rock slope stability of the vmt - citizens promoting the ... · seismic re-engineering of the...
TRANSCRIPT
Seismic Re-Engineering of the Valdez Marine Terminal (VMT) Contract No. 556.07.0007
Rock Slope Stability of the VMT
Prepared for
The Prince William Sound Regional Citizen’s Advisory Council (RCAC)
Prepared by
Terry R. West, Ph.D., P.E., C.P.G.
and
Kyu Ho Cho, Ph.D., P.E.
September 2007

Rock Slope Stability of the VMT
TABLE OF CONTENTS
Page
EXECUTIVE SUMMARY (to include abstract by Dr. James Beget) ............................. i 1. INTRODUCTION ................................................................................................ 1
2. BACKGROUND .................................................................................................. 1
3. SCOPE OF WORK ............................................................................................... 4
4. SITE GEOLOGY .................................................................................................. 8
5. SEISMIC SETTING ............................................................................................. 9
6. FIELD INVESTIGATIONS ............................................................................... 10
6-1. First Visit - July 2006 .................................................................................. 10
6-2. Second Visit - August 2006 ......................................................................... 12
7. DATA ANALYSIS ............................................................................................. 13
7-1. Rock Slope Stability Analysis ...................................................................... 13
7-1-1. Types of Rock Slope Failure ............................................................ 14
7-1-2. Kinematic Analysis............................................................................ 14
7-1-3. Kinetic Analysis................................................................................. 21
7-1-4. Probability of Failure......................................................................... 26
7-2. Rock Slopes in VMT ................................................................................... 28
7-2-1. Limitation of Analysis ....................................................................... 28
7-2-2. BWT Slope ....................................................................................... 31
7-2-3. PVR Slope ......................................................................................... 47
7-2-4. West Manifold Slope ......................................................................... 64
7-2-5. West Tank Farm Slope ...................................................................... 72
7-2-6. East Tank Farm Slope........................................................................ 83
7-2-7. Other Slopes....................................................................................... 91
7-3. Analysis of Aerial Photographs above VMT .............................................. 91
8. CONCLUSIONS........................................................................................................ 102
9. RECOMMENDATIONS .......................................................................................... 105
REFERENCES CITED.................................................................................................. 106
Rock Slope Stability of the VMT i
EXECUTIVE SUMMARY
The primary purpose of this project was to evaluate the stability of rock slopes of the VMT during potential earthquake conditions. Field reconnaissance and a detailed fracture survey of the rock slopes were conducted by Dr. Terry R. West and his associates in July and August 2006.
During the fracture survey more than 300 discontinuity values were measured in the field.
The discontinuity data were measured on those relatively critical slopes including the Ballast Water Treatment Plant (“BWT Slope”), the Power House and Vapor Recovery Plant (“PVR Slope”), the West Manifold Building (“WM Slope”), the West Tank Farm Slope (“WTF Slope”), and the East Tank Farm Slope (“ETF Slope”). Discontinuity data were also obtained from the less critical slopes including the Power House Road Slope, the Tea Shelter Slope, and the rock quarries located on the southern portion of the VMT site.
Using these fracture data and existing rock cut information available at the time of this investigation, an analysis of rock slope stability was conducted using kinematic and factor of safety (deterministic) methods. Because of the uncertainty of the information, the probability of failure method was also employed to evaluate the stability of the VMT slopes in this study. Assumptions concerning rock mass strengths were made based on the literature and experience of the authors. Based on the kinematic and kinetic analyses, it is anticipated that the external loading conditions equal to 0.7Hw/Hslope or equal to pore pressure of 0.6Hw/Hslope with 0.1g of horizontal acceleration will cause the BWT Slope to become unstable. For the PVR Slope, the external loading conditions equal to 0.85Hw/Hslope or equal to pore pressure of 0.8Hw/Hslope with 0.1g of horizontal acceleration or 0.55Hw/Hslope with 0.2g of horizontal acceleration may cause the PVR Slope to become unstable. For the West Manifold Slope, the external loading conditions equal to 0.35Hw/Hslope, and the external loading conditions equal to pore pressure of 0.15Hw/Hslope with 0.1g of horizontal acceleration may cause the West Manifold Slope to become unstable. For the East Tank Farm Slope, the external loading conditions equal to 0.7Hw/Hslope or the external loading conditions equal to pore pressure of 0.45Hw/Hslope with 0.1g of horizontal acceleration may cause the East Tank Farm Slope to become unstable. For the West Tank Farm Slope, the external loading conditions equal to 0.65Hw/Hslope or the external loading conditions equal to pore pressure of 0.5Hw/Hslope with 0.1g of horizontal acceleration may cause the East Tank Farm Slope to become unstable. Details concerning drainage holes at VMT were not provided for this study. These data are required along with rock bolt distributions in order to perform a more precise evaluation of slope stability for the site.
To reduce the risk of the existing slopes at this time, the ditches above the rock slopes should have steep enough grades to avoid water-ponding to prevent infiltration of ponded water which can increase pore pressures. Also, it is recommended that any cracks at the top of the slope be sealed with grout or asphalt. It is also recommended that the piezometers which are clogged in the VMT slopes be regularly cleaned and measured frequently to monitor pore pressures. It is also recommended that more rock bolts be installed in the areas where the existing rock bolts are loosened and where rock bolts have not been installed following a further study to establish these details. Finally, a contingency plan should be developed to address an increase in pore pressure due to increased precipitation, as higher pore pressures could lead to slope instability.
Rock Slope Stability of the VMT 1
1. INTRODUCTION
The Valdez Marine Terminal was constructed between 1974 and 1977 at the
southern end of the 800 mile long Trans-Alaska Pipeline. An extensive amount of rock
excavation was necessary to build the platform on which the facility was constructed.
Nearly thirty years have passed since that time and it is a well-established fact that rock
slopes weather, relax and deteriorate with time due to exposure to climatic conditions.
Because of the vast amount of crude oil stored in tanks on the site, failure of the rock
slopes could cause a major oil spill and possibly a major fire on the VMT site. With this
concern in mind the Prince William Sound, Regional Citizen’s Advisory Council (RCAC)
authorized a study of the stability of the rock slopes under various conditions, including
seismic loading. Valdez lies within the major subduction zone along the southern coast of
Alaska and is located only 38 miles from the epicenter of the Great Alaska earthquake of
1964. Dr. Terry R. West, geological and engineering consultant, was employed to
evaluate the slope stability aspects of the VMT, including the effects of seismic shaking.
This report is based on field studies conducted in July and August, 2006 and subsequent
analysis of the discontinuity data.
2. BACKGROUND
Construction of the Valdez Terminal for Alyeska Pipeline Service Company
(Alyeska) was accomplished between 1974 and 1977. The site, consisting of about 1000
acres, involved major construction, including among other engineering works, several
extensive, high rock-cut excavations. An estimated 7 million cubic yards of material were
removed at the site (Cohen, The Great Alaska Pipeline, p. 108). Difficulties were

Rock Slope Stability of the VMT 2
encountered when constructing the rock cuts and the foundations for the large oil and
ballast water treatment tanks. These were related to problematic, geological and
groundwater conditions involving weak rocks, unfavorable orientation of rock
discontinuities and high groundwater levels. Weak, foliated rocks, including phyllites,
were subject to slope failure. Groundwater levels remained above excavated surfaces
(high piezometric levels) for extended periods of time (Bukovansky, 1990).
During an early phase of construction, a rock block slide caused a slope failure on
a portion of the PVR slope (Powerhouse and Vapor Recovery). This occurred along the
existing foliation which dips at an angle of about 60° from the slope. The original cut
slope before failure, based on available photos, appears to have been a near vertical face
(Tart, 2002, p. 10). Actually it had a 1/4 to 1 inclination yielding a 76° dip into the cut
(Tart, personal communication, 2006). The failed slope is shown on p. 9 of the report
(Tart, 2002). Consisting of phyllite, it is no surprise that the slope failed even without any
contribution from pore water pressure. The φ angle for the phyllite was likely 30° or less,
so the dip of the foliation greatly exceeded this φ angle and failure was eminent. (FS =
tanφ /tanθ, where θ = dip angle = 60°, φ = 30°, so FS = 0.33) Because of this failure
occurrence, rock slopes were cut back to the angle of the foliation or about 60° and slope
drainage, rock bolts and rock buttresses were added to increase the factor of safety. This
new slope angle prevented the foliation from daylighting or intercepting the cut slope.
Other information suggests that the slope angle in the failed area was reduced to 45°, also
preventing the foliation planes from daylighting on the slope (Bukovansky, 1990).
According to this consulting report (Bukovansky, 1990) stringent earthquake
design criteria required the application of mitigating measures to alleviate the high

Rock Slope Stability of the VMT 3
groundwater levels (high pore pressures). Extensive dewatering measures were
implemented (horizontal drains installed) to eliminate or reduce uplift forces on the
slopes and below the terminal tanks. Extensive piezometric level monitoring systems
were installed during construction in the important cuts and below most terminal tanks to
enable long term water level monitoring.
Regarding the earthquake design criteria for the area of Valdez, an Ms of 8.5,
surface wave magnitude, was supposedly implemented for the area, which translates into
a 0.60g ground acceleration or a ground velocity of 29 inches/second (Design Manual for
Pipeline, TAPs 1973, Revised 1974, Table 4.2-1). This value of 0.60g is considered later
on in this report, during the evaluation process.
Numerous piezometers were installed in the major rock cuts on the site as shown
in Figure 5, page 6 of the 2002 Status Report (Tart, 2002). The PVR slope is the primary
area of study in that evaluation. Piezometer No.40 is shown as an example. The Flag
level depicts the piezometric surface in the rock slope following placement of a
horizontal drain system and subsequent drainage after construction. Page 24 indicates for
Piezometer No.40 that the groundwater elevation has been essentially the same, an
elevation of 450 feet, for the period 1993 to 2002. The following line of reasoning seems
to have prevailed. If the slope was stable in 1976 with the rock bolts in place, the slope
should continue to be stable as long as the pore pressure or piezometric level does not
increase. It is not clear what amount of seismic loading was assumed in this calculation.
Certainly, no seismic effect was involved during the initial failure of the PVR slope
during construction.
Rock Slope Stability of the VMT 4
In the past there has been some concern expressed about rising piezometric levels.
The 1990 report by Bukovansky shows on Figure 1 that the annual precipitation at
Valdez increased from 55 to 82 inches per year from 1973 to 1989. It is outside the scope
of the current study to examine the precipitation record from 1989 to the present, but it is
clearly a concern as to how the piezometric levels can be kept at the Flag level and below,
if total precipitation continues to increase. Bukovansky expressed concern in his report
(1990) about the capability of lowering the groundwater level any further if it begins to
rise with increased precipitation. Dr. Singh has also indicated a concern for increased
levels of the piezometers (Singh and Associates, 1998).
A concern for rock slope stability was recognized by the current authors when a
combination of increased pore pressure and earthquake effects occur which decreases the
sliding resistance of the rock mass. This aspect forms the essence of the analysis that is
presented in Section 7.
3. SCOPE OF WORK
This study, Seismic Evaluation of Valdez Marine Terminal, was authorized by
RCAC (Prince William Sound, Regional Citizen’s Advisory Council) to determine the
level of safety of the terminal facility under earthquake loading conditions. The Great
Alaska Earthquake of 1964 predates construction of the VMT by about ten years. This
earthquake, centered between Anchorage and Valdez, registered an Ms (surface wave
magnitude) = 8.5, Mw (moment magnitude) = 9.2 magnitude on the Richter scale and
caused major damage to the town of Valdez. Although the repeat interval for this major
Rock Slope Stability of the VMT 5
earthquake is considered by some to be 2500 years, the seismic design for the terminal is
based on a repeat event of this magnitude.
The following items were designated in the proposal of work for RCAC by Dr.
T.R. West. The overall objective of this work is to evaluate the stability of the rock
slopes at and above the Valdez Marine Terminal (VMT) and to determine the probability
of failure under various conditions including earthquake shaking. To accomplish this, the
following activities were proposed:
a) Obtain detailed geologic data on the rock mass in question including, but not
necessarily limited to, rock type, structure, nature and spacing of fractures, shear
strength of fractures and of intact rock strength. Council staff will assist Consultant
in obtaining these data from Alyeska Pipeline Service Company and the Joint
Pipeline Office.
b) Review slope stability design and determine current slope stability conditions
excluding earthquake loading. Consider both dry and pore pressure conditions.
c) Determine slope stability based on a deterministic analysis, include earthquake
shaking effects.
d) Determine variability of slope stability factors and perform a probabilistic evaluation
of slope stability. Include both kinematic and kinetic aspects of discontinuities.
Calculate combined probability of failure and block size occurrences; both sliding
and wedge failure considered.
e) Perform the Colorado Rockfall Simulation Program (CRSP). Evaluate slope failure
including runout zone details, ditch width and depth for existing rock slope.
Rock Slope Stability of the VMT 6
f) Evaluate earthquake potential; consider both horizontal and vertical acceleration.
g) Evaluate stability relative to increased pore pressure conditions.
h) Combined effects of earthquake shaking, plus kinematic and kinetic aspects of slope
stability. Calculate probability of failure under combination of conditions.
i) Review the adequacy of current support system for VMT rock slopes relative to
probability of failure criteria.
j) Determine if additional support is needed for the slope, or if a modification of the
slope configuration is required.
k) Examine maintenance practices and slope deterioration from weathering effects or
from relaxation of stresses.
l) Review construction techniques used to obtain the cut slope geometry, blasting
details, pre-splitting, scaling and rock bolting.
m) Review design and stability of Mechanically Stabilized Earth (MSE) walls on the
site.
n) After detailed analysis, examine existing slopes in regard to results obtained from
the evaluation. Check condition of rock bolts, also the bolt spacing and other slope
protection considerations. It is anticipated that two trips to the site between June and
August, 2006 will be required by the consultant. Three person weeks total are
estimated for field activities.
o) Provide periodic reports to the Council as requested during the evaluation process.
Prepare final report for this phase of the work when study is complete.
p) Consider other issues as Council directs, such as tsunami and undersea landslides
related to earthquake shaking.
Rock Slope Stability of the VMT 7
q) Coordinate activities and findings with Dr. James R. Beget who is engaged in a
complementary geomorphology study of Port Valdez and help assure a seamless
interface between the two efforts.
r) Prepare final report. The final report will be submitted in draft form to the Council
by December 31, 2006. The final report revised as necessary will be submitted to the
Council by February 16, 2007.
Two visits to the site were accomplished in the summer 2006. The first visit, in
July, was made by Terry R. West, Ph.D., P.E., geological and engineering consultant, the
principal investigator on this project. The purpose of the visit was to meet with site
personnel for Alyeska and to perform a reconnaissance evaluation of the site. Dr. Thomas
Kuckertz, project manager for RCAC, was also present. During part of the visit Dr. James
Beget, geological consultant, accompanied Dr. West. Mr. Rupert (Bucky) Tart, of Golder
Associates Consultants was also present during a portion of the site visit. An adjacent
area to the east of the site was also examined, the dam site for the Solomon Gulch
Hydroelectric plant. During the following week Dr. West met with Alyeska personnel
and the Joint Pipeline Office in Anchorage.
The second visit to VMT occurred in August, 2006. During the visit a three-man
team conducted five days of field work, led by Dr. West, aided by Dr. Kyu Ho Cho and
another field assistant. A detailed fracture study of the rock slopes in question was
conducted in which more than 300 discontinuity values were measured in the field.
Additional data were obtained from Alyeska which were used in this evaluation of
the rock slope stability at the VMT site. This report has been prepared to determine the
Rock Slope Stability of the VMT 8
safety of the rock slopes under different conditions including seismic shaking. It is not
intended to be the basis of a design document, but instead its intent is to point out any
concerns for the long term stability of rock slopes on the VMT facility.
4. SITE GEOLOGY
The Valdez Marine Terminal is a 1,000 acre site on the 11 mile long fiord near
the northeast corner of Prince William Sound. It is located on the south shore of the Port
Valdez Fiord about 5 miles south of the town of Valdez, Alaska along the Valdez Arm of
the Prince William Sound. The bedrock formations comprise a part of the Valdez Group
of the Chugach Terrane. Metamorphosed, marine sedimentary rocks consisting of several
thousand feet of interbedded slates, graywackes, phyllites, argillites and greenstones
(metabasalt) are present. These were formed in late Cretaceous time near the edge of the
continental shelf. Rocks that crop out at VMT have undergone greenschist facies
metamorphism (Connor and O’Hare, 1988; Verigin and Harder, 1989; Bukovansky,
1990).
Folding in the rocks is intense and accompanied by recrystallization resulting in
development of cleavage and schistosity. The significant rock hardness is due to thorough
impregnation by siliceous solutions. Numerous openings have been filled and sealed with
quartz so that quartz stringers are prevalent. The rocks have a well developed foliation
which strikes east-west and dips steeply to the north. Rocks are strongly jointed with the
most prominent ones being a vertical set oriented perpendicular to the foliation. These
major joints are prominently exposed along the south side of the Valdez Arm where
water courses commonly follow them. These two structural features, foliation (or bedding)
Rock Slope Stability of the VMT 9
and the perpendicular joints effectively control the topographic grain of the region. The
perpendicular joints also form release planes that can isolate rock blocks that
subsequently undergo failure.
5. SEISMIC SETTING
Southern Alaska is one of the most seismically active regions in the world. This is
due to the northward, underthrusting of the Pacific crustal plate below the North
American crustal plate, all along the Aleutian trench, the southern limit of the Aleutian
Megathrust Zone.
Great earthquakes have occurred historically throughout this region and can be
expected to continue in the future. Davies (1985) indicated that three of the ten largest
earthquakes in the world have occurred in Alaska and that Alaska may experience as
many as six times the number of moderate and greater earthquakes than does California.
Davies et al. (1979) has suggested that the Megathrust Zone in this area produces
earthquakes of the size of the 1964 Alaska earthquake (Ms = 8.5, Mw = 9.2)
approximately every 160 years. This is in contrast to the 2500 year return cycle suggested
by others. The straight line distance from the epicenter of the March 27, 1964 earthquake
to the VMT is approximately 38 miles. Several points of interest were noted in the report
by Bukovansky (1990). The Power and Vapor Recovery (PVR) cut is located within poor
quality phyllites and the west portion of this cut is where the 1975 failure occurred. He
claimed that the slope was cut back to 45° after failure. The BWT by contrast is located
in hard competent greenstone, the best quality rock of any of the bedrock on the site. The
West Manifold Cut, is located partly in phyllite and partly in greenstone.
Rock Slope Stability of the VMT 10
6. FIELD INVESTIGATION
6-1 First Visit - July 2006
Dr. West and leadership personnel for the VMT site met in the VMT office, along
with Bucky Tart from Golder Associates and Jim Roddick from the Alyeska office in
Anchorage. Also in attendance was Dr. Thomas Kuckertz, project manager for RCAC.
During an early discussion the Alyeska team suggested that pore pressures in rock
fractures would be dissipated by minor movements of the rock mass and not cause further
stability problems. Dr. West disagreed with this concept which is contrary to basic
analysis procedures for rock slopes. Pore pressures act in two ways to reduce slope
stability, they increase the driving force and decrease the resistance force.
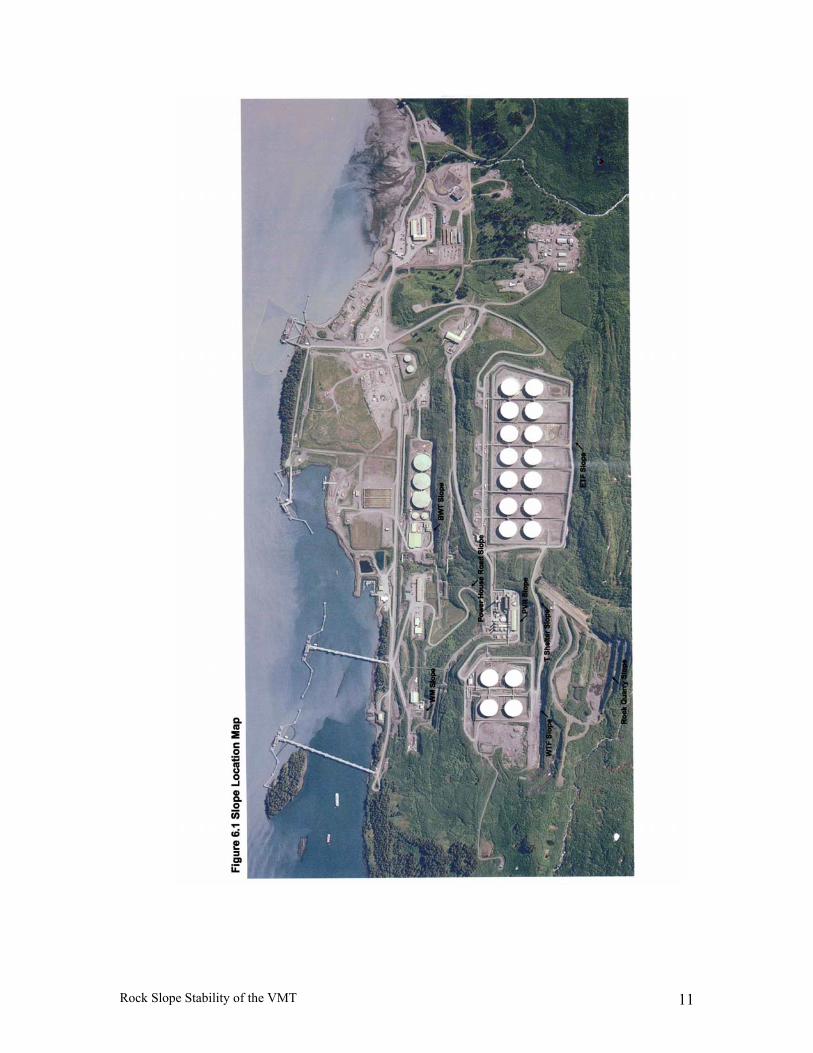
The group visited slopes on the site, and the reinforced earthwall. They observed
the Power and Vapor Recovery Cut, Ballast Water Treatment Cut, West Manifold Cut,
West Tank Farm Cuts, East Tank Farm Cuts, Tea Shelter Slope and the rock quarry. The
locations of these slopes are shown in Figure 6.1. During this visit Dr. West noted the
nature of the rock mass and the stabilization techniques employed. This included rock
bolts, rock fill berms, mechanically stabilized earth (MSE) walls, drain holes and
piezometer instrumentation. Dr. West later concluded, based on field observation, that the
MSE walls were in a stable condition. No detailed measurements of the rock
discontinuities were accomplished. Later in the week Dr. West examined the soil slopes
on the east side of the terminal property and the hydroelectric dam further to the east, the
Solomon Gulch rock fill dam. The foliated, metasedimentary rock at the dam site was
more massive than that found on most of the VMT site.
Rock Slope Stability of the VMT 11
Rock Slope Stability of the VMT 12
Two types of rock prevailed at the dam site: 1) a very hard, fine-grained, dark
gray, argillite lacking well-developed cleavage, with some interbedded slate or slaty
argillite and 2) a fine-grained blue-black slate interbedded with argillite.
The slate has well developed cleavage, but there is little or no cleavage in the
argillite (Verign and Harder, 1989). Massive rock is exposed in the outlet channel for the
dam. It consists of steeply dipping, foliated argillite striking parallel to the slope and
dipping outward at about 60°. The trend is much like that observed at several locations on
the VMT property.
6-2. Second Visit - August 2006
A three man team spent five days at the VMT site obtaining rock discontinuity
data on the rock cuts. Detailed line mapping of fractures was accomplished by the team
led by Dr. T. R. West with Dr. Kyu Ho Cho and another field assistant working as well.
More than 300 strike and dip measurements were made on the primary rock slopes on the
site. This detailed field work became necessary after it was determined that no
discontinuity data from previous studies on the VMT site would be made available for
analysis. It had been assumed by Dr. West when the study was proposed to RCAC, that
abundant rock slope data were available and would be provided by Alyeska. The report
by Bokovansky (1990) indicates that significant slope design work was accomplished for
the VMT site prior to completion of the rock cuts in 1977. It was also suggested that
seismic effects were included in this analysis as well. This rock slope discontinuity data
and slope design analysis were not made available for Dr. West’s study.
At the close of the five day field investigation Dr. West and his team met with the
leaders of the senior staff of VMT. In an exit discussion he noted that based on a
Rock Slope Stability of the VMT 13
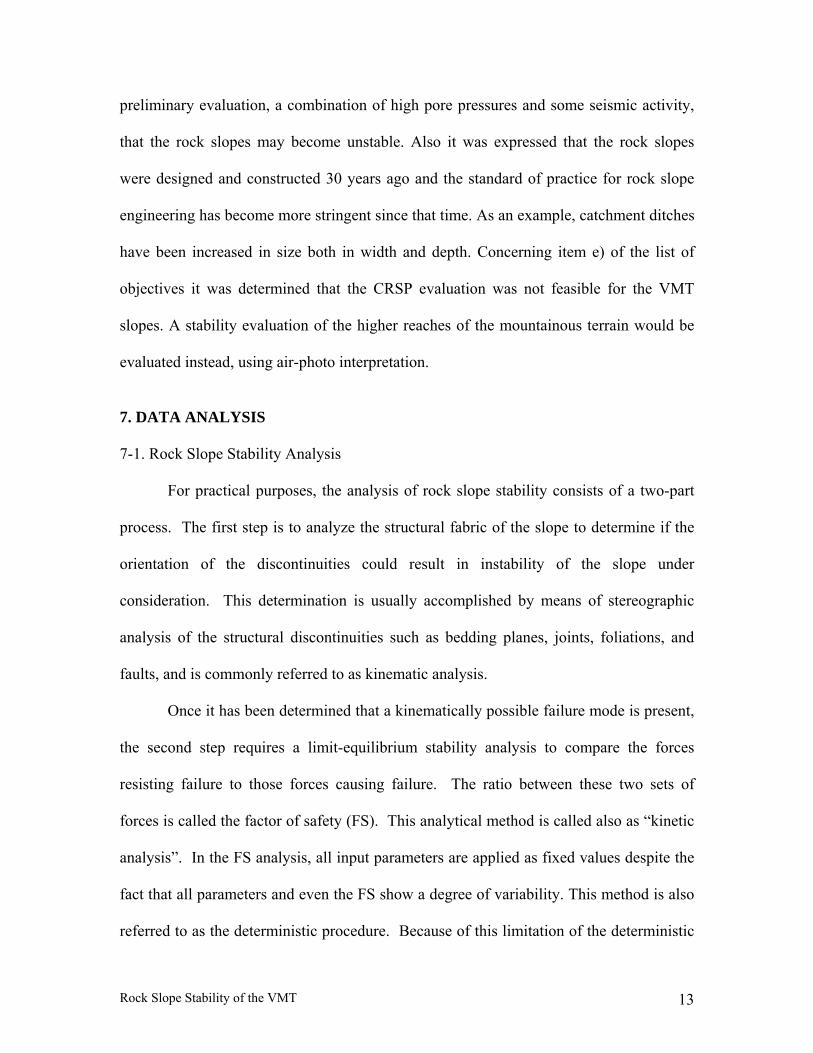
preliminary evaluation, a combination of high pore pressures and some seismic activity,
that the rock slopes may become unstable. Also it was expressed that the rock slopes
were designed and constructed 30 years ago and the standard of practice for rock slope
engineering has become more stringent since that time. As an example, catchment ditches
have been increased in size both in width and depth. Concerning item e) of the list of
objectives it was determined that the CRSP evaluation was not feasible for the VMT
slopes. A stability evaluation of the higher reaches of the mountainous terrain would be
evaluated instead, using air-photo interpretation.
7. DATA ANALYSIS
7-1. Rock Slope Stability Analysis
For practical purposes, the analysis of rock slope stability consists of a two-part
process. The first step is to analyze the structural fabric of the slope to determine if the
orientation of the discontinuities could result in instability of the slope under
consideration. This determination is usually accomplished by means of stereographic
analysis of the structural discontinuities such as bedding planes, joints, foliations, and
faults, and is commonly referred to as kinematic analysis.
Once it has been determined that a kinematically possible failure mode is present,
the second step requires a limit-equilibrium stability analysis to compare the forces
resisting failure to those forces causing failure. The ratio between these two sets of
forces is called the factor of safety (FS). This analytical method is called also as “kinetic
analysis”. In the FS analysis, all input parameters are applied as fixed values despite the
fact that all parameters and even the FS show a degree of variability. This method is also
referred to as the deterministic procedure. Because of this limitation of the deterministic

Rock Slope Stability of the VMT 14
method, probability methods using a reliability index and a probability of failure have
been considered for rock slope stability analysis as an alternative method. For
comparison, both the FS and probability of failure methods were used to evaluate the
stability of the VMT slopes in this study.
7-1-1. Types of Rock Slope Failure
Most slope failures can be classified into one of four categories depending on the
geometrical and mechanical nature of the discontinuity and the conditions of the rock
masses as shown in Figure 7.1. Planar failures occur when a discontinuity strikes parallel
or nearly parallel to the slope face and dips into the excavation at an angle greater than
the friction angle. Slope failure during construction of the PVR slope was caused by
planar failure. Wedge failures involve a rock mass defined by two discontinuities with a
line of intersection that is inclined out from the slope face where the inclination of the
intersection line is significantly greater than the angle of friction. Circular failures occur
when rock masses are highly fractured or composed of very weak material. Toppling
failures involve rock slabs or columns defined by discontinuities that dip steeply into the
slope face.
7-1-2. Kinematic Analysis
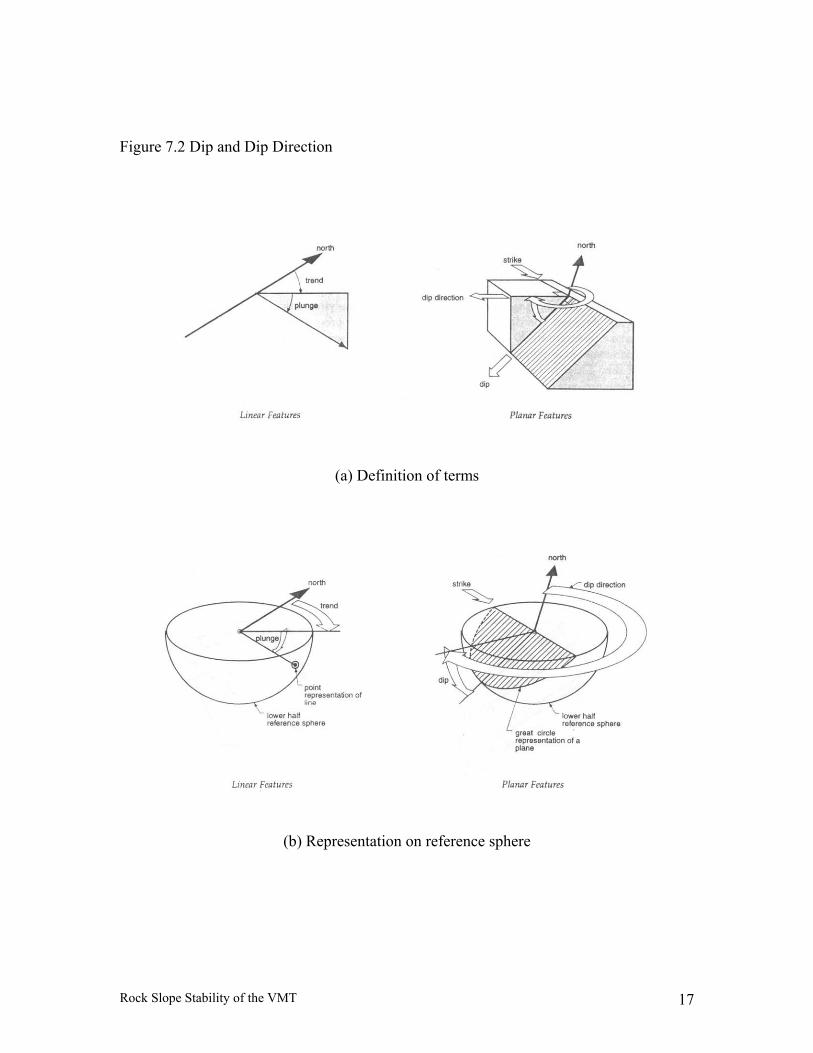
The kinematic analysis is performed using the stereographic projection method
which is a strong tool to use for systematic data collection and presentation. Data
required to perform the stereographic projection method are dip and dip direction of each
discontinuity. The dip is defined as the maximum inclination of a structural discontinuity
plane measured from the horizontal. The dip direction is the direction of the horizontal
trace of the line of dip measured clockwise from north. The definition of the dip and dip

Rock Slope Stability of the VMT 15
direction are illustrated in Figure 7.2. The discontinuity can be also represented using
strike and dip. Strike is the compass bearing of the line formed by the intersection of a
discontinuity plane and a horizontal plane. The discontinuity data measured at VMT are
presented using strike, dip, and dip direction in tabular form in this report.
The discontinuity data were recorded as dip and dip direction using a Bronton
Compass, for example 30/150, where 30 is the dip and 150 is the dip direction. In the
kinematic analysis, the dip and dip direction were plotted by a software package Dips 2.2
(Rocscience) using the stereographic equal-angle projection method.
The kinematic conditions for each of the rock slope failure modes are as follows:
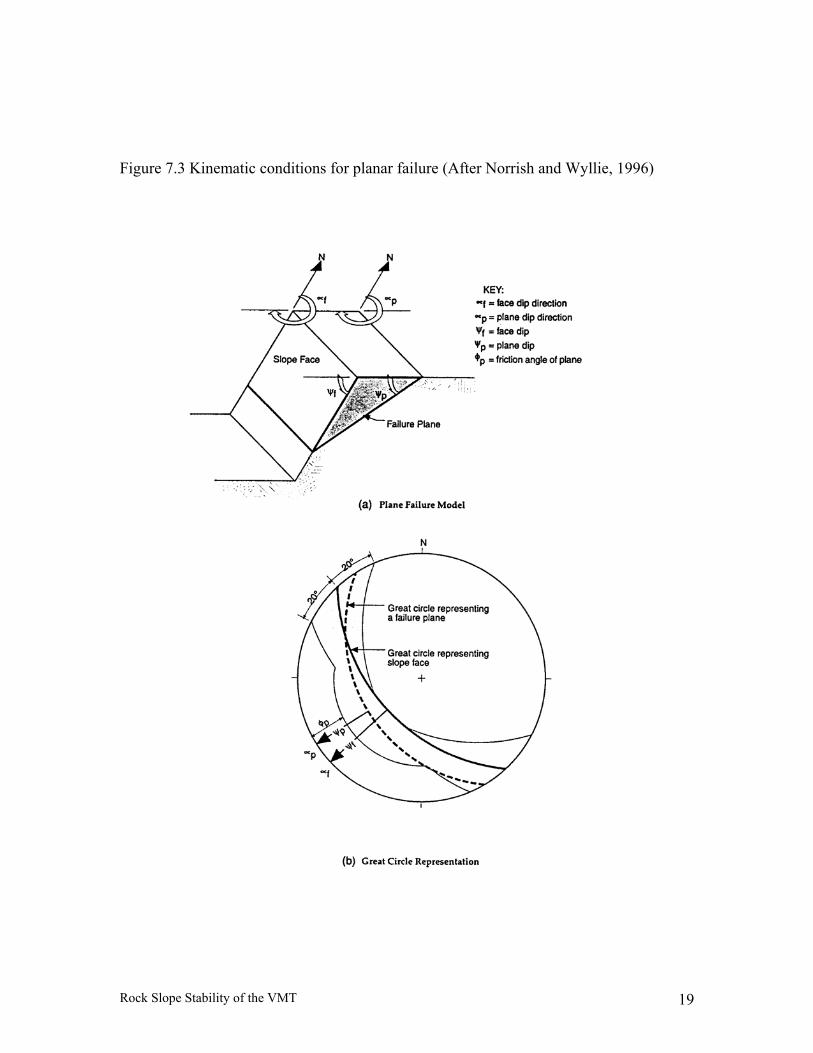
A. Planar Failure
Planar failure is a relatively rare occurrence in rock slopes because only
occasionally do all the geometrical conditions required to produce planar failure actually
occur. Wedge-type failures are more common and in fact rock engineers commonly
consider that planar failure is a special case of the wedge failure analysis where the
wedge angle between the two planes goes to 180°. The four structural conditions required
for planar failure are shown in Figure 7.3 and explained below:
The dip direction of the planar discontinuity must be within 20 degrees of the dip
direction of the slope face.
The dip of the planar discontinuity must be less than the dip of the slope face
(daylights in the slope)
The dip of the planar discontinuity must be greater than the angle of friction of
the failure plane.

Rock Slope Stability of the VMT 16
The lateral extent of the potential failure mass must be isolated by lateral release
surfaces which free a block for sliding. This is the requirement that reduces the
likelihood of planar failure occurrence.
Figure 7.1 Four types of rock slope failures (After Hoek and Bray, 1981)
(a) Circular Failure (b) Planar Failure (c) Wedge Failure (d) Toppling
Rock Slope Stability of the VMT 17
Figure 7.2 Dip and Dip Direction
(a) Definition of terms
(b) Representation on reference sphere
Rock Slope Stability of the VMT 18
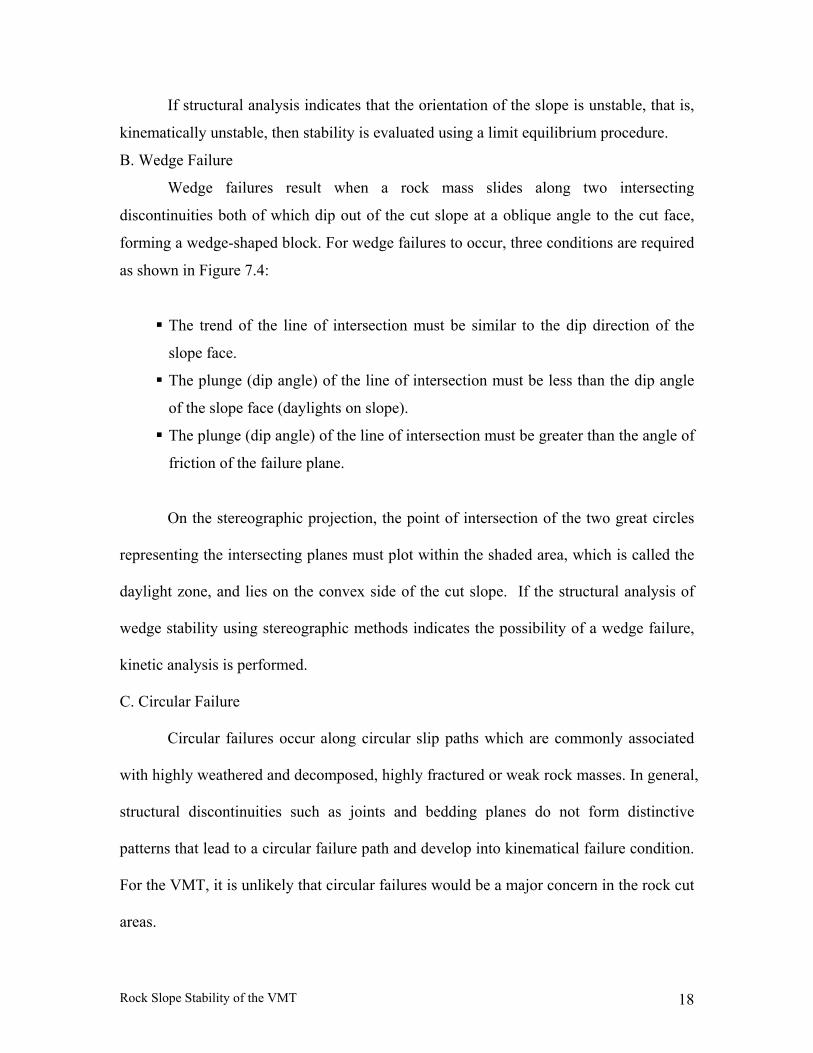
If structural analysis indicates that the orientation of the slope is unstable, that is,
kinematically unstable, then stability is evaluated using a limit equilibrium procedure.
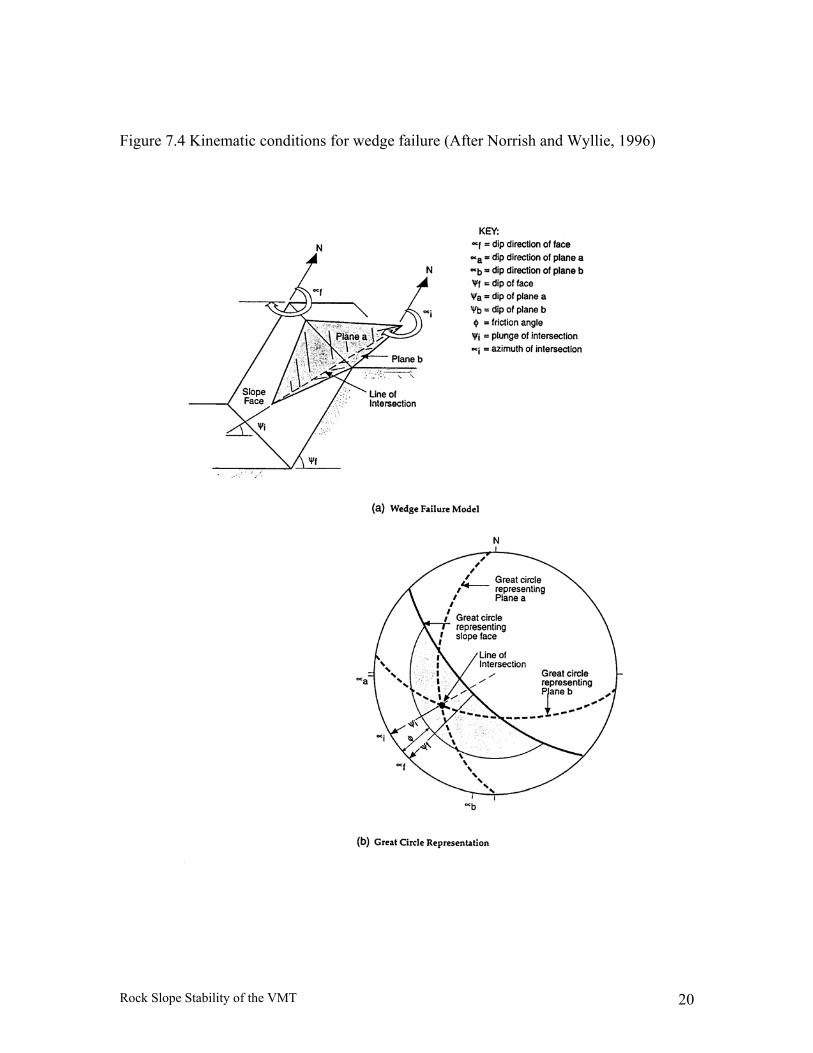
B. Wedge Failure
Wedge failures result when a rock mass slides along two intersecting
discontinuities both of which dip out of the cut slope at a oblique angle to the cut face,
forming a wedge-shaped block. For wedge failures to occur, three conditions are required
as shown in Figure 7.4:
The trend of the line of intersection must be similar to the dip direction of the
slope face.
The plunge (dip angle) of the line of intersection must be less than the dip angle
of the slope face (daylights on slope).
The plunge (dip angle) of the line of intersection must be greater than the angle of
friction of the failure plane.
On the stereographic projection, the point of intersection of the two great circles
representing the intersecting planes must plot within the shaded area, which is called the
daylight zone, and lies on the convex side of the cut slope. If the structural analysis of
wedge stability using stereographic methods indicates the possibility of a wedge failure,
kinetic analysis is performed.
C. Circular Failure
Circular failures occur along circular slip paths which are commonly associated
with highly weathered and decomposed, highly fractured or weak rock masses. In general,
structural discontinuities such as joints and bedding planes do not form distinctive
patterns that lead to a circular failure path and develop into kinematical failure condition.
For the VMT, it is unlikely that circular failures would be a major concern in the rock cut
areas.
Rock Slope Stability of the VMT 19
Figure 7.3 Kinematic conditions for planar failure (After Norrish and Wyllie, 1996)
Rock Slope Stability of the VMT 20
Figure 7.4 Kinematic conditions for wedge failure (After Norrish and Wyllie, 1996)
Rock Slope Stability of the VMT 21
D. Toppling
The necessary conditions for toppling failure can be summarized as follows:
The strike of the layers must be approximately parallel to the slope face.
Differences in these orientations of 20 degrees or less are required based on
references in the literature.
The dip of the layers must be into the slope face.
The discontinuity condition must satisfy the following equation.
[ ])()()(90 planealonganglefrictionfaceslopeofdipplaneofdip pfp φϕϕ −≤−o
Analogous to planar failure, some limitation to the lateral extent of the toppling
failure is a fourth condition for a kinematically possible failure.
Based on our field investigations, the planar and wedge failures are the prevalent
failure modes in the VMT slopes rather than are circular or toppling. Therefore, potential
planar and wedge failures are considered in the following kinetic analysis.
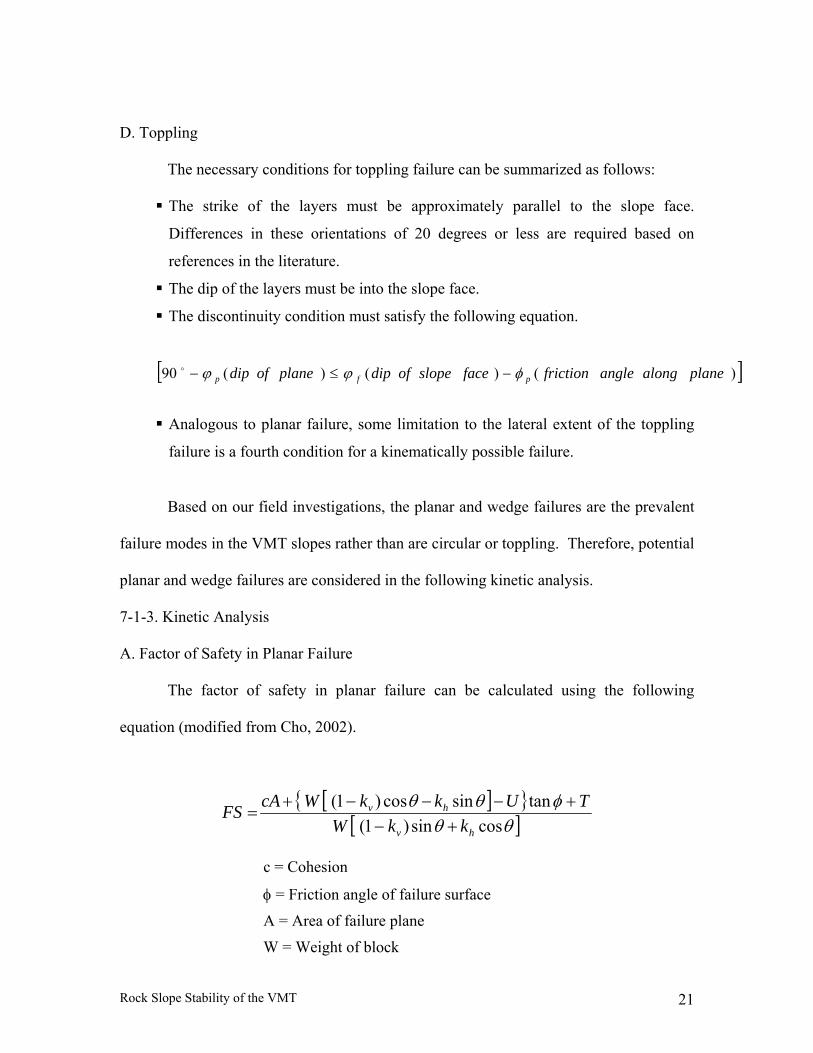
7-1-3. Kinetic Analysis
A. Factor of Safety in Planar Failure
The factor of safety in planar failure can be calculated using the following
equation (modified from Cho, 2002).
[ ]{ }[ ]θθ
φθθcossin)1(
tansincos)1(
hv
hv
kkWTUkkWcAFS
+−+−−−+
=
c = Cohesion
φ = Friction angle of failure surface
A = Area of failure plane
W = Weight of block
Rock Slope Stability of the VMT 22
T = Tension in bolts or cables
U = Water pressure
kh = Horizontal pseudostatic coefficient
kv = Vertical pseudostatic coefficient
θ = Inclination (dip) of failure plane
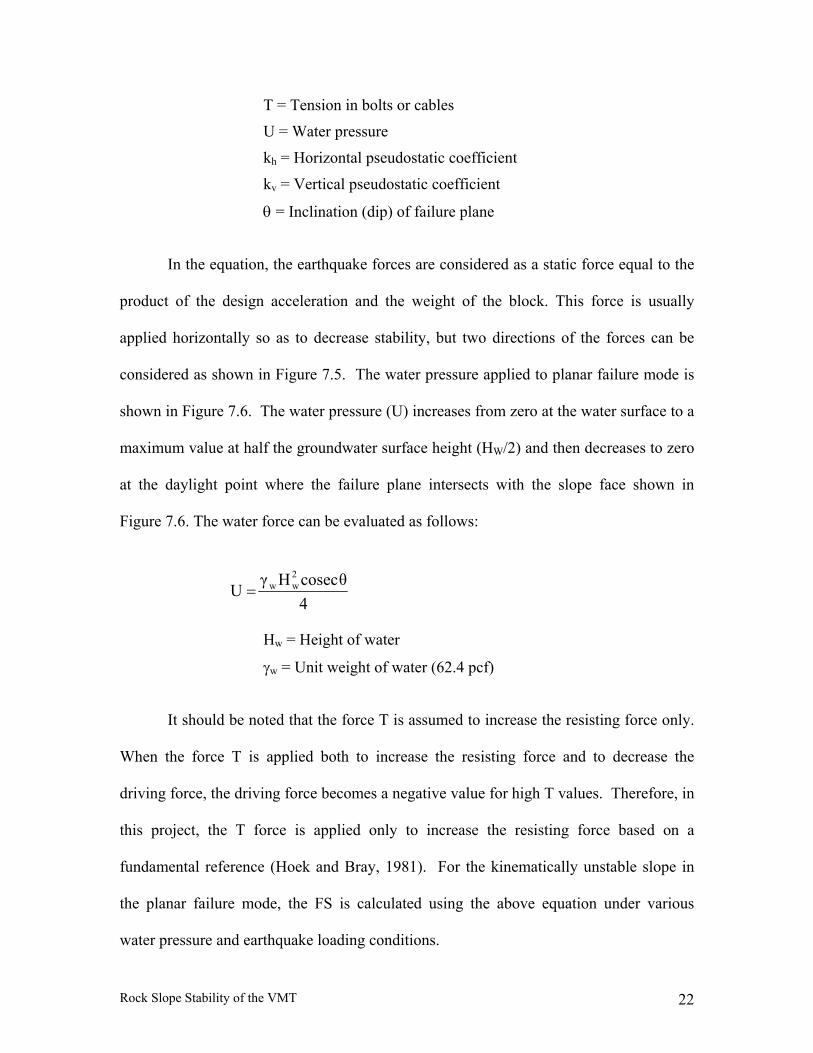
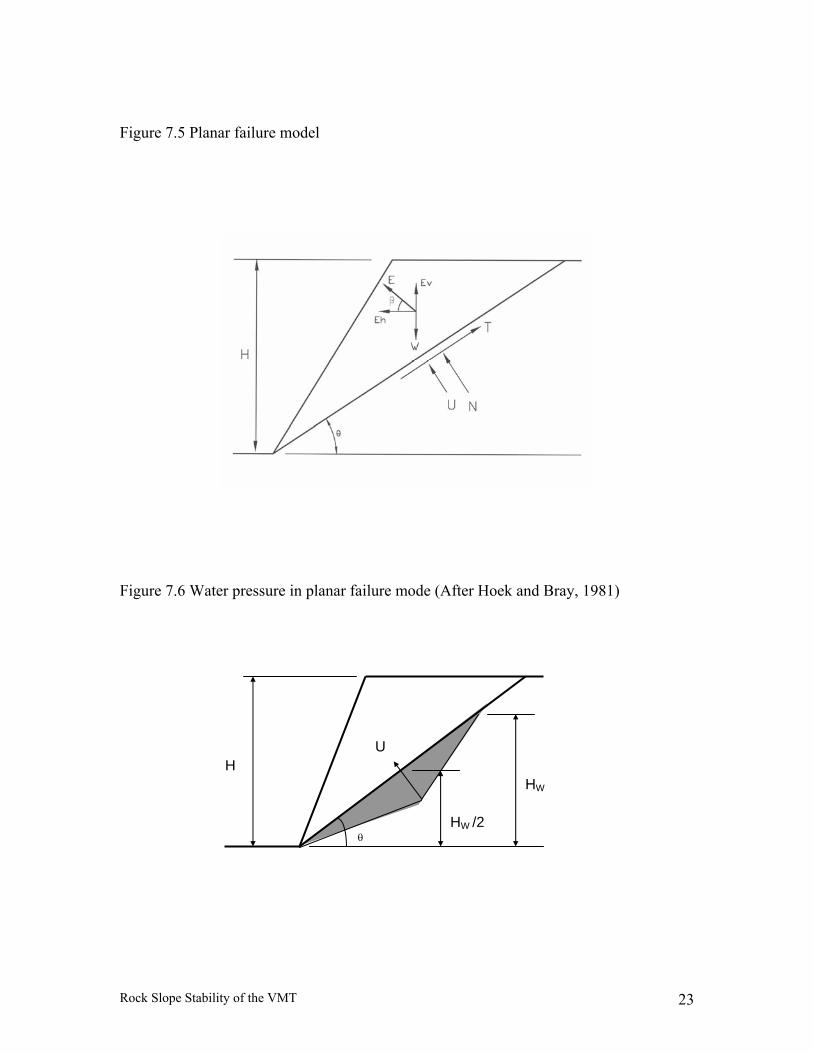
In the equation, the earthquake forces are considered as a static force equal to the
product of the design acceleration and the weight of the block. This force is usually
applied horizontally so as to decrease stability, but two directions of the forces can be
considered as shown in Figure 7.5. The water pressure applied to planar failure mode is
shown in Figure 7.6. The water pressure (U) increases from zero at the water surface to a
maximum value at half the groundwater surface height (HW/2) and then decreases to zero
at the daylight point where the failure plane intersects with the slope face shown in
Figure 7.6. The water force can be evaluated as follows:
4θcosecHγ
U2ww=
Hw = Height of water
γw = Unit weight of water (62.4 pcf)
It should be noted that the force T is assumed to increase the resisting force only.
When the force T is applied both to increase the resisting force and to decrease the
driving force, the driving force becomes a negative value for high T values. Therefore, in
this project, the T force is applied only to increase the resisting force based on a
fundamental reference (Hoek and Bray, 1981). For the kinematically unstable slope in
the planar failure mode, the FS is calculated using the above equation under various
water pressure and earthquake loading conditions.
Rock Slope Stability of the VMT 23
Figure 7.5 Planar failure model
Figure 7.6 Water pressure in planar failure mode (After Hoek and Bray, 1981)
θ HW /2
U H
HW

Rock Slope Stability of the VMT 24
B. Factor of Safety in Wedge Failure
The factor of safety in wedge failure can be calculated using the following
equation (modified from Cho, 2002).
( ) [ ]
( ) [ ]
]cossin)1[(
tan]sincos)1[(sin
cos
tan]sincos)1[(sin
cos
2221
1
1121
22211
θθ
φθθωω
ω
φθθωω
ω
hv
hv
hv
kkW
TUkkW
UkkWAcAc
FS+−
+⎭⎬⎫
⎩⎨⎧
−−−+
+
⎭⎬⎫
⎩⎨⎧
−−−+
++
=
2211 61,
61
wwwwww AHUAHU γγ ==
c1 and c2 = Cohesions for failure planes A and B, respectively
φ1 and φ1 = Friction angle of failure planes A and B, respectively
W = Weight of block
T = Tension in bolts or cables
U1 and U2 = Water pressure on failure planes A and B, respectively
kh = Horizontal pseudostatic coefficient
kv = Vertical pseudostatic coefficient
θ = Inclination (dip) of failure plane
ω1 = Angles between failure plane A and the vertical line
ω2 = Angles between failure plane B and the vertical line
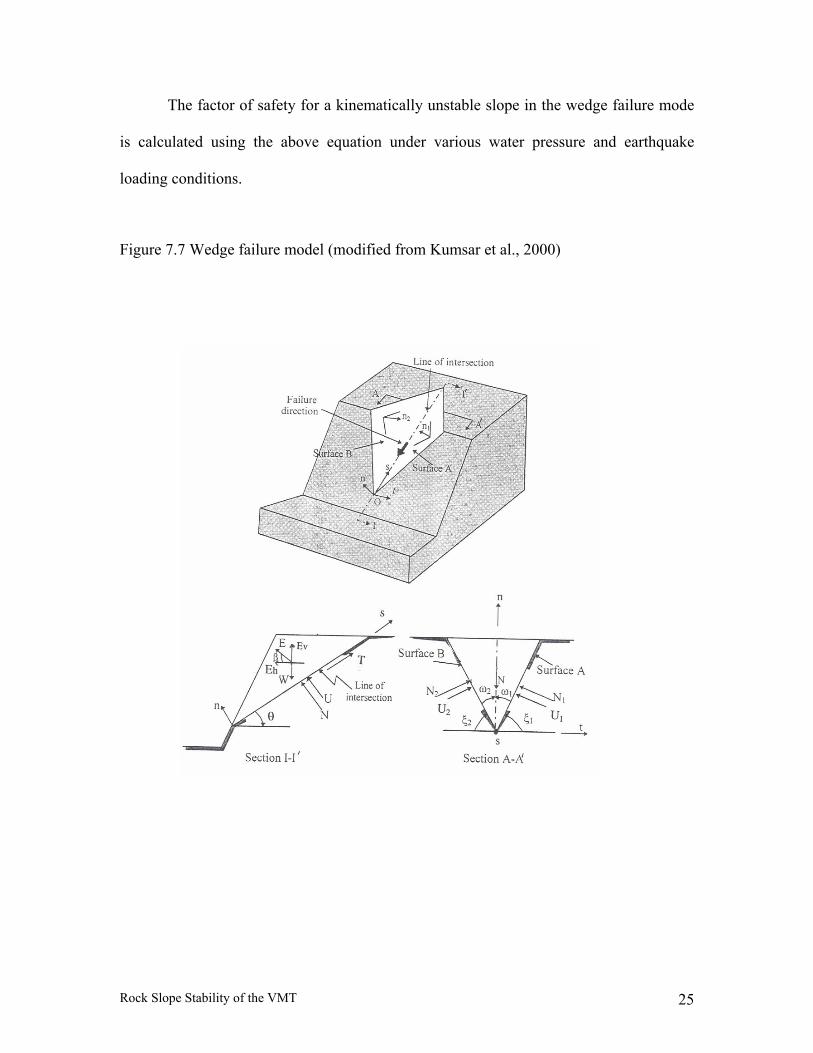
Effects of earthquake forces on wedge failures in rock slopes can be considered in
the same manner as considered for the planar failure using limit equilibrium analysis.
The wedge failure model can be illustrated as shown in Figure 7.7. The force T is
assumed only to increase the resisting force as explained previously for the planar failure
mode.
Rock Slope Stability of the VMT 25
The factor of safety for a kinematically unstable slope in the wedge failure mode
is calculated using the above equation under various water pressure and earthquake
loading conditions.
Figure 7.7 Wedge failure model (modified from Kumsar et al., 2000)
Rock Slope Stability of the VMT 26
7-1-4. Probability of Failure
The probability of failure (Pf) is defined in this study as the probability that the
factor of safety is less than 1.0. To calculate the probability of failure, the mean and
standard deviation of the factor of safety (FS) are needed. The mean FS can be calculated
from each mean value of the input parameters and the standard deviation can be
calculated from each variation of the input parameters using the Taylor’s series expansion.
The approach for computing the uncertainty in the factor of safety, then finding the
reliability index and probability of failure is explained in the following discussion:
A. Identification of Variables
All variables (xi) that affect the stability of a particular slope should be identified.
For planar and wedge failures in this analysis, the slope geometry is fixed. The variables
are unit weight (γ) of unstable blocks and shear strength parameters (c, φ). The pore
pressure conditions are assumed to be dry (Hw/Hslope= 0), partially saturated (Hw/Hslope=
0.3 and 0.7), and/or fully saturated (Hw/Hslope= 1).
B. Mean of Variables
To determine the best estimate of the factor of safety, the best estimates, which
are usually the mean values of variables, μ (xi), should be selected in advance. In this
project, the mean unit weight and mean strength parameters were obtained based on our
experience regarding similar rock types and on the literature.
C. Standard Deviation of Variables
To evaluate uncertainty of variables, the standard deviation (σ (xi)) should be
considered in the reliability analysis. The σ (xi) can be evaluated from measurements.

Rock Slope Stability of the VMT 27
Also the standard deviation can be determined from the coefficient of variance (cov) after
the mean is determined because cov = σ (xi)/μ (xi). The values of cov used in this
analysis are listed in Table 7.1.
Table 7.1 Values of coefficient of variation (After Duncan, 2000)
Parameters Coefficient of Variation
Unit weight (γ) 3 – 7 %
Effective stress friction angle (φ’) 2 – 13 %
Cohesion (c) 13 – 40 %
D. Sensitivity Analysis
Sensitivity analysis is accomplished by calculating the change in factor of safety
due to changing each variable and computing ΔFS/Δxi. In this study, ΔFS/Δγ, ΔFS/Δφ
and ΔFS/Δc were determined.
E. Standard Deviation of Factor of Safety
Uncertainty in the factor of safety can be measured by its variance or standard
deviation using the Taylor series expansion. Assuming each variable is independent, the
equation for σ (FS) is given below:
( ) ( ) ( ) ( ) ( )22
22
22
2
1
2
tantan
cc
FSFSFSxxgFS i
n
iX
iσφσ
φγσ
γσσ μ ⎟
⎠
⎞⎜⎝
⎛Δ
Δ+⎟⎟
⎠
⎞⎜⎜⎝
⎛ΔΔ
+⎟⎟⎠
⎞⎜⎜⎝
⎛Δ
Δ=⎟⎟
⎠
⎞⎜⎜⎝
⎛
∂∂
= ∑=
=

Rock Slope Stability of the VMT 28
F. Reliability Index and Probability of Failure
Reliability index (β) describes the factor of safety using the number of standard
deviations that separate the best estimate of FS from its defined failure value of 1.0.
It can also be considered as a way to normalize the factor of safety with respect to its
standard deviation. When the shape of the probability distribution of the factor of safety
is known, the reliability index can be related to the probability of failure (Pf). Reliability
index (β) can be calculated from the factor of safety (FS) as follows:
)(cov)(0.1)(
)(0.1)(
FSFSFS
FSFS
⋅−
=−
=μ
μσ
μβ
In the analysis, the probability of failure (Pf) is calculated assuming that the FS
follows the normal distribution as shown in Figure 7.8. The probabilities of failure [P
(FS < 1.0)] for planar and wedge failures in the VMT slopes are calculated.
7-2. Rock Slopes in VMT
7-2-1. Limitations of This Analysis
During the field investigations, discontinuity data were measured on those
relatively critical slopes located adjacent to the existing VMT facilities. These include
the Ballast Water Treatment Plant (“BWT Slope”), the Power House and Vapor
Recovery Plant (“PVR Slope”), the West Manifold Building (“WM Slope”), the West
Tank Farm Slope (“WTF Slope”), and the East Tank Farm Slope (“ETF Slope”).
Discontinuity data were also obtained from the less critical slopes located adjacent to the
existing facilities. These include the Power House Road Slope, the Tea Shelter Slope, and
the rock quarries located on the southern portion of the VMT site.

Rock Slope Stability of the VMT 29
Figure 7.8 Probability of failure (Pf) (Cho, 2002)
Rock Slope Stability of the VMT 30
During the field investigations, in most of the critical slopes, it was difficult to
gain access to the higher portions of the cut slopes so most of the data were obtained
along the base of the slopes. Therefore, the data measured for the site may not be fully
representative of the entire rock slope.
It was observed that the critical slopes have been reinforced with rock bolts in the
BWT Slope, PVR Slope, and the first tier of WM Slope. It appears that the slopes have a
minimum of four rock bolts per unit width extending up the slope. Due to the limited
information available, tension values equal to 400 kips per rock block to be analyzed was
assumed, yielding conservative analyses. Rock bolts were originally tensioned to 100
kips per bolt as indicated in the reference document (Bukovansky, 1990).
In the FS analysis, it was also assumed that the discontinuity planes involved were
through-going, meaning that the fracture is continuous through out the block as shown in
Figures 7.5 and 7.7. The concept of a through-going fracture is commonly accepted in
the engineering practice. However, if the discontinuity is not through-going, the FS
becomes higher than that determined assuming a through-going fracture. Fracture
continuity is one of the most important parameters that affect the rock mass strength, and
it is also very difficult to quantify.
The mechanical properties of the rock slope discontinuities include unit weight,
friction angle of the potential failure plane, and cohesion. These were also assumed based
on a literature review. In this analysis, cohesion was assumed to be zero and the friction
angles of 30 degrees and 45 degrees were assumed for foliations and joints, respectively.
Unit weight of the rock was assumed to be 160 pcf.
Rock Slope Stability of the VMT 31
In the factor of safety calculations involving earthquake loading conditions, the
slope is considered to be stable if the FS is greater than 1.0. In the same manner, the
slope is considered to be unstable if the FS is less than 1.0.
7-2-2. BWT Slope
A. Site Observations
The BWT slope is located immediately south of the Ballast Water Treatment
facilities. Based on the topographic map provided, the height of the slope ranges
approximately from 120 feet to 160 feet.
The BWT slope consists of hard, competent greenstone. The major
discontinuities are foliations, joints, and a fault located in the west end of this slope. It
appears that the strike and dip of the fault are approximately N20W and 62SW,
respectively. It rises higher toward the road above the slope.
Rock bolts have been installed in this slope using both random and systematic
patterns. Based upon available information (Bukovansky, 1990), the bolts were installed
using 5 to 10 foot staggered patterns, whereas, some bolts were installed in an
approximately 20 foot pattern.
During the site visit, it was observed that a number of blocks of various sizes,
most of them less than about one foot in diameter, have fallen from the cut slopes.
B. Kinematic Analysis
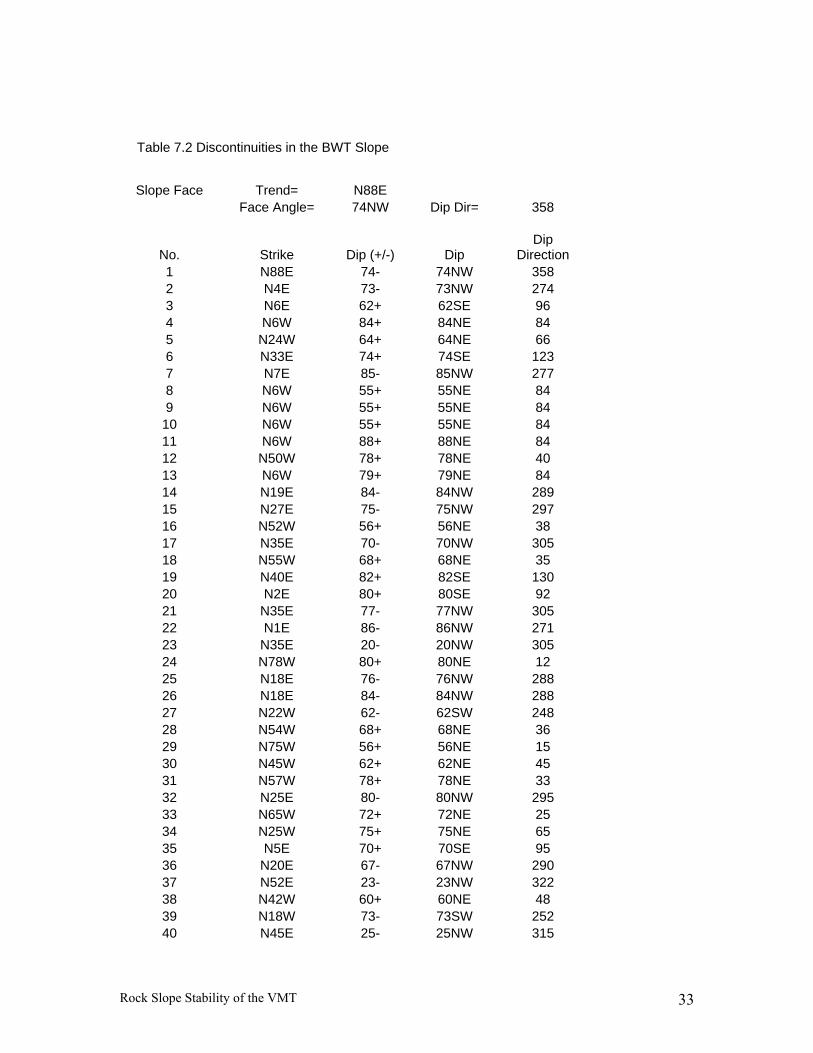
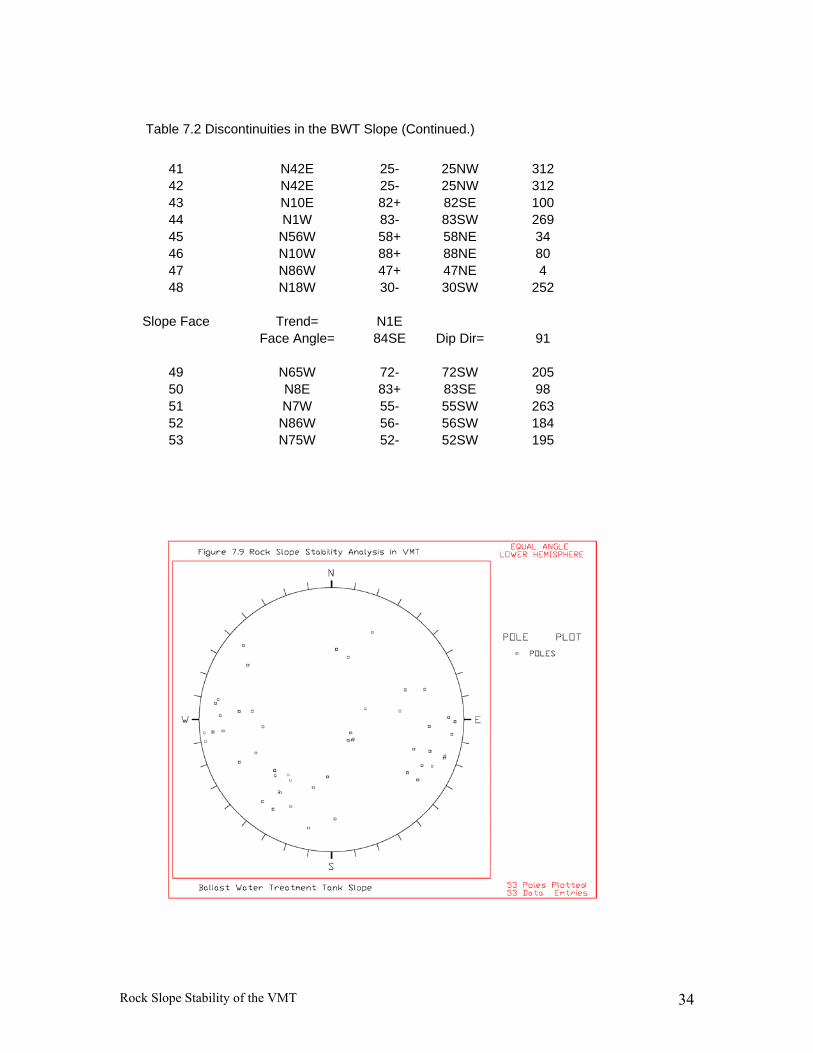
The major discontinuities measured in this slope are listed in Table 7.2 and the
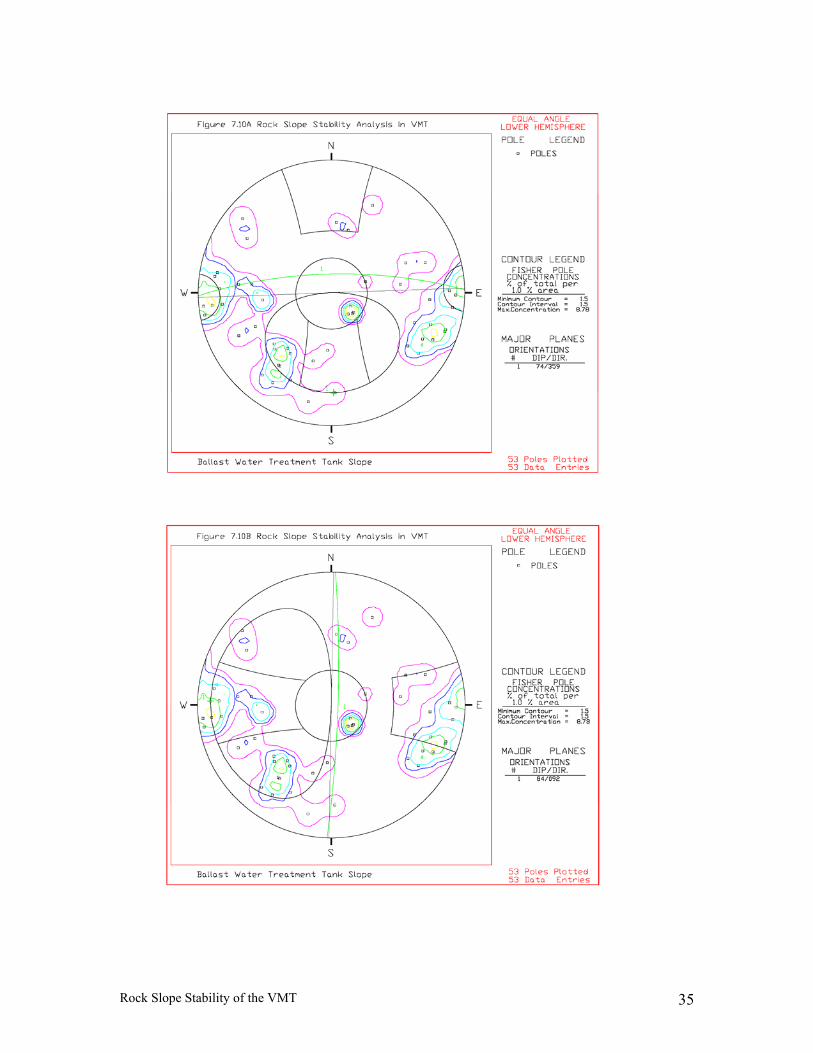
pole plot of these data is illustrated in Figure 7.9. Based on the kinematic analysis shown
in Figures 7.10A and 7.10B, and Figures 7.12A and 7.12B, it is anticipated that wedge
failures are most prominent with planar failure and toppling being less prominent for the
Rock Slope Stability of the VMT 32
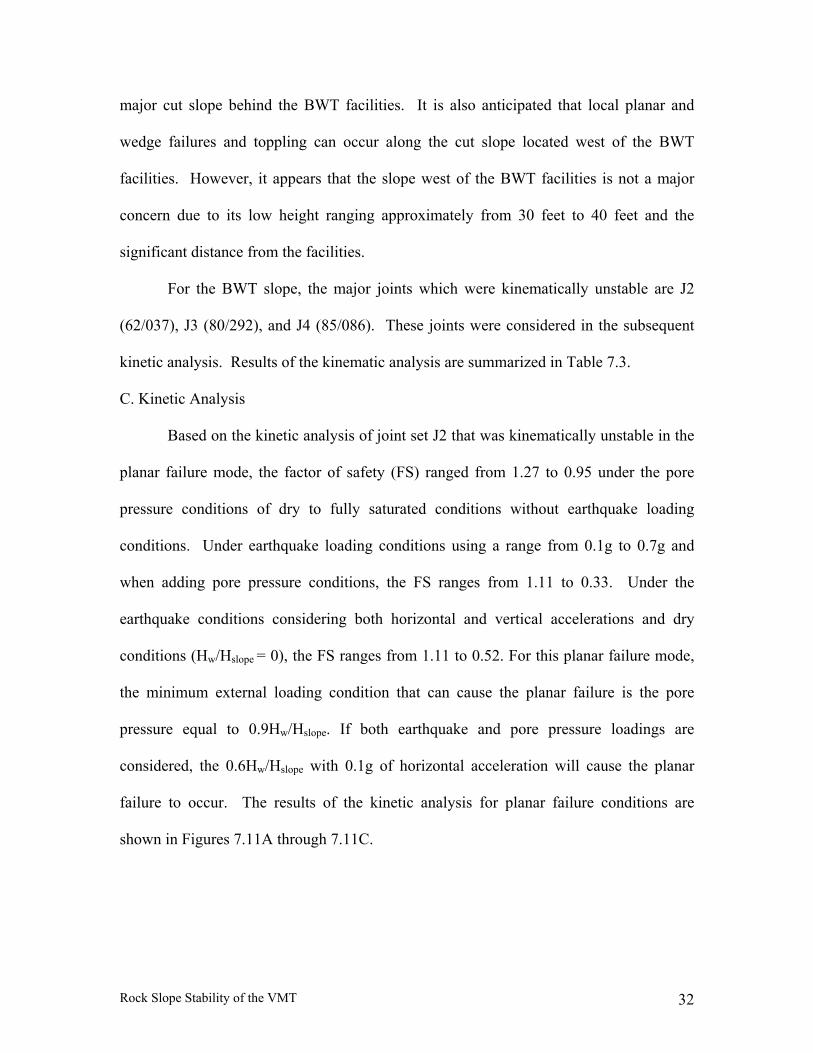
major cut slope behind the BWT facilities. It is also anticipated that local planar and
wedge failures and toppling can occur along the cut slope located west of the BWT
facilities. However, it appears that the slope west of the BWT facilities is not a major
concern due to its low height ranging approximately from 30 feet to 40 feet and the
significant distance from the facilities.
For the BWT slope, the major joints which were kinematically unstable are J2
(62/037), J3 (80/292), and J4 (85/086). These joints were considered in the subsequent
kinetic analysis. Results of the kinematic analysis are summarized in Table 7.3.
C. Kinetic Analysis
Based on the kinetic analysis of joint set J2 that was kinematically unstable in the
planar failure mode, the factor of safety (FS) ranged from 1.27 to 0.95 under the pore
pressure conditions of dry to fully saturated conditions without earthquake loading
conditions. Under earthquake loading conditions using a range from 0.1g to 0.7g and
when adding pore pressure conditions, the FS ranges from 1.11 to 0.33. Under the
earthquake conditions considering both horizontal and vertical accelerations and dry
conditions (Hw/Hslope = 0), the FS ranges from 1.11 to 0.52. For this planar failure mode,
the minimum external loading condition that can cause the planar failure is the pore
pressure equal to 0.9Hw/Hslope. If both earthquake and pore pressure loadings are
considered, the 0.6Hw/Hslope with 0.1g of horizontal acceleration will cause the planar
failure to occur. The results of the kinetic analysis for planar failure conditions are
shown in Figures 7.11A through 7.11C.
Rock Slope Stability of the VMT 33
Table 7.2 Discontinuities in the BWT Slope
Slope Face Trend= N88E
Face Angle= 74NW Dip Dir= 358
No. Strike Dip (+/-) Dip Dip
Direction 1 N88E 74- 74NW 358 2 N4E 73- 73NW 274 3 N6E 62+ 62SE 96 4 N6W 84+ 84NE 84 5 N24W 64+ 64NE 66 6 N33E 74+ 74SE 123 7 N7E 85- 85NW 277 8 N6W 55+ 55NE 84 9 N6W 55+ 55NE 84
10 N6W 55+ 55NE 84 11 N6W 88+ 88NE 84 12 N50W 78+ 78NE 40 13 N6W 79+ 79NE 84 14 N19E 84- 84NW 289 15 N27E 75- 75NW 297 16 N52W 56+ 56NE 38 17 N35E 70- 70NW 305 18 N55W 68+ 68NE 35 19 N40E 82+ 82SE 130 20 N2E 80+ 80SE 92 21 N35E 77- 77NW 305 22 N1E 86- 86NW 271 23 N35E 20- 20NW 305 24 N78W 80+ 80NE 12 25 N18E 76- 76NW 288 26 N18E 84- 84NW 288 27 N22W 62- 62SW 248 28 N54W 68+ 68NE 36 29 N75W 56+ 56NE 15 30 N45W 62+ 62NE 45 31 N57W 78+ 78NE 33 32 N25E 80- 80NW 295 33 N65W 72+ 72NE 25 34 N25W 75+ 75NE 65 35 N5E 70+ 70SE 95 36 N20E 67- 67NW 290 37 N52E 23- 23NW 322 38 N42W 60+ 60NE 48 39 N18W 73- 73SW 252 40 N45E 25- 25NW 315
Rock Slope Stability of the VMT 34
Table 7.2 Discontinuities in the BWT Slope (Continued.)
41 N42E 25- 25NW 312 42 N42E 25- 25NW 312 43 N10E 82+ 82SE 100 44 N1W 83- 83SW 269 45 N56W 58+ 58NE 34 46 N10W 88+ 88NE 80 47 N86W 47+ 47NE 4 48 N18W 30- 30SW 252
Slope Face Trend= N1E
Face Angle= 84SE Dip Dir= 91
49 N65W 72- 72SW 205 50 N8E 83+ 83SE 98 51 N7W 55- 55SW 263 52 N86W 56- 56SW 184 53 N75W 52- 52SW 195
Rock Slope Stability of the VMT 35

Rock Slope Stability of the VMT 36
Figure 7.11APore Pressure (No earthquake conditions)
0.0
0.2
0.4
0.6
0.8
1.0
1.2
1.4
0 0.1 0.2 0.3 0.4 0.5 0.6 0.7 0.8 0.9 1
Pore Pressure (Hw/Hslope)
FS
Figure 7.11BPore Pressure (With earthquake conditions)
0.00
0.20
0.40
0.60
0.80
1.00
1.20
0 0.2 0.4 0.6 0.8 1
Pore Pressure (Hw/Hslope)
FS
ah=0.1 ah=0.3 ah=0.5 ah=0.7

Rock Slope Stability of the VMT 37
Figure 7.11CVertical and Horizontal Accelerations (No Pore pressure)
0.00.10.20.30.40.50.60.70.80.91.01.11.2
0 0.5ah
Vertical Accelerations (av)
FS
ah=0.1 ah=0.3 ah=0.5 ah=0.7

Rock Slope Stability of the VMT 38
The kinetic analysis was also performed on the joint sets that form the most
unfavorable wedge failure. Based on the kinetic analysis of the intersection of joint sets
J2 and J3 that were kinematically unstable in the wedge failure mode, the factor of safety
(FS) ranges from 1.38 to 0.51 under the pore pressures of dry to fully saturated conditions
without earthquake loading conditions. Under earthquake loading conditions ranging
from 0.1g to 0.7g, adding pore pressure conditions, the FS ranges from 1.21 to zero.
Under the earthquake conditions considering both horizontal and vertical accelerations
and dry conditions (Hw/Hslope = 0), the FS ranges from 1.21 to 0.31.
Rock Slope Stability of the VMT 39
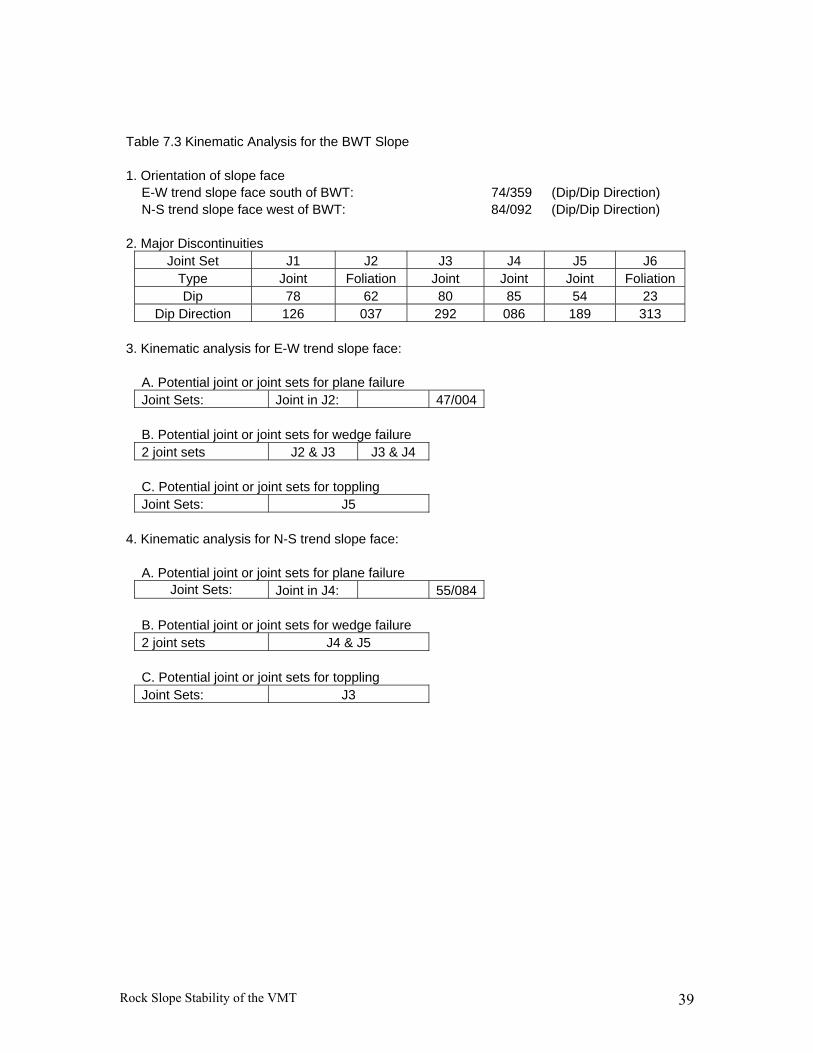
Table 7.3 Kinematic Analysis for the BWT Slope 1. Orientation of slope face E-W trend slope face south of BWT: 74/359 (Dip/Dip Direction) N-S trend slope face west of BWT: 84/092 (Dip/Dip Direction) 2. Major Discontinuities Joint Set J1 J2 J3 J4 J5 J6 Type Joint Foliation Joint Joint Joint Foliation Dip 78 62 80 85 54 23 Dip Direction 126 037 292 086 189 313 3. Kinematic analysis for E-W trend slope face: A. Potential joint or joint sets for plane failure Joint Sets: Joint in J2: 47/004 B. Potential joint or joint sets for wedge failure 2 joint sets J2 & J3 J3 & J4 C. Potential joint or joint sets for toppling Joint Sets: J5 4. Kinematic analysis for N-S trend slope face: A. Potential joint or joint sets for plane failure Joint Sets: Joint in J4: 55/084 B. Potential joint or joint sets for wedge failure 2 joint sets J4 & J5 C. Potential joint or joint sets for toppling Joint Sets: J3
Rock Slope Stability of the VMT 40
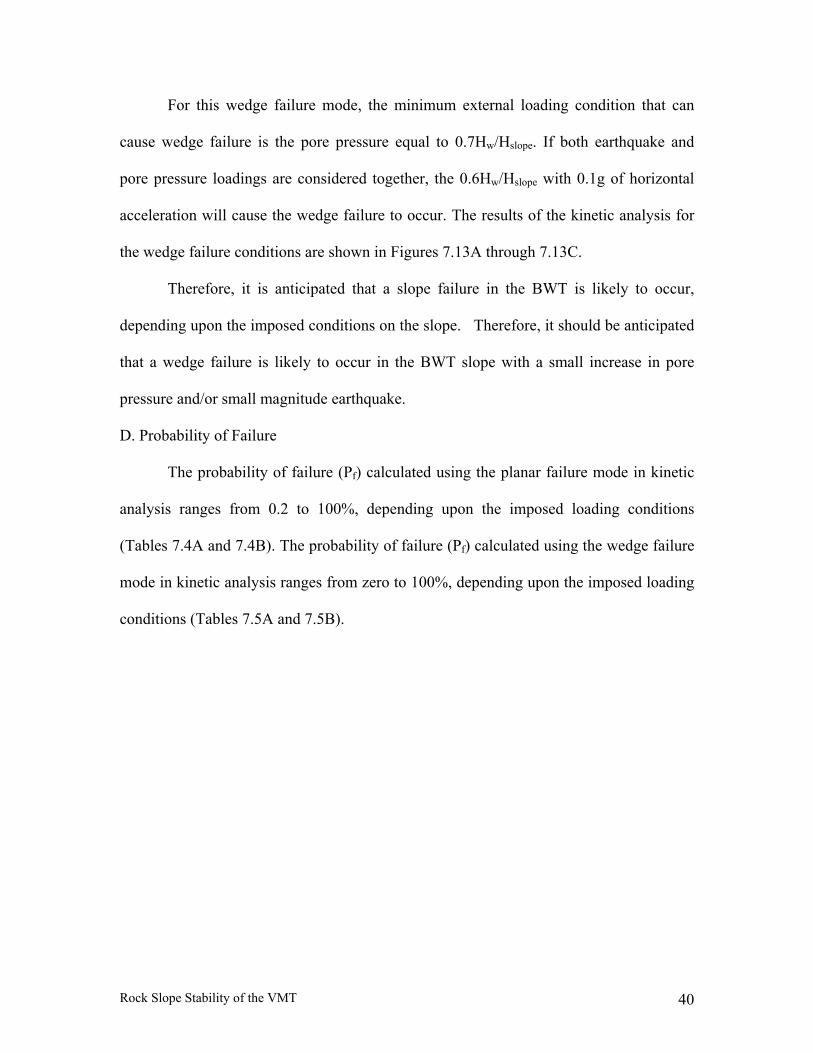
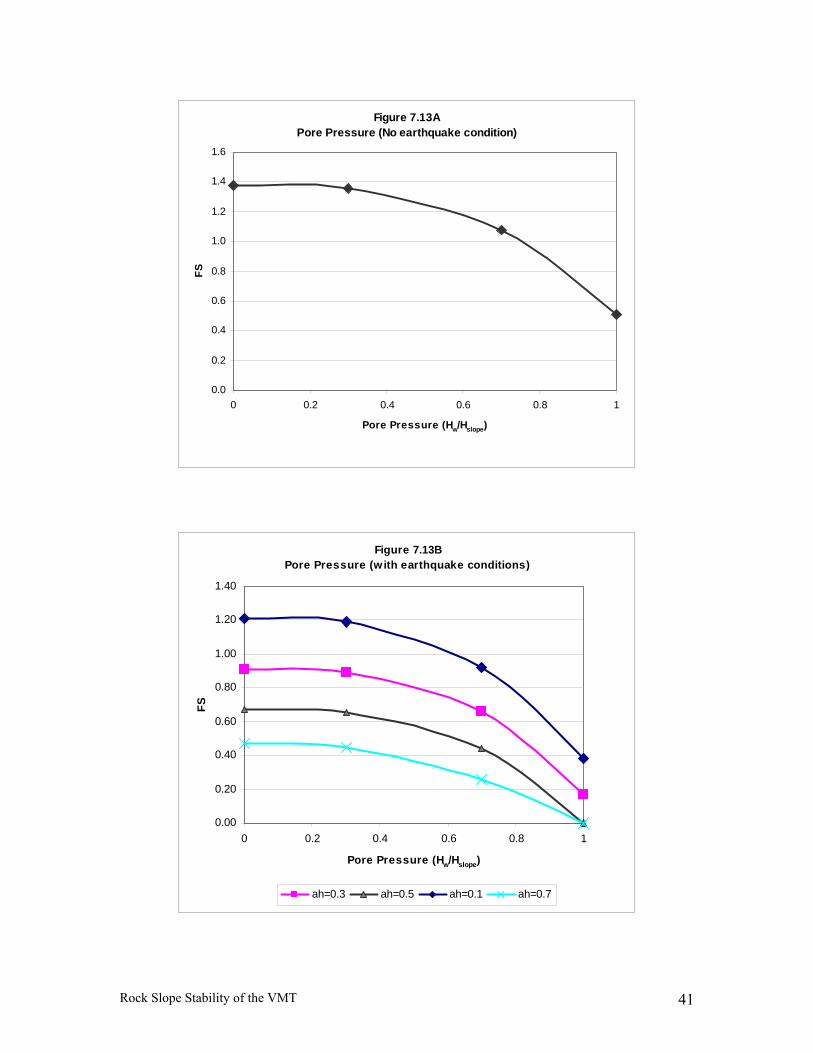
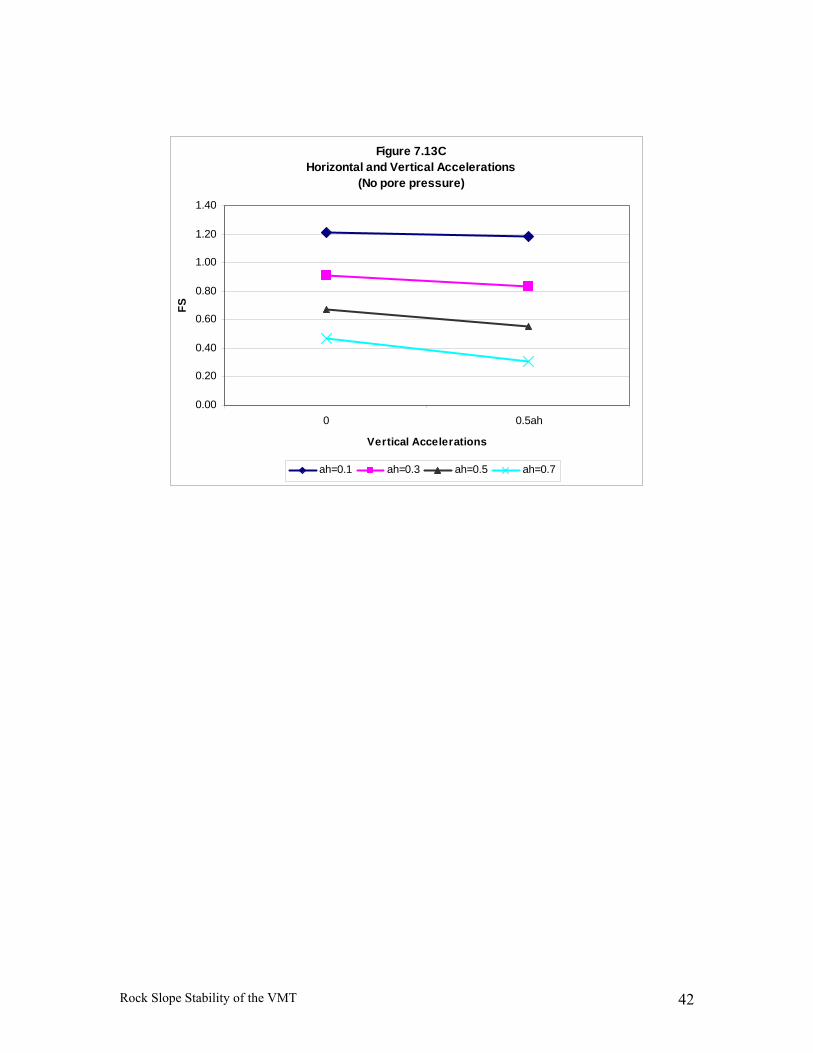
For this wedge failure mode, the minimum external loading condition that can
cause wedge failure is the pore pressure equal to 0.7Hw/Hslope. If both earthquake and
pore pressure loadings are considered together, the 0.6Hw/Hslope with 0.1g of horizontal
acceleration will cause the wedge failure to occur. The results of the kinetic analysis for
the wedge failure conditions are shown in Figures 7.13A through 7.13C.
Therefore, it is anticipated that a slope failure in the BWT is likely to occur,
depending upon the imposed conditions on the slope. Therefore, it should be anticipated
that a wedge failure is likely to occur in the BWT slope with a small increase in pore
pressure and/or small magnitude earthquake.
D. Probability of Failure
The probability of failure (Pf) calculated using the planar failure mode in kinetic
analysis ranges from 0.2 to 100%, depending upon the imposed loading conditions
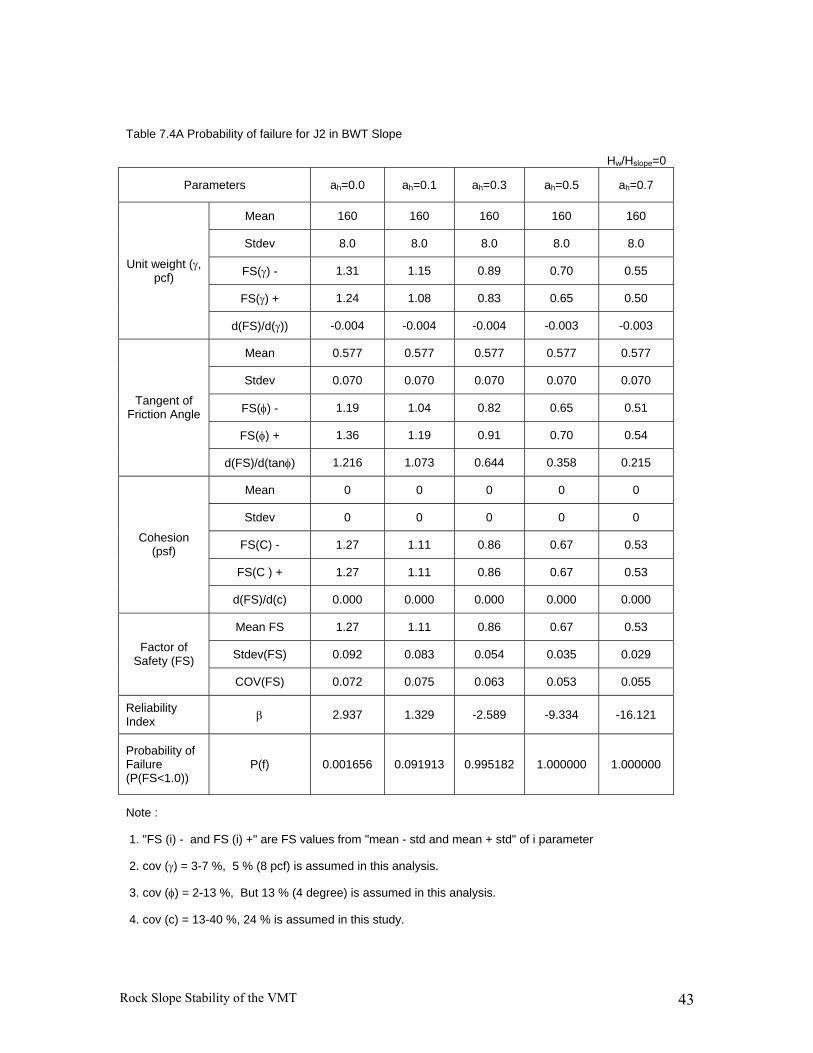
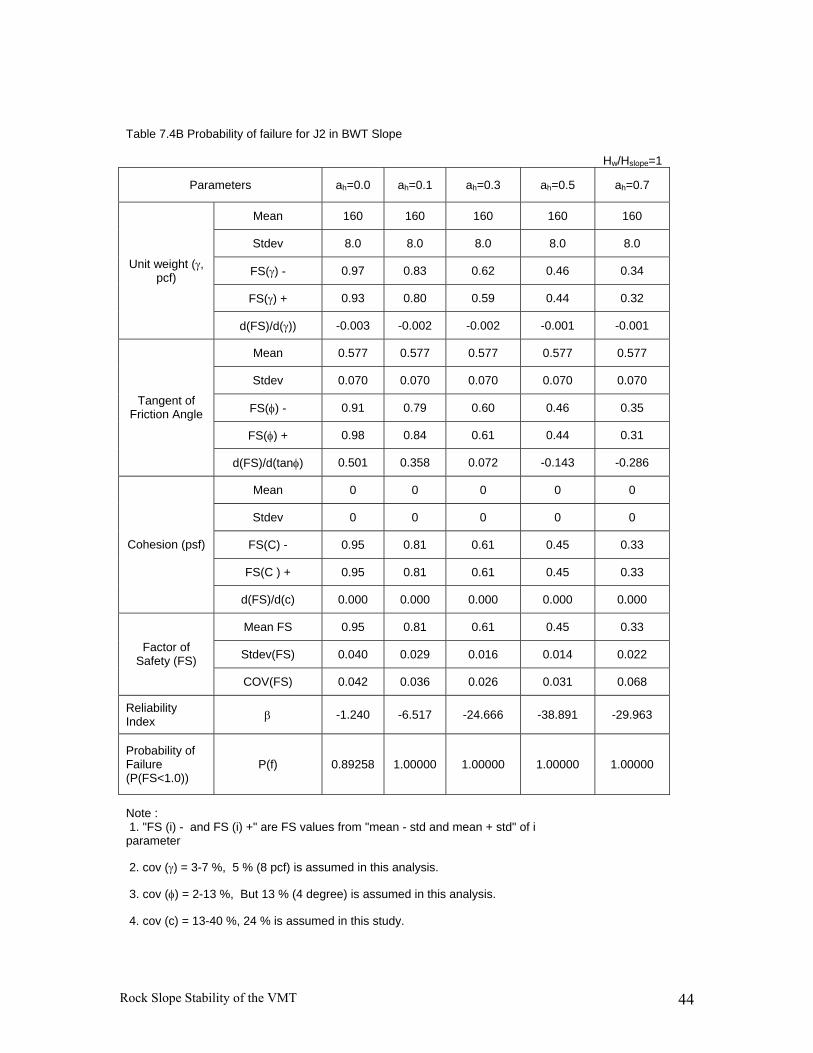
(Tables 7.4A and 7.4B). The probability of failure (Pf) calculated using the wedge failure
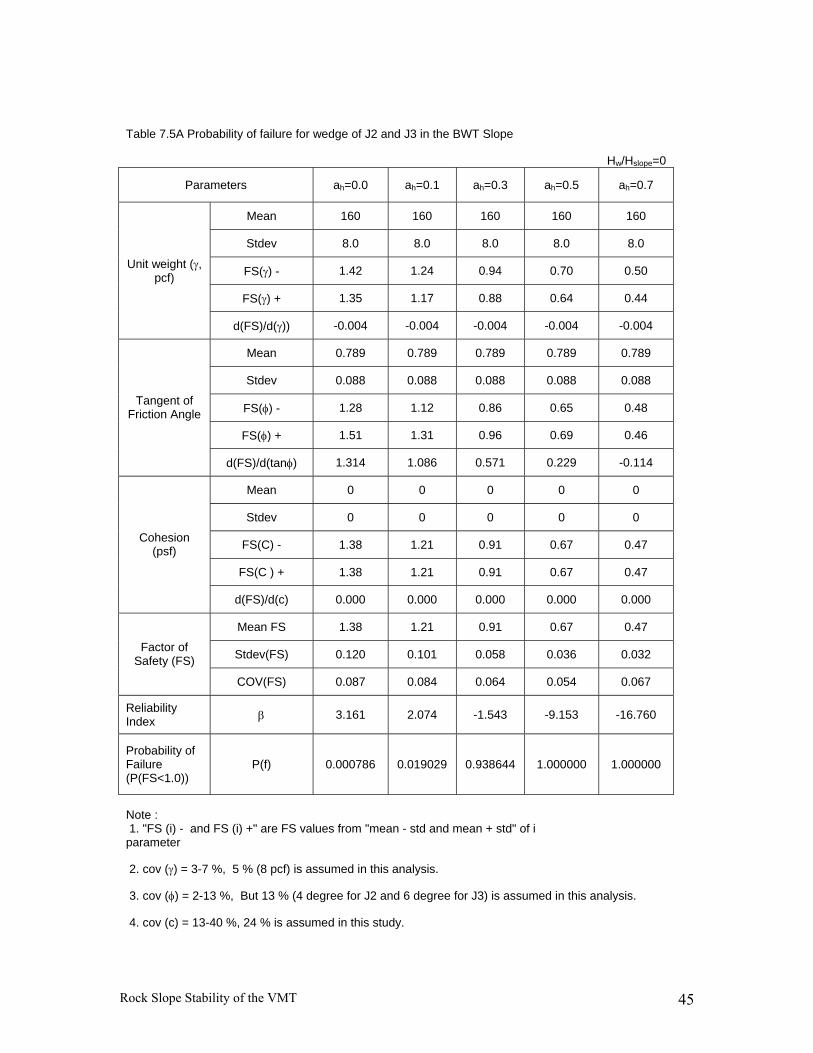
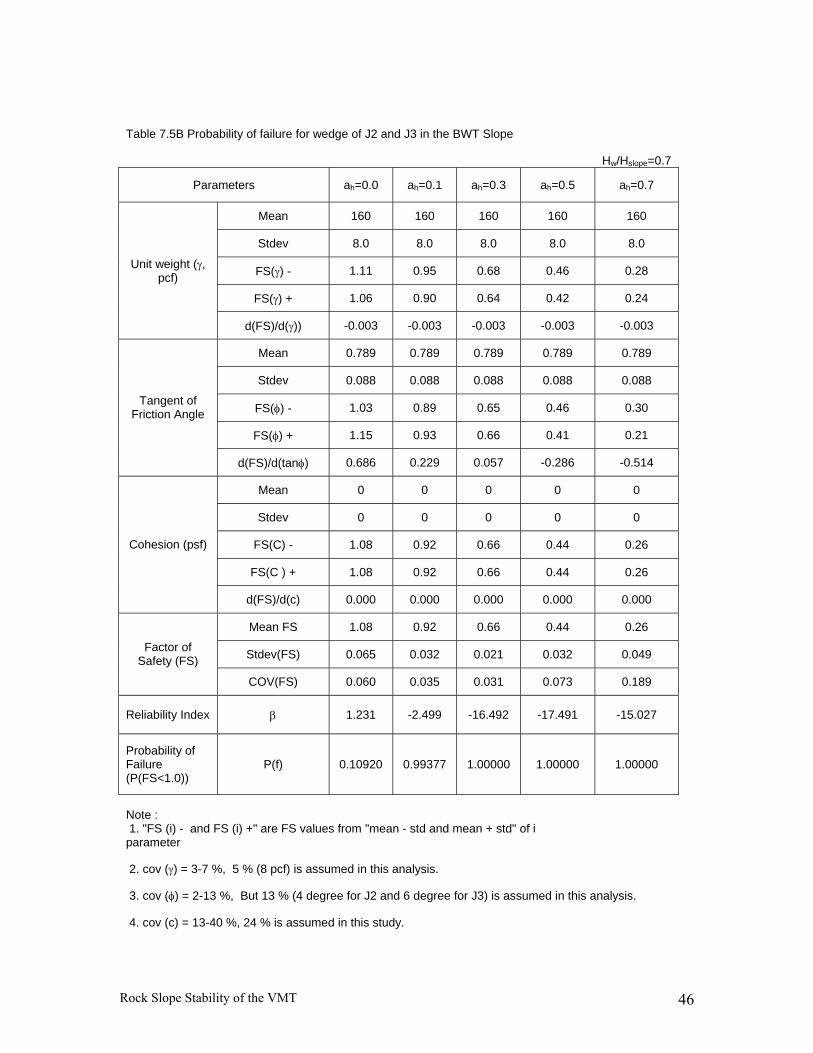
mode in kinetic analysis ranges from zero to 100%, depending upon the imposed loading
conditions (Tables 7.5A and 7.5B).
Rock Slope Stability of the VMT 41
Figure 7.13APore Pressure (No earthquake condition)
0.0
0.2
0.4
0.6
0.8
1.0
1.2
1.4
1.6
0 0.2 0.4 0.6 0.8 1
Pore Pressure (Hw/Hslope)
FS
Figure 7.13BPore Pressure (with earthquake conditions)
0.00
0.20
0.40
0.60
0.80
1.00
1.20
1.40
0 0.2 0.4 0.6 0.8 1
Pore Pressure (Hw/Hslope)
FS
ah=0.3 ah=0.5 ah=0.1 ah=0.7
Rock Slope Stability of the VMT 42
Figure 7.13CHorizontal and Vertical Accelerations
(No pore pressure)
0.00
0.20
0.40
0.60
0.80
1.00
1.20
1.40
0 0.5ah
Vertical Accelerations
FS
ah=0.1 ah=0.3 ah=0.5 ah=0.7
Rock Slope Stability of the VMT 43
Table 7.4A Probability of failure for J2 in BWT Slope
Hw/Hslope=0
Parameters ah=0.0 ah=0.1 ah=0.3 ah=0.5 ah=0.7
Mean 160 160 160 160 160
Stdev 8.0 8.0 8.0 8.0 8.0
FS(γ) - 1.31 1.15 0.89 0.70 0.55
FS(γ) + 1.24 1.08 0.83 0.65 0.50
Unit weight (γ, pcf)
d(FS)/d(γ)) -0.004 -0.004 -0.004 -0.003 -0.003
Mean 0.577 0.577 0.577 0.577 0.577
Stdev 0.070 0.070 0.070 0.070 0.070
FS(φ) - 1.19 1.04 0.82 0.65 0.51
FS(φ) + 1.36 1.19 0.91 0.70 0.54
Tangent of Friction Angle
d(FS)/d(tanφ) 1.216 1.073 0.644 0.358 0.215
Mean 0 0 0 0 0
Stdev 0 0 0 0 0
FS(C) - 1.27 1.11 0.86 0.67 0.53
FS(C ) + 1.27 1.11 0.86 0.67 0.53
Cohesion (psf)
d(FS)/d(c) 0.000 0.000 0.000 0.000 0.000
Mean FS 1.27 1.11 0.86 0.67 0.53
Stdev(FS) 0.092 0.083 0.054 0.035 0.029 Factor of Safety (FS)
COV(FS) 0.072 0.075 0.063 0.053 0.055
Reliability Index β 2.937 1.329 -2.589 -9.334 -16.121
Probability of Failure (P(FS<1.0))
P(f) 0.001656 0.091913 0.995182 1.000000 1.000000
Note :
1. "FS (i) - and FS (i) +" are FS values from "mean - std and mean + std" of i parameter
2. cov (γ) = 3-7 %, 5 % (8 pcf) is assumed in this analysis.
3. cov (φ) = 2-13 %, But 13 % (4 degree) is assumed in this analysis.
4. cov (c) = 13-40 %, 24 % is assumed in this study.
Rock Slope Stability of the VMT 44
Table 7.4B Probability of failure for J2 in BWT Slope
Hw/Hslope=1
Parameters ah=0.0 ah=0.1 ah=0.3 ah=0.5 ah=0.7
Mean 160 160 160 160 160
Stdev 8.0 8.0 8.0 8.0 8.0
FS(γ) - 0.97 0.83 0.62 0.46 0.34
FS(γ) + 0.93 0.80 0.59 0.44 0.32
Unit weight (γ, pcf)
d(FS)/d(γ)) -0.003 -0.002 -0.002 -0.001 -0.001
Mean 0.577 0.577 0.577 0.577 0.577
Stdev 0.070 0.070 0.070 0.070 0.070
FS(φ) - 0.91 0.79 0.60 0.46 0.35
FS(φ) + 0.98 0.84 0.61 0.44 0.31
Tangent of Friction Angle
d(FS)/d(tanφ) 0.501 0.358 0.072 -0.143 -0.286
Mean 0 0 0 0 0
Stdev 0 0 0 0 0
FS(C) - 0.95 0.81 0.61 0.45 0.33
FS(C ) + 0.95 0.81 0.61 0.45 0.33
Cohesion (psf)
d(FS)/d(c) 0.000 0.000 0.000 0.000 0.000
Mean FS 0.95 0.81 0.61 0.45 0.33
Stdev(FS) 0.040 0.029 0.016 0.014 0.022 Factor of Safety (FS)
COV(FS) 0.042 0.036 0.026 0.031 0.068
Reliability Index β -1.240 -6.517 -24.666 -38.891 -29.963
Probability of Failure (P(FS<1.0))
P(f) 0.89258 1.00000 1.00000 1.00000 1.00000
Note : 1. "FS (i) - and FS (i) +" are FS values from "mean - std and mean + std" of i parameter
2. cov (γ) = 3-7 %, 5 % (8 pcf) is assumed in this analysis.
3. cov (φ) = 2-13 %, But 13 % (4 degree) is assumed in this analysis.
4. cov (c) = 13-40 %, 24 % is assumed in this study.
Rock Slope Stability of the VMT 45
Table 7.5A Probability of failure for wedge of J2 and J3 in the BWT Slope
Hw/Hslope=0
Parameters ah=0.0 ah=0.1 ah=0.3 ah=0.5 ah=0.7
Mean 160 160 160 160 160
Stdev 8.0 8.0 8.0 8.0 8.0
FS(γ) - 1.42 1.24 0.94 0.70 0.50
FS(γ) + 1.35 1.17 0.88 0.64 0.44
Unit weight (γ, pcf)
d(FS)/d(γ)) -0.004 -0.004 -0.004 -0.004 -0.004
Mean 0.789 0.789 0.789 0.789 0.789
Stdev 0.088 0.088 0.088 0.088 0.088
FS(φ) - 1.28 1.12 0.86 0.65 0.48
FS(φ) + 1.51 1.31 0.96 0.69 0.46
Tangent of Friction Angle
d(FS)/d(tanφ) 1.314 1.086 0.571 0.229 -0.114
Mean 0 0 0 0 0
Stdev 0 0 0 0 0
FS(C) - 1.38 1.21 0.91 0.67 0.47
FS(C ) + 1.38 1.21 0.91 0.67 0.47
Cohesion (psf)
d(FS)/d(c) 0.000 0.000 0.000 0.000 0.000
Mean FS 1.38 1.21 0.91 0.67 0.47
Stdev(FS) 0.120 0.101 0.058 0.036 0.032 Factor of Safety (FS)
COV(FS) 0.087 0.084 0.064 0.054 0.067
Reliability Index β 3.161 2.074 -1.543 -9.153 -16.760
Probability of Failure (P(FS<1.0))
P(f) 0.000786 0.019029 0.938644 1.000000 1.000000
Note : 1. "FS (i) - and FS (i) +" are FS values from "mean - std and mean + std" of i parameter
2. cov (γ) = 3-7 %, 5 % (8 pcf) is assumed in this analysis.
3. cov (φ) = 2-13 %, But 13 % (4 degree for J2 and 6 degree for J3) is assumed in this analysis.
4. cov (c) = 13-40 %, 24 % is assumed in this study.
Rock Slope Stability of the VMT 46
Table 7.5B Probability of failure for wedge of J2 and J3 in the BWT Slope
Hw/Hslope=0.7
Parameters ah=0.0 ah=0.1 ah=0.3 ah=0.5 ah=0.7
Mean 160 160 160 160 160
Stdev 8.0 8.0 8.0 8.0 8.0
FS(γ) - 1.11 0.95 0.68 0.46 0.28
FS(γ) + 1.06 0.90 0.64 0.42 0.24
Unit weight (γ, pcf)
d(FS)/d(γ)) -0.003 -0.003 -0.003 -0.003 -0.003
Mean 0.789 0.789 0.789 0.789 0.789
Stdev 0.088 0.088 0.088 0.088 0.088
FS(φ) - 1.03 0.89 0.65 0.46 0.30
FS(φ) + 1.15 0.93 0.66 0.41 0.21
Tangent of Friction Angle
d(FS)/d(tanφ) 0.686 0.229 0.057 -0.286 -0.514
Mean 0 0 0 0 0
Stdev 0 0 0 0 0
FS(C) - 1.08 0.92 0.66 0.44 0.26
FS(C ) + 1.08 0.92 0.66 0.44 0.26
Cohesion (psf)
d(FS)/d(c) 0.000 0.000 0.000 0.000 0.000
Mean FS 1.08 0.92 0.66 0.44 0.26
Stdev(FS) 0.065 0.032 0.021 0.032 0.049 Factor of Safety (FS)
COV(FS) 0.060 0.035 0.031 0.073 0.189
Reliability Index β 1.231 -2.499 -16.492 -17.491 -15.027
Probability of Failure (P(FS<1.0))
P(f) 0.10920 0.99377 1.00000 1.00000 1.00000
Note : 1. "FS (i) - and FS (i) +" are FS values from "mean - std and mean + std" of i parameter
2. cov (γ) = 3-7 %, 5 % (8 pcf) is assumed in this analysis.
3. cov (φ) = 2-13 %, But 13 % (4 degree for J2 and 6 degree for J3) is assumed in this analysis.
4. cov (c) = 13-40 %, 24 % is assumed in this study.
Rock Slope Stability of the VMT 47
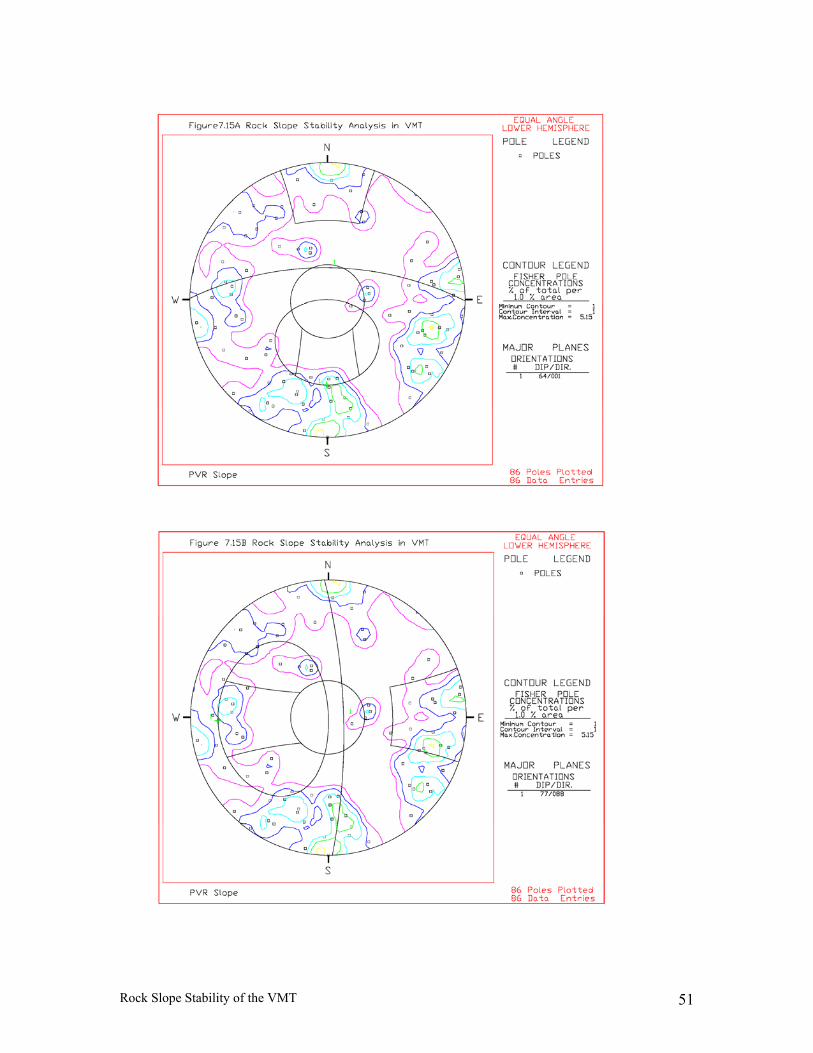
7-2-3. PVR Slope
A. Site Observations
The PVR slope is located immediately south of the Power and Vapor Recovery
facilities. Based on the topographic map provided, the height of the slope ranges
approximately from 110 feet to 130 feet.
The PVR slope consists of weathered phyllite. The slope is flatter in the western
portion of the slope than the eastern slope because after the western slope failed in 1975
during construction, the slope was reduced to about 45 degrees. Subsequent stabilization
measures were implemented, including rock bolting, dewatering, rock buttress
construction at the toe and placement of an impermeable liner at the crest (Bukovansky,
1990). During the site visit, it was observed that there had been rock slab failures along
the phyllite foliation. Dewatering of rock slopes is accomplished by the installation of
horizontal drain holes drilled into the rock mass. Removing pore pressures from a slope
can be a challenging process with conditions not unlike those when wells are drilled for
water supply (Santi et al., 2001).
The major discontinuities observed in this slope are foliations and joints. Also, a
fault was observed trending 20/285 (dip/dip direction). Based on the available
information (Bukovansky, 1990), the bolts were installed in 5 foot to 10 foot staggered
patterns.
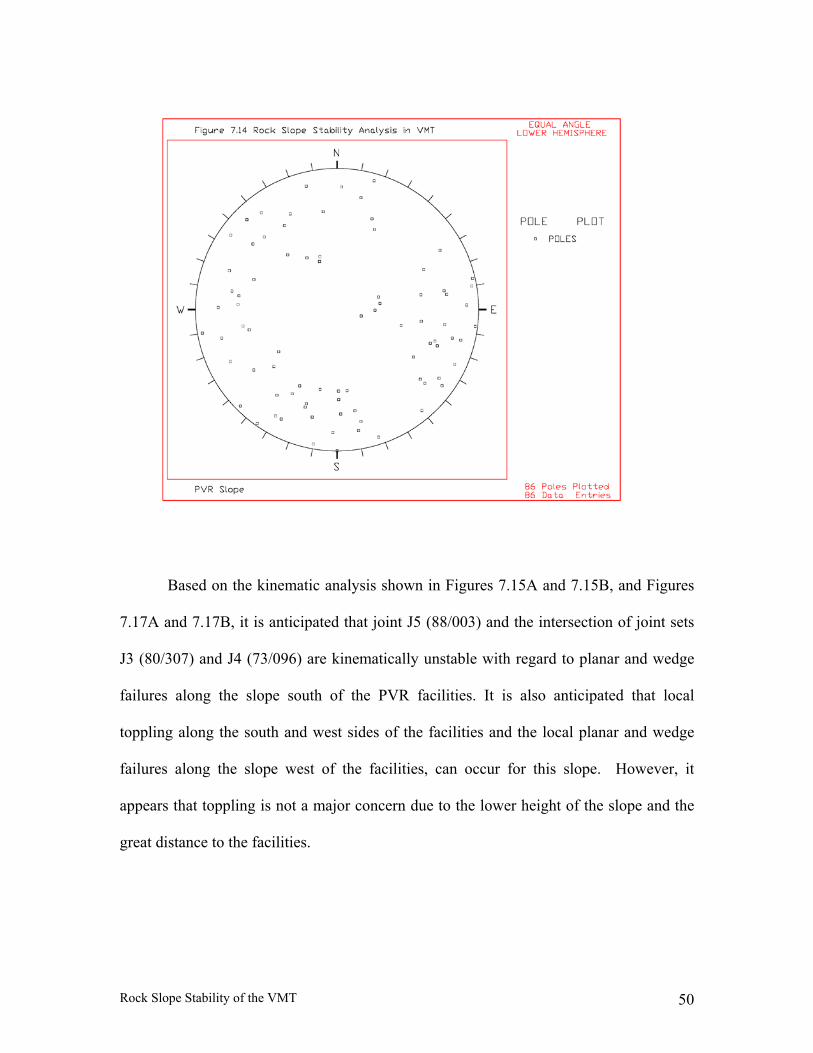
B. Kinematic Analysis
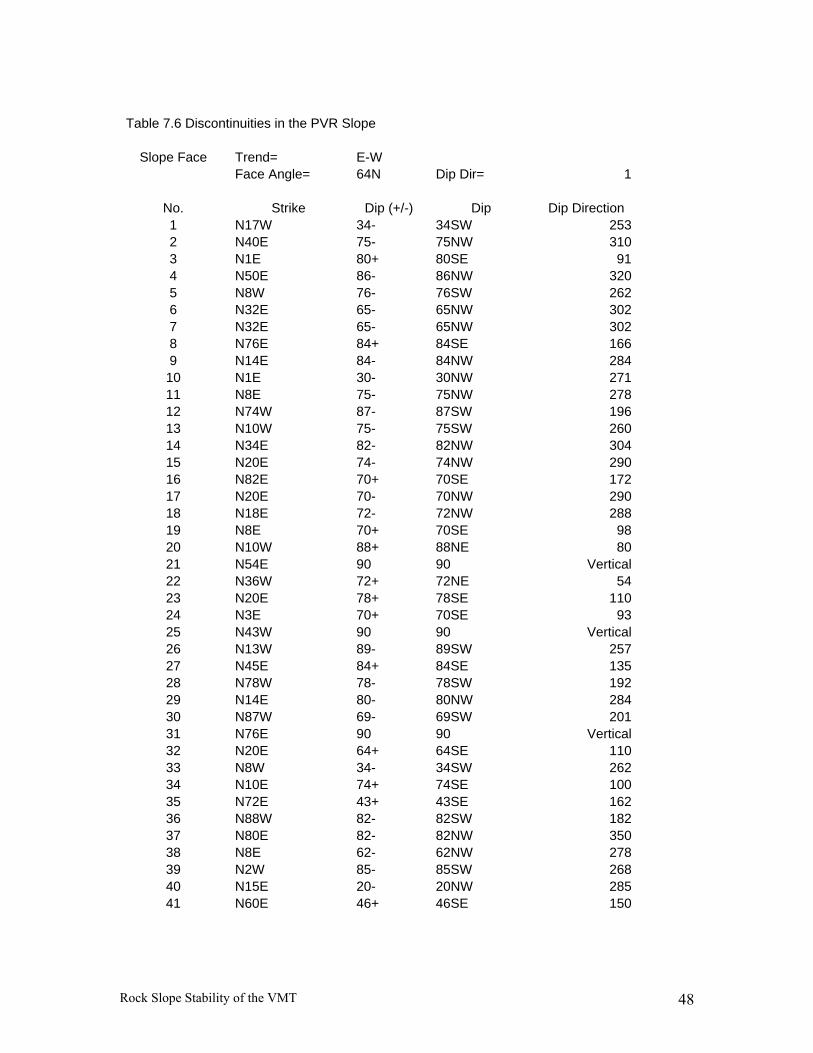
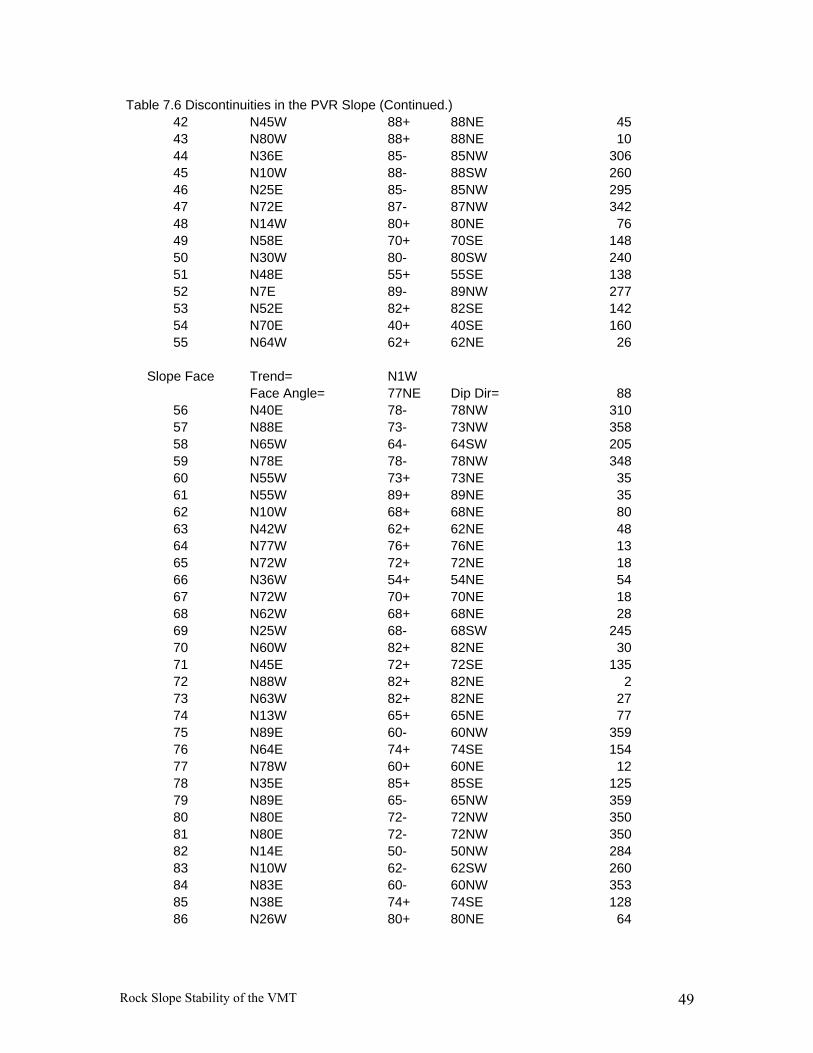
The major discontinuities measured in this slope are listed in Table 7.6 and the
pole plot of these data is illustrated in Figure 7.14.
Rock Slope Stability of the VMT 48
Table 7.6 Discontinuities in the PVR Slope
Slope Face Trend= E-W Face Angle= 64N Dip Dir= 1
No. Strike Dip (+/-) Dip Dip Direction 1 N17W 34- 34SW 253 2 N40E 75- 75NW 310 3 N1E 80+ 80SE 91 4 N50E 86- 86NW 320 5 N8W 76- 76SW 262 6 N32E 65- 65NW 302 7 N32E 65- 65NW 302 8 N76E 84+ 84SE 166 9 N14E 84- 84NW 284 10 N1E 30- 30NW 271 11 N8E 75- 75NW 278 12 N74W 87- 87SW 196 13 N10W 75- 75SW 260 14 N34E 82- 82NW 304 15 N20E 74- 74NW 290 16 N82E 70+ 70SE 172 17 N20E 70- 70NW 290 18 N18E 72- 72NW 288 19 N8E 70+ 70SE 98 20 N10W 88+ 88NE 80 21 N54E 90 90 Vertical 22 N36W 72+ 72NE 54 23 N20E 78+ 78SE 110 24 N3E 70+ 70SE 93 25 N43W 90 90 Vertical 26 N13W 89- 89SW 257 27 N45E 84+ 84SE 135 28 N78W 78- 78SW 192 29 N14E 80- 80NW 284 30 N87W 69- 69SW 201 31 N76E 90 90 Vertical 32 N20E 64+ 64SE 110 33 N8W 34- 34SW 262 34 N10E 74+ 74SE 100 35 N72E 43+ 43SE 162 36 N88W 82- 82SW 182 37 N80E 82- 82NW 350 38 N8E 62- 62NW 278 39 N2W 85- 85SW 268 40 N15E 20- 20NW 285 41 N60E 46+ 46SE 150
Rock Slope Stability of the VMT 49
Table 7.6 Discontinuities in the PVR Slope (Continued.) 42 N45W 88+ 88NE 45 43 N80W 88+ 88NE 10 44 N36E 85- 85NW 306 45 N10W 88- 88SW 260 46 N25E 85- 85NW 295 47 N72E 87- 87NW 342 48 N14W 80+ 80NE 76 49 N58E 70+ 70SE 148 50 N30W 80- 80SW 240 51 N48E 55+ 55SE 138 52 N7E 89- 89NW 277 53 N52E 82+ 82SE 142 54 N70E 40+ 40SE 160 55 N64W 62+ 62NE 26
Slope Face Trend= N1W
Face Angle= 77NE Dip Dir= 88 56 N40E 78- 78NW 310 57 N88E 73- 73NW 358 58 N65W 64- 64SW 205 59 N78E 78- 78NW 348 60 N55W 73+ 73NE 35 61 N55W 89+ 89NE 35 62 N10W 68+ 68NE 80 63 N42W 62+ 62NE 48 64 N77W 76+ 76NE 13 65 N72W 72+ 72NE 18 66 N36W 54+ 54NE 54 67 N72W 70+ 70NE 18 68 N62W 68+ 68NE 28 69 N25W 68- 68SW 245 70 N60W 82+ 82NE 30 71 N45E 72+ 72SE 135 72 N88W 82+ 82NE 2 73 N63W 82+ 82NE 27 74 N13W 65+ 65NE 77 75 N89E 60- 60NW 359 76 N64E 74+ 74SE 154 77 N78W 60+ 60NE 12 78 N35E 85+ 85SE 125 79 N89E 65- 65NW 359 80 N80E 72- 72NW 350 81 N80E 72- 72NW 350 82 N14E 50- 50NW 284 83 N10W 62- 62SW 260 84 N83E 60- 60NW 353 85 N38E 74+ 74SE 128 86 N26W 80+ 80NE 64
Rock Slope Stability of the VMT 50
Based on the kinematic analysis shown in Figures 7.15A and 7.15B, and Figures
7.17A and 7.17B, it is anticipated that joint J5 (88/003) and the intersection of joint sets
J3 (80/307) and J4 (73/096) are kinematically unstable with regard to planar and wedge
failures along the slope south of the PVR facilities. It is also anticipated that local
toppling along the south and west sides of the facilities and the local planar and wedge
failures along the slope west of the facilities, can occur for this slope. However, it
appears that toppling is not a major concern due to the lower height of the slope and the
great distance to the facilities.
Rock Slope Stability of the VMT 51
Rock Slope Stability of the VMT 52
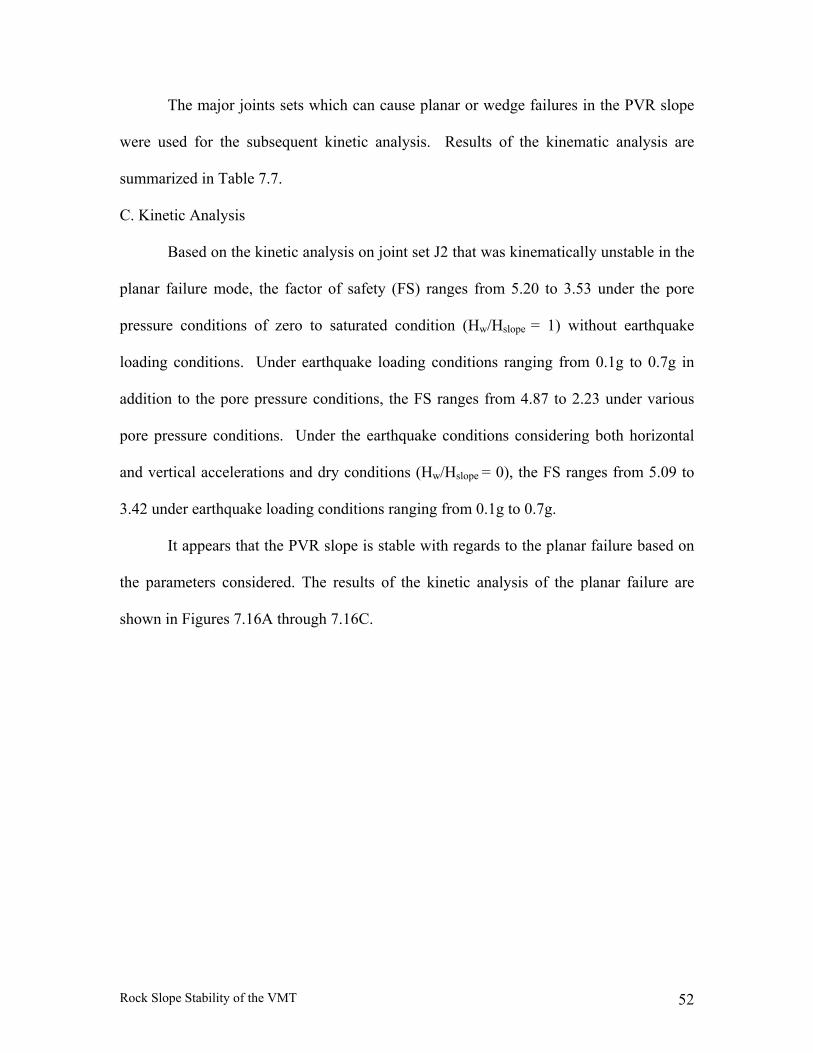
The major joints sets which can cause planar or wedge failures in the PVR slope
were used for the subsequent kinetic analysis. Results of the kinematic analysis are
summarized in Table 7.7.
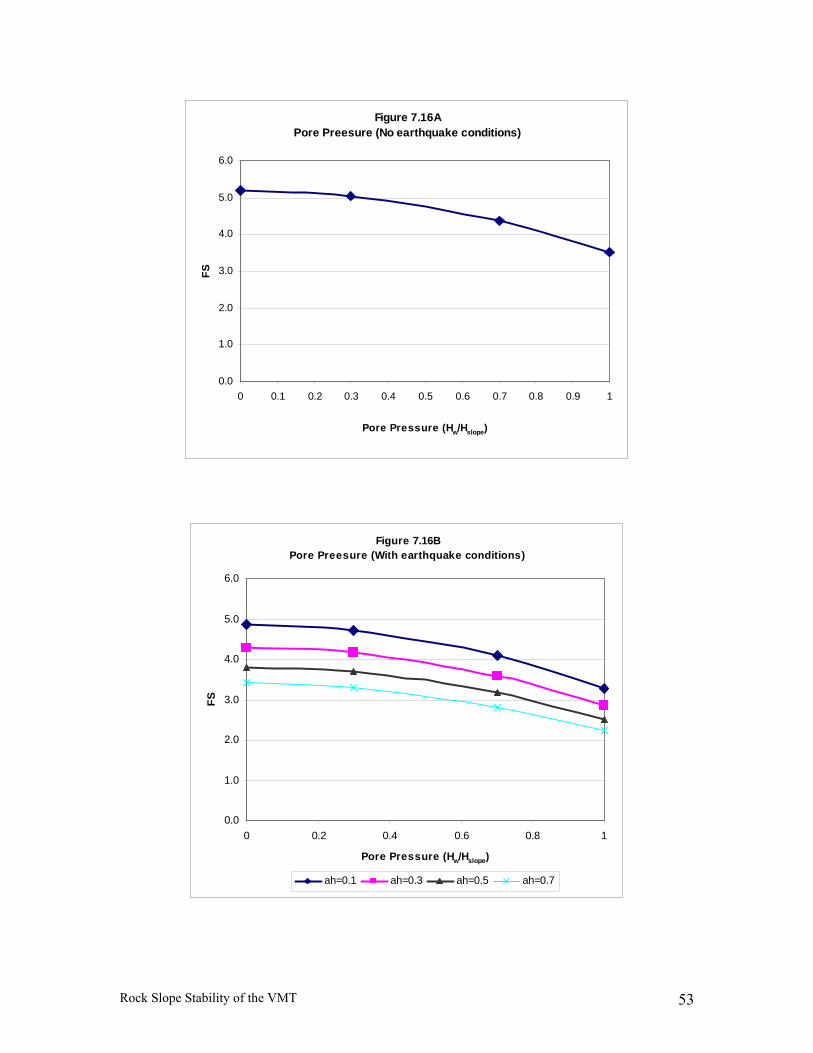
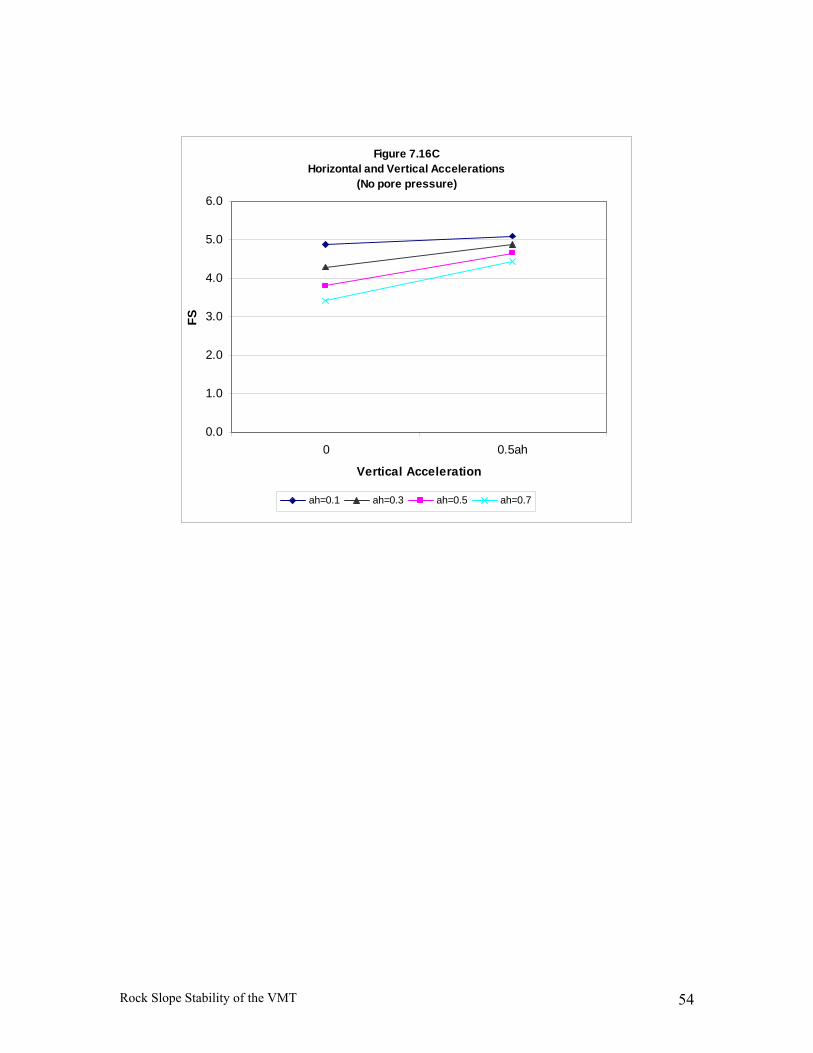
C. Kinetic Analysis
Based on the kinetic analysis on joint set J2 that was kinematically unstable in the
planar failure mode, the factor of safety (FS) ranges from 5.20 to 3.53 under the pore
pressure conditions of zero to saturated condition (Hw/Hslope = 1) without earthquake
loading conditions. Under earthquake loading conditions ranging from 0.1g to 0.7g in
addition to the pore pressure conditions, the FS ranges from 4.87 to 2.23 under various
pore pressure conditions. Under the earthquake conditions considering both horizontal
and vertical accelerations and dry conditions (Hw/Hslope = 0), the FS ranges from 5.09 to
3.42 under earthquake loading conditions ranging from 0.1g to 0.7g.
It appears that the PVR slope is stable with regards to the planar failure based on
the parameters considered. The results of the kinetic analysis of the planar failure are
shown in Figures 7.16A through 7.16C.
Rock Slope Stability of the VMT 53
Figure 7.16APore Preesure (No earthquake conditions)
0.0
1.0
2.0
3.0
4.0
5.0
6.0
0 0.1 0.2 0.3 0.4 0.5 0.6 0.7 0.8 0.9 1
Pore Pressure (Hw/Hslope)
FS
Figure 7.16BPore Preesure (With earthquake conditions)
0.0
1.0
2.0
3.0
4.0
5.0
6.0
0 0.2 0.4 0.6 0.8 1
Pore Pressure (Hw/Hslope)
FS
ah=0.1 ah=0.3 ah=0.5 ah=0.7
Rock Slope Stability of the VMT 54
Figure 7.16C Horizontal and Vertical Accelerations
(No pore pressure)
0.0
1.0
2.0
3.0
4.0
5.0
6.0
0 0.5ah
Vertical Acceleration
FS
ah=0.1 ah=0.3 ah=0.5 ah=0.7

Rock Slope Stability of the VMT 55
Rock Slope Stability of the VMT 56
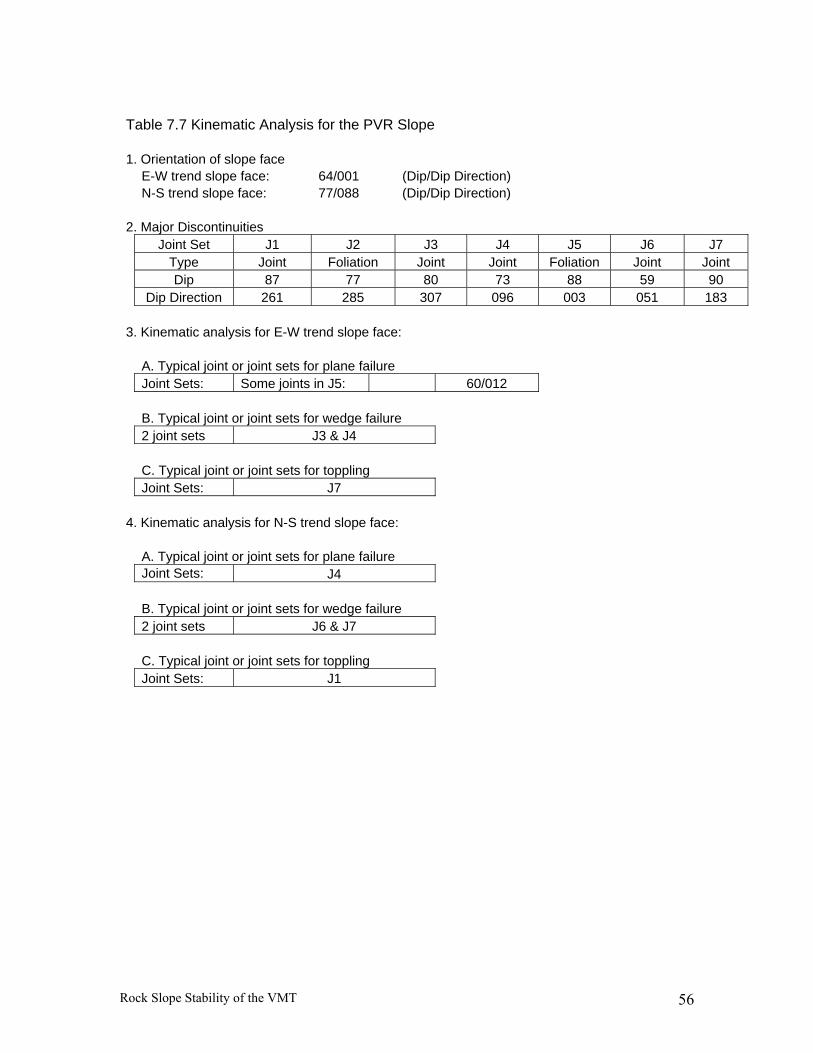
Table 7.7 Kinematic Analysis for the PVR Slope 1. Orientation of slope face E-W trend slope face: 64/001 (Dip/Dip Direction) N-S trend slope face: 77/088 (Dip/Dip Direction) 2. Major Discontinuities Joint Set J1 J2 J3 J4 J5 J6 J7 Type Joint Foliation Joint Joint Foliation Joint Joint Dip 87 77 80 73 88 59 90 Dip Direction 261 285 307 096 003 051 183 3. Kinematic analysis for E-W trend slope face: A. Typical joint or joint sets for plane failure Joint Sets: Some joints in J5: 60/012 B. Typical joint or joint sets for wedge failure 2 joint sets J3 & J4 C. Typical joint or joint sets for toppling Joint Sets: J7 4. Kinematic analysis for N-S trend slope face: A. Typical joint or joint sets for plane failure Joint Sets: J4 B. Typical joint or joint sets for wedge failure 2 joint sets J6 & J7 C. Typical joint or joint sets for toppling Joint Sets: J1
Rock Slope Stability of the VMT 57
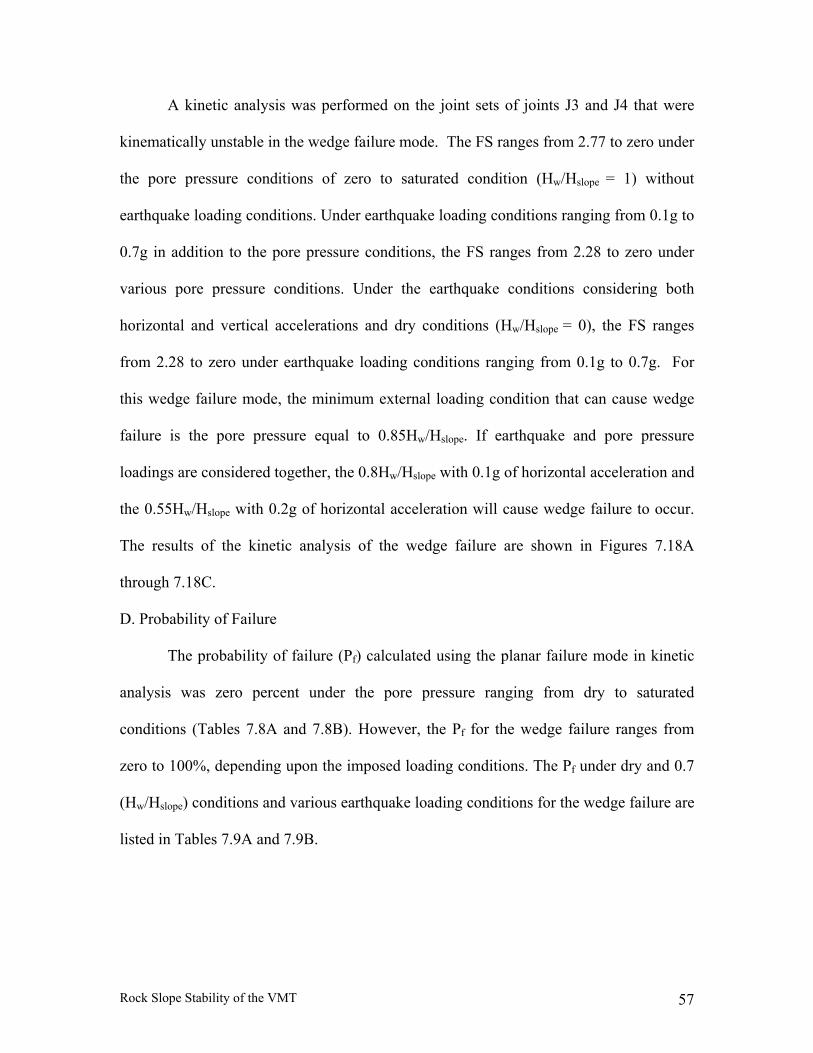
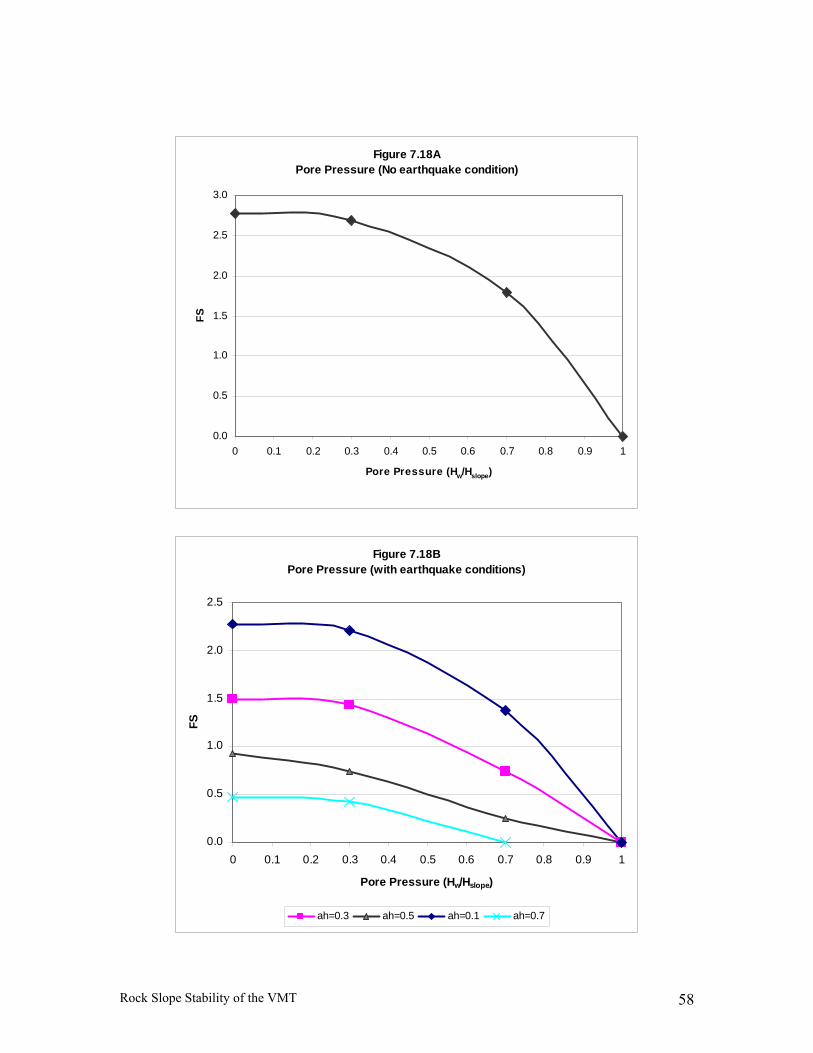
A kinetic analysis was performed on the joint sets of joints J3 and J4 that were
kinematically unstable in the wedge failure mode. The FS ranges from 2.77 to zero under
the pore pressure conditions of zero to saturated condition (Hw/Hslope = 1) without
earthquake loading conditions. Under earthquake loading conditions ranging from 0.1g to
0.7g in addition to the pore pressure conditions, the FS ranges from 2.28 to zero under
various pore pressure conditions. Under the earthquake conditions considering both
horizontal and vertical accelerations and dry conditions (Hw/Hslope = 0), the FS ranges
from 2.28 to zero under earthquake loading conditions ranging from 0.1g to 0.7g. For
this wedge failure mode, the minimum external loading condition that can cause wedge
failure is the pore pressure equal to 0.85Hw/Hslope. If earthquake and pore pressure
loadings are considered together, the 0.8Hw/Hslope with 0.1g of horizontal acceleration and
the 0.55Hw/Hslope with 0.2g of horizontal acceleration will cause wedge failure to occur.
The results of the kinetic analysis of the wedge failure are shown in Figures 7.18A
through 7.18C.
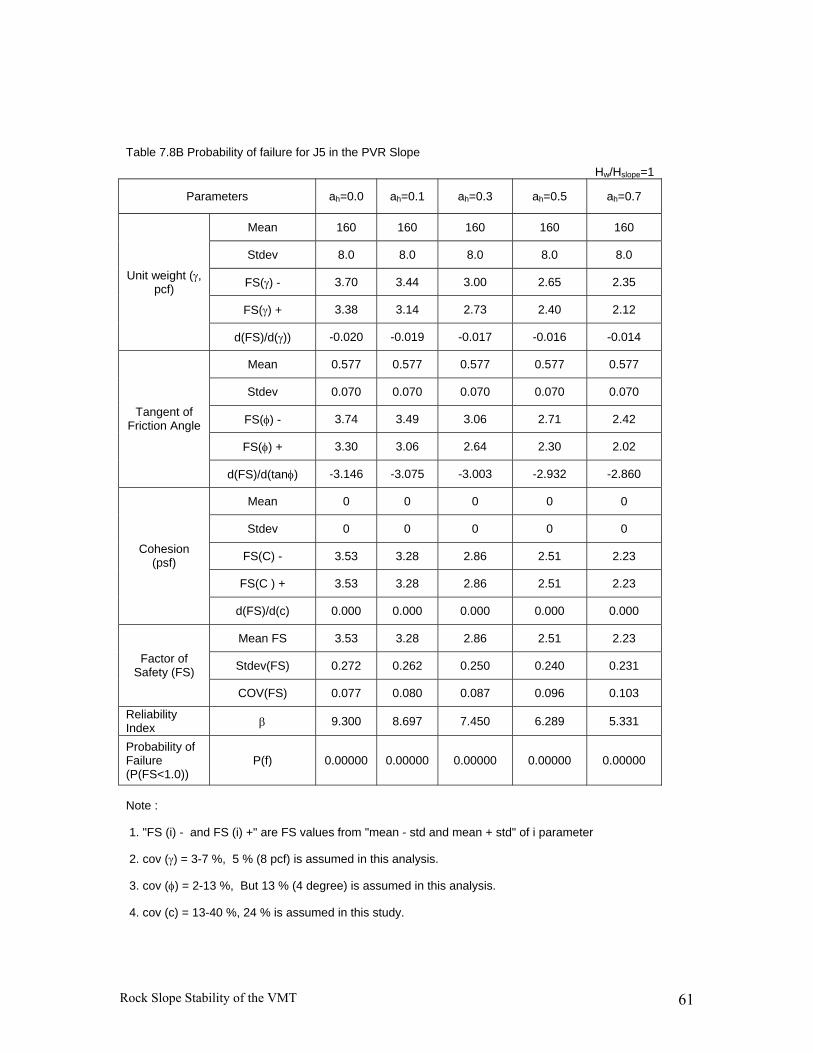
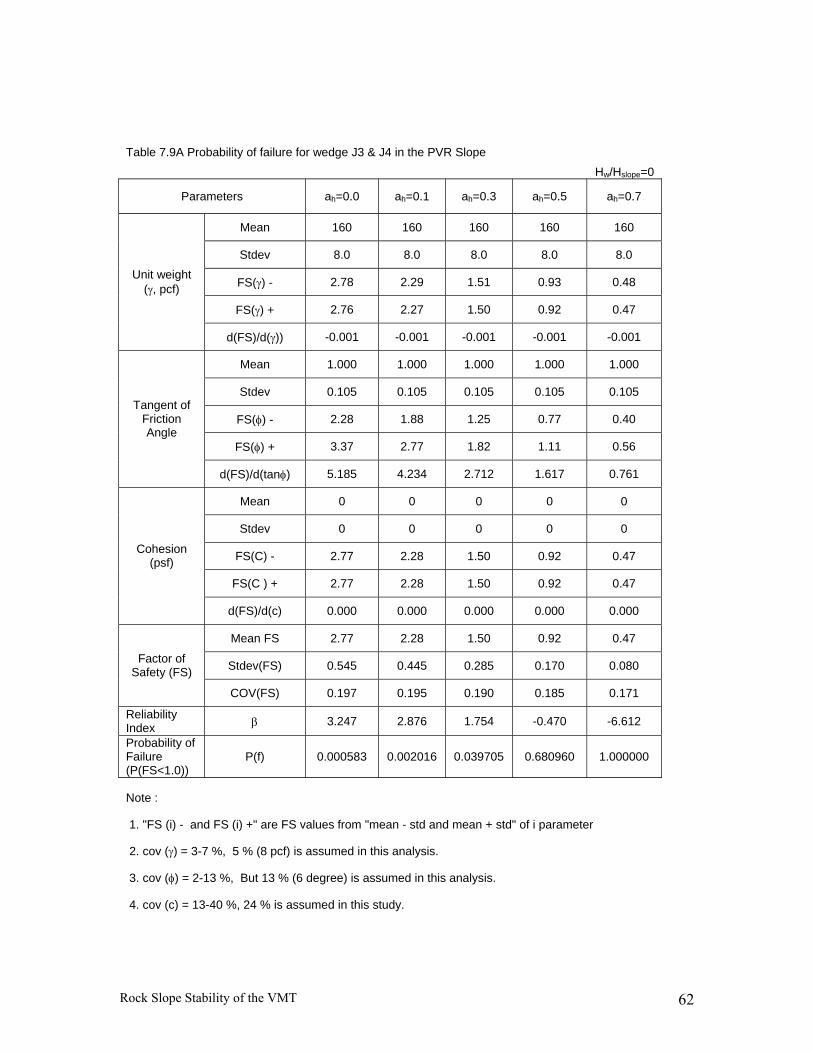
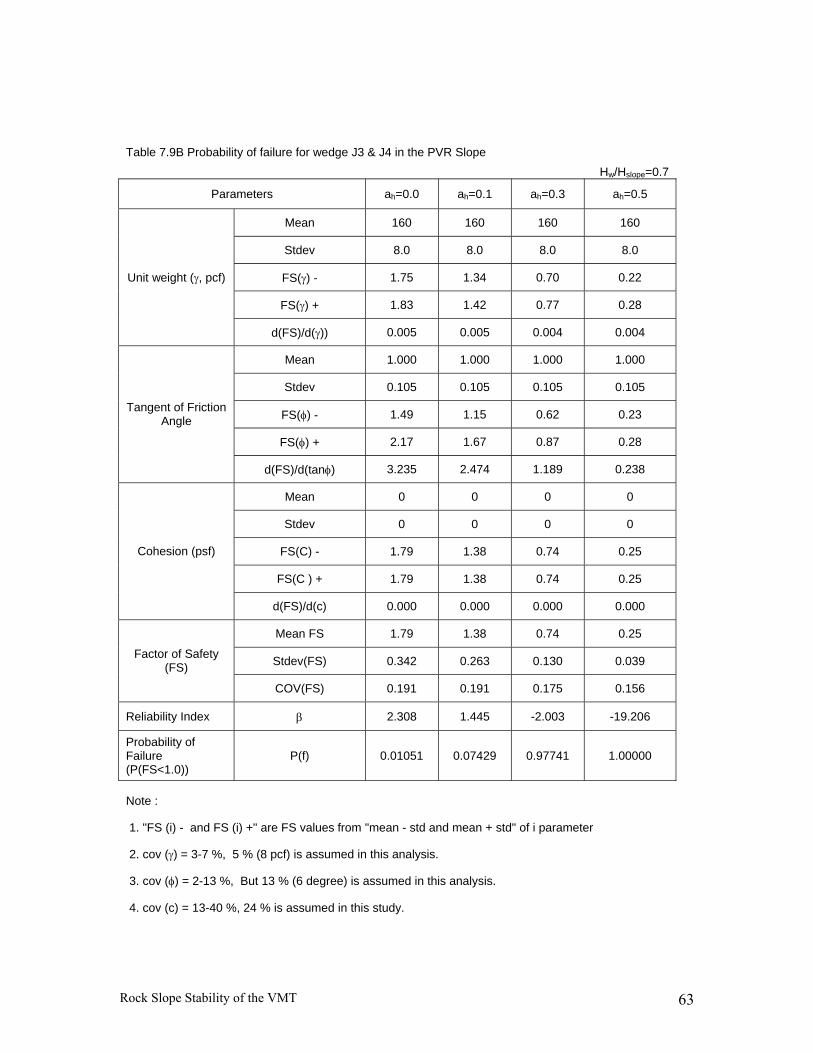
D. Probability of Failure
The probability of failure (Pf) calculated using the planar failure mode in kinetic
analysis was zero percent under the pore pressure ranging from dry to saturated
conditions (Tables 7.8A and 7.8B). However, the Pf for the wedge failure ranges from
zero to 100%, depending upon the imposed loading conditions. The Pf under dry and 0.7
(Hw/Hslope) conditions and various earthquake loading conditions for the wedge failure are
listed in Tables 7.9A and 7.9B.
Rock Slope Stability of the VMT 58
Figure 7.18APore Pressure (No earthquake condition)
0.0
0.5
1.0
1.5
2.0
2.5
3.0
0 0.1 0.2 0.3 0.4 0.5 0.6 0.7 0.8 0.9 1
Pore Pressure (Hw/Hslope)
FS
Figure 7.18BPore Pressure (with earthquake conditions)
0.0
0.5
1.0
1.5
2.0
2.5
0 0.1 0.2 0.3 0.4 0.5 0.6 0.7 0.8 0.9 1
Pore Pressure (Hw/Hslope)
FS
ah=0.3 ah=0.5 ah=0.1 ah=0.7
Rock Slope Stability of the VMT 59
Figure 7.18CHorizontal and Vertical Accelerations
(No pore pressure)
0.00
0.50
1.00
1.50
2.00
2.50
0 0.5ah
Vertical Accelerations
FS
ah=0.1 ah=0.3 ah=0.5 ah=0.7

Rock Slope Stability of the VMT 60
Table 7.8A Probability of failure for J5 in the PVR Slope
Hw/Hslope=0
Parameters ah=0.0 ah=0.1 ah=0.3 ah=0.5 ah=0.7
Mean 160 160 160 160 160
Stdev 8.0 8.0 8.0 8.0 8.0
FS(γ) - 5.46 5.11 4.51 4.01 3.60
FS(γ) + 4.97 4.65 4.09 3.63 3.25
Unit weight (γ, pcf)
d(FS)/d(γ)) -0.031 -0.029 -0.026 -0.024 -0.022
Mean 0.577 0.577 0.577 0.577 0.577
Stdev 0.070 0.070 0.070 0.070 0.070
FS(φ) - 5.15 4.83 4.27 3.81 3.43
FS(φ) + 5.26 4.91 4.31 3.82 3.41
Tangent of Friction Angle
d(FS)/d(tanφ) 0.787 0.572 0.286 0.072 -0.143
Mean 0 0 0 0 0
Stdev 0 0 0 0 0
FS(C) - 5.20 4.87 4.29 3.81 3.42
FS(C ) + 5.20 4.87 4.29 3.81 3.42
Cohesion (psf)
d(FS)/d(c) 0.000 0.000 0.000 0.000 0.000
Mean FS 5.20 4.87 4.29 3.81 3.42
Stdev(FS) 0.251 0.233 0.211 0.190 0.175 Factor of Safety (FS)
COV(FS) 0.048 0.048 0.049 0.050 0.051
Reliability Index β 16.727 16.577 15.596 14.784 13.806
Probability of Failure (P(FS<1.0))
P(f) 0.000000 0.000000 0.000000 0.000000 0.000000
Note :
1. "FS (i) - and FS (i) +" are FS values from "mean - std and mean + std" of i parameter
2. cov (γ) = 3-7 %, 5 % (8 pcf) is assumed in this analysis.
3. cov (φ) = 2-13 %, But 13 % (4 degree) is assumed in this analysis.
4. cov (c) = 13-40 %, 24 % is assumed in this study.
Rock Slope Stability of the VMT 61
Table 7.8B Probability of failure for J5 in the PVR Slope Hw/Hslope=1
Parameters ah=0.0 ah=0.1 ah=0.3 ah=0.5 ah=0.7
Mean 160 160 160 160 160
Stdev 8.0 8.0 8.0 8.0 8.0
FS(γ) - 3.70 3.44 3.00 2.65 2.35
FS(γ) + 3.38 3.14 2.73 2.40 2.12
Unit weight (γ, pcf)
d(FS)/d(γ)) -0.020 -0.019 -0.017 -0.016 -0.014
Mean 0.577 0.577 0.577 0.577 0.577
Stdev 0.070 0.070 0.070 0.070 0.070
FS(φ) - 3.74 3.49 3.06 2.71 2.42
FS(φ) + 3.30 3.06 2.64 2.30 2.02
Tangent of Friction Angle
d(FS)/d(tanφ) -3.146 -3.075 -3.003 -2.932 -2.860
Mean 0 0 0 0 0
Stdev 0 0 0 0 0
FS(C) - 3.53 3.28 2.86 2.51 2.23
FS(C ) + 3.53 3.28 2.86 2.51 2.23
Cohesion (psf)
d(FS)/d(c) 0.000 0.000 0.000 0.000 0.000
Mean FS 3.53 3.28 2.86 2.51 2.23
Stdev(FS) 0.272 0.262 0.250 0.240 0.231 Factor of Safety (FS)
COV(FS) 0.077 0.080 0.087 0.096 0.103
Reliability Index β 9.300 8.697 7.450 6.289 5.331
Probability of Failure (P(FS<1.0))
P(f) 0.00000 0.00000 0.00000 0.00000 0.00000
Note :
1. "FS (i) - and FS (i) +" are FS values from "mean - std and mean + std" of i parameter
2. cov (γ) = 3-7 %, 5 % (8 pcf) is assumed in this analysis.
3. cov (φ) = 2-13 %, But 13 % (4 degree) is assumed in this analysis.
4. cov (c) = 13-40 %, 24 % is assumed in this study.
Rock Slope Stability of the VMT 62
Table 7.9A Probability of failure for wedge J3 & J4 in the PVR Slope Hw/Hslope=0
Parameters ah=0.0 ah=0.1 ah=0.3 ah=0.5 ah=0.7
Mean 160 160 160 160 160
Stdev 8.0 8.0 8.0 8.0 8.0
FS(γ) - 2.78 2.29 1.51 0.93 0.48
FS(γ) + 2.76 2.27 1.50 0.92 0.47
Unit weight (γ, pcf)
d(FS)/d(γ)) -0.001 -0.001 -0.001 -0.001 -0.001
Mean 1.000 1.000 1.000 1.000 1.000
Stdev 0.105 0.105 0.105 0.105 0.105
FS(φ) - 2.28 1.88 1.25 0.77 0.40
FS(φ) + 3.37 2.77 1.82 1.11 0.56
Tangent of Friction Angle
d(FS)/d(tanφ) 5.185 4.234 2.712 1.617 0.761
Mean 0 0 0 0 0
Stdev 0 0 0 0 0
FS(C) - 2.77 2.28 1.50 0.92 0.47
FS(C ) + 2.77 2.28 1.50 0.92 0.47
Cohesion (psf)
d(FS)/d(c) 0.000 0.000 0.000 0.000 0.000
Mean FS 2.77 2.28 1.50 0.92 0.47
Stdev(FS) 0.545 0.445 0.285 0.170 0.080 Factor of Safety (FS)
COV(FS) 0.197 0.195 0.190 0.185 0.171
Reliability Index β 3.247 2.876 1.754 -0.470 -6.612
Probability of Failure (P(FS<1.0))
P(f) 0.000583 0.002016 0.039705 0.680960 1.000000
Note :
1. "FS (i) - and FS (i) +" are FS values from "mean - std and mean + std" of i parameter
2. cov (γ) = 3-7 %, 5 % (8 pcf) is assumed in this analysis.
3. cov (φ) = 2-13 %, But 13 % (6 degree) is assumed in this analysis.
4. cov (c) = 13-40 %, 24 % is assumed in this study.
Rock Slope Stability of the VMT 63
Table 7.9B Probability of failure for wedge J3 & J4 in the PVR Slope Hw/Hslope=0.7
Parameters ah=0.0 ah=0.1 ah=0.3 ah=0.5
Mean 160 160 160 160
Stdev 8.0 8.0 8.0 8.0
FS(γ) - 1.75 1.34 0.70 0.22
FS(γ) + 1.83 1.42 0.77 0.28
Unit weight (γ, pcf)
d(FS)/d(γ)) 0.005 0.005 0.004 0.004
Mean 1.000 1.000 1.000 1.000
Stdev 0.105 0.105 0.105 0.105
FS(φ) - 1.49 1.15 0.62 0.23
FS(φ) + 2.17 1.67 0.87 0.28
Tangent of Friction Angle
d(FS)/d(tanφ) 3.235 2.474 1.189 0.238
Mean 0 0 0 0
Stdev 0 0 0 0
FS(C) - 1.79 1.38 0.74 0.25
FS(C ) + 1.79 1.38 0.74 0.25
Cohesion (psf)
d(FS)/d(c) 0.000 0.000 0.000 0.000
Mean FS 1.79 1.38 0.74 0.25
Stdev(FS) 0.342 0.263 0.130 0.039 Factor of Safety (FS)
COV(FS) 0.191 0.191 0.175 0.156
Reliability Index β 2.308 1.445 -2.003 -19.206
Probability of Failure (P(FS<1.0))
P(f) 0.01051 0.07429 0.97741 1.00000
Note :
1. "FS (i) - and FS (i) +" are FS values from "mean - std and mean + std" of i parameter
2. cov (γ) = 3-7 %, 5 % (8 pcf) is assumed in this analysis.
3. cov (φ) = 2-13 %, But 13 % (6 degree) is assumed in this analysis.
4. cov (c) = 13-40 %, 24 % is assumed in this study.

Rock Slope Stability of the VMT 64
7-2-4. West Manifold Slope
A. Site Observations
The West Manifold Building slope is located immediately on the south and west
sides of the West Manifold Building. The slope consists of both phyllite and greenstone.
Based upon available information (Bukovansky, 1990), a portion of the slope failed
during construction so that stabilizing measures had to be implemented. These included
rock bolting, dewatering, shotcrete placement, and buttress construction at the toe.
The WM slope was excavated in a series of cuts and most discontinuity
measurements at this time were performed on the bench above the first cut slope. Based
on the topographic map provided, the height of the second slope that we investigated has
an approximate range from 40 feet to 60 feet plus a small bench above the third slope.
The slope continues to the West Farm Tank Area.
The major discontinuities are foliations and joints. It appears that the exposed
rocks are relatively stronger than other slopes in VMT. Rock bolts were installed in the
first slope, but the slope we investigated was not rock-bolted.
During the site visit, it was observed that various sizes of the rock fragments had
fallen loose to accumulate along the ditch. Individual fragments measured less than one
foot diameter.
B. Kinematic Analysis
The major discontinuities measured in this slope are listed in Table 7.10 and the
pole plot of these data is illustrated in Figure 7.19. Based on the kinematic analysis
shown in Figures 7.20A through 7.20D, wedge failure is more prevalent than the planar
failure and toppling at the slope located south of the West Manifold building.

Rock Slope Stability of the VMT 65
However, it appears that the slope located west of the West Manifold building is
kinematically stable.
Major joint sets of J1 (64/103) and J2 (63/008) which may cause wedge failures in
the WM slope located south of the WM building were considered for the subsequent
kinetic analysis. Results of the kinematic analysis are summarized in Table 7.11.
C. Kinetic Analysis
It appears that the slope is stable under current conditions at the time of our field
investigations except for local sloughing of small rock fragments. Based on back
calculations using the current slope conditions, the 45 and 60 degrees of internal friction
angles of foliation and joints, respectively, were used for the slope stabilization analysis.
The factor of safety (FS) for the potential wedge failure ranges from 0.0 to 1.33 under
different pore pressure conditions ranging from saturated conditions (Hw/Hslope = 1) to dry
conditions (Hw/Hslope = 0) without any earthquake loading. Under earthquake loading
conditions ranging from 0.1g to 0.5g in addition to the pore pressure conditions, the FS
ranges from 1.07 to zero. When vertical acceleration (0.5ah) was imposed in addition to
the horizontal accelerations, the FS reduced significantly as shown in Figure 7.21C. For
this wedge failure mode, the minimum external loading condition that causes a wedge
failure is a pore pressure equal to 0.35Hw/Hslope. If both earthquake and pore pressure
loadings are considered, the 0.15Hw/Hslope with 0.1g of horizontal acceleration will cause
a wedge failure. The results of the kinetic analysis of the wedge failure are shown in
Figures 7.21A through 7.21C.
Therefore, it appears that the WM Slope investigated is likely to fail, depending
upon the imposed conditions on the slope. Based on this, it should be anticipated that a
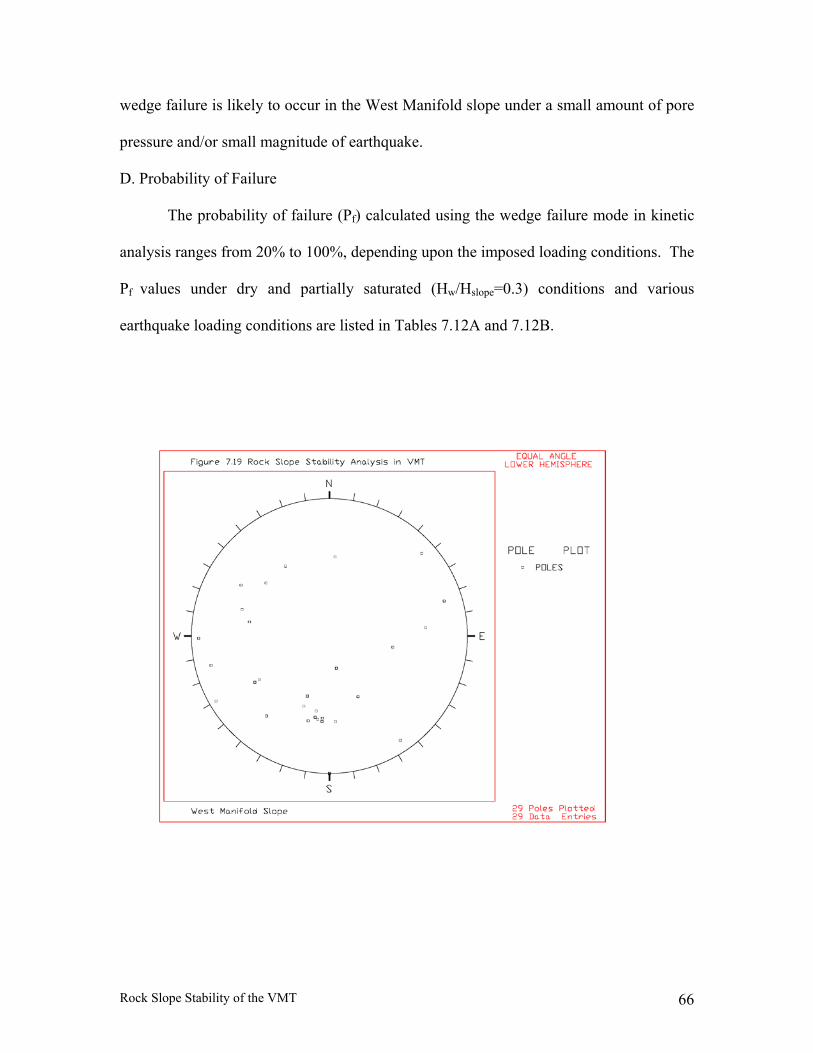
Rock Slope Stability of the VMT 66
wedge failure is likely to occur in the West Manifold slope under a small amount of pore
pressure and/or small magnitude of earthquake.
D. Probability of Failure
The probability of failure (Pf) calculated using the wedge failure mode in kinetic
analysis ranges from 20% to 100%, depending upon the imposed loading conditions. The
Pf values under dry and partially saturated (Hw/Hslope=0.3) conditions and various
earthquake loading conditions are listed in Tables 7.12A and 7.12B.
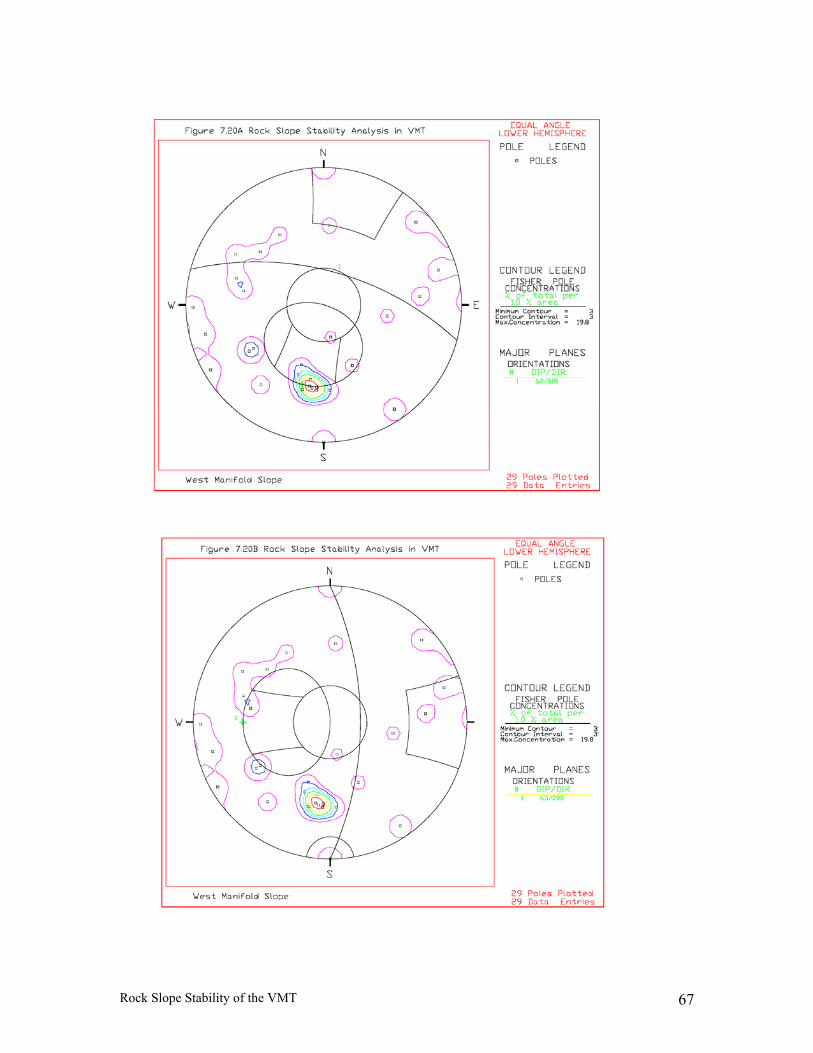
Rock Slope Stability of the VMT 67
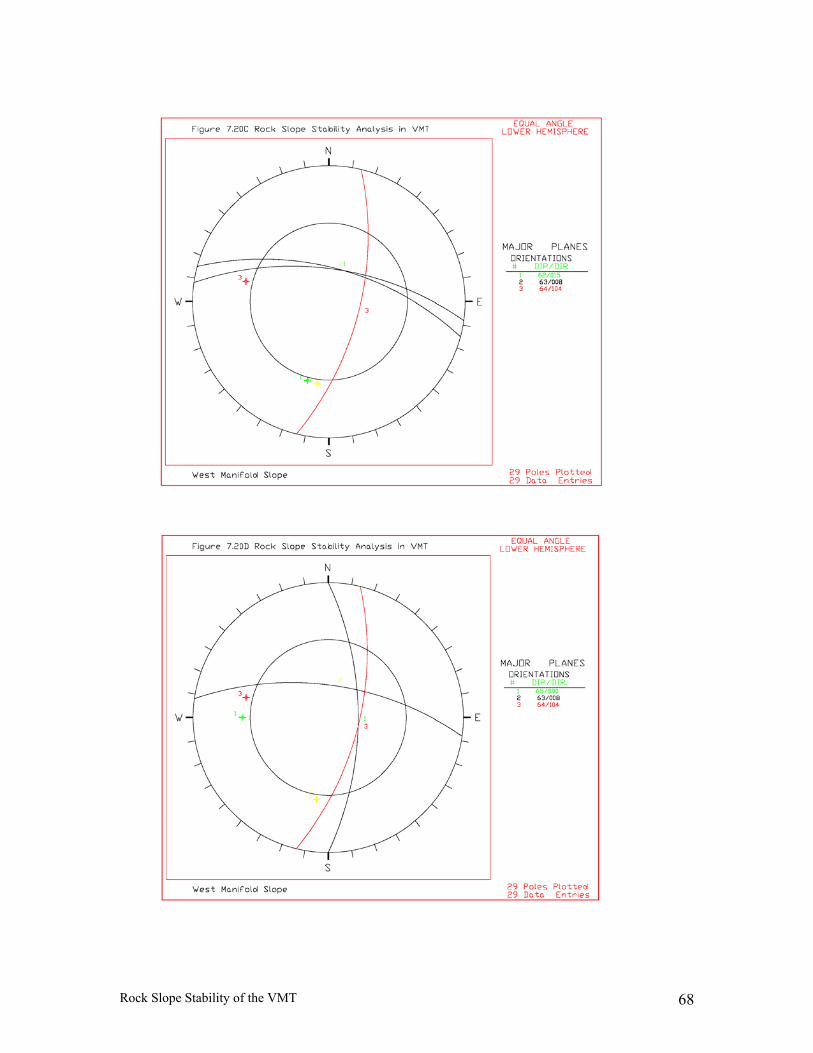
Rock Slope Stability of the VMT 68
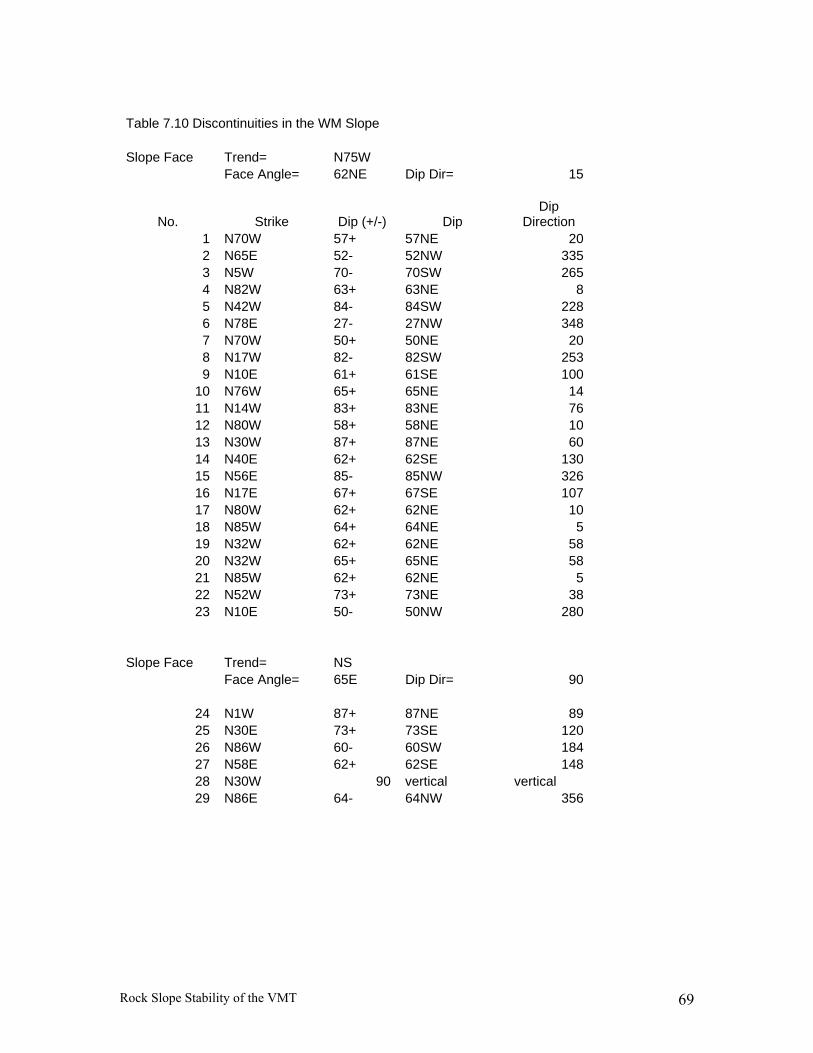
Rock Slope Stability of the VMT 69
Table 7.10 Discontinuities in the WM Slope Slope Face Trend= N75W Face Angle= 62NE Dip Dir= 15
No. Strike Dip (+/-) Dip Dip
Direction 1 N70W 57+ 57NE 20 2 N65E 52- 52NW 335 3 N5W 70- 70SW 265 4 N82W 63+ 63NE 8 5 N42W 84- 84SW 228 6 N78E 27- 27NW 348 7 N70W 50+ 50NE 20 8 N17W 82- 82SW 253 9 N10E 61+ 61SE 100
10 N76W 65+ 65NE 14 11 N14W 83+ 83NE 76 12 N80W 58+ 58NE 10 13 N30W 87+ 87NE 60 14 N40E 62+ 62SE 130 15 N56E 85- 85NW 326 16 N17E 67+ 67SE 107 17 N80W 62+ 62NE 10 18 N85W 64+ 64NE 5 19 N32W 62+ 62NE 58 20 N32W 65+ 65NE 58 21 N85W 62+ 62NE 5 22 N52W 73+ 73NE 38 23 N10E 50- 50NW 280
Slope Face Trend= NS Face Angle= 65E Dip Dir= 90
24 N1W 87+ 87NE 89 25 N30E 73+ 73SE 120 26 N86W 60- 60SW 184 27 N58E 62+ 62SE 148 28 N30W 90 vertical vertical 29 N86E 64- 64NW 356
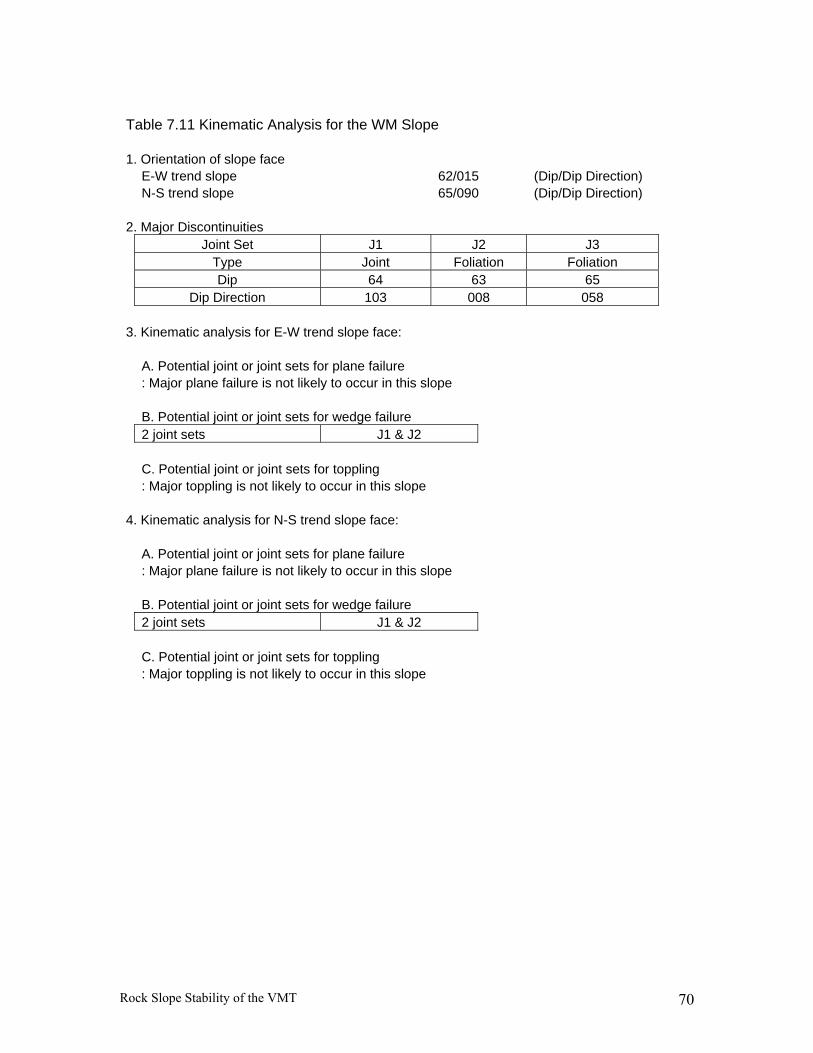
Rock Slope Stability of the VMT 70
Table 7.11 Kinematic Analysis for the WM Slope 1. Orientation of slope face E-W trend slope 62/015 (Dip/Dip Direction) N-S trend slope 65/090 (Dip/Dip Direction) 2. Major Discontinuities Joint Set J1 J2 J3 Type Joint Foliation Foliation Dip 64 63 65 Dip Direction 103 008 058 3. Kinematic analysis for E-W trend slope face: A. Potential joint or joint sets for plane failure : Major plane failure is not likely to occur in this slope B. Potential joint or joint sets for wedge failure 2 joint sets J1 & J2 C. Potential joint or joint sets for toppling : Major toppling is not likely to occur in this slope 4. Kinematic analysis for N-S trend slope face: A. Potential joint or joint sets for plane failure : Major plane failure is not likely to occur in this slope B. Potential joint or joint sets for wedge failure 2 joint sets J1 & J2 C. Potential joint or joint sets for toppling : Major toppling is not likely to occur in this slope
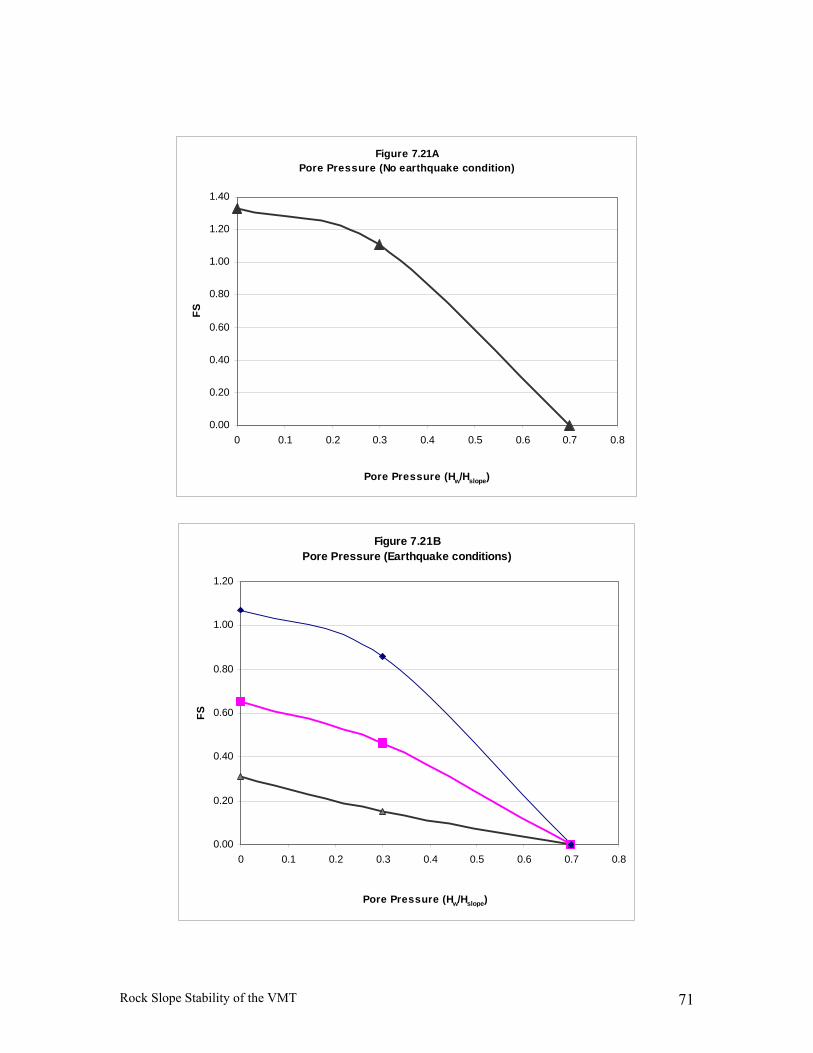
Rock Slope Stability of the VMT 71
Figure 7.21APore Pressure (No earthquake condition)
0.00
0.20
0.40
0.60
0.80
1.00
1.20
1.40
0 0.1 0.2 0.3 0.4 0.5 0.6 0.7 0.8
Pore Pressure (Hw/Hslope)
FS
Figure 7.21BPore Pressure (Earthquake conditions)
0.00
0.20
0.40
0.60
0.80
1.00
1.20
0 0.1 0.2 0.3 0.4 0.5 0.6 0.7 0.8
Pore Pressure (Hw/Hslope)
FS
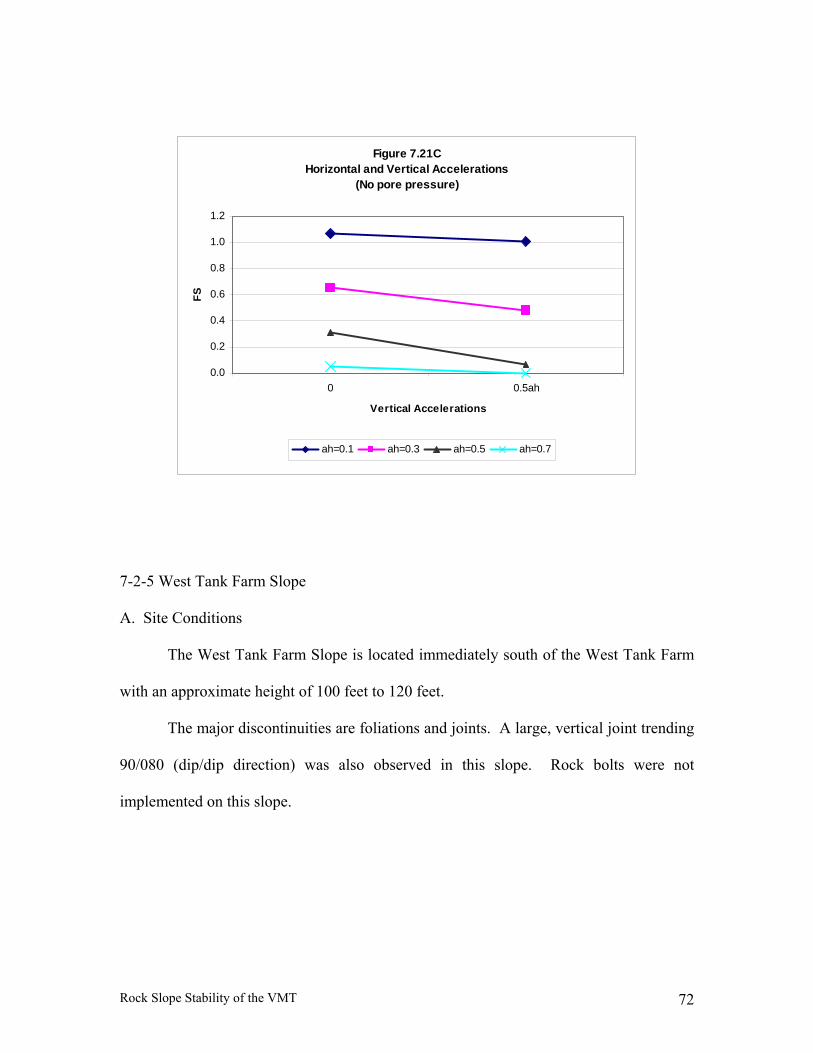
Rock Slope Stability of the VMT 72
Figure 7.21CHorizontal and Vertical Accelerations
(No pore pressure)
0.0
0.2
0.4
0.6
0.8
1.0
1.2
0 0.5ah
Vertical Accelerations
FS
ah=0.1 ah=0.3 ah=0.5 ah=0.7
7-2-5 West Tank Farm Slope
A. Site Conditions
The West Tank Farm Slope is located immediately south of the West Tank Farm
with an approximate height of 100 feet to 120 feet.
The major discontinuities are foliations and joints. A large, vertical joint trending
90/080 (dip/dip direction) was also observed in this slope. Rock bolts were not
implemented on this slope.
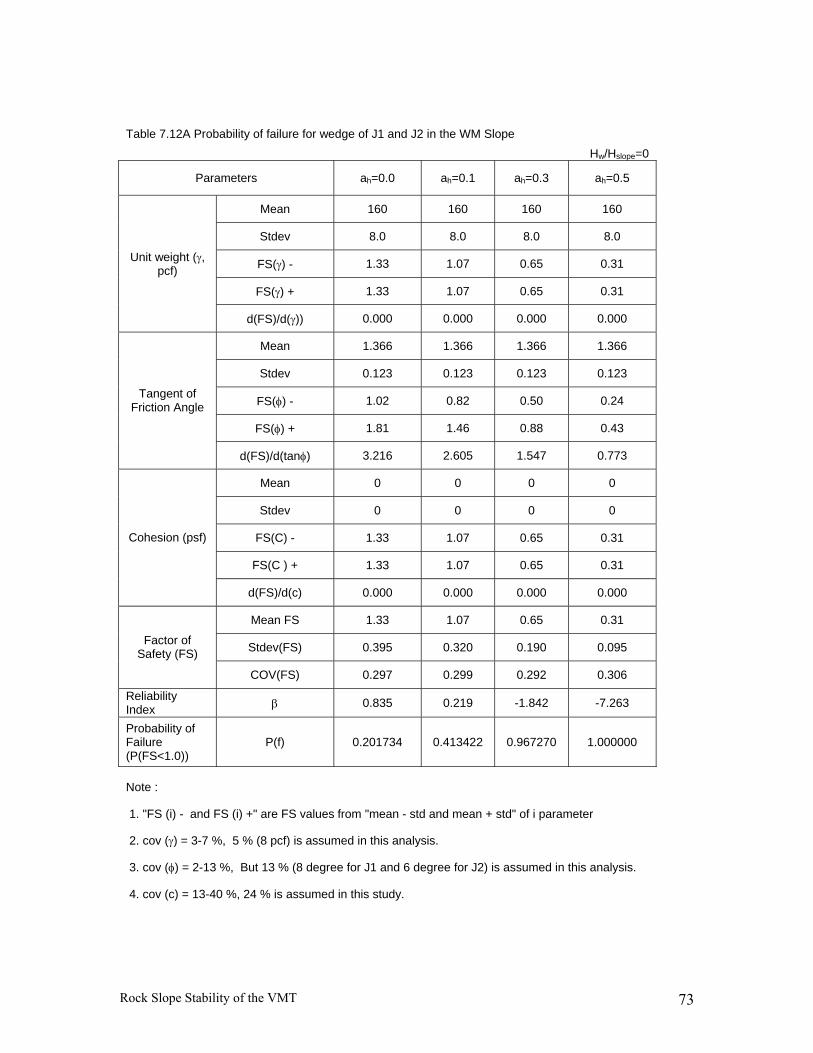
Rock Slope Stability of the VMT 73
Table 7.12A Probability of failure for wedge of J1 and J2 in the WM Slope Hw/Hslope=0
Parameters ah=0.0 ah=0.1 ah=0.3 ah=0.5
Mean 160 160 160 160
Stdev 8.0 8.0 8.0 8.0
FS(γ) - 1.33 1.07 0.65 0.31
FS(γ) + 1.33 1.07 0.65 0.31
Unit weight (γ, pcf)
d(FS)/d(γ)) 0.000 0.000 0.000 0.000
Mean 1.366 1.366 1.366 1.366
Stdev 0.123 0.123 0.123 0.123
FS(φ) - 1.02 0.82 0.50 0.24
FS(φ) + 1.81 1.46 0.88 0.43
Tangent of Friction Angle
d(FS)/d(tanφ) 3.216 2.605 1.547 0.773
Mean 0 0 0 0
Stdev 0 0 0 0
FS(C) - 1.33 1.07 0.65 0.31
FS(C ) + 1.33 1.07 0.65 0.31
Cohesion (psf)
d(FS)/d(c) 0.000 0.000 0.000 0.000
Mean FS 1.33 1.07 0.65 0.31
Stdev(FS) 0.395 0.320 0.190 0.095 Factor of Safety (FS)
COV(FS) 0.297 0.299 0.292 0.306
Reliability Index β 0.835 0.219 -1.842 -7.263
Probability of Failure (P(FS<1.0))
P(f) 0.201734 0.413422 0.967270 1.000000
Note :
1. "FS (i) - and FS (i) +" are FS values from "mean - std and mean + std" of i parameter
2. cov (γ) = 3-7 %, 5 % (8 pcf) is assumed in this analysis.
3. cov (φ) = 2-13 %, But 13 % (8 degree for J1 and 6 degree for J2) is assumed in this analysis.
4. cov (c) = 13-40 %, 24 % is assumed in this study.

Rock Slope Stability of the VMT 74
Table 7.12B Probability of failure for wedge of J1 and J2 in the WM Slope Hw/Hslope=0.3
Parameters ah=0.0 ah=0.1 ah=0.3 ah=0.5
Mean 160 160 160 160
Stdev 8.0 8.0 8.0 8.0
FS(γ) - 1.09 0.85 0.45 0.14
FS(γ) + 1.12 0.87 0.47 0.16
Unit weight (γ, pcf)
d(FS)/d(γ)) 0.002 0.001 0.001 0.001
Mean 1.366 1.366 1.366 1.366
Stdev 0.123 0.123 0.123 0.123
FS(φ) - 0.84 0.65 0.35 0.11
FS(φ) + 1.52 1.19 0.64 0.22
Tangent of Friction Angle
d(FS)/d(tanφ) 2.768 2.198 1.181 0.448
Mean 0 0 0 0
Stdev 0 0 0 0
FS(C) - 1.11 0.86 0.46 0.15
FS(C ) + 1.11 0.86 0.46 0.15
Cohesion (psf)
d(FS)/d(c) 0.000 0.000 0.000 0.000
Mean FS 1.11 0.86 0.46 0.15
Stdev(FS) 0.340 0.270 0.145 0.056 Factor of Safety (FS)
COV(FS) 0.307 0.314 0.316 0.373
Reliability Index β 0.323 -0.518 -3.715 -15.205
Probability of Failure (P(FS<1.0))
P(f) 0.37327 0.69783 0.99990 1.00000
Note :
1. "FS (i) - and FS (i) +" are FS values from "mean - std and mean + std" of i parameter
2. cov (γ) = 3-7 %, 5 % (8 pcf) is assumed in this analysis.
3. cov (φ) = 2-13 %, But 13 % (8 degree for J1 and 6 degree for J2) is assumed in this analysis.
4. cov (c) = 13-40 %, 24 % is assumed in this study.
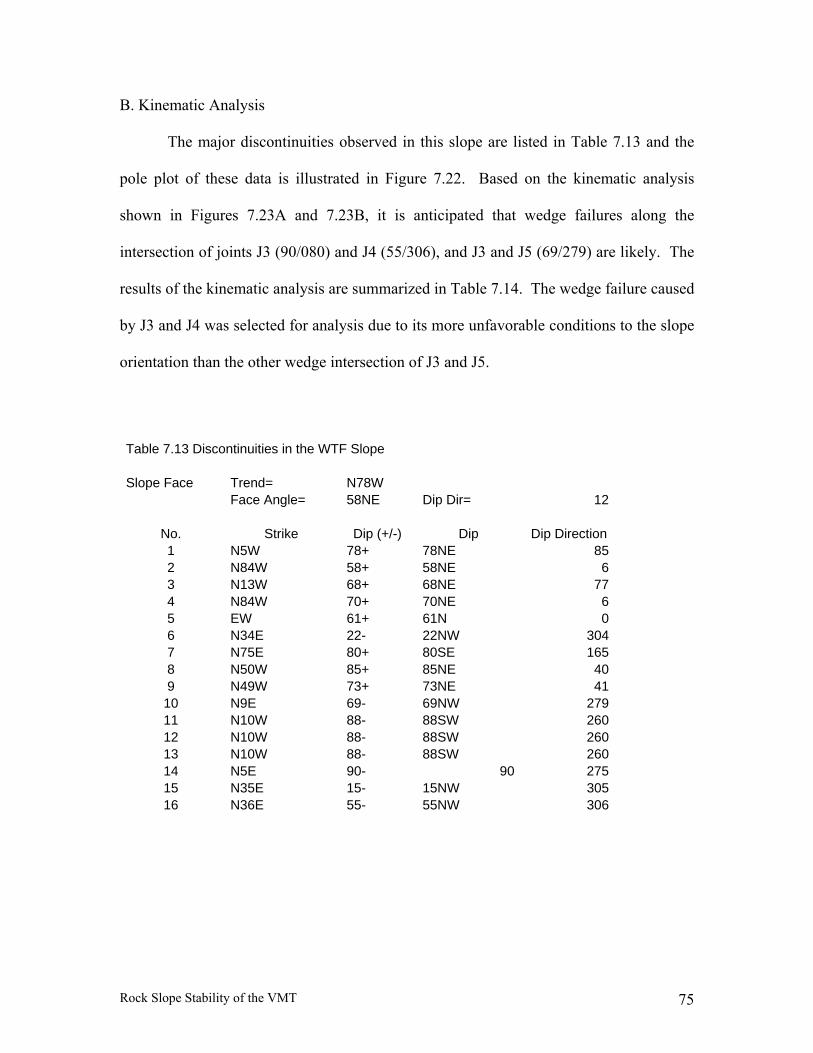
Rock Slope Stability of the VMT 75
B. Kinematic Analysis
The major discontinuities observed in this slope are listed in Table 7.13 and the
pole plot of these data is illustrated in Figure 7.22. Based on the kinematic analysis
shown in Figures 7.23A and 7.23B, it is anticipated that wedge failures along the
intersection of joints J3 (90/080) and J4 (55/306), and J3 and J5 (69/279) are likely. The
results of the kinematic analysis are summarized in Table 7.14. The wedge failure caused
by J3 and J4 was selected for analysis due to its more unfavorable conditions to the slope
orientation than the other wedge intersection of J3 and J5.
Table 7.13 Discontinuities in the WTF Slope Slope Face Trend= N78W Face Angle= 58NE Dip Dir= 12
No. Strike Dip (+/-) Dip Dip Direction 1 N5W 78+ 78NE 85 2 N84W 58+ 58NE 6 3 N13W 68+ 68NE 77 4 N84W 70+ 70NE 6 5 EW 61+ 61N 0 6 N34E 22- 22NW 304 7 N75E 80+ 80SE 165 8 N50W 85+ 85NE 40 9 N49W 73+ 73NE 41
10 N9E 69- 69NW 279 11 N10W 88- 88SW 260 12 N10W 88- 88SW 260 13 N10W 88- 88SW 260 14 N5E 90- 90 275 15 N35E 15- 15NW 305 16 N36E 55- 55NW 306
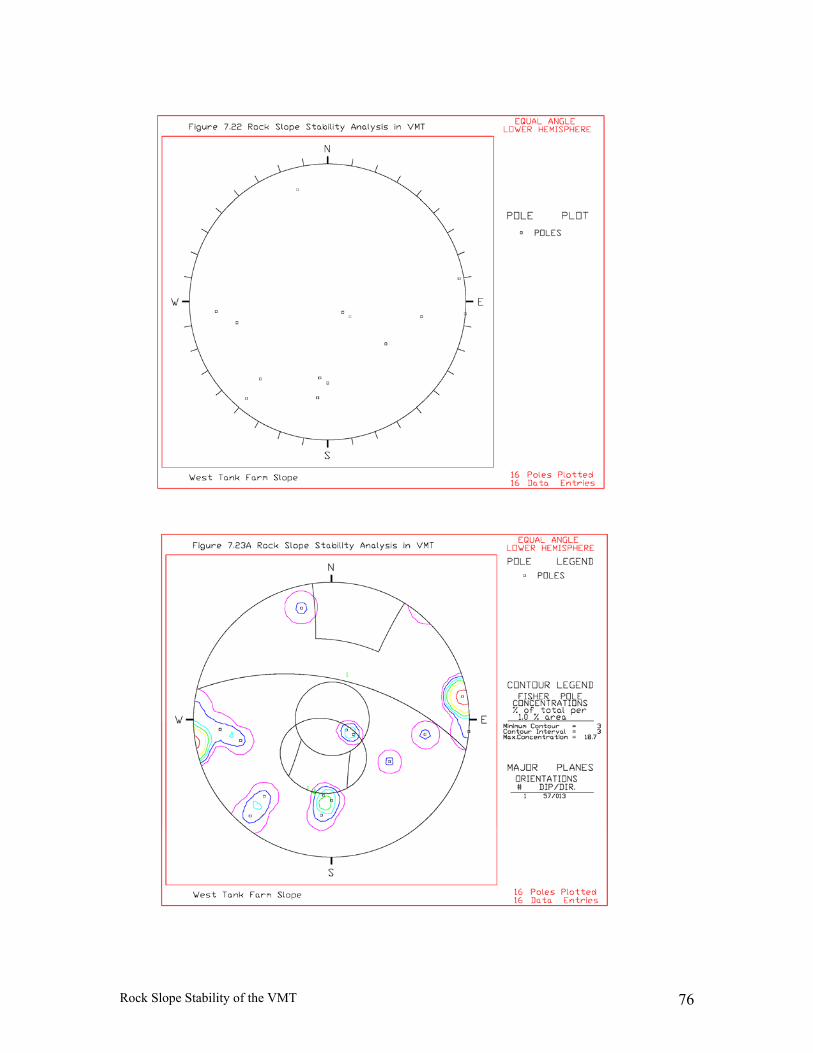
Rock Slope Stability of the VMT 76
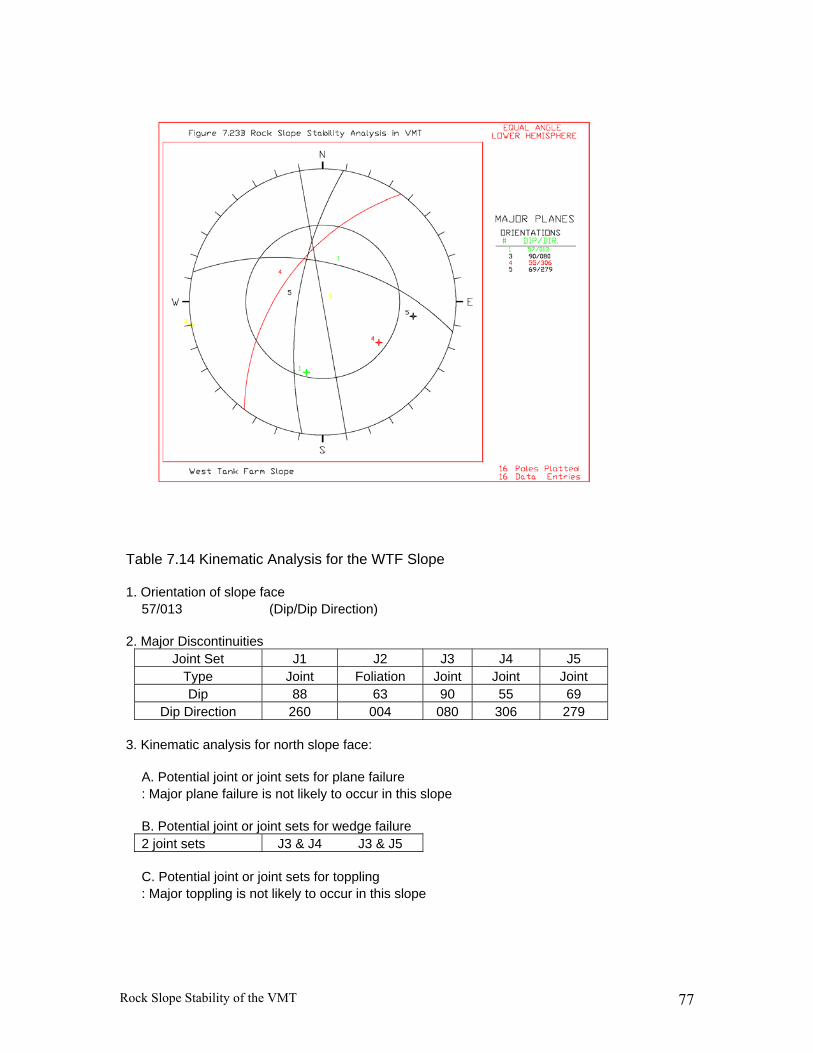
Rock Slope Stability of the VMT 77
Table 7.14 Kinematic Analysis for the WTF Slope 1. Orientation of slope face 57/013 (Dip/Dip Direction) 2. Major Discontinuities Joint Set J1 J2 J3 J4 J5 Type Joint Foliation Joint Joint Joint Dip 88 63 90 55 69 Dip Direction 260 004 080 306 279 3. Kinematic analysis for north slope face: A. Potential joint or joint sets for plane failure : Major plane failure is not likely to occur in this slope B. Potential joint or joint sets for wedge failure 2 joint sets J3 & J4 J3 & J5 C. Potential joint or joint sets for toppling : Major toppling is not likely to occur in this slope
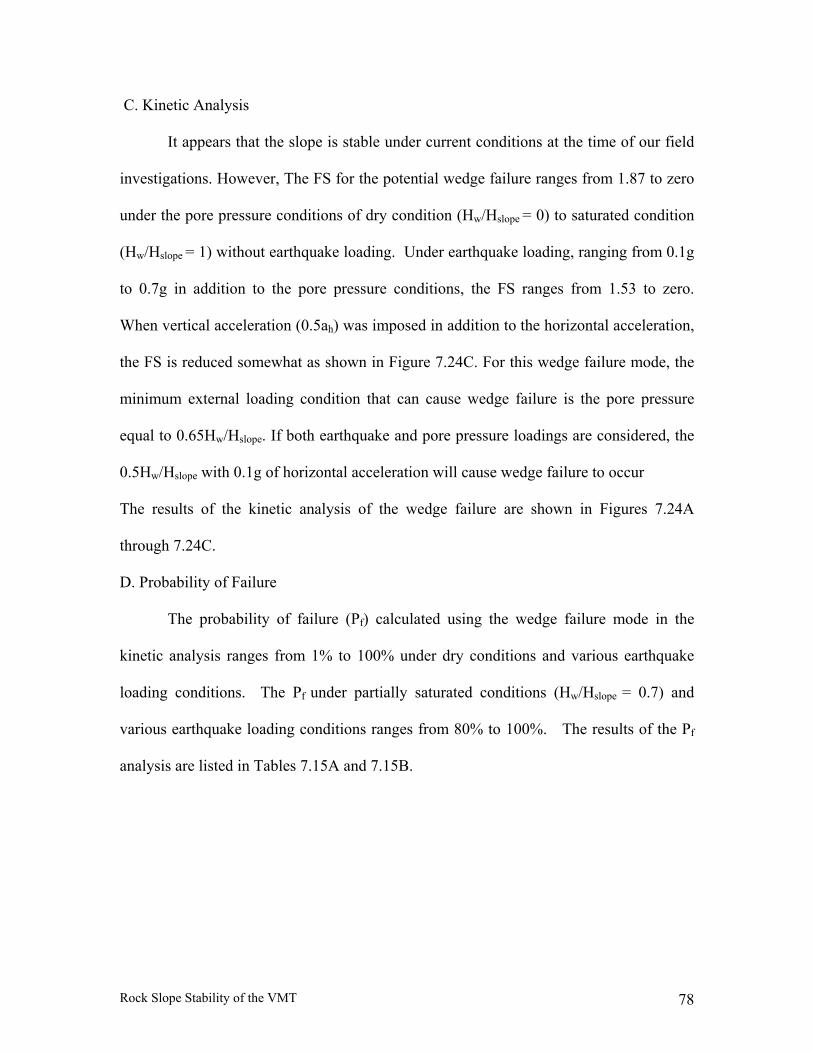
Rock Slope Stability of the VMT 78
C. Kinetic Analysis
It appears that the slope is stable under current conditions at the time of our field
investigations. However, The FS for the potential wedge failure ranges from 1.87 to zero
under the pore pressure conditions of dry condition (Hw/Hslope = 0) to saturated condition
(Hw/Hslope = 1) without earthquake loading. Under earthquake loading, ranging from 0.1g
to 0.7g in addition to the pore pressure conditions, the FS ranges from 1.53 to zero.
When vertical acceleration (0.5ah) was imposed in addition to the horizontal acceleration,
the FS is reduced somewhat as shown in Figure 7.24C. For this wedge failure mode, the
minimum external loading condition that can cause wedge failure is the pore pressure
equal to 0.65Hw/Hslope. If both earthquake and pore pressure loadings are considered, the
0.5Hw/Hslope with 0.1g of horizontal acceleration will cause wedge failure to occur
The results of the kinetic analysis of the wedge failure are shown in Figures 7.24A
through 7.24C.
D. Probability of Failure
The probability of failure (Pf) calculated using the wedge failure mode in the
kinetic analysis ranges from 1% to 100% under dry conditions and various earthquake
loading conditions. The Pf under partially saturated conditions (Hw/Hslope = 0.7) and
various earthquake loading conditions ranges from 80% to 100%. The results of the Pf
analysis are listed in Tables 7.15A and 7.15B.

Rock Slope Stability of the VMT 79
Figure 7.24APore Pressure (No earthquake condition)
0.00
0.20
0.40
0.60
0.80
1.00
1.20
1.40
1.60
1.80
2.00
0 0.1 0.2 0.3 0.4 0.5 0.6 0.7 0.8 0.9 1
Pore Pressure (Hw/Hslope)
FS
Figure 7.24BPore Pressure (With earthquake conditions)
0.00
0.20
0.40
0.60
0.80
1.00
1.20
1.40
1.60
1.80
0 0.1 0.2 0.3 0.4 0.5 0.6 0.7 0.8 0.9 1
Pore Pressure (Hw/Hslope)
FS
ah=0.3 ah=0.5 ah=0.1 ah=0.7
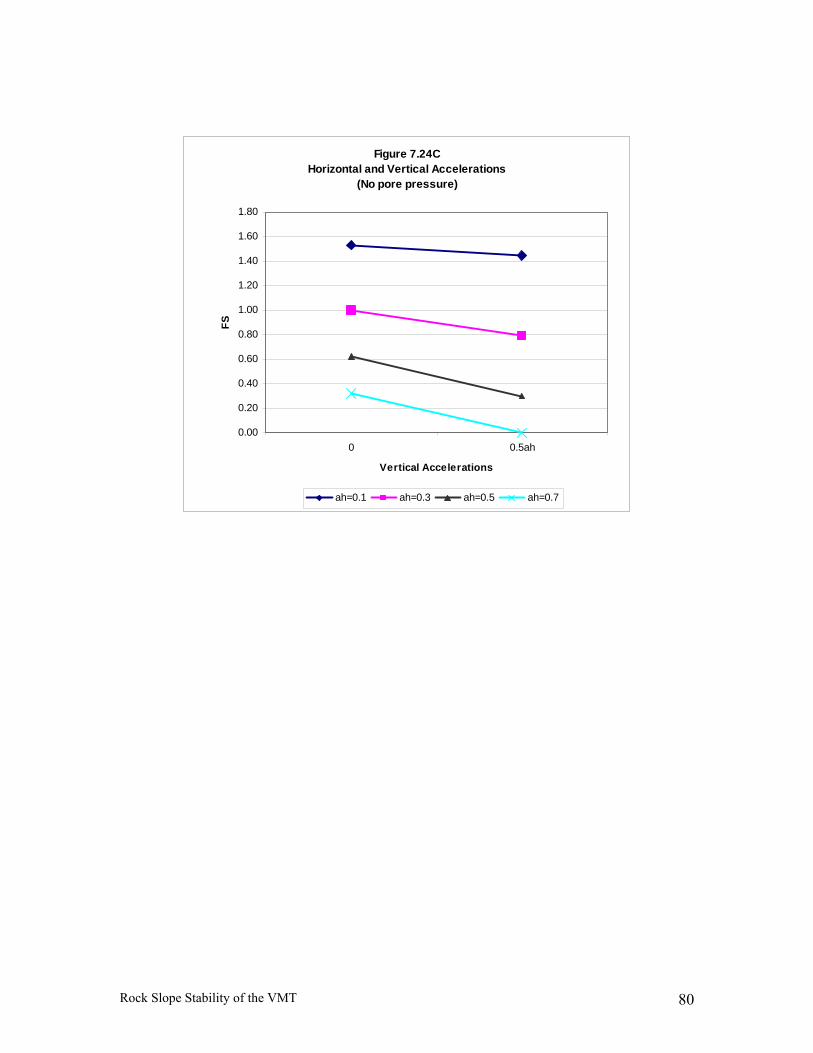
Rock Slope Stability of the VMT 80
Figure 7.24CHorizontal and Vertical Accelerations
(No pore pressure)
0.00
0.20
0.40
0.60
0.80
1.00
1.20
1.40
1.60
1.80
0 0.5ah
Vertical Accelerations
FS
ah=0.1 ah=0.3 ah=0.5 ah=0.7
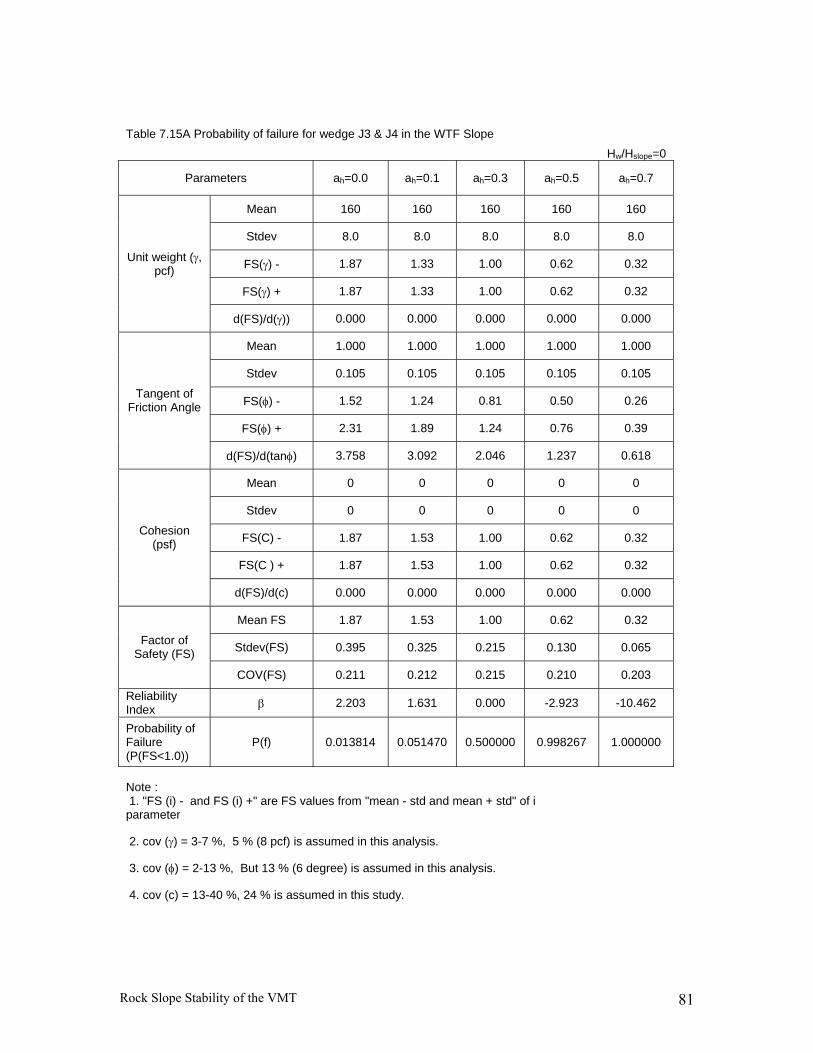
Rock Slope Stability of the VMT 81
Table 7.15A Probability of failure for wedge J3 & J4 in the WTF Slope Hw/Hslope=0
Parameters ah=0.0 ah=0.1 ah=0.3 ah=0.5 ah=0.7
Mean 160 160 160 160 160
Stdev 8.0 8.0 8.0 8.0 8.0
FS(γ) - 1.87 1.33 1.00 0.62 0.32
FS(γ) + 1.87 1.33 1.00 0.62 0.32
Unit weight (γ, pcf)
d(FS)/d(γ)) 0.000 0.000 0.000 0.000 0.000
Mean 1.000 1.000 1.000 1.000 1.000
Stdev 0.105 0.105 0.105 0.105 0.105
FS(φ) - 1.52 1.24 0.81 0.50 0.26
FS(φ) + 2.31 1.89 1.24 0.76 0.39
Tangent of Friction Angle
d(FS)/d(tanφ) 3.758 3.092 2.046 1.237 0.618
Mean 0 0 0 0 0
Stdev 0 0 0 0 0
FS(C) - 1.87 1.53 1.00 0.62 0.32
FS(C ) + 1.87 1.53 1.00 0.62 0.32
Cohesion (psf)
d(FS)/d(c) 0.000 0.000 0.000 0.000 0.000
Mean FS 1.87 1.53 1.00 0.62 0.32
Stdev(FS) 0.395 0.325 0.215 0.130 0.065 Factor of Safety (FS)
COV(FS) 0.211 0.212 0.215 0.210 0.203
Reliability Index β 2.203 1.631 0.000 -2.923 -10.462
Probability of Failure (P(FS<1.0))
P(f) 0.013814 0.051470 0.500000 0.998267 1.000000
Note : 1. "FS (i) - and FS (i) +" are FS values from "mean - std and mean + std" of i parameter
2. cov (γ) = 3-7 %, 5 % (8 pcf) is assumed in this analysis.
3. cov (φ) = 2-13 %, But 13 % (6 degree) is assumed in this analysis.
4. cov (c) = 13-40 %, 24 % is assumed in this study.
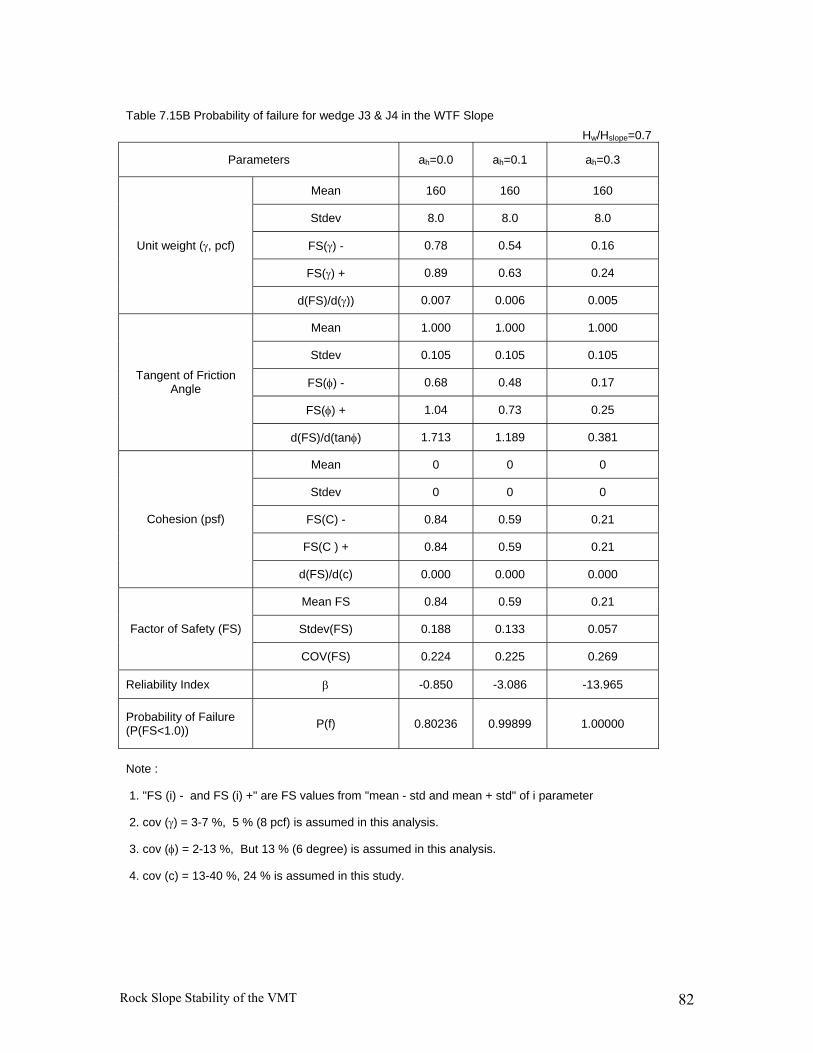
Rock Slope Stability of the VMT 82
Table 7.15B Probability of failure for wedge J3 & J4 in the WTF Slope Hw/Hslope=0.7
Parameters ah=0.0 ah=0.1 ah=0.3
Mean 160 160 160
Stdev 8.0 8.0 8.0
FS(γ) - 0.78 0.54 0.16
FS(γ) + 0.89 0.63 0.24
Unit weight (γ, pcf)
d(FS)/d(γ)) 0.007 0.006 0.005
Mean 1.000 1.000 1.000
Stdev 0.105 0.105 0.105
FS(φ) - 0.68 0.48 0.17
FS(φ) + 1.04 0.73 0.25
Tangent of Friction Angle
d(FS)/d(tanφ) 1.713 1.189 0.381
Mean 0 0 0
Stdev 0 0 0
FS(C) - 0.84 0.59 0.21
FS(C ) + 0.84 0.59 0.21
Cohesion (psf)
d(FS)/d(c) 0.000 0.000 0.000
Mean FS 0.84 0.59 0.21
Stdev(FS) 0.188 0.133 0.057 Factor of Safety (FS)
COV(FS) 0.224 0.225 0.269
Reliability Index β -0.850 -3.086 -13.965
Probability of Failure (P(FS<1.0)) P(f) 0.80236 0.99899 1.00000
Note :
1. "FS (i) - and FS (i) +" are FS values from "mean - std and mean + std" of i parameter
2. cov (γ) = 3-7 %, 5 % (8 pcf) is assumed in this analysis.
3. cov (φ) = 2-13 %, But 13 % (6 degree) is assumed in this analysis.
4. cov (c) = 13-40 %, 24 % is assumed in this study.

Rock Slope Stability of the VMT 83
7-2-6 East Tank Farm Slope
A. Site Conditions
The East Tank Farm Slope is located immediately south of the East Tank Farm
along the East Tank Loop Road. The slope extends approximately 100 to over 400 feet
to the west.
Based on available information (Bukovansky, 1990), no stabilization measures
were taken here because of the significant distance (approximately 400 feet) from the
slope to the nearest tank. Blocks that had fallen from this slope were found in the ditch
located between the slope and the road.
B. Kinematic Analysis
The major discontinuities measured in this slope are listed in Table 7.16 and the
pole plot of these data is illustrated in Figure 7.25. Based on the kinematic analysis
shown in Figure 7.26 and Figure 7.28, it is anticipated that a planar failure by foliation J3
(90/080) and a wedge failure by the intersection of joints J1 (65/351) and J2 (60/113)
may occur. The results of the kinematic analysis are summarized in Table 7.17.
C. Kinetic Analysis
Based on the kinetic analysis on the joint sets that were kinematically unstable in
the planar failure mode, the factor of safety (FS) ranges from 1.38 to 0.73 under pore
pressure conditions of zero to a saturated condition (Hw/Hslope = 1) without earthquake
loading effects. Under earthquake loading conditions ranging from 0.1g to 0.7g in
addition to the pore pressure effects, FS ranges from 1.12 to 0.01 under various pore
pressure conditions.
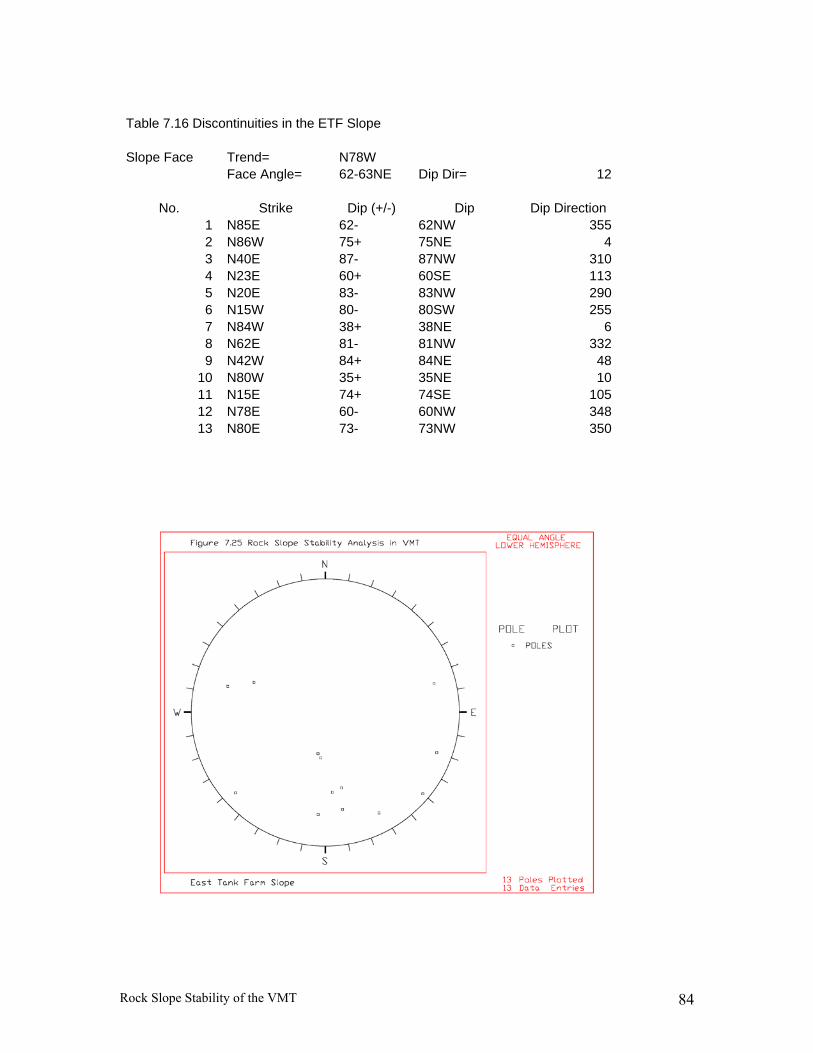
Rock Slope Stability of the VMT 84
Table 7.16 Discontinuities in the ETF Slope Slope Face Trend= N78W Face Angle= 62-63NE Dip Dir= 12
No. Strike Dip (+/-) Dip Dip Direction 1 N85E 62- 62NW 355 2 N86W 75+ 75NE 4 3 N40E 87- 87NW 310 4 N23E 60+ 60SE 113 5 N20E 83- 83NW 290 6 N15W 80- 80SW 255 7 N84W 38+ 38NE 6 8 N62E 81- 81NW 332 9 N42W 84+ 84NE 48
10 N80W 35+ 35NE 10 11 N15E 74+ 74SE 105 12 N78E 60- 60NW 348 13 N80E 73- 73NW 350
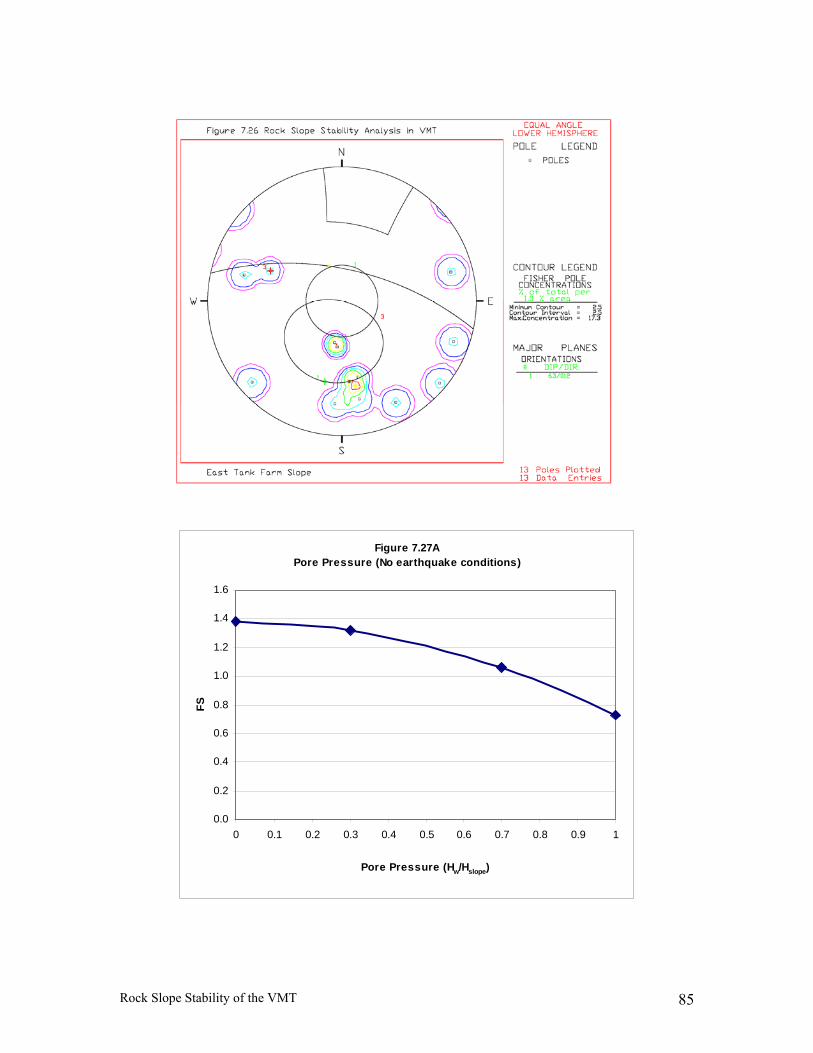
Rock Slope Stability of the VMT 85
Figure 7.27APore Pressure (No earthquake conditions)
0.0
0.2
0.4
0.6
0.8
1.0
1.2
1.4
1.6
0 0.1 0.2 0.3 0.4 0.5 0.6 0.7 0.8 0.9 1
Pore Pressure (Hw/Hslope)
FS
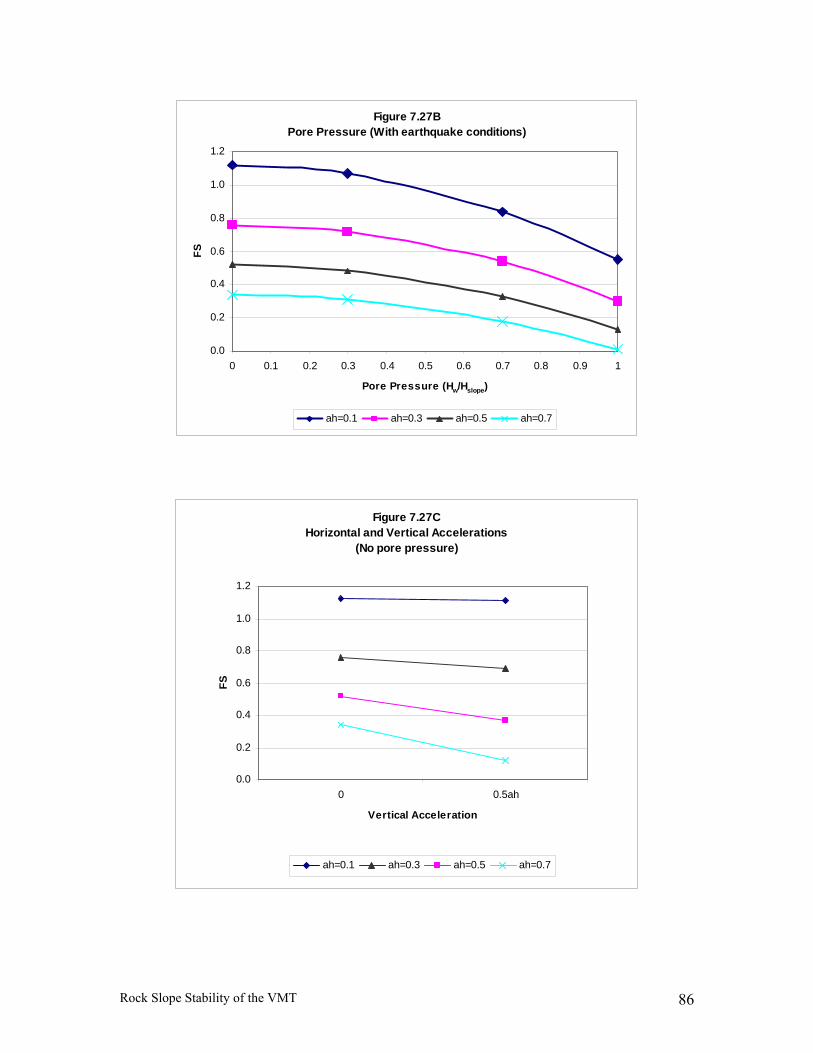
Rock Slope Stability of the VMT 86
Figure 7.27B Pore Pressure (With earthquake conditions)
0.0
0.2
0.4
0.6
0.8
1.0
1.2
0 0.1 0.2 0.3 0.4 0.5 0.6 0.7 0.8 0.9 1
Pore Pressure (Hw/Hslope)
FS
ah=0.1 ah=0.3 ah=0.5 ah=0.7
Figure 7.27CHorizontal and Vertical Accelerations
(No pore pressure)
0.0
0.2
0.4
0.6
0.8
1.0
1.2
0 0.5ah
Vertical Acceleration
FS
ah=0.1 ah=0.3 ah=0.5 ah=0.7
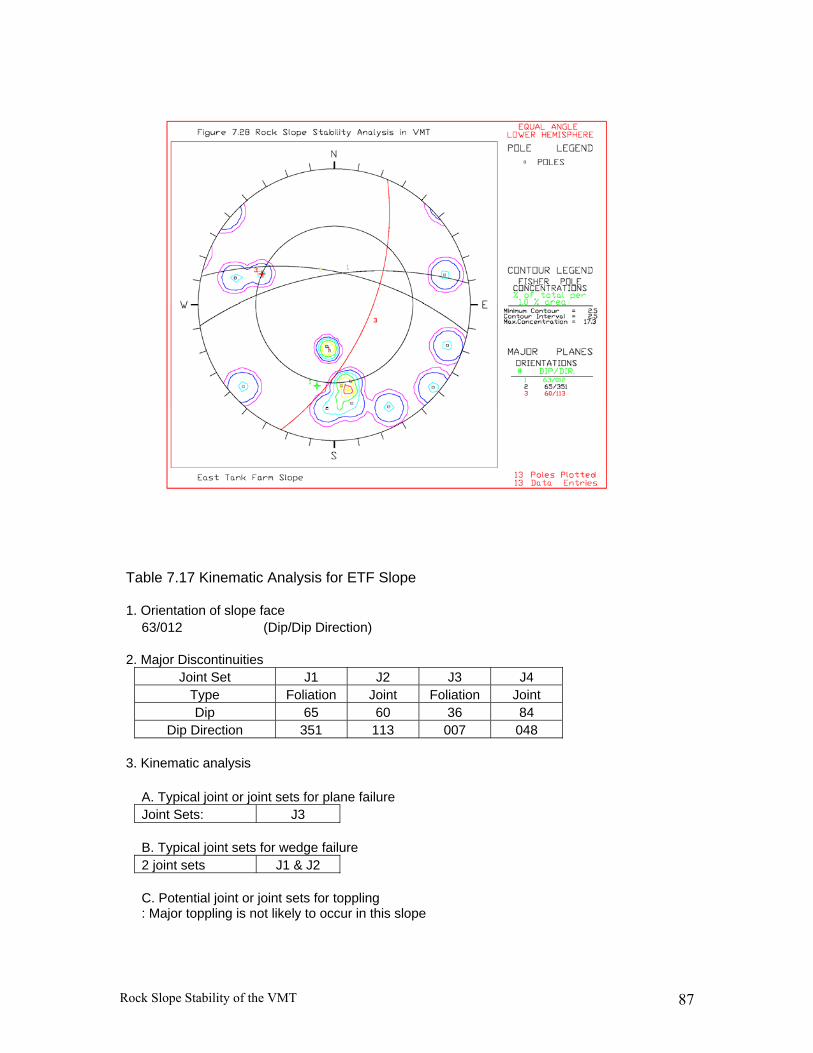
Rock Slope Stability of the VMT 87
Table 7.17 Kinematic Analysis for ETF Slope 1. Orientation of slope face 63/012 (Dip/Dip Direction) 2. Major Discontinuities Joint Set J1 J2 J3 J4 Type Foliation Joint Foliation Joint Dip 65 60 36 84 Dip Direction 351 113 007 048 3. Kinematic analysis A. Typical joint or joint sets for plane failure Joint Sets: J3 B. Typical joint sets for wedge failure 2 joint sets J1 & J2 C. Potential joint or joint sets for toppling : Major toppling is not likely to occur in this slope
Rock Slope Stability of the VMT 88
For the earthquake conditions considering both horizontal and vertical
accelerations and dry conditions (Hw/Hslope = 0), FS ranges from 1.12 to 0.12 for the
earthquake loading conditions ranging from 0.1g to 0.7g. For the planar failure mode, the
minimum external loading condition that can cause a planar failure is a pore pressure
equal to 0.75Hw/Hslope. If both earthquake and pore pressure loadings are considered, the
0.45Hw/Hslope with 0.1g of horizontal acceleration will cause a wedge failure to occur.
The results of the kinetic analysis for the planar failure are shown in Figures 7.27A
through 7.27C.
A kinetic analysis was performed on the joint sets of joints J3 and J4 that were
kinematically unstable in the wedge failure mode. The FS ranges from 1.71 to 0.44 under
the pore pressure conditions of zero to saturated condition (Hw/Hslope = 1) without an
earthquake loading condition. Under earthquake loading effects ranging from 0.1g to
0.7g in addition to the pore pressure effects, FS ranges from 1.40 to zero under various
pore pressure conditions. Under the earthquake conditions considering both horizontal
and vertical accelerations and dry conditions (Hw/Hslope = 0), FS ranges from 1.40 to zero
under earthquake loading conditions ranging from 0.1g to 0.7g. For this wedge failure
mode, the minimum external loading condition that can cause a wedge failure is a pore
pressure equal to 0.7Hw/Hslope. If both earthquake and pore pressure loadings are
considered together, the 0.6Hw/Hslope with 0.1g of horizontal acceleration will cause the
wedge failure to occur. The results of the kinetic analysis of the wedge failure are shown
in Figures 7.29A through 7.29C.
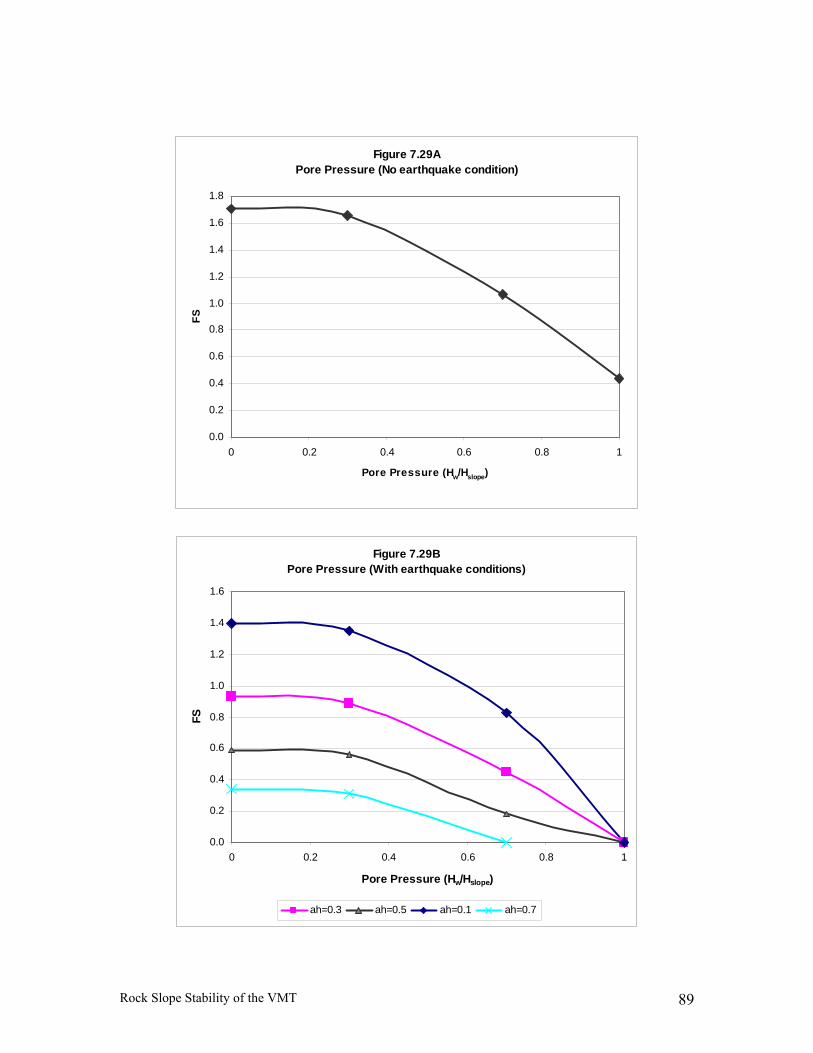
Rock Slope Stability of the VMT 89
Figure 7.29APore Pressure (No earthquake condition)
0.0
0.2
0.4
0.6
0.8
1.0
1.2
1.4
1.6
1.8
0 0.2 0.4 0.6 0.8 1
Pore Pressure (Hw/Hslope)
FS
Figure 7.29BPore Pressure (With earthquake conditions)
0.0
0.2
0.4
0.6
0.8
1.0
1.2
1.4
1.6
0 0.2 0.4 0.6 0.8 1
Pore Pressure (Hw/Hslope)
FS
ah=0.3 ah=0.5 ah=0.1 ah=0.7
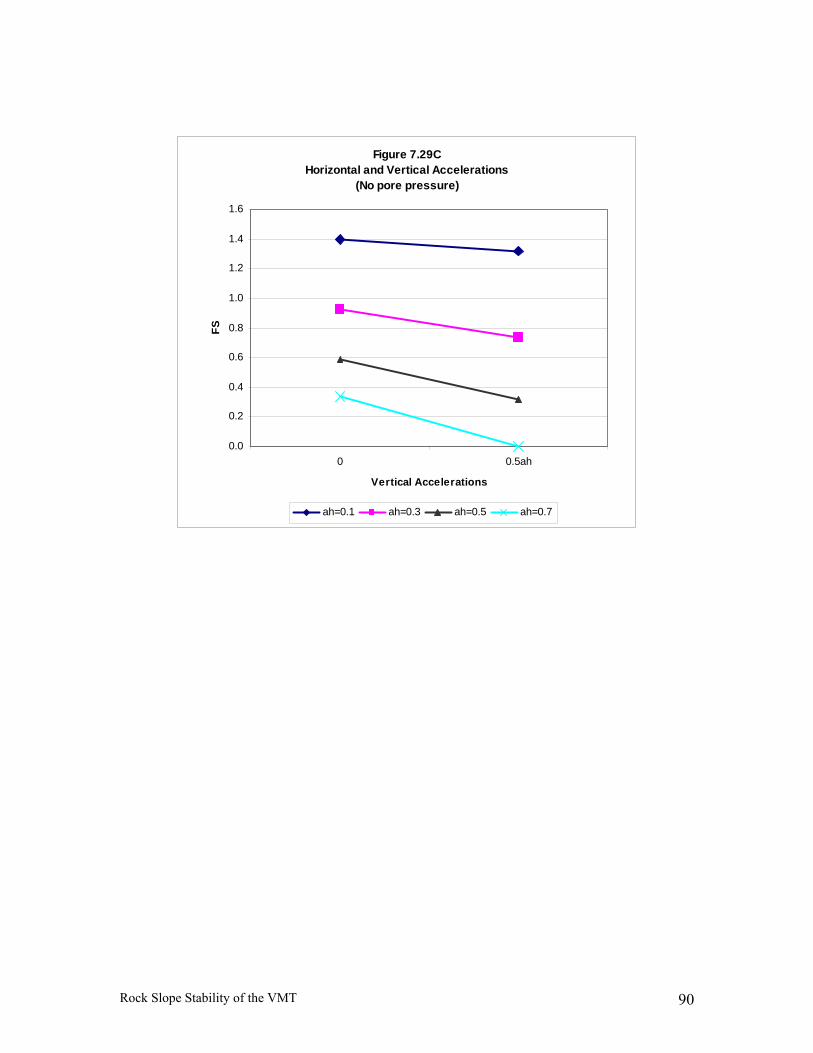
Rock Slope Stability of the VMT 90
Figure 7.29CHorizontal and Vertical Accelerations
(No pore pressure)
0.0
0.2
0.4
0.6
0.8
1.0
1.2
1.4
1.6
0 0.5ah
Vertical Accelerations
FS
ah=0.1 ah=0.3 ah=0.5 ah=0.7
Rock Slope Stability of the VMT 91
D. Probability of Failure
The probability of failure (Pf) calculated using the planar failure mode in kinetic
analysis ranges from 10% to 100% under dry conditions with the earthquake loading
ranging from zero to 0.7g. The Pf under the partially saturated conditions (Hw/Hslope = 0.7)
ranges from 40% to 100% (Tables 7.18A and 7.18B). However, the Pf for the wedge
failure ranges from 3% to 100% under dry conditions with the earthquake loading
conditions ranging from zero to 0.7g. The Pf under the partially saturated conditions
(Hw/Hslope=0.7) ranges from 4% to 100%. Results of the probability of failure analysis for
the wedge failure are listed in Tables 7.19A and 7.19B.
7-2-7 Other Slopes
During the field investigation, additional data were obtained from the slopes
deemed to be of less significance, including the Tea Shelter Slope, the Power House
Road Slope and the rock quarry. It appears that the discontinuities observed in these
areas would not cause critical damage to the existing facilities due to their lower height
and significant distance from the facilities.
The data for the discontinuities measured in these slopes are included in Tables
7.20 through 7.22 and Figures 7.30 through 7.32.
7-3 Analysis of Aerial Photographs above VMT
Another concern for rock slope stability was considered. This included an area
which extends beyond the 1000 acre site itself and involves the stability of the large rock
mass at the top of the mountain to the south. Viewed from the water in the Valdez arm,
the mass of glaciated rock slopes extend high above the VMT facilities.
Rock Slope Stability of the VMT 92
The rock mass is an extensive cirque feature where a massive ice field had existed
prior to the current melt-back of glaciers in southern Alaska. Because of this concern,
stereo pairs of air photos were examined by Dr. West to evaluate the potential for
massive rock failures that could yield large blocks of rock tumbling down upon the VMT
facilities. This is not an inconsequential concern because it is well documented that
massive rock slides occur in proximity to high magnitude earthquakes (Keefer, 1984).
Rockslides and rock falls are abundant occurrence in close proximities to high magnitude
earthquake.
Examination of the air photos indicated that a large valley exits between the high
peaks and the slopes directly above the VMT site. This was the route of the descending
glacier from this high cirque area. Based on this evaluation, it is concluded that if a major
rock fall or slide occurs on the high slope during a major earthquake near the VMT site,
that the rock mass would not be directed toward the site but be routed into another lower
area.
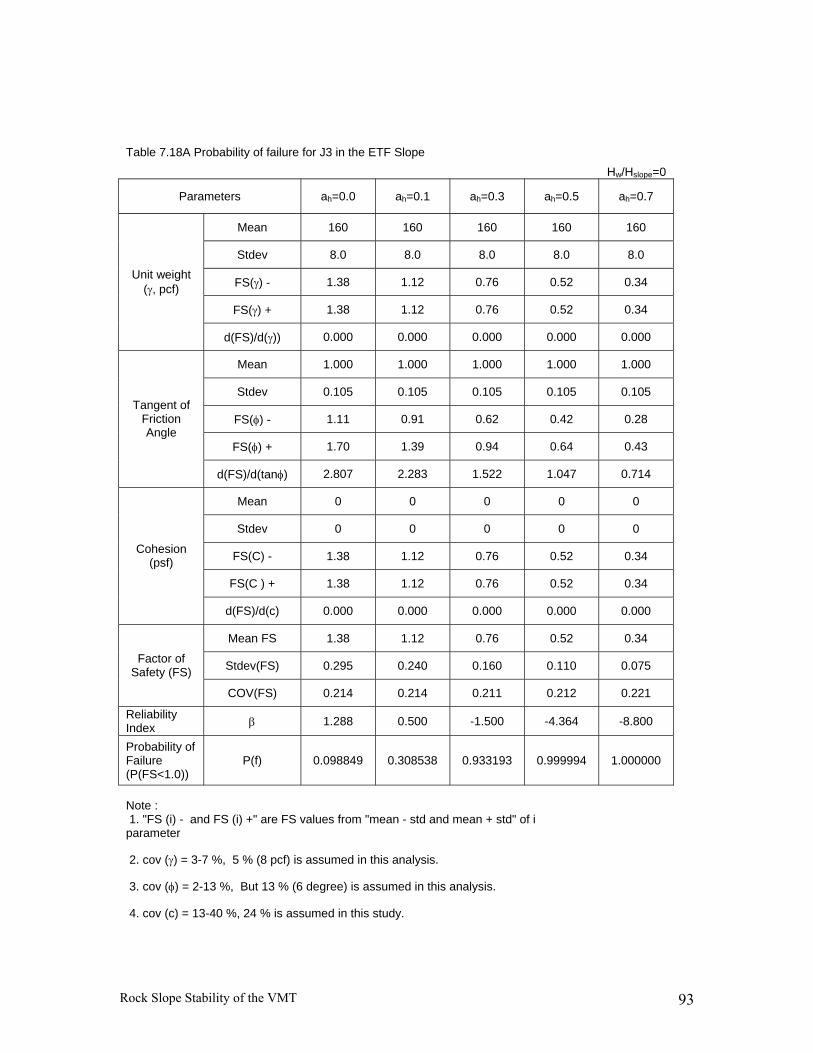
Rock Slope Stability of the VMT 93
Table 7.18A Probability of failure for J3 in the ETF Slope Hw/Hslope=0
Parameters ah=0.0 ah=0.1 ah=0.3 ah=0.5 ah=0.7
Mean 160 160 160 160 160
Stdev 8.0 8.0 8.0 8.0 8.0
FS(γ) - 1.38 1.12 0.76 0.52 0.34
FS(γ) + 1.38 1.12 0.76 0.52 0.34
Unit weight (γ, pcf)
d(FS)/d(γ)) 0.000 0.000 0.000 0.000 0.000
Mean 1.000 1.000 1.000 1.000 1.000
Stdev 0.105 0.105 0.105 0.105 0.105
FS(φ) - 1.11 0.91 0.62 0.42 0.28
FS(φ) + 1.70 1.39 0.94 0.64 0.43
Tangent of Friction Angle
d(FS)/d(tanφ) 2.807 2.283 1.522 1.047 0.714
Mean 0 0 0 0 0
Stdev 0 0 0 0 0
FS(C) - 1.38 1.12 0.76 0.52 0.34
FS(C ) + 1.38 1.12 0.76 0.52 0.34
Cohesion (psf)
d(FS)/d(c) 0.000 0.000 0.000 0.000 0.000
Mean FS 1.38 1.12 0.76 0.52 0.34
Stdev(FS) 0.295 0.240 0.160 0.110 0.075 Factor of Safety (FS)
COV(FS) 0.214 0.214 0.211 0.212 0.221
Reliability Index β 1.288 0.500 -1.500 -4.364 -8.800
Probability of Failure (P(FS<1.0))
P(f) 0.098849 0.308538 0.933193 0.999994 1.000000
Note : 1. "FS (i) - and FS (i) +" are FS values from "mean - std and mean + std" of i parameter
2. cov (γ) = 3-7 %, 5 % (8 pcf) is assumed in this analysis.
3. cov (φ) = 2-13 %, But 13 % (6 degree) is assumed in this analysis.
4. cov (c) = 13-40 %, 24 % is assumed in this study.
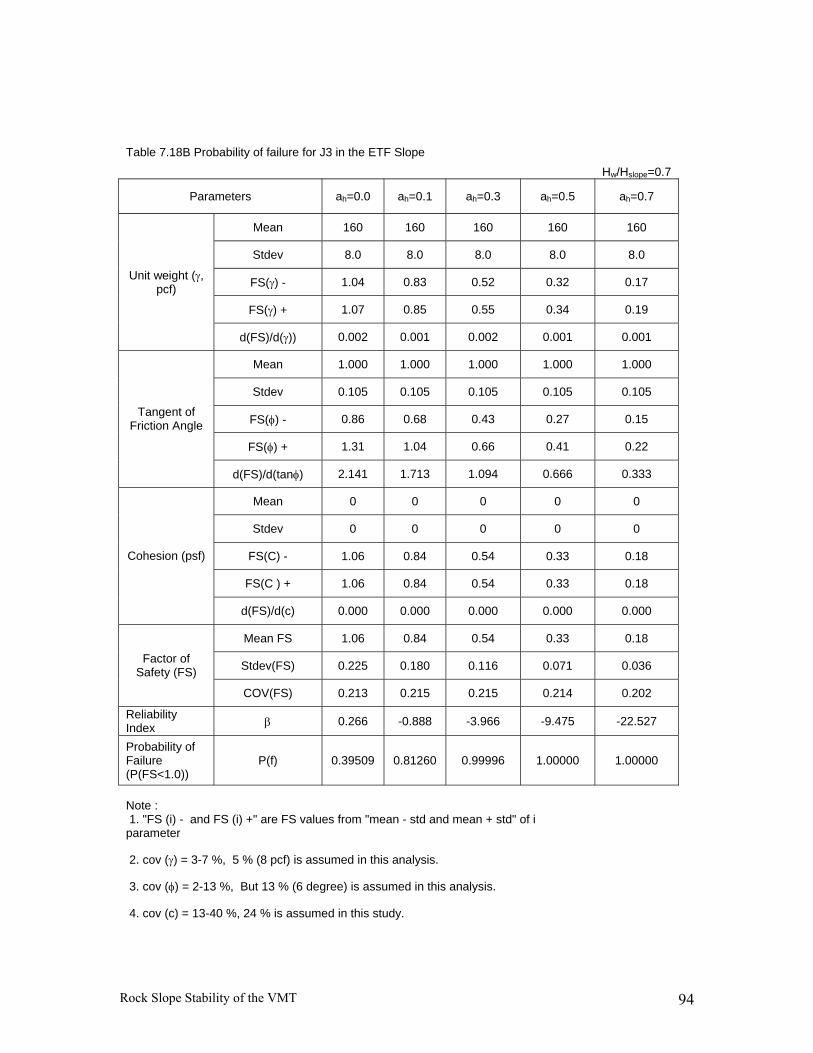
Rock Slope Stability of the VMT 94
Table 7.18B Probability of failure for J3 in the ETF Slope Hw/Hslope=0.7
Parameters ah=0.0 ah=0.1 ah=0.3 ah=0.5 ah=0.7
Mean 160 160 160 160 160
Stdev 8.0 8.0 8.0 8.0 8.0
FS(γ) - 1.04 0.83 0.52 0.32 0.17
FS(γ) + 1.07 0.85 0.55 0.34 0.19
Unit weight (γ, pcf)
d(FS)/d(γ)) 0.002 0.001 0.002 0.001 0.001
Mean 1.000 1.000 1.000 1.000 1.000
Stdev 0.105 0.105 0.105 0.105 0.105
FS(φ) - 0.86 0.68 0.43 0.27 0.15
FS(φ) + 1.31 1.04 0.66 0.41 0.22
Tangent of Friction Angle
d(FS)/d(tanφ) 2.141 1.713 1.094 0.666 0.333
Mean 0 0 0 0 0
Stdev 0 0 0 0 0
FS(C) - 1.06 0.84 0.54 0.33 0.18
FS(C ) + 1.06 0.84 0.54 0.33 0.18
Cohesion (psf)
d(FS)/d(c) 0.000 0.000 0.000 0.000 0.000
Mean FS 1.06 0.84 0.54 0.33 0.18
Stdev(FS) 0.225 0.180 0.116 0.071 0.036 Factor of Safety (FS)
COV(FS) 0.213 0.215 0.215 0.214 0.202
Reliability Index β 0.266 -0.888 -3.966 -9.475 -22.527
Probability of Failure (P(FS<1.0))
P(f) 0.39509 0.81260 0.99996 1.00000 1.00000
Note : 1. "FS (i) - and FS (i) +" are FS values from "mean - std and mean + std" of i parameter
2. cov (γ) = 3-7 %, 5 % (8 pcf) is assumed in this analysis.
3. cov (φ) = 2-13 %, But 13 % (6 degree) is assumed in this analysis.
4. cov (c) = 13-40 %, 24 % is assumed in this study.
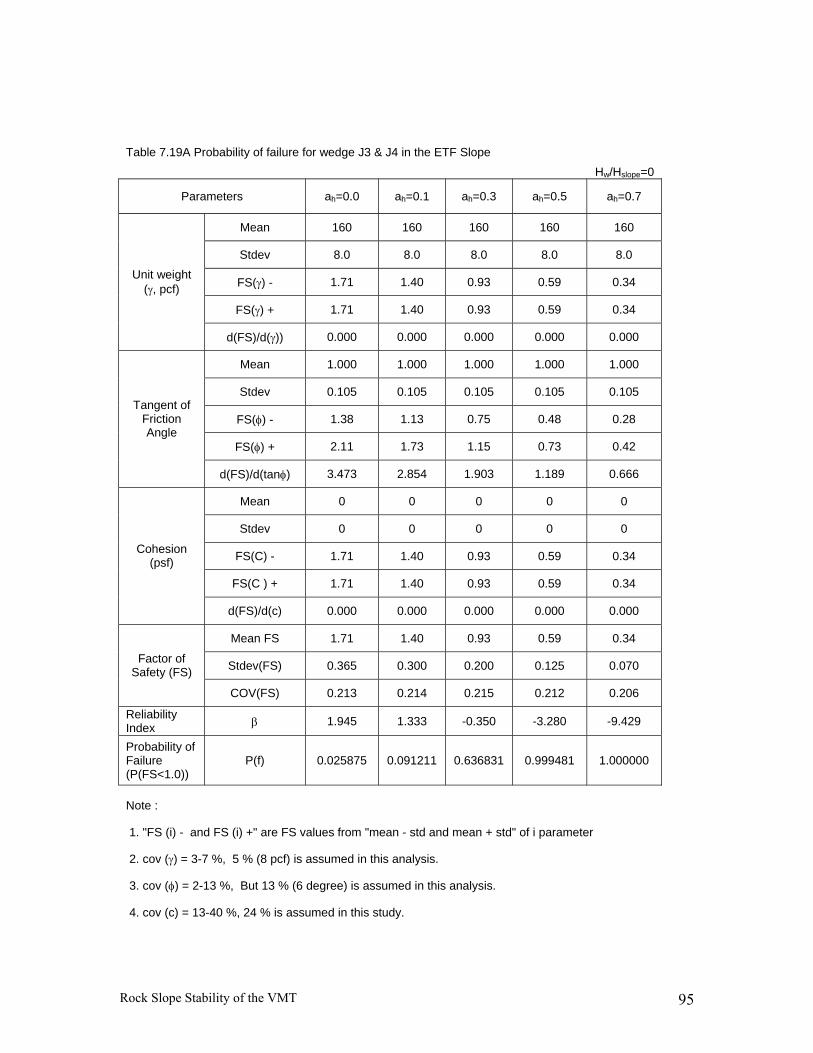
Rock Slope Stability of the VMT 95
Table 7.19A Probability of failure for wedge J3 & J4 in the ETF Slope Hw/Hslope=0
Parameters ah=0.0 ah=0.1 ah=0.3 ah=0.5 ah=0.7
Mean 160 160 160 160 160
Stdev 8.0 8.0 8.0 8.0 8.0
FS(γ) - 1.71 1.40 0.93 0.59 0.34
FS(γ) + 1.71 1.40 0.93 0.59 0.34
Unit weight (γ, pcf)
d(FS)/d(γ)) 0.000 0.000 0.000 0.000 0.000
Mean 1.000 1.000 1.000 1.000 1.000
Stdev 0.105 0.105 0.105 0.105 0.105
FS(φ) - 1.38 1.13 0.75 0.48 0.28
FS(φ) + 2.11 1.73 1.15 0.73 0.42
Tangent of Friction Angle
d(FS)/d(tanφ) 3.473 2.854 1.903 1.189 0.666
Mean 0 0 0 0 0
Stdev 0 0 0 0 0
FS(C) - 1.71 1.40 0.93 0.59 0.34
FS(C ) + 1.71 1.40 0.93 0.59 0.34
Cohesion (psf)
d(FS)/d(c) 0.000 0.000 0.000 0.000 0.000
Mean FS 1.71 1.40 0.93 0.59 0.34
Stdev(FS) 0.365 0.300 0.200 0.125 0.070 Factor of Safety (FS)
COV(FS) 0.213 0.214 0.215 0.212 0.206
Reliability Index β 1.945 1.333 -0.350 -3.280 -9.429
Probability of Failure (P(FS<1.0))
P(f) 0.025875 0.091211 0.636831 0.999481 1.000000
Note :
1. "FS (i) - and FS (i) +" are FS values from "mean - std and mean + std" of i parameter
2. cov (γ) = 3-7 %, 5 % (8 pcf) is assumed in this analysis.
3. cov (φ) = 2-13 %, But 13 % (6 degree) is assumed in this analysis.
4. cov (c) = 13-40 %, 24 % is assumed in this study.
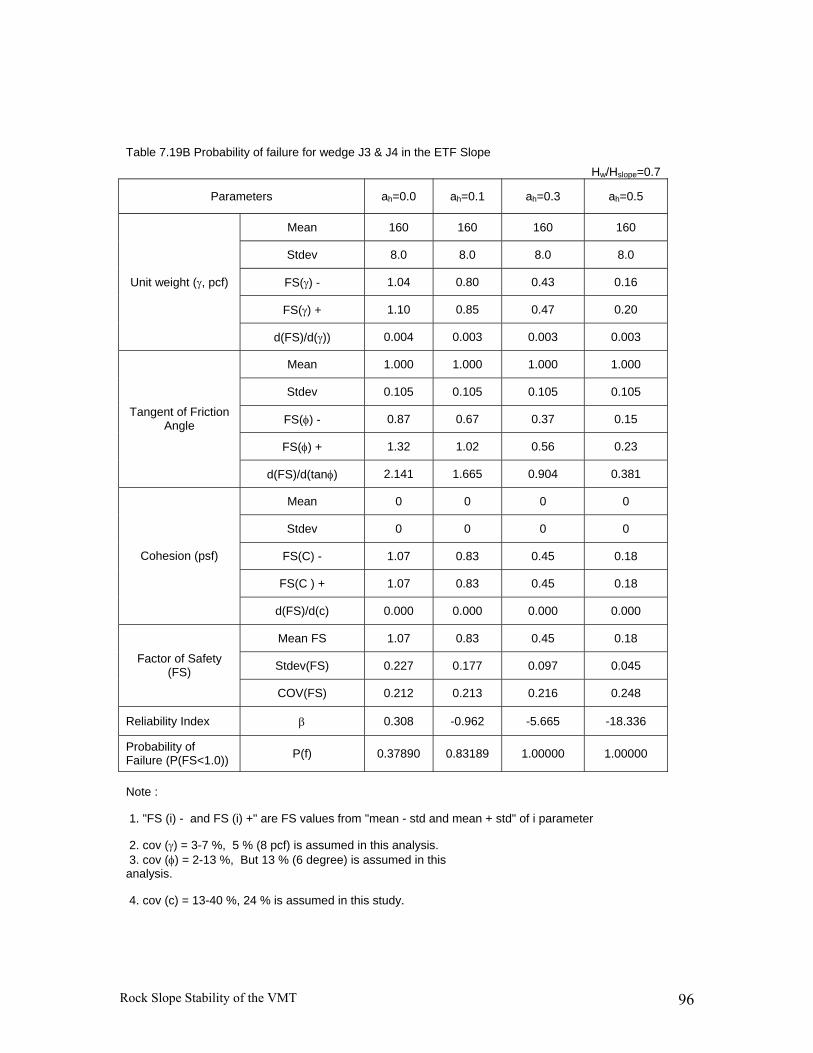
Rock Slope Stability of the VMT 96
Table 7.19B Probability of failure for wedge J3 & J4 in the ETF Slope Hw/Hslope=0.7
Parameters ah=0.0 ah=0.1 ah=0.3 ah=0.5
Mean 160 160 160 160
Stdev 8.0 8.0 8.0 8.0
FS(γ) - 1.04 0.80 0.43 0.16
FS(γ) + 1.10 0.85 0.47 0.20
Unit weight (γ, pcf)
d(FS)/d(γ)) 0.004 0.003 0.003 0.003
Mean 1.000 1.000 1.000 1.000
Stdev 0.105 0.105 0.105 0.105
FS(φ) - 0.87 0.67 0.37 0.15
FS(φ) + 1.32 1.02 0.56 0.23
Tangent of Friction Angle
d(FS)/d(tanφ) 2.141 1.665 0.904 0.381
Mean 0 0 0 0
Stdev 0 0 0 0
FS(C) - 1.07 0.83 0.45 0.18
FS(C ) + 1.07 0.83 0.45 0.18
Cohesion (psf)
d(FS)/d(c) 0.000 0.000 0.000 0.000
Mean FS 1.07 0.83 0.45 0.18
Stdev(FS) 0.227 0.177 0.097 0.045 Factor of Safety (FS)
COV(FS) 0.212 0.213 0.216 0.248
Reliability Index β 0.308 -0.962 -5.665 -18.336
Probability of Failure (P(FS<1.0)) P(f) 0.37890 0.83189 1.00000 1.00000
Note :
1. "FS (i) - and FS (i) +" are FS values from "mean - std and mean + std" of i parameter
2. cov (γ) = 3-7 %, 5 % (8 pcf) is assumed in this analysis. 3. cov (φ) = 2-13 %, But 13 % (6 degree) is assumed in this analysis.
4. cov (c) = 13-40 %, 24 % is assumed in this study.

Rock Slope Stability of the VMT 97
Table 7.20 Discontinuities in the T-Shelter Slope Slope Face Trend= N85E Face Angle= 53NW Dip Dir= 355
No. Strike Dip (+/-) Dip Dip Direction 1 N82W 57+ 57NE 8 2 N35E 78- 78NW 305 3 N48W 88+ 88NE 42 4 N72E 60+ 60SE 162 5 N70E 84- 84NW 340 6 N70E 75+ 75SE 160 7 N68E 89- 89NW 338 8 N47W 67+ 67NE 43 9 N62E 67+ 67SE 152
10 N80E 82- 82NW 350 11 N60E 68+ 68SE 150 12 N65E 30- 30NW 335 13 N47W 70+ 70NE 43 14 N64E 82+ 82SE 154 15 N42W 83+ 83NE 48 16 N34E 75- 75NW 304 17 N30E 74+ 74SE 120 18 N5W 75+ 75NE 85 19 N77E 87- 87NW 347 20 N60W 55+ 55NE 30 21 N7E 85+ 85SE 97 22 N85W 61+ 61NE 5 23 N64E 35- 35NW 334
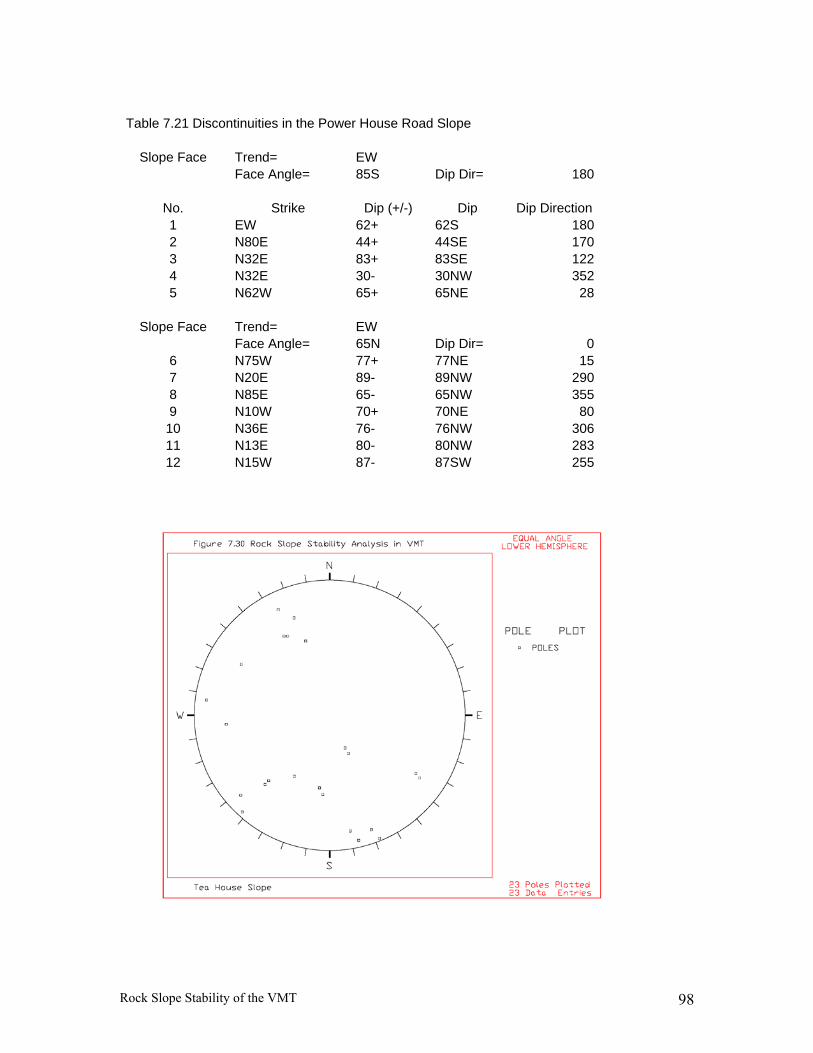
Rock Slope Stability of the VMT 98
Table 7.21 Discontinuities in the Power House Road Slope
Slope Face Trend= EW Face Angle= 85S Dip Dir= 180
No. Strike Dip (+/-) Dip Dip Direction 1 EW 62+ 62S 180 2 N80E 44+ 44SE 170 3 N32E 83+ 83SE 122 4 N32E 30- 30NW 352 5 N62W 65+ 65NE 28
Slope Face Trend= EW Face Angle= 65N Dip Dir= 0
6 N75W 77+ 77NE 15 7 N20E 89- 89NW 290 8 N85E 65- 65NW 355 9 N10W 70+ 70NE 80 10 N36E 76- 76NW 306 11 N13E 80- 80NW 283 12 N15W 87- 87SW 255
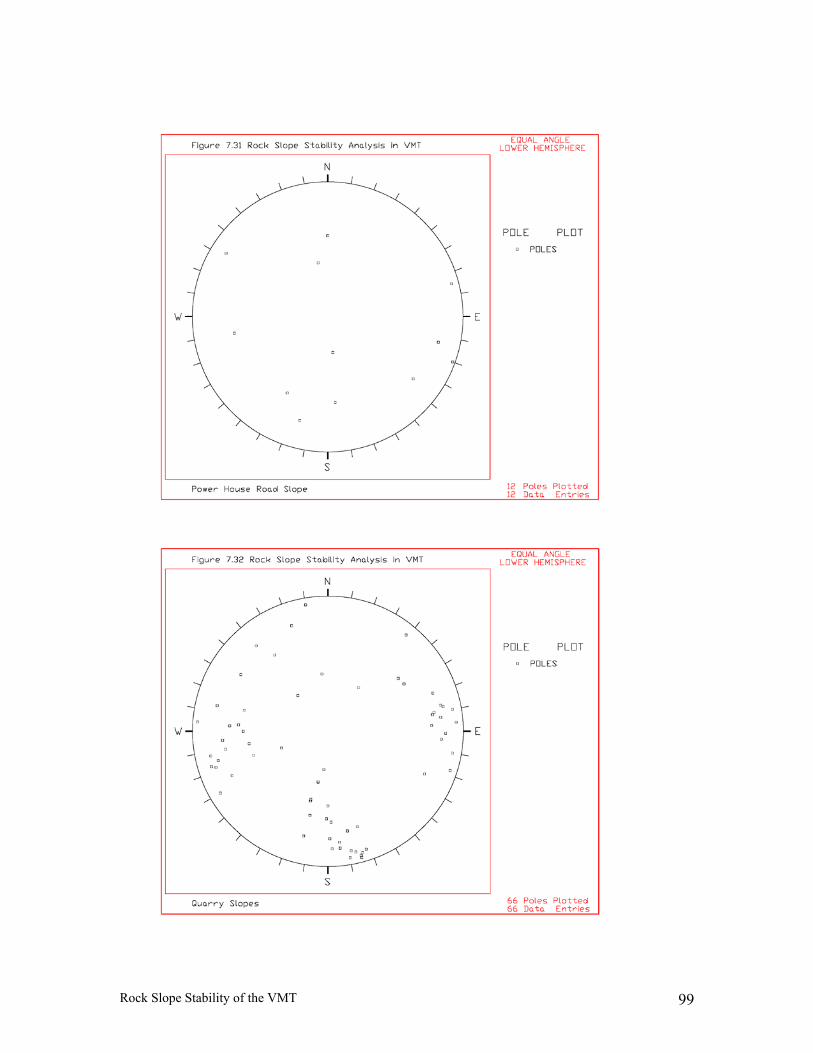
Rock Slope Stability of the VMT 99

Rock Slope Stability of the VMT 100
Table 7.22 Discontinuities in the Rock Quarry Slope Slope Face Trend= N80W Face Angle= 65-69NE Dip Dir= 10
No. Strike Dip (+/-) Dip Dip Direction 1 N25W 76+ 76NE 65 2 N18W 82+ 82NE 72 3 N10E 86- 86NW 280 4 N37W 66- 66SW 233 5 N1E 82- 82NW 271 6 N84E 82- 82NW 354 7 EW 58- 58N 360 8 N78W 65+ 65NE 12 9 N18E 87- 87NW 288 10 N75E 87- 87NW 345 11 N75E 88- 88NW 345 12 N76W 55+ 55NE 14 13 N24E 76- 76NW 294 14 N84E 79- 79NW 354 15 N18W 60+ 60NE 72 16 N9W 61+ 61NE 81 17 N20W 40+ 40NE 70 18 N77W 77+ 77NE 13 19 N4E 67+ 67SE 94 20 N13W 81- 81SW 257 21 N79E 74- 74NW 349 22 N5W 76+ 76NE 85 23 N13W 81- 81SW 257 24 N79E 74- 74NW 349 25 N4W 87- 87SW 266 26 N7W 80- 80SW 263 27 N84W 32+ 32NE 6 28 N50E 38+ 38SE 140 29 N14E 79+ 79SE 104 30 NS 64+ 64E 90 31 N10W 75+ 75NE 80 32 N13E 80+ 80SE 103 33 N72E 85- 85NW 342 34 N74E 86- 86NW 344 35 N9W 76- 76SW 261
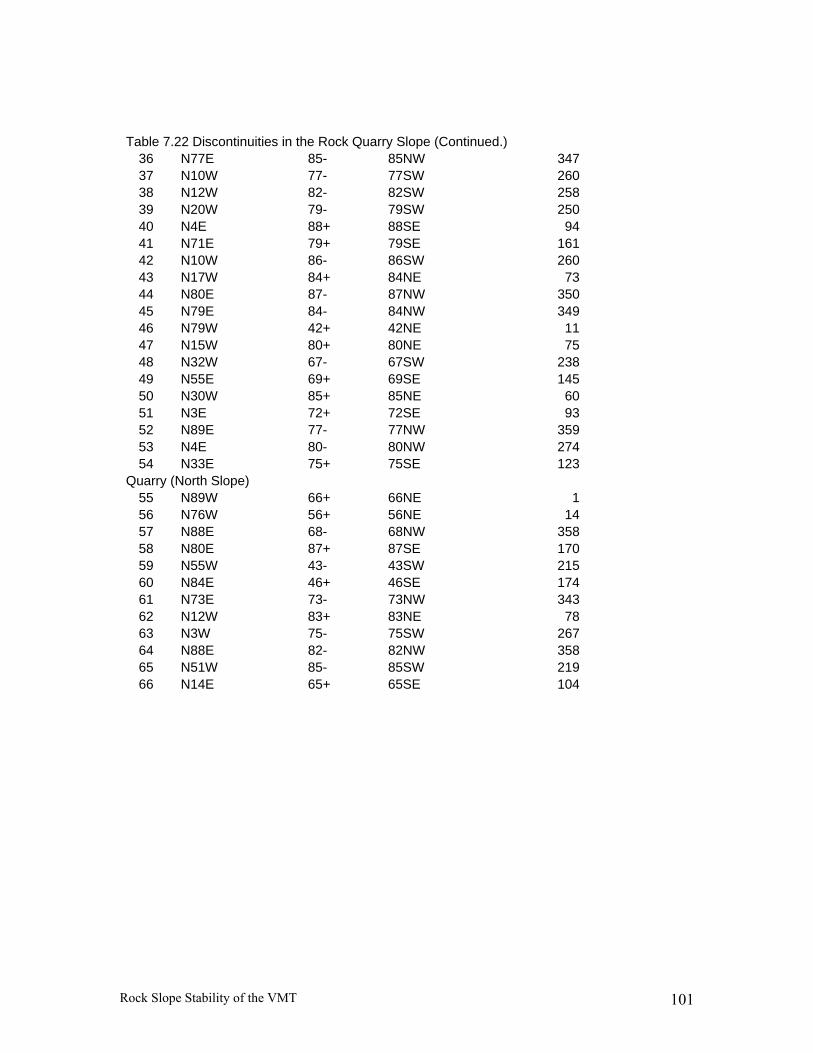
Rock Slope Stability of the VMT 101
Table 7.22 Discontinuities in the Rock Quarry Slope (Continued.) 36 N77E 85- 85NW 347 37 N10W 77- 77SW 260 38 N12W 82- 82SW 258 39 N20W 79- 79SW 250 40 N4E 88+ 88SE 94 41 N71E 79+ 79SE 161 42 N10W 86- 86SW 260 43 N17W 84+ 84NE 73 44 N80E 87- 87NW 350 45 N79E 84- 84NW 349 46 N79W 42+ 42NE 11 47 N15W 80+ 80NE 75 48 N32W 67- 67SW 238 49 N55E 69+ 69SE 145 50 N30W 85+ 85NE 60 51 N3E 72+ 72SE 93 52 N89E 77- 77NW 359 53 N4E 80- 80NW 274 54 N33E 75+ 75SE 123
Quarry (North Slope) 55 N89W 66+ 66NE 1 56 N76W 56+ 56NE 14 57 N88E 68- 68NW 358 58 N80E 87+ 87SE 170 59 N55W 43- 43SW 215 60 N84E 46+ 46SE 174 61 N73E 73- 73NW 343 62 N12W 83+ 83NE 78 63 N3W 75- 75SW 267 64 N88E 82- 82NW 358 65 N51W 85- 85SW 219 66 N14E 65+ 65SE 104

Rock Slope Stability of the VMT 102
8. CONCLUSIONS
Based on the field investigations performed to evaluate stability of the existing
rock slopes at the VMT and subsequent data analysis, the following conclusions are
obtained. It should be noted that the stability analyses for this project were performed
using limited information on the strength of the rock discontinuities and rock bolts, and
limited access to rock slopes. It also should be noted that the kinetic analysis used in this
project is considered to be conservative for the slope stability analysis because of rock
mass strength considerations. Through-going discontinuities are assumed and this likely
is not the case in all situations. Therefore, the FS may actually be greater than the values
calculated.
A more precise evaluation of rock slope stability at VMT would require a detailed
field evaluation of the site. This would require an accurate location of all rock bolts,
drainage holes and piezometers, including the length and orientation of these units. This
information was not available in the current study. Also, the condition of the rock bolts
and drainage holes is needed.
Based on the kinematic analyses of the BWT Slope, the orientations of the
discontinuities observed in this slope indicate that both planar and wedge type failures
may occur. However, due to the in-place strength of the discontinuities, it appears that
the slope is stable under current conditions. Based upon the kinetic analysis, considering
various earthquake and pore pressure conditions imposed by the prolonged rainfall and
snow melt, it is anticipated that the external loading conditions equal to 0.7Hw/Hslope
when pore pressure only is applied and equal to pore pressure of 0.6Hw/Hslope with 0.1g of
Rock Slope Stability of the VMT 103
horizontal acceleration when both earthquake and pore pressure are imposed, will cause
the BWT Slope to become unstable.
The kinematic analyses of the PVR Slope indicated that both planar and wedge
type failures may occur. However, due to the in-place strength of the discontinuities, it
appears that the slope is stable under current conditions. However, for this wedge failure
mode, the external loading conditions equal to 0.85Hw/Hslope when pore pressure only is
applied and equal to pore pressure of 0.8Hw/Hslope with 0.1g of horizontal acceleration or
0.55Hw/Hslope with 0.2g of horizontal acceleration when both earthquake and pore
pressure are imposed may cause the PVR Slope to become unstable.
Based on the kinematic analyses of the West Manifold Slope, the orientations of
the discontinuities observed here indicate that wedge type failure may occur. However,
due to the in-place strength of the discontinuities, it appears that the slope is stable under
current conditions. However, based on a kinetic analysis considering various earthquake
and pore pressure conditions, it is anticipated that the external loading conditions equal to
0.35Hw/Hslope when only pore pressure is applied, and the external loading conditions
equal to pore pressure of 0.15Hw/Hslope with 0.1g of horizontal acceleration when both
earthquake and pore pressure are imposed, may cause the West Manifold Slope to
become unstable.
The kinematic analyses of the East Tank Farm Slope indicated that both planar
and wedge type failures may occur. However, due to the in-place strength of the
discontinuities, it appears that the slope is stable under current conditions. However, the
external loading conditions equal to 0.7Hw/Hslope when pore pressure only is applied, and
the external loading conditions equal to pore pressure of 0.45Hw/Hslope with 0.1g of
Rock Slope Stability of the VMT 104
horizontal acceleration when both earthquake and pore pressure are imposed, may cause
the East Tank Farm Slope to become unstable.
The kinematic analyses on the West Tank Farm Slope indicated that wedge type
failure may occur. However, due to the in-place strength of the discontinuities, it
appears that the slope is stable under current conditions. However, the external loading
conditions equal to 0.65Hw/Hslope when pore pressure only is applied and the external
loading conditions equal to pore pressure of 0.5Hw/Hslope with 0.1g of horizontal
acceleration when both earthquake and pore pressure are imposed may cause the East
Tank Farm Slope to become unstable.
Evaluation of the existing pore pressure values in piezometers was not included in
this rock slope study of the project. Thus, various pore pressure conditions with
earthquake loading conditions were selected to identify the minimum external loading
conditions at which slopes of the VMT become unstable. The detailed results of the
kinematic and kinetic analyses are included in this report as indicated in the previous
sections.
Details on the conditions of the drainage holes in the various rock slopes at VMT
were not provided for this study. It is not clear at this time whether or not this information
is known in detail. This should be determined in order to perform a more precise
evaluation of slope stability for the site.
Also it could not be determined whether or not a contingency plan has been developed at
VMT to address an occurrence of rising piezometer levels (increased pore pressures)
under increased precipitation conditions. Conclusions reached in this study, based on the

Rock Slope Stability of the VMT 105
assumptions made, indicated that high pore pressures with moderate earthquake shaking
can give rise to unstable slope conditions.
6. RECOMMENDATIONS
The purpose of this project was mainly to evaluate the stability of rock slopes of
the VMT during potential earthquake conditions. This report has been prepared for the
purpose of assisting RCAC and Alyeska in deciding a future agenda for maintaining the
rock slopes to provide stable conditions. It should be noted that this report is not
intended to be used as a part of any contract document or as a design document.
As indicated in the conclusion, it appears that the slopes are stable under current
conditions except for the local and small sized planar and wedge failures occurring in the
space between adjacent rock bolts. Therefore, we recommended the following
remediation measures:
The ditches above the rock slopes should have steep enough grades to avoid
water-ponding, thereby preventing infiltration of ponded water which can increase pore
pressures. Also, it is recommended that any cracks at the top of the slope be sealed with
grout or asphalt.
It was observed that some of the installed piezometers were clogged. Therefore,
it is recommended that these piezometers in the VMT slopes be regularly cleaned and
measured frequently to monitor pore pressures. A program of frequent measurements
would show the annual fluctuation of piezometer level. It is anticipated that the rock
slope may undergo unstable conditions when the slope is fully saturated (Hw/Hslope=1.0).

Rock Slope Stability of the VMT 106
It is also recommended that more rock bolts be installed in the areas where the
existing rock bolts are loosened and where rock bolts have not been installed. Methods
of installation including rock bolt pattern, length and grouting should be determined by a
consulting firm performing this specialty. Therefore, it is recommended that the existing
rock bolts be examined before more rock bolts are added.
Rock slope stability calculations presented in this report are based on a number of
assumptions concerning rock mass strength and slope stabilization. The latter includes
rock bolt distribution and drainage hole location and extent. In order to conduct a more
precise evaluation than is presented here, these additional data must be obtained.
REFERENCES CITED
Bukovansky, Michael, 1990, Valdez Terminal Rock Cuts and Tank Foundations, CH2MHill, Consultants.
Cho, K.H., 2002, Deterministic and Probabilistic Analysis of Rock Slope Stability under Earthquake Loading Conditions, Ph.D. thesis, Purdue University.
Cohen, Stan, The Great Alaska Pipeline, Pictorial Histories Publishing Co., Missoula, Montana, 134 pages, with information contributed by Alyeska Pipeline Service Company.
Connor, Cathy and O’Haire, Daniel, 1988, Roadside Geology of Alaska, Mountain Press Publishing Co., Missoula, Montana, 250 pages.
Davies, John N., 1985, Overview of Alaskan Historical Seismicity, Public Data File Report 85-12, Alaska Division of Geological and Geophysical Surveys.
Davies, John N. and House, Leigh, 1979, Aleutian Subduction Zone Seismicity, Volcano-Trench Separation and Their Relation to Great Thrust-Type Earthquakes, Journal of Geophysical Research, Vol. 84, No. B9.
DIPS 2.2, Data Interpretating Package Using Stereographic Projection, Rocscience, Inc.
Duncan, J. M., 2000, Factors of Safety and Reliability in Geotechnical Engineering, Journal of Geotechnical and Geoenvironmental Engineering, Vol. 126, No. 4, pp 307-316.
Hoek, E. and Bray, J. W., 1981, Rock Slope Engineering, Revised 3rd Edition, 358 pages.
Keefer, D. K., 1984, Landslide Caused by Earthquakes, Geological Society of America Bulletin, Vol. 95, pp 406-421.
Rock Slope Stability of the VMT 107
Kovari, K. and Fritz, P., 1975, Stability analysis of rock slopes for plane and wedge failure with the aid of a programmable pocket calculator, 16th US Rock Mechanics Symposium, Minneapolis, USA, pp 25-33.
Norrish, N. I. and Wyllie, D.C., 1996, Rock slope stability analysis, Landslide–Investigation and Mitigation, TRB Special Report 247, Chapter 15, pp 391-425. Transportation Research Board, Washington D. C.
Santi, P. M., Elifrits, C. D. and Liljegren, J. A,, 2001, Design and Installation of Horizontal Wick Drains for Landslide Stabilization, Transportation Research Board 1757, pp 58-66.
Singh, J.P. and Associates, 1999, Closure to Geotechnical and Slope Stability Review, Valdez Marine Terminal, Valdez, Alaska.
TAPS, 1973, Revised 1974, Summary Report Geotechnical Aspects, Design Manual for Alaska Pipeline, Appendix Volume 3.
Tart, Rupert G., 2002, Rock Slopes at the Valdez Marine Terminal, Seismic Status Report PowerPoint Presentation, 31 pages.
Tart, Rupert G., Personal Communication, August, 2006.
Verigin, William M. and Harder, Leslie F., Jr., 1989, Seismic Deformation Analysis of Solomon Gulch Dam, R.W. Beck and Associates, Inc., 65 pages.