rock slope assessment at jalan bukit permai,...
TRANSCRIPT

278
Rock Slope Assessment at Jalan Bukit Permai, Cheras
Muhammad Syaifuddin Norazman1, Rini Asnida Abdullah1 1Faculty of Civil Engineering, Universiti Teknologi Malaysia, Malaysia
Keywords: Rock Slope Assessment, stability, rock fall path, kinetic energy
Abstract. The rock slope at Jalan Bukit Permai, Cheras, Selangor is an abandoned quarry before the developer decided to build a residential house. The problem arose when the residential area and the road alignment were built close to the rock slope with very limited buffer zone. This study is important in determining the type of instability and probability mode of failure by using Dips 6.0. The software allows for analyzing and visualizing structural discontinuity analysis based on the kinematic analysis. The software allows for analyzing and visualizing structural discontinuity analysis based on the kinematic analysis. The rock fall simulation was then utilised to simulate the rock fall event using Rocfall 5.0. The software is capable of monitoring in terms of the rock fall path, endpoint location and maximum kinetic energy. The end location will give a useful guideline for the authorities to have a safe buffer zone at that area. Lastly, the rock slope was also assessed for the rockfall hazard rating level as several cases of rock falls have been observed in this area; to take action for the remedial work to be carried out by using Rockfall Hazard Rating System (RHRS). All the results from analysis may provide usefull information for the authorities to take a proper action in this area.
Introduction In rock falls, a rock mass of any size is detached from a steep slope or cliff along a surface on
which little or no shear displacement takes place, and descends mostly through the air either by free fall, leaping, bouncing, or rolling. It is generally initiated by some climatic or biological event that causes a change in the forces acting on a rock.
These events may include pore pressure increase due to rainfall infiltration, erosion of surrounding material during heavy rain storms, freeze-thaw processes in cold climates, chemical degradation or weathering of the rock, root growth or leverage by roots moving in high winds [1].
The slopestability is concerned with many projects in hilly as well as plain terrains, such asfoundations of structures (buildings, bridges, power houses and dams),transportation routes (highways, railways, canals, pipelines and tunnels) andunderground storages and basements.
Then, rock slope stability analyses are routinely performed and directed towards the safe and functional design of excavated slopes. Within the phenomena of slope instability, the detachment of blocks fromsteep walls and their subsequent fall along slopes are particularly important.
Infact, slopes suffering rock falls involve a very high risk, that considerable sums ofmoney are spent each year on their upkeep and improvement [2]. So, the required stability conditions of rock slopes in others country will depending on the type of project andthe consequence of failure.
The analysis of rock fall has always been a challenging task, mainly because of the presence of discontinuities in the rocks masses. Rock or disuse quarry that not been used for the long time ago will be weathered due to time and the condition of that stability is not good as compared to the fresh rock. So, when the rock is weathered and it will become worse if it have a lot of fractured or discontinuities happens on the surface of rock slope. The tendency of the rock slope to fail is high based on that situation and it also may fail in various modes of failure.

279
Problem statementIn Malaysia, many constructions built close or near to the unstable rock slope face. This happened due to the high demand of real estate and also because the location for that residential area is strategic compared to others places. By assuming the rock is strong and safe, the developer usually take least attention on the buffer zone, in which by time rock or disuse quarries may become unstable and can affect the stability of the rock slope. Given the situation, some analysis of the rock fall at Jalan Bukit Permai, Cheras will be carried out to determine the stability condition of the rock forming slope. Objective of study The objectives of this study are as per discussed: 1) To carry out scanline survey at Jalan Bukit Permai, Cheras, Selangor. 2) To determine the instability and probability of failure using kinematic analysis in Dips 6.0 and
simulate the rock fall event using RocFall 5.0. 3) To identify hazard level and stimulate the rock fall stability by using Rockfall Hazard Rating
System (RHRS). Scope of study The scope of study will be focused on: 1) The rock slope at Jalan Bukit Permai, Cheras, Selangor. 2) Empirical analysis using Rockfall Hazard Rating System (RHRS). 3) Numerical analysis of rock falls by using RocFall 5.0 and Dips 6.0 software from RocScience. Previous study
In a rock fall, relatively large fragments of rock become detached and it can free-fall, rolling, sliding or a combination of these methods and make it moves rapidly down a very steep slope under the force of gravity.
Rock failure occurs when the downward movements of material due to gravity and happen imbalance condition between shear stresses and shear strength in the surface of the ground. Therefore, factors that tend to increase the shear stresses or decrease the shear strength increase the chances of failure of a rock. Different processes can lead to reduction in the shear strengths of rock mass [3].
The stability of rock slopes is significantly influenced by the structural discontinuity in the rock in which the slope is excavated. A discontinuity is a plane or surface that marks a change in physical or chemical characteristics in a soil or rock mass.
This discontinuity controls the type of failure which may occur in a rock slope such as plane, wedge, toppling and rotational (circular/non-circular). Table 1 show four different type of failures that are commonly encountered in the rock slopes event.
Rock falls can occur where a rock source exists above slopes steep enough to allow rapid down slope movement of dislodged rocks. Most rock falls originate on slopes steeper than 35 degrees, although rock-fall hazards are found on lesser slopes. Rock-fall sources include bedrock outcrops or boulders on steep slopes such as mountainsides, cliffs, bluffs, and terraces.

280
Table 1: Types Rock Slope Failure Type of failure Description
Planar failure
Planar failure in rock in which a discontinuity
“daylights” the slope face. Sliding without rotation
along a face; single or multiple blocks.
Wedge failure
Wedge failure on two intersection discontinuities with
a line of intersection which “daylights” the slope face.
Wedge failure depends on joint attitude and conditions,
it occurs more frequently than plane failure .
Toppling failure
Toppling failure involves rotation of columns or blocks
of hard rock about a fixed base by discontinuities that
dip steeply into the slope. There are several types of
toppling failure; block toppling, flexural toppling and
block-flexural toppling.
Circular failure
Circular failure occurs in overburden soil, weathered
rock mass or heavily fractured rock mass. These
failures occur along the surface that approaches a
circular shape.
The detailed rating is done to numerically differentiate the risk at the identified sites. Once rated,
the sites can be sorted and prioritized on the basis of their scores. These 12 categories represent the significant elements of a rock fall section that contribute to the overall hazard.
The four columns of benchmark criteria to the right correspond to logical breaks in the increasing risk associated with each category. The category scores are then totalled. Slopes with higher scores present the greater risk.
Accordingly, as the risk increases from left to right, the related scores above each column increase from 3 to 8 1 points. These set scores increase exponentially. An exponential scoring system provides a rapid increase in score that distinguishes the more hazardous sites.
Conclusion is higher scores implies more risk and Table 2 represent a summary sheet of RHRS.

281
Table 2: Summary sheet of the Rockfall Hazard Rating System [4]
Category Slope height
Ditch effectiveness
Average vehicle risk
Percent of decision sight distance
Roadway with including paved shoulders
Rating Criteria and Score Points 3 Points 9 Points 27 Poinst 81
25 ft 50 ft 75 ft 100 ft Good
catchment Moderate catchment
Limited catchment No catchment
25% of the time 50% of the time 75% of the
time 100% of the
time
Adequate site distance, 100% of low design
value
Moderate sight distance, 80% of low design value
Limited site distance, 60% of low design
value
Very limited sight
distance, 40% of low design value
44 feet 36 feet 28 feet 20 feet
Geo
logi
c ch
arac
ter
Cas
e 1
Structural condition
Discontinuous joints,
favorable orientation
Discontinuous joints,
randomorientation
Discontinuous joints, adverse
orientation
Continuous joints,
adverse orientation
Rock friction Rough, irrergular Undulating Planar
Clay infilling or
slickensided
Cas
e 2 Structural
condition
Few differential
erosion features
Occasional erosion features
Many erosion features
Major erosion features
Rock friction Small difference
Moderate difference
Large difference
Extreme difference
Block size 1 FT 2 FT 3 FT 4 Ft
Quantity of rockfall/event 3 cubic yards 6 cubic yards 9 cubic yards 12 cubic yards
Climate and presence of water on slope
Low moderate precipitation; no freezing periods, no
water on slope
Moderate precipitation or short freezing
periods or intermittent water
on slope
High precipitation or long freezing
periods or continual water
on slope
High precipitation
and long freezing
periods or continual water on slope and
long freezing periods
Rockfall history Few falls Occasional falls Many falls Constant falls
Based on the number of study done at rockfall site in towns and countries, rockfall hazard are classified into four levels with an interval of 199 points, in which level one is the most dangerous and level four is the least dangerous and also relevant measures are suggested [4].

282
Table 3: Assessment of Rockfall Hazard and Relevant Measures [5] Risk Degree Score Measure
Level 4 0 – 199 No special measures needed; twice or three times of routine inspection a week.
Level 3 200 – 399 Warning sign needed; four times of routine inspection a week or five times in monsoon; measures should be taken when resources are available.
Level 2 400 – 599 Warning sign, monitoring and speed limit required; daily inspection; inspection immediately after rain; measures should be taken preferentially when resources are available.
Level 1 > 600 Warning sign and speed limit required; close the traffic when necessary; daily inspection; inspection immediately after the rain; measures should be taken preferentially or immediately when resources are available.
Methodology
This research was divided into three stages in order to complete which are preliminary study,
data collection and analysis with conclusion. Background studyThe research was conducted at Jalan Bukit Permai, near the Pangsapuri Intan, Cheras which at there have a lot of rock slope due to this area is from a disused quarry. That road is a main road between Pangsapuri Indah, Monte Bayu Condominium and also the main road to another place. Field workOn 14th of January 2016, a field work was conducted at Jalan Bukit Permai, Cheras from 2pm until 5pm. The reference of that rock slope is UK417344/R004/3/T by Majlis Perbandaraan Ampang Jaya. The field work was carried out by using conventional scanline survey. The scanline are measured which located three different places with different rock slope and slope face, each for three scanlines. The locations of the scanlines were selected as to presence the differences major discontinuities on the rock slope at that area. Data collectionSpecific equipment such as Clar Compass was used to the measurement for dip and dip direction of the discontinuities and the slope face. The Clar compass allows measurement of dip angle and dip direction in one single operation. The height of the slope is too great to use measuring tape; therefore the slope height was measured using the disometer. The width of road also measured using the same equipment to be compared with the length of the endpoint location and the roadway width as the reference to know whether the area of buffer zone is enough or not at that location.
Figure 1: Obtaining Dip Angle and Dip Direction by using Clar Geological Compass

283
Aperture can be measure by using filler gauges. There are several thicknesses of filler a gauge which are inscribed in the gauge and was used by filling them into the aperture. The reading is based on the tightest fit gauge when inserted into the aperture. Whereas the infilling of the aperture can be obtained by observation only.Other data such as the weathering grade, the infilling material and waterflow on the rock slope is done by observation only.
Figure 2: A boulder of rock fall
Figure 3: Presence of water flow and trees
Other data such as the weathering grade, the infilling material and water flow on the rock slope is done by observation only. From the slope face it can be seen that a few loose rock due to the weathering and it broke into a smaller pieces of rock. The presence of water flow and trees can also be measured by the observation. Rocscience SoftwareBased on kinematic considerations and frictional properties of joint planes, Dips 6.0 Software is possible to perform stability analyses such as toppling, planar sliding and wedge sliding on a Stereonet for safety factor analysis. Rocfall 5.0 software is a statistical analysis program designed to assist with assessment of slopes at risk for rockfalls. Energy, velocity and "bounce height" envelopes for the entire slope are determined by the program, as is the location of rock endpoints. Distributions of energy, velocity and bounce height are also calculated along the slope profile [6]. Data Analysis Slope 1 Input Data Based on the scanline, it show that this slope have total of three joint set. Before start to develop the model using Rocfall 5.0 and Dips 6.0 software, first thing to do is input all the data required to that software:

284
Figure 4: Joint System in Slope 1
Table 4:Information Data for First Slope Face
No Type of Information Description / Data 1 Coordinate 3º6’34’’N, 101º45’24’’E on 192º South (S) 2 Slope height 10 meter 3 Slope angle 42º 4 Slope face 80º, 345º 5 Dips orientation Joint 1
(65º, 308º) Joint 2 (45º, 334º)
Joint 3 (82º, 352º)
6 Shape of rock Square (Super ellipse^4,1:1) 7 Dimension block 0.8 m x 0.6 m 8 Roadway width 6.7 meter 9 Slope material Bedrock slope & asphalt road 10 Others info Intersection joint
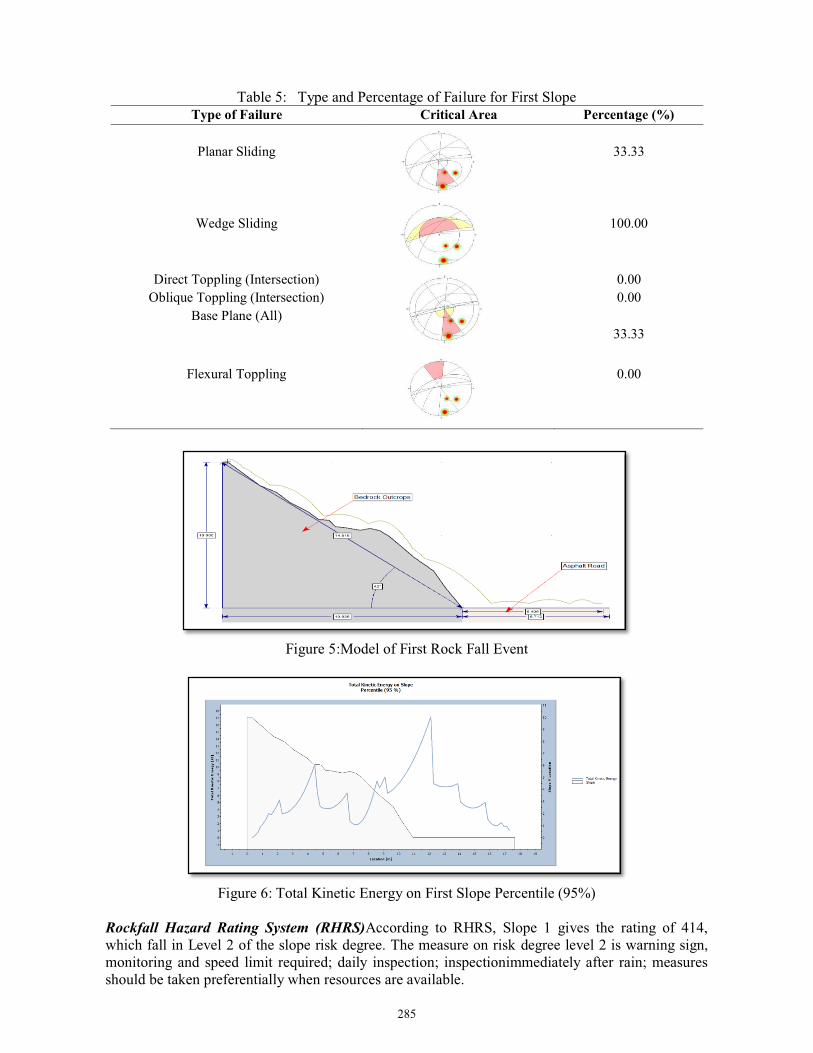
Dips 6.0 SoftwareDIPS software is capable of calculating the probability mode of failure based on the unfavourable orientation of discontinuities. Table 5 summarised the probability of failure for Slope 1. It was found that the potential of instability at Slope 1 are due to planar (33%), wedge (100%) and rock fall (33%). Even though the highest instability is from the wedge type of failure, since the block is small in size, it may fail as the rock fall. In addition, there is also evidence of rockfall during the field visit. Therefore, the next analysis will be performed in the Rocfall software as to simulate the rock fall event and determine the end point location. Rocfall 5.0 Software In Rocfall version 5.0, the rockfall is monitors in terms of the rock fall path, endpoint location and maximum kinetic energy. Figure 5 shows the rockfall path and it was found thatthe endpoint is located at 6.5m from the slope toe. With this end point distance and available buffer zone, the rockfall may hit the passing vehicle. With the maximum kinetic energy of 17 kJ, the passing by vehicle can be damaged from this rockfall event (Figure 6). This kinetic energy is also important for the design of the rock fall barrier.
J 1
J 3
J 2
285
Table 5: Type and Percentage of Failure for First Slope Type of Failure Critical Area Percentage (%)
Planar Sliding
33.33
Wedge Sliding
100.00
Direct Toppling (Intersection) Oblique Toppling (Intersection)
Base Plane (All)
0.00 0.00
33.33
Flexural Toppling
0.00
Figure 5:Model of First Rock Fall Event
Figure 6: Total Kinetic Energy on First Slope Percentile (95%)
Rockfall Hazard Rating System (RHRS)According to RHRS, Slope 1 gives the rating of 414, which fall in Level 2 of the slope risk degree. The measure on risk degree level 2 is warning sign, monitoring and speed limit required; daily inspection; inspectionimmediately after rain; measures should be taken preferentially when resources are available.

286
Table 6 RHRS Parameters and Rating for First Slope (refer Table 2) Parameter Description Value rating Slope height 10 m = 32 ft 3 Ditch effectiveness No Catchment 81 Average vehicle risk 100% of the time 81 Percent of decision sight distance
Limited sight distance
27
Roadway width 6.6 m = 22 ft 81 Structural condition Continues joints, adverse orientation 81 Rock friction Planar 27 Block size 0.8 m = 2.6 ft 27 Climate and presence of water on slope
Low to moderate precipitation 3
Rock fall history Few falls 3 VALUE OF RHRS 414
Slope 2
Input Data Based on the scanline, it show that this slope have total of two joint set. Before start to develop the model, input all the data required:
Figure 7: Joint System in Slope 2
J 1
J 2

287
Table 7: Information Data for Second Slope Face No Type of Information Description / Data 1 Coordinate 3º6’35’’N, 101º45’30’’E on
34º North East(NE) 2 Slope height 16.5 meter 3 Slope angle 80º 4 Slope face 75º, 250º 5 Dips orientation Joint 1 (55º, 210º) Joint 2 (70º, 230º) 6 Shape of rock Square (Super ellipse^4,1:1) 7 Dimension block 0.4 m x 0.4 m 8 Roadway width 6.9 meter 9 Slope material Bedrock slope & asphalt road 10 Others info Hanging more on horizontal joint
Dips 6.0 Software Table 8 summarised the probability of failure for Slope 2. It was found that the potential of instability at Slope 1 are due to planar (50%), wedge (0%) and rock fall (50%). Eventhough the percent of instability is same from the planar and toppling type of failure; it may fail as the rock fall for the toppling condition. Therefore, the next analysis will be performed in the Rocfall software as to simulate the rock fall event and determine the end point location.
Table 8: Type and Percentage of Failure for Second Slope Type of Failure Critical Area Percentage (%)
Planar Sliding
50.00
Wedge Sliding
0.00
Direct Toppling (Intersection) Oblique Toppling (Intersection)
Base Plane (All)
0.00 0.00
50.00
Flexural Toppling
0.00
Rocfall 5.0 Software In Rocfall version 5.0, the rockfall is monitores in terms of the rock fall path, endpoint location and maximum kinetic energy. Figure 8 shows the rockfall path and it was found thatthe endpoint is located at 6.5 m from the slope toe. With this end point distance and available buffer zone, the rockfall may hit the passing vehicle. With the maximum kinetic energy of 22 kJ, the passing by vehicle can be damaged from this rockfall event (Figure 9). This kinetic energy is also important for the design of the rock fall barrier

288
Rockfall Hazard Rating System (RHRS)According to RHRS, Slope 1 gives the rating of 366, which fall in level 3 of the slope risk degree. The measure on risk degree level 3 is warning sign needed; four times of routine inspection a week or five times in monsoon; measures should be taken when resources are available.
Table 9: RHRS Parameters and Rating (refer Table 2) Parameter Description Value rating Slope height 16.5 m = 54 ft 9 Ditch effectiveness No catchment 81 Average vehicle risk 100% of the time 81 Percent of decision sight distance
Adequate sight distance
3
Roadway width 6.9 m = 23 ft 81 Structural condition Continues & intersection joints 81 Rock friction Undulating 9 Block size 0.4 m = 1.3 ft 9 Climate and presence of water on slope
Moderate precipitation 9
Rock fall history Few falls 3 VALUE OF RHRS 366
Slope 3 Input DataBased on the scanline, it shows that this slope doesn’t have any set of joint. Before start
to develop the model, input all the data required:
Figure 8: Model of Second Rock Fall
Figure 9: Total Kinetic Energy on Second Slope Percentile (95%)

289
Figure 10: Joint System in Slope 3
Table 10: Information Data for Third Slope Face
No Type of Information Description / Data 1 Coordinate 3º6’33’’N, 101º45’31’’E on
127º South East (SE) 2 Slope height 18.6 meter 3 Slope angle 80º 4 Slope face 80º, 290º 5 Dips orientation Joint 1
(75º, 200º) 6 Shape of rock Square (Super ellipse^4,1:1) 7 Dimension block 0.3 m x 0.5 m 8 Roadway width 6 meter 9 Slope material Bedrock slope & asphalt road 10 Others info Massive block and have water dipping
Dips 6.0 Software Table 11 summarised the probability of failure for Slope 3. It was found that the potential of instability at Slope 3 are due to planar (0%), wedge (0%) and rock fall (0%). So, the result shows no potential of instability, but based on the visual assessment at that location the remedial work has been installed on site.
Therefore, the next analysis will be performed in the Rocfall software as to simulate the rock fall event and determine the end point location just in case if rock fall occur at that area of slope.
Table 11: Type of Failure for the First Slope Type of Failure Critical Area Percentage (%)
Planar Sliding
0.00
Wedge Sliding
0.00

290
Direct Toppling (Intersection) Oblique Toppling (Intersection)
Base Plane (All)
0.00 0.00 0.00
Flexural Toppling
0.00
Rocfall 5.0 Software In Rocfall version 5.0, the rockfall is monitores in terms of the rock fall path, endpoint location and maximum kinetic energy. Eventhough, there have no potential of mode of instability at this slope, but below that slope are parking vehicle and residential area, the danger is still have and this simulation will assume the endpoint of that rock fall eventif it happen. Figure 11 shows the rockfall path and it was found that the endpoint is located at 6.6 m from the slope toe. With this end point distance and available buffer zone, the rockfall may hit the passing vehicle. With the maximum kinetic energy of 13 kJ, the passing by vehicle can be damaged from this rockfall event (Figure 12). This kinetic energy is also important for the design of the rock fall barrier
Figure 11: Model of Third Rock Fall Event
Figure 12: Total Kinetic Energy on Third Slope Percentile (95%)

291
Rockfall Hazard Rating System (RHRS)According to RHRS, Slope 1 gives the rating of 324, which fall in level 3 of the slope risk degree. The measure on risk degree level 3 is warning sign needed; four times of routine inspection a week or five times in monsoon; measures should be taken when resources are available.
Table 12: RHRS Parameters and Rating (refer Table 2) Parameter Description Value rating Slope height 18.6 m = 61 ft 9 Ditch effectiveness Limited catchment 27 Average vehicle risk 100% of the time 81 Percent of decision sight distance
Adequate sight distance
3
Roadway width 6 m = 20 ft 81 Structural condition Continues & intersection joints 81 Rock friction Undulating 9 Block size 0.3 m = 1 ft 3 Climate and presence of water on slope
High precipitation 27
Rock fall history Few falls 3 VALUE OF RHRS 324
Conclusion Table 13: Summary of slope analyse based on different approaches
Slope Kinematic (Mode of
Instability)
Rockfall Simulation (Endpoint location)
RHRS Level (Description)
Comment / Summary
Slope
1
Planar Sliding, Wedge Sliding,
Base Plane (Toppling)
6.5 meter (Roadway
width: 6.7 m)
Level 2 (Warning sign, monitoring and speed limit required; daily inspection; inspection immediately after rain)
Based on visual observation on rock slope, the rock fall event may occur, it consist 3 mode of instabilities and not enough buffer zone allocated, but it still consider safe due to the existing remedial work (wire mesh and rock bolt.
Slope
2
Planar Sliding,
Base Plane (Toppling)
6.5 meter (Roadway
width: 6.7 m)
Level 3 (Warning sign needed; four times inspection a week; inspection immediately after rain.)
Based on visual observation on rock slope, the rock fall event can occur, it consist 2 mode of instability and not enough buffer zone allocated at there, but still safe due to the remedial work that have been install.
Slope
3
–
6.6 meter (Roadway
width: 6.7 m)
Level 3 (Warning sign needed; four times inspection a week; inspection immediately after rain.)
Based on visual observation on rock slope, there is no sign of instability. Additionally, wire mesh has been installed on site to prevent the rock fall.

292
The fieldwork has been carried out on 14th of January 2016 at Jalan Bukit Permai, Cheras. Three slopes were chosen as the study slopes based on different slope conditions. Data have been collected based on three scanlines as the input parameter for the analysis stage. Through the slope inspection, factors that contribute to the slope instability can be easily indentified. As the slope is an abandon quarry, fractures induced from previous blasting work has reduced the quality of the rock slope. Additional, no proper rehabilitation was performed prior to closing the quarry operation.
Dips software was utilised in identifying the slope instability. It was found slope 1 planar, wedge sliding and base plane toppling; slope 2 consists of planar sliding and base plane toppling while slope 3 doesn’t consists of any mode of instability. Then, rock fall simulations were performed to
monitor the rock fall event in terms of the rock fall path, endpoint location and maximum kinetic energy. This will provide the guideline to the authorities for a safe buffer zone.
Lastly, the Rockfall Hazard Rating System (RHRS) was applied to identify hazard level, from the RHRS it was found slope 1 in level 2 while slope 2 and slope 3 both in level 3. Since no parameter for the remedial work in RHRS, it has misled the hazard level. The existing remedial work has been installed on site, therefore it is suggested that a consistent maintenance work are requires to ensure the safe slope condition. Recommendation
Since the Rocscience software is imperative and practiced to analyze the possibility of rock fall event, it is suggested that for the next research to use the another method of scanline survey such as Terrestrial Digital Photogrammetry (TDP) or Terrestrial Laser Scanning (TLS) which can provide high resolution of 3Digital Terrain Model (DTM) by remote all data collection in order to give a consistency and accurate data of collecting rock parameter on site before it can be analyzed in software due to the field work which are dealing with a lot of uncertainties. The output can be stored in a database as a reference to others researches.
Eventhough, the shape and size of rock cannot be easily predicted so for the further research is suggested to carry out the parametric study on the size and shape of the boulders. The next research is recommend have more study site in order to obtain the consistence and accurate result because there a lot of disused quarries which developer takes part to develop the construction area.
References
[1] Goodman, R. E. (1989). Introduction to rock mechanics. Third edition. New York: John
Wiley and Sons. [2] Spang and Rautenstrauch.(1988). The Shear Strength of Rock Joints in Theory and Practice.
Great Britain: A.A. Balkema Publishers. [3] Wyllie, D. C. (1999). Foundation on Rock, 2nd Edition. UK: Taylor and Francis. [4] Pierson, Lawrence, A. (1991). The Rockfall Hazard Rating System. (Oregon: Oregon
Department of Transportation). [5] Liu, Hu, Y. C. and Chen, C. S. (2007). A new approach for application of rock mass
classification on rock slope stability assessment. Engineering Geology, 89, 129 –43. [6] Roscience. (2011). Stability Analysis for Rock Slope (Version 5.0). Toronto: Rocscience Inc.