rock riprap design for protection of stream · pdf filerock riprap design for protection of...
TRANSCRIPT
ROCK RIPRAP DESIGN FOR PROTECTION OF STREAM
CHANNELS NEAR HIGHWAY STRUCTURES
VOLUME 1 -- HYDRAULIC CHARACTERISTICS OF OPEN CHANNELS
By J.C. Blodgett
U.S. GEOLOGICAL SURVEY
Water-Resources Investigations Report 86-4127
Prepared in cooperation with
FEDERAL HIGHWAY ADMINISTRATION
o i
o00
Sacramento, California
1986

UNITED STATES DEPARTMENT OF THE INTERIOR
DONALD PAUL HODEL, Secretary
GEOLOGICAL SURVEY
Dallas L. Peck, Director
For additional information, write to:
District Chief U.S. Geological Survey Federal Building, Room W-2234 2800 Cottage Way Sacramento, CA 95825
Copies of this report can be purchased from:
Open-File Services Section Western Distribution Branch U.S. Geological Survey Box 25425, Federal Center Denver, CO 80225 Telephone: (303) 236-7476

CONTENTS
PageAbstract ---------------------------------------------------------------- 1Introduction ------------------------------------------------------------ 1Geometric properties of open channels ----------------------------------- 3
Ratio of maximum to mean depth ------------------------------------- 7Changes in channel shape ------------------------------------------- 10Definition of a wide-open channel ---------------------------------- 16Estimation of probable channel geometry ---------------------------- 17
Hydraulic properties of open channels ----------------------------------- 19Determination of Manning's roughness coefficient ------------------- 19Velocity-head coefficient ------------------------------------------ 35Flow expansion and reverse flow ------------------------------------ 38Superelevation at bends -------------------------------------------- 39Supercritical flow ------------------------------------------------- 42
Selected morphologic characteristics of open channels ------------------- 47Depth of scour in alluvial channels -------------------------------- 48Permissible nonscour velocity -------------------------------------- 54Effect of alinement changes on channel slope ----------------------- 55
Summary ----------------------------------------------------------------- 58References -------------------------------------------------------------- 59
ILLUSTRATIONS
Cover Photograph of bank erosion on right bank of Sacramento River at Butte City, California, downstream from SR-16Q crossing (photographed January 1985)
Figure Page1. Aerial photograph of failed rock riprap intended to prevent lateral
erosion on right bank of Sacramento River near Hamilton City, California (September 1984) ----------- _.-----.----__------- 2
2. Cross-sectional sketch of typical channel -------------------------- 6
3. Graph showing comparison of flow depths for various channel shapes - 94. Sketch of comparison of constructed and present channel geometry
at cross section 7, Pinole Creek at Pinole, California ----------- 115. Aerial photograph of Pinole Creek at Pinole, California, showing
study reach and cross sections (October 1, 1982) ----------------- 126. Photograph of Pinole Creek at Pinole, California, showing displaced
rock in channel bottom following flood of January 4, 1982 (photographed March 1982) ---------------------------------------- 15
7. Graph of comparison of Manning's roughness coefficient, n, derivedfrom laboratory and natural channel data ------------------------- 22
8. Graph of magnitude of errors in computed discharge andcross-sectional areas for various velocity-head coefficients(alpha) if the value is assumed to be 1.0 ------------------------ 37
9. Graph of relationship of average velocity and depth forsupercritical flow conditions ------------------------------------ 44
10. Graph of relationship of flow depth, boundary roughness, and sloperequired for supercritical flow ---------------------------------- 46
11. Sketch of riprap layer (blanket) and toe foundation detail --------- 49
III

Figure Page12. Definition sketch of channel bed scour ----------------------------- 5113. Graph of relationship of scour depth to median size of bed material
in channel ------------------------------------------------------- 52
14. Graph of comparison of permissible velocities from Chow (1959) andKeown and others (1977) ------------------------------------------ 56
TABLES
Table Page1. Hydraulic properties and channel geometry of streams as a function
of channel slope ------------------------------------------------- 4
2. Hydraulic properties and channel geometry of streams as a functionof channel curvature --------------------------------------------- 6
3. Suitable side slopes for channels built in various kinds ofmaterials -------------------------------------------------------- 10
4. Summary of channel alinement and slope changes for 1965-82 forPinole Creek at Pinole, California ------------------------------- n
5. Comparison of constructed and present (1982) channel geometry forPinole Creek at Pinole, California ------------------------------- 14
6. Changes in channel geometry of Sacramento River at crosssection 6 near Ord Bend, California, 1972-84, for a discharge of10,000 ft3/s 15
7. Comparison of hydraulic properties and channel geometry for anexisting and proposed new channel -------------------------------- 18
8. Hydraulic data for estimating Manning's roughness coefficient, n --- 239. Comparison of methods to compute Manning's roughness coefficient, n,
based on selected channel conditions ----------------------------- 3210. Manning's roughness coefficient, n, for selected values of mean
depth and median bed material size ------------------------------- 33
11. Manning's roughness coefficient, n, for selected values of channelslope ------------------------------------------------------------ 35
12. Summary of alpha coefficients for various types of cross sections -- 3613. Comparison of water-surface slopes in channels with areas of
flow expansion --------------------------------------------------- 3914. Superelevation of water surface at channel bends ------------------- 4115. Depth of scour for selected sand, gravel, and cobble bed streams --- 5016. Maximum permissible velocities recommended by Fortier and Scobey
and the corresponding unit-tractive-force values converted by the U.S. Bureau of Reclamation ----------------------------------- 54
17. Nonscour velocities for soils -------------------------------------- 55
18. Morphologic and hydraulic properties of Sacramento River betweenChico Landing (site E-10) and Woodson Bridge, California --------- 57
IV

LIST OF SYMBOLS
Term
,b,c Constants
A Area
B Channel bottom width
C Coefficient; Chezy resistance coefficient
d Mean depth
d. Subunit area applicable to point velocityr\
d Critical depth
d Maximum depthm ^
d Depth of scours *
d , N Estimated maximum depth of scour s(,max)
d f N Estimated mean depth of scours(mean) rD Diameter of rock particles
D Selected percentile size of stone measured at the intermediatew
axis
f Darcy-Weisbach resistance coefficient
F Froude number
g Acceleration of gravity
h Water-surface elevation
k Equivalent roughness; energy recovery coefficient; constant
K Conveyance of channel at supercritical flow
L Length of stream channel being considered
n Manning's roughness coefficient
P Total wetted perimeter
Q Total discharge
R Hydraulic radius
R, Mean radius of outside bank of bend dR Mean radius of channel centerline at bend o
S Critical slope
S Energy slope
S f Friction slope
S Channel bed slopeo r
S Water-surface slopew v
T Top width of channel
V
Symbol
v
V
V a
V mz
a
PA
AA
Ah
Ay
LIST OF SYMBOLS (continued)
Term
Point velocity
Velocity
Average velocity in cross section
Maximum point velocity in cross section
Side slope, ratio of horizontal to vertical
Velocity-head coefficient, alpha
Momentum coefficient, beta
Internal angle of channel bend, in degrees
Subunit area applicable to point velocity
Change in water-surface elevation between cross sections
Magnitude of superelevation
CONVERSION FACTORS
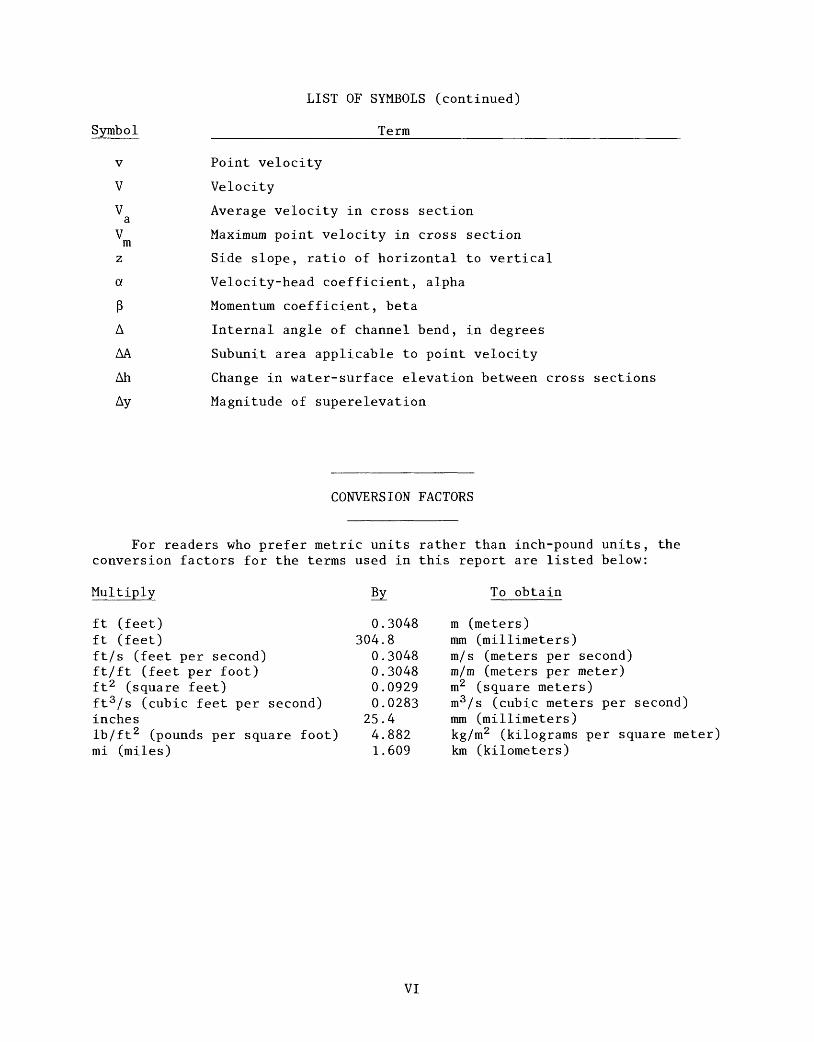
For readers who prefer metric units rather than inch-pound units, the conversion factors for the terms used in this report are listed below:
Multiply By
ft (feet) 0.3048ft (feet) 304.8ft/s (feet per second) 0.3048ft/ft (feet per foot) 0.3048ft 2 (square feet) 0.0929 ft3 /s (cubic feet per second) 0.0283inches 25.4lb/ft2 (pounds per square foot) 4.882mi (miles) 1.609
To obtain
m (meters)mm (millimeters)m/s (meters per second)m/m (meters per meter)m (square meters)m3 /s (cubic meters per second) mm (millimeters)kg/m2 (kilograms per square meter) km (kilometers)
VI

ROCK RIPRAP DESIGN FOR PROTECTION OF
STREAM CHANNELS NEAR HIGHWAY STRUCTURES
VOLUME 1--HYDRAULIC CHARACTERISTICS OF OPEN CHANNELS
By J.C. Blodgett
ABSTRACT
Volume 1 discusses the hydraulic and channel properties of streams, based on data from several hundred sites. Streamflow and geomorphic data have been collected and developed to indicate the range in hydraulic factors typical of open channels, to assist design, maintenance, and construction engineers in preparing rock riprap bank protection. Typical channels were found to have a maximum-to-mean depth ratio of 1.55 and a ratio of hydraulic radius to mean depth of 0.98, which is independent of width. Most stable channel characteris tics for a given discharge are slope, maximum depth, and hydraulic radius.
Volume 2, "Evaluation of Riprap Design Procedures," evaluates seven riprap design procedures now used. A review of field data and design procedures sug gests chat estimates of hydraulic forces acting on the boundary based on flow velocity rather than shear stress are more reliable. Several adjustments for local conditions, such as channel curvature, superelevation, or boundary rough ness, may be unwarranted in view of the difficulty in estimating critical hydraulic forces for which riprap is to be designed. Factors associated with riprap failure include stone size, bank side slope, size gradation, thickness, insufficient toe or endwall, failure of bank material, overtopping, and geomor phic changes in the channel. Success of riprap is related not only to the appropriate procedure for selecting stone size, but also to reliability of estimated hydraulic and channel factors applicable to the site.
Further identification of channel properties and the development of a pro cedure for estimating stone size are presented in volume 3, "Assessment of Hydraulic Characteristics of Streams at Bank Protection Sites."
INTRODUCTION
There are a variety of procedures available for designing rock riprap to protect streambanks from erosion. Diverse results may be obtained, however, depending on the procedure used and assumptions concerning hydraulic and geo morphic conditions. This diversity indicates a need to better understand the various design concepts, and consequences of application of the selected riprap design procedures. Riprap failures (fig. 1) are usually attributed to exces sive hydraulic forces acting on the bank and causing displacement of the stones that comprise the riprap. However, other factors, such as improper gradation or placement, inadequate assessment of probable morphologic changes, or failure of the original bank material may also contribute to the failure.

Rem
nant
s of
roc
k ri
prap
ba
nk p
rote
ctio
n
New
ban
k pr
otec
tion
un
der
cons
truc
tion
FIG
UR
E 1
. A
eria
l ph
otog
raph
of
fail
ed r
ock
ripr
ap i
nten
ded
to p
reve
nt l
ater
al e
rosi
on o
n ri
ght
bank
of
Sac
ram
ento
Riv
er n
ear
Ham
ilto
n C
ity,
Cal
ifor
nia
(Sep
tem
ber
1984
).
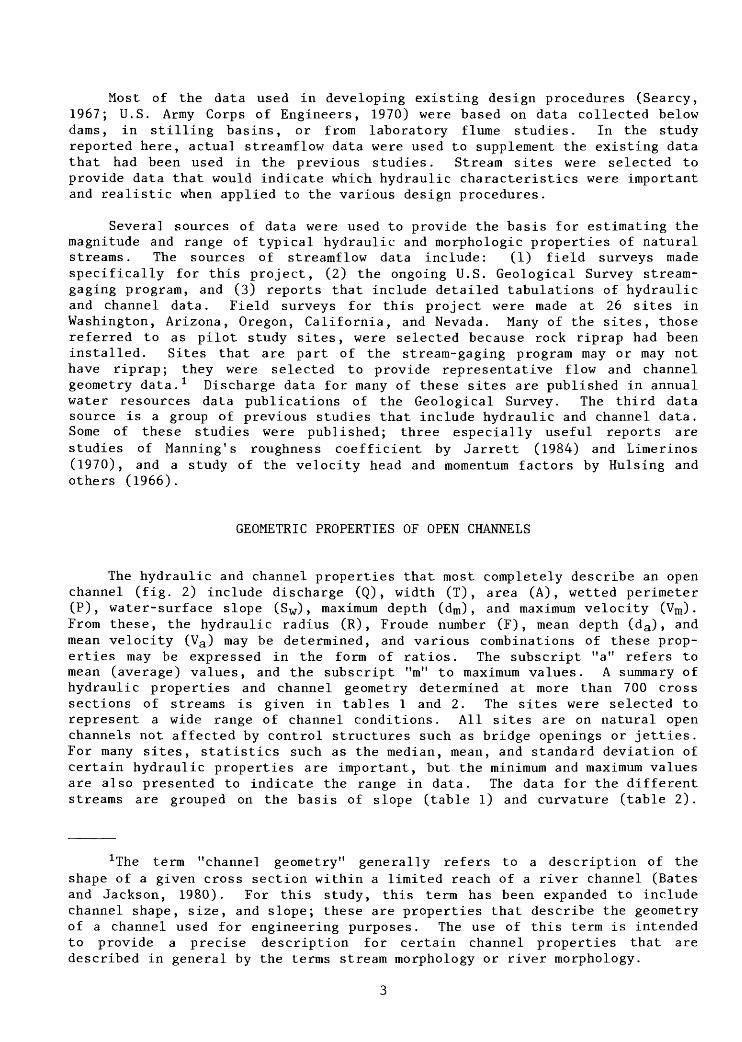
Most of the data used in developing existing design procedures (Searcy, 1967; U.S. Army Corps of Engineers, 1970) were based on data collected below dams, in stilling basins, or from laboratory flume studies. In the study reported here, actual streamflow data were used to supplement the existing data that had been used in the previous studies. Stream sites were selected to provide data that would indicate which hydraulic characteristics were important and realistic when applied to the various design procedures.
Several sources of data were used to provide the basis for estimating the magnitude and range of typical hydraulic and morphologic properties of natural streams. The sources of streamflow data include: (1) field surveys made specifically for this project, (2) the ongoing U.S. Geological Survey stream- gaging program, and (3) reports that include detailed tabulations of hydraulic and channel data. Field surveys for this project were made at 26 sites in Washington, Arizona, Oregon, California, and Nevada. Many of the sites, those referred to as pilot study sites, were selected because rock riprap had been installed. Sites that are part of the stream-gaging program may or may not have riprap; they were selected to provide representative flow and channel geometry data. 1 Discharge data for many of these sites are published in annual water resources data publications of the Geological Survey. The third data source is a group of previous studies that include hydraulic and channel data. Some of these studies were published; three especially useful reports are studies of Manning's roughness coefficient by Jarrett (1984) and Limerinos (1970), and a study of the velocity head and momentum factors by Hulsing and others (1966).
GEOMETRIC PROPERTIES OF OPEN CHANNELS
The hydraulic and channel properties that most completely describe an open channel (fig. 2) include discharge (Q) , width (T) , area (A), wetted perimeter (P), water-surface slope (Sw), maximum depth (dm), and maximum velocity (Vm). From these, the hydraulic radius (R) , Froude number (F) , mean depth (da), and mean velocity (Va ) may be determined, and various combinations of these prop erties may be expressed in the form of ratios. The subscript "a" refers to mean (average) values, and the subscript "m" to maximum values. A summary of hydraulic properties and channel geometry determined at more than 700 cross sections of streams is given in tables 1 and 2. The sites were selected to represent a wide range of channel conditions. All sites are on natural open channels not affected by control structures such as bridge openings or jetties. For many sites, statistics such as the median, mean, and standard deviation of certain hydraulic properties are important, but the minimum and maximum values are also presented to indicate the range in data. The data for the different streams are grouped on the basis of slope (table 1) and curvature (table 2).
1The term "channel geometry" generally refers to a description of the shape of a given cross section within a limited reach of a river channel (Bates and Jackson, 1980). For this study, this term has been expanded to include channel shape, size, and slope; these are properties that describe the geometry of a channel used for engineering purposes. The use of this term is intended to provide a precise description for certain channel properties that are described in general by the terms stream morphology or river morphology.
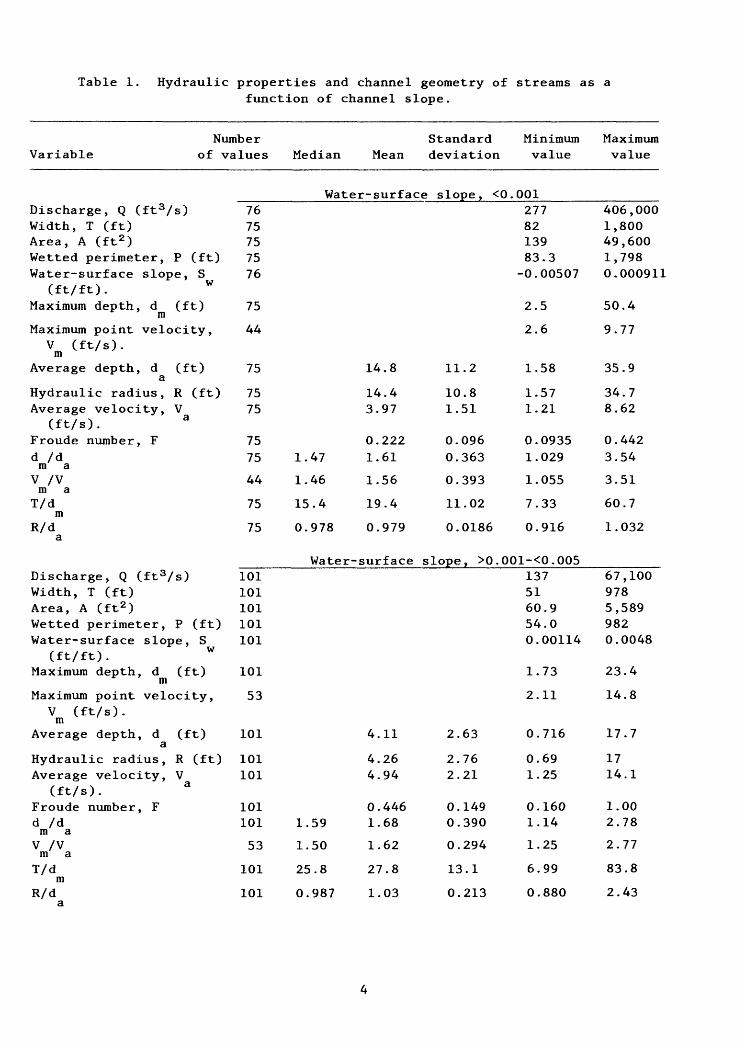
Table 1. Hydraulic properties and channel geometry of streams as afunction of channel slope.
NumberVariable of values Median Mean
Standarddeviation
Water-surface slope, <0.Discharge, Q (ft3/s)Width, T (ft)Area, A (ft2 )Wetted perimeter, P (ft)Water-surface slope, S
(ft/ft). WMaximum depth, d (ft)
mMaximum point velocity,
V (ft/s).m
Average depth, d (ft)a
Hydraulic radius, R (ft)Average velocity, V
(ft/s). aFroude number, Fd /dm a
V /Vm aT/d
mR/d
a
Discharge, Q (ft3/s)Width, T (ft)Area, A (ft2 )Wetted perimeter, P (ft)Water-surface slope, S
(ft/ft). WMaximum depth, d (ft)
mMaximum point velocity,
V (ft/s).m
Average depth, d (ft)a
Hydraulic radius, R (ft)Average velocity, V
(ft/s). aFroude number, Fd /dm a
V /Vm aT/d
mR/d
7675757576
75
44
75
7575
7575
44
75
75
101101101101101
101
53
101
101101
101101
53
101
101
14.8
14.43.97
0.2221.47 1.61
1.46 1.56
15.4 19.4
0.978 0.979
Water- surf ace
4.11
4.264.94
0.4461.59 1.68
1.50 1.62
25.8 27.8
0.987 1.03
11.2
10.81.51
0.0960.363
0.393
11.02
0.0186
Minimumvalue
0012778213983.3-0.00507
2.5
2.6
1.58
1.571.21
0.09351.029
1.055
7.33
0.916
Maximumvalue
406,0001,80049,6001,7980.000911
50.4
9.77
35.9
34.78.62
0.4423.54
3.51
60.7
1.032
slope, >0.001-<0.005
2.63
2.762.21
0.1490.390
0.294
13.1
0.213
1375160.954.00.00114
1.73
2.11
0.716
0.691.25
0.1601.14
1.25
6.99
0.880
67,1009785,5899820.0048
23.4
14.8
17.7
1714.1
1.002.78
2.77
83.8
2.43

Table 1. Hydraulic properties and channel geometry of streams as a function of channel slope (continued).
NumberVariable of values Median Mean
Standarddeviation
Water-surface slope,Discharge, Q (ft3/s)Width, T (ft)Area, A (ft 2 )Wetted perimeter, P (ft)Water-surface slope, S
(ft/ ft). WMaximum depth, d (ft)
mMaximum point velocity,
V (ft/s).m
Average depth, d (ft)a
Hydraulic radius, R (ft)Average velocity, V
(ft/s). aFroude number, Fd /dm a
V /Vm a
T/dm
R/da
120120120120120
120
48
120
120120
120120
48
120
120
4.057
3.897.37
0.6811.69 1.73
1.53 1.71
14.0 19.5
0.954 0.965
3.063
2.874.42
0.3070.297
0.549
17.0
0.122
Water-surface slope,Discharge, Q (ft3/s)Width, T (ft)Area, A (ft 2 )Wetted perimeter, P (ft)Water-surface slope, S
(ft/ ft). WMaximum depth, d (ft)
mMaximum point velocity,
V (ft/s).m
Average depth, d (ft)a
Hydraulic radius, R (ft)Average velocity, V
(ft/s). aFroude number, Fd /dm a
V /Vm a
T/dm
R/da
764764763728297
761
578
763
728763
763761
578
761
728
X 0. 00368 0.00931
7.1 10.3
4.6 6.93
4.7 7.043.8 4.39
0.313 0.3561.49 1.55
1.53 1.61
15.8 19.8
0.974 0.975
7.73
7.592.98
0.2340.284
0.301
13.4
0.102
Minimumvalue
>0.005145.82.896.420.00505
0.93
1.23
0.490
0.450.850
0.1431.18
1.09
2.58
0.729
all0.0260.70.076.42
-0.00507
0.16
0.26
0.1
0.450.232
0.0271.02
1.055
2.58
0.480
Maximumvalue
26,5004751,9864800.1013
19.2
16.7
12.9
11.423.0
1.712.91
3.45
81.7
1.70
598,0002,49286,2702,4930.1013
88.3
16.7
54.7
52.223.0
1.713.54
3.51
83.8
2.43
*Median water-surface slope for 728 sites.

Table 2. Hydraulic properties and channel geometry of streams as afunction of channel curvature.
Number ofVariable values Median Mean
Standarddeviation
Minimumvalue
Maximumvalue
STRAIGHT
Maximum depth, d (ft)m
Maximum velocity, V(ft/s).
d /dm a
V /Vm aT/d
mR/d
a
Maximum depth, d (ft)m
Maximum velocity, V(ft/s).
d /dm a
V /Vm a
T/dm
R/da
98
96
98
96
98
97
44
43
44
43
44
43
11.7
4.73
1.53 1.61
1.50 1.60
13.4 18.1
0.975 0.967
16.5
4.87
1.65 1.69
1.46 1.53
9.67 12.0
0.956 0.950
7.73
3.40
0.423
0.452
11.1
0.104
BEND
11.8
3.46
0.226
0.286
6.77
0.049
1.40
1.07
0.198
1.06
3.09
0.164
1.80
1.01
1.34
1.15
6.25
0.737
43.8
16.7
3.54
3.51
62.9
1.20
48.0
15.9
2.38
2.47
32.4
1.04
BANKFULL ELEVATION
TOP WIDTH (T)
Q ^ ^E1 s
><
I
FIGURE 2. Cross-sectional sketch of typical channel.

The sites in table 1 were selected to represent streams in valleys, moun tains, coastal areas, and deserts, and include both straight and curved reaches. Most streams are perennial, but some are ephemeral. The magnitude of streamflow was limited to bankfull so that overflow areas that require subdivi sion of the cross section were omitted from the analysis. The channel slope was not defined for many of the sites in table 1, but other hydraulic and chan nel data were available. As a result, there are many entries in table 1 for "all water-surface slopes" that are not included in other parts of the table.
The channel slopes given in table 1 generally represent the slope defined over a short reach and reflect localized changes in the channel geometry. A distinction between a short or long reach is dependent on the size of the channel, expressed in terms of discharge or width and the slope. A short reach is considered to vary between 1 and 11 channel widths in length, and a long reach is longer than 11 channel widths. For streams in mountain areas, a short reach may be only one or two channel widths in length, depending on the topog raphy and geology. The value of 11 channel widths was determined on the basis of surveys of 14 streams with slopes up to 0.002, in which the longest continu ous water-surface profiles (without a change in slope) were found to have a median value of 11 channel widths. In this analysis, it was assumed all flows were less than bankfull.
In some cases, the mean velocity in table 1 for a group of slopes is greater than the maximum. The mean velocity was determined on the basis of channel surveys, but measured point velocities at sites with high mean veloc ities were not always available for inclusion in the table. This is indicated by the fact that mean velocities are available for 763 sites, but only 578 sites have measurements of maximum point velocities. Discharges of streams in this sample range from 0.03 to 598,000 ft 3/s (0.00085 to 16,900 m3/s).
Ratio of Maximum to Mean Depth
Based on mean values for the streams in table 1 for all slopes, the following observations concerning channel and hydraulic properties typical of open channels may be made:
o The ratio of maximum depth to mean depth in a reach is 1.55. This ratio appears to be independent of channel slope.
o The ratio of maximum point velocity in a cross section to mean velocity in a reach of channel is 1.61. This ratio shows a slight increase for channels with a steeper slope.
o The ratio (0.98) of hydraulic radius to mean depth is slightly less than 1.0, and is independent of channel width for most open channels. This result supports the common assumption made in analysis of wide-open channels that the hydraulic radius and mean depth may be considered equal.

A summary of channel and hydraulic properties separated on the basis of straight and curved reaches is listed in table 2. Using mean values, these data indicate:
o The ratio of maximum to mean depth for curved channels (1.7) is slightly greater than the ratio for straight channels (1.6).
o The ratio of maximum to mean velocities in a cross section at bends (1.5) is slightly less than the ratio for straight reaches (1.6).
o The ratio of water-surface width to maximum depth for curved reaches is less than for straight reaches. This suggests the average depth of flow at bends is greater than in straight reaches.
o The ratio of hydraulic radius to mean depth is slightly smaller at bends than in straight reaches, a result comparable to the ratio of water- surface width to maximum depth.
The data in tables 1 and 2 are based on a sample of streams that may not include the complete range of channel and hydraulic properties that occur in natural channels. These data, however, provide reasonable guidelines for esti mating properties of natural channels that should be considered in both channel and riprap design.
The flow capacity of a channel is related to the area of flow, to slope, and to boundary roughness. The conveyance and efficiency of a channel cross section increases with an increase in area and a decrease in wetted perimeter. The most efficient channel one of a maximum conveyance has the least wetted perimeter for a given cross sectional area, and has been defined by Chow (1959) as the best hydraulic section. The side slope of a trapezoidal channel that gives the least wetted perimeter has a ratio of horizontal distance to vertical
distance of ^:1 or the value of z is equal to 0.577.
Open channels are usually designed with a trapezoidal cross section with side slopes that are about 2 horizontal to 1 vertical as compared with the hydraulically best slope of 0.577:1. Side slopes of at least 1:1 are usually required to reduce the possibility of bank erosion. Chow (1959, p. 158) and Anderson and others (1970, p. 59) present data (table 3) indicating suitable side slopes for various types of bank material. The recommended side slopes for various base materials should be used even though bank protection is planned, to reduce the possibility of bank failure by shear that is related to excess pore pressure in the bank material. The instability of a soil mass from excess pore pressure occurs when the soil is saturated by water from precipita tion or is inundated during high flows.
In the design or modification of channels that approximate a trapezoidal shape, the possibility should be considered that, in time, the channel geometry will change from the as-built condition. Most likely changes in the channel are scour, fill, and lateral erosion. For most natural channels, the ratio of maximum to mean depth based on an analysis of 761 cross sections is 1.55, as shown in figure 3. This ratio closely approximates the corresponding ratio of 1.5 for a parabolic shaped channel (Chow, 1959). In comparison, the ratio is 1.33 for the hydraulically best trapezoidal channel. The ratio of maximum to mean depth varies from 1.0 for a rectangular channel to 2.0 for a triangular channel.
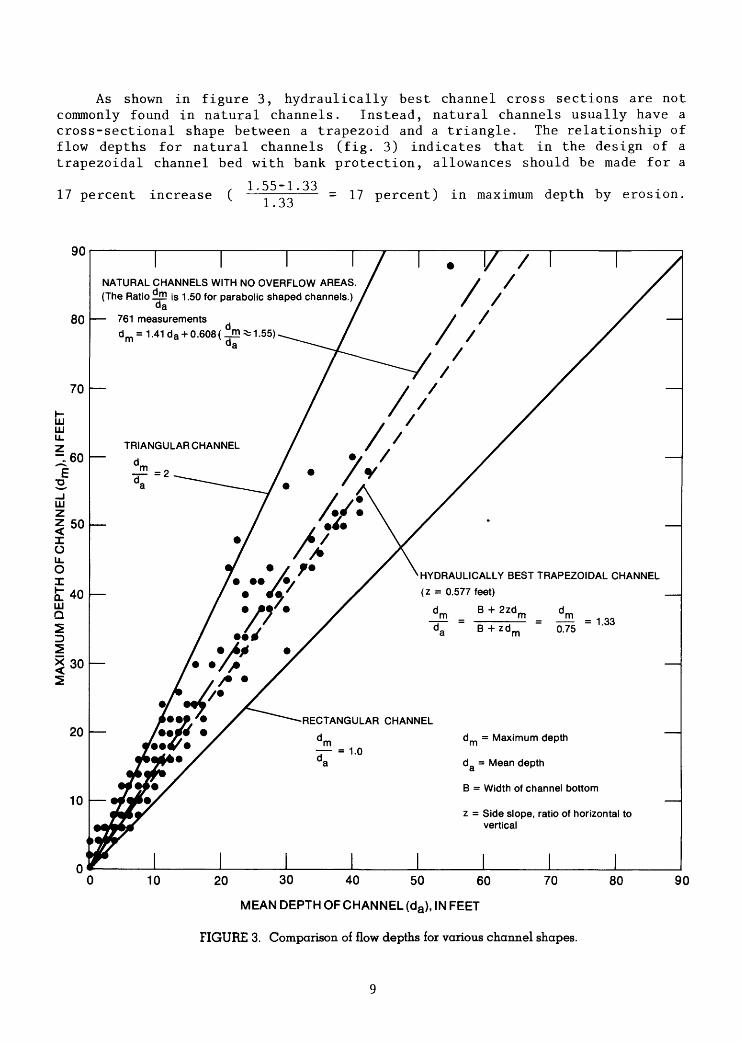
As shown in figure 3, hydraulically best channel cross sections are not commonly found in natural channels. Instead, natural channels usually have a cross-sectional shape between a trapezoid and a triangle. The relationship of flow depths for natural channels (fig. 3) indicates that in the design of a trapezoidal channel bed with bank protection, allowances should be made for a
17 percent increase (1.55-1.33
1.33= 17 percent) in maximum depth by erosion.
90
80
70
TRIANGULAR CHANNEL
d
HYDRAULICALLY BEST TRAPEZOIDAL CHANNEL
(z = 0.577 feet)
m _ md~ ~ = ~
RECTANGULAR CHANNEL
d d = Maximum depth
d = Mean deptha
B = Width of channel bottom
z = Side slope, ratio of horizontal to vertical
NATURAL CHANNELS WITH NO OVERFLOW AREAS
(The Ratio rID is 1.50 for parabolic shaped channels.) da
761 measurementsd m = 1.41 d a + 0.608 (_m=5= 1.55)
d a
20 30 40 50 60
MEAN DEPTH OF CHANNEL (da), IN FEET
FIGURE 3. Comparison of flow depths for various channel shapes.

Table 3. Suitable side slopes for channels built in variouskinds of materials.
[Adapted from Chow, 1959, and Anderson and others, 1970]
Side slopeBase material (horizontal
to vertical)
Rock (solid) Nearly verticalRock (crushed) 1 2^:1Rock (very angular) 1 2^:1Rock (very rounded) 1 3:1Muck and peat soils \°.\
Stiff clay or earth with concrete lining \:\ to 1:1Earth with stone lining, or earth for large channels 1:1Firm clay or earth for small ditches 1^:1Loose sandy earth 2:1Sandy loam or porous clay 3:1
Anderson and others (1970) , and assumes rock riprap D 50 is 0.1 ft. For riprap with D 50 of 0.5 ft or larger, maximum recommended side slope for all types of rock is 2^:1.
Changes in Channel Shape
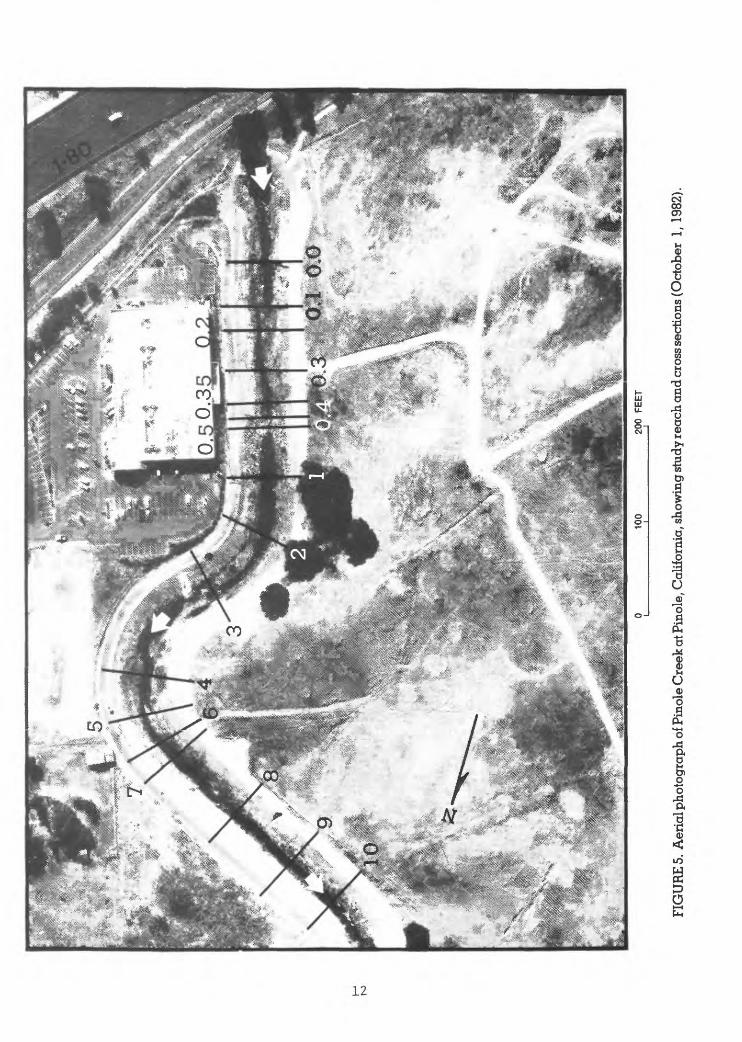
Although most constructed channels are designed to have a trapezoidal cross section, the action of bed scour and bank erosion eventually creates a channel shaped as a parabola or trapezoid with rounded corners, as shown in figure 4. Pinole Creek at Pinole, California, is an example of an altered trapezoidal channel which was designed for a flood discharge of 2,500 ft /s (71 ms /s) with a bottom width of 20 ft (6.1 m) for most of a 1,400-ft (427-m) long reach (fig. 5). Channel banks were designed with a 2:1 side slope.
The Manning's roughness coefficient, n, for the 17 cross sections (fig. 5) ranged from 0.027 to 0.048, based on verification studies made after the Janu ary 1982 flood. A chute structure was constructed in the vicinity of cross section 0.4, causing rapid flow conditions. At cross section 7, which is on a curve (see fig. 5), the channel bed on the outside of the bend scoured about 2 ft (0.6 m). It is significant that, as originally designed and constructed, the ratio dm/da was 1.55, but after the channel bed scoured, the ratio dm/da was 1.87, with the increase in depth ratio attributed to the presence of the riprap placed on both banks that limited scour to the channel bed.
The original channel alinement and slope for this reach were altered when improvements were constructed in 1966. Minor increases in channel sinuosity were noted in 1982, but lateral migration of the channel is generally restric ted by the rock riprap layer. A summary of original, constructed, and present channel conditions is presented in table 4.
10

Table 4. Summary of channel alinement and slope changes for 1965-82 for Pinole Creek at Pinole, California.
Date
1965 (preconstruction) 1966 (constructed channel) 1982 (present conditions)
Average slope, S
0.0056 .00701 .00696
Percent change
+25 0
Sinu
osity
1.31 1.29 1.29
Percent change
-1.5 0
100
95
90LU LU
< 85
LU I 111
80
75
Peak water surface during flood of January 1982
Channel as built in 1966
As built in 1966 :
m = 1.55a
March 1982: d.m
a= 1.87
Channel in March 1982
10 20 30 40 50 60 70 80
DISTANCE FROM LEFT BANK, IN FEET
90 100 110
FIGURE 4. Comparison of constructed and present channel geometry at cross section 7, Pinole Creek at Pinole, California.
11
100
200
FEE
T
FIG
UR
E 5
. A
eria
l pho
togr
aph
of P
inol
e C
reek
at P
inol
e, C
alif
orni
a, s
how
ing
stud
y re
ach
and
cros
s se
ctio
ns (
Oct
ober
1,
1982
).
The channel sinuosity is determined as the ratio of the reach length meas ured along the channel centerline to the reach length measured as a straight (airline) distance between ends of the reach. Channel slopes for pre- and postconstruction conditions were determined from construction plans. The slope for present conditions is based on surveyed water-surface elevations. The data in table 4 indicate that the channel slope has not changed since construction in 1966 even though the slope is steeper than before channel improvements, and flow velocities are higher. Data in table 5 show a comparison of the channel geometry at the time of construction and at the end of the period 1966-82. The comparison is based on the January 1982 flood discharge of 2,250 fts /s (63.68 m3/s), which is 10 percent less than the flow used for channel design.
Referring to table 5, the average area of flow for the 11 cross sections in the straight reach increased by 8 percent and the maximum depth increased from 6.9 to 8.7 ft (2.1 to 2.7 m), or an average of 26 percent. The ratio of maximum to mean depth (dm/da) for the straight and curved parts of the reach increased from about 1.43 to 1.72 (20 percent) and 1.49 to 1.78 (19 percent), respectively. The present ratios of maximum to mean depth (dm/da ) for the straight and curved reaches are 1.72 and 1.78, both of which are greater than the ratio of 1.55 for natural channels (table 1). The increase in the depth ratios is attributed to the bank protection, which effectively restricted lateral erosion so that the water-surface width and hydraulic radius changed less than 7 percent during the study period. The lack of significant change in water-surface width throughout the reach indicates that all of the channel scour and bank erosion occurred near the bottom part of each cross section. The stability of the hydraulic radius for all cross sections indicates that the capacity of the channel is relatively constant, regardless of changes in other hydraulic factors.
An unexpected channel change for Pinole Creek is the reduction in flow area (table 5) at five cross sections in the reach. The reduction in area for these cross sections is attributed to erosion of riprap and subsequent deposi tion downstream on the channel bed (fig. 6).
For comparison, changes in the Sacramento River near Ord Bend channel between 1972 and 1984 have been documented for a discharge of 10,000 fts/s (283 ms/s) (table 6). Based on data collected over this period, the channel thalweg has moved laterally over 100 ft (80.5 m). Unlike Pinole Creek, the channel is not confined and is therefore able to migrate laterally, and a point bar on the right bank is subject to continual scour and fill. For a constant discharge, hydraulic properties such as area, hydraulic radius, water-surface width, and depth, changed up to 87 percent from the mean for the period. The changes noted are related to both low and high flows that occurred during the study period. Because the comparative discharge for the study period is constant but the cross-sectional area shows variations of ±40 percent, the mean velocity must also vary in order to maintain continuity of flow:
Q = AlVi = A2V2 = ...-AnVn (1)
The changes in velocity evidently are related to local changes in slope for a short reach near the site. In general, changes in channel slope are localized in terms of length of reach and are for short periods of time. The subject of channel slope stability is discussed in a later section of this report.
13

Table 5.
Comparison of constructed and present (1
982)
channel geometry for Pinole Creek at Pinole, California.
[Measurements are based on January 1982 flood discharge of 2,250 ft
3/s
]
Constructed (1
966)
Cross
sec
tion
0.0
0.1
0.2
0.3
0.35
0.4
0.5
1 21
31
41
51
61
71
8 9 10
Water-
surface
width,
T(f
t) 53
54
52 56 46 -- -- 58 63 56 58 59 55 56 56
53 52
Area,
A(ft2)
253
258
251
278
188
Rapid
flow
315
346
306
304
304
276
278
273
242
246
Maxi
mum
depth,
d (ft)
m
6.9
6.9
6.9
6.6
5.9
-- -- 8.0
8.2
7.5
7.6
7.4
8.0
7.7
7.0
6.7
6.8
Hydrau
lic
radius ,
R (f
t)
4.54
4.59
4.54
4.72
3.82
-- -- 5.15
5.23
5.08
4.98
4.90
4.82
4.71
4.63
4.40
4.47
Eleva
tion of
thalweg
(ft)
86.4
86.0
85.6
85.3
84.9
~ -- 80.9
80.6
80.4
80.0
79.8
79.6
79.5
79.2
78.8
78.6
Ratio of
maximum
to mean
depth,
d /d
m
a
1.45
1.44
1.46
1.33
1.44
-- -- 1.47
1.52
1.37
1.45
1.46
1.57
1.55
1.44
1.44
1.44
Water-
surface
width,
T(f
t)
51 57 53 51 49 -- -- 62 64 61 57 58 54 55 55 52
55
Area ,
A (ft2)
298
326
259
222
212
Rapid
flow
353
339
298
300
313
268
282
285
259
268
Present
Maxi
mum
depth,
dm (f
t)m
9.9
9.1
8.3
8.2
7.2
-- -- 8.8
9.3
7.7
10.5
8.8
9.5
9.6
8.9
8.9
8.9
(March 1982)
Hydrau
lic
radius,
R (ft)
5.02
5.28
4.60
4.09
4.06
-- -- 5.33
5.01
4.62
4.85
5.00
4.62
4.73
4.77
4.59
4.62
Eleva
tion of
thalweg
(ft)
83.4
83.8
84.2
83.7
83.6
-- -- 80.1
79.5
80.6
77.1
78.4
78.0
77.6
77.3
76.6
76.5
Ratio of
maximum
to mean
depth,
d /d
m
a
1.69
1.62
1.70
1.88
1.66
~ 1.55
1.76
1.58
2.00
1.63
1.95
1.87
1.72
1.79
1.83
Straight re
ach:
Mean
256
6.86
4.54
82.9
1.43
Standard
deviation
33.9
0.54
0.35
3.39
0.041
276
45.6
8.69
0.74
4.71
0.45
81.0
3.39
1.72
0.104
Curved reach:
Mean
Standard
deviation
302
25.3
7.73
0.31
4.95
0.19
80.0
0.44
1 0
.49
.074
299
24.8
9.17
1.07
4.80
0.19
78.5
1.30
1.78
0.196
1Cross sections in
reach with cu
rve.

Table 6. Changes in channel geometry of Sacramento River at cross section 6 near Ord Bend, California, 1972-84, for a discharge of 10,000 ft3/s.
[Winter peak discharge is annual peak discharge for winter preceding survey, movement is from initial point, based on location in 1972]
Thalweg
Survey date
10-17-728-20-739-17-748-24-766-27-78
8-16-7910-10-809-3-818-5-828-10-838-07-84
Winter peak dis charge, Q (ft3/s)
95,80098,500136,00027,300121,000
58,000124,00067,000102,000157,000129,000
Mean
Lateral
movement of thal- weg (ft)
021777383
841119195
107100
Standard deviationRange in data as apercentage of the mean1
Cross sectional area, A (ft2 )
3,2783,0712,0152,2943,319
3,3272,9272,7114,5654,1063,742
3,214746
+42.0-37.3
Hydrau
lic radius, R (ft)
11.78.28.33.94.4
4.56.16.19.96.15.5
6.342.61+84.5-47.9
Width at water surface, T (ft)
273372602585757
733475445452670667
548156+38.1-50.2
Mean depth,
d a
(ft)
12.08.33.33.94.4
4.56.26.110.16.15.6
6.412.70
+87.2-48.5
Maxi
mum depth ,
d (ft) m
19.714.611.511.112.1
12.217.614.818.418.718.5
15.43.30
+27.9-27.9
Ratio,d /d m a
1.641.773.442.832.76
2.692.862.431.823.053.30
2.600.62+33.8-36.9
1The means of the percentage range in data for the six hydraulic factors (A, R, T,and d /d ) are +52.3 and -41.5 percent,
m a
FIGURE 6. Pinole Creek at Pinole, California, showing displaced rock in channel bottom following flood of January 4, 1982 (photographed March 1982).
15
The data in table 6 suggest the hydraulic properties that define the capacity of the channel are constantly changing from year to year in response to various flow conditions. The various hydraulic properties in table 6 may range from the long-term mean by an average of plus 52 and minus 41 percent, with the maximum depth showing the least variation from year to year. These data suggest that hydraulic data surveyed at a site during a given year may vary as much as ±50 percent from the long-term mean. Further, the net change in cross-sectional area between 1972 and 1984 is about +14 percent.
An evaluation of the flow capacity of a channel and the extent of bank protection needed is dependent on the timing of the site survey. Therefore, allowances need to be made for probable changes in time of the hydraulic prop erties that will affect the channel size and shape and associated riprap design. For example, a design for Sacramento River at Ord Bend that was based on surveys in 1972 would be much different from a design based on surveys in 1976. Likewise, mean velocity and boundary stresses based on cross sections surveyed in 1976 would differ from those based on surveys made in 1982.
The data for Pinole Creek and the Sacramento River suggest that certain channel properties may reflect short-term changes but, on the average, remain relatively constant. Thus, selected channel properties, based on average con ditions with an allowance for short-term deviation from the mean, should be used for estimating the channel capacity as part of the bed or bank protection design.
Definition of a Wide-Qpen Channel
A wide-open channel is a channel in which the lateral distribution of velocity in the central part of the cross section is similar to that of a rec tangular channel of infinite width. Velocities in the central part of a cross section are unaffected by the boundary only when the width is about 10 times greater than the depth of flow. Channels with these dimensions are considered to be wide-open, as defined by Chow (1959). The definition of a wide-open channel includes the assumption that the hydraulic radius and mean depth are equal in order to simplify hydraulic analyses.
The ratios of water-surface width to maximum depth (T/d ) given in table 1
range from 2.58 to 83.8 for 761 cross sections, with a mean value of 19.8.
Although table 1 shows a larger T/d for slopes between 0.001 and 0.005, the
difference was not found to be statistically significant, and the ratio is
considered to be independent of the slope. This suggests that channels of
streams on steep mountainous slopes, in terms of the width and depth ratio, are
similar to streams in the lowlands. For channels with slopes flatter than
0.001, the ratio of T/d for all cross sections exceeds 7.3. The ratio ofm
water-surface width to depth exceeds 10 for 80 percent of the cross sections in
table 1, indicating that most channels may be considered as wide-open channels.
16

Estimation of Probable Channel Geometry
The properties that define the channel geometry of a natural stream for a selected discharge and that are least likely to be affected in the long term (5 or more years) are the cross-sectional area, slope for a long reach, and hydraulic radius. Only if the channel is constricted, the alinement straight ened, chute cutoffs occur, or drop structures are installed, will the slope be altered. If the channel is realined or modified, the properties most likely to change are the cross-sectional area, short-reach slope, roughness, width, and depth. The boundary roughness generally decreases because the bed and banks will be smoother and straighter after channel realinement. However, if large size riprap is placed on the channel banks, the boundary roughness may increase. The required channel size that will convey the design discharge in a channel being considered for realinement, bank protection, or alteration in size or shape, may be estimated as follows:
Utilizing the Manning equation,
Q = AR2 /3 S */ 2 (2) n e
where Q = the design dischargen = Manning's roughness coefficientA = cross-sectional areaR = hydraulic radiusS = energy slope, and may be approximated by the water-surface6 slope (S )
w
Rearranging terms in equation 2 gives:
1.486 SW
Because the mean depth and hydraulic radius are approximately equal (table 1), and the area is equal to top width times the mean depth, equation 3 may be modified to
/(1. \
486 TS w
where T = width of water surface d = mean depth
Equation 4 may be used to estimate a design channel that is hydraulically equivalent to the original channel.
Application of equation 4 is illustrated by the following example. Assume the channel properties of an existing stream are to be altered by straightening and then protecting the new banks with rock riprap. A tabulation of the prop erties to be evaluated at the site are listed in table 7, followed by calcula tions for the new channel.
17

Table 7. Comparison of hydraulic properties and channel geometry for an existing and proposed new channel.
Hydraulic and channel geometry properties
Discharge, Q
Slope (water-surface slope, S , is
assumed to equal energy slope, S ).
Sinuosity ratio
Manning's n
Width of water surface, T
Cross-sectional area, A
Mean depth, d
Average velocity, V
Channel side slope, z
Median stone size of riprap, D5O
Old channel
2,250 ft3/s
0.0056
1.31
0.030
52 ft
227 ft2
4.37 ft
9.91 ft/s
variable
none
Proposed new channel
2,250 fts/s
0.00696
1.29
0.045
52 ft
271 ft2
5.21 ft
8.30 ft/s
2:1
1.1 ft
The average depth of the old channel at design discharge is:
= (U.
Qn486 TSw
3/5
- (-\l.
2250 x 0.0303/5
486 x 52(0.0056) 1 = 4.37 ft (1.33 m)
For the new channel, the slope increases because the channel is straight ened, the roughness coefficient increases due to the addition of rock riprap, and assuming T remains constant at 52 ft (15.9 m) , then:
3/5 3/5- / Qn \ _ ( 2250 x 0.045 \ _ n , " Vl.486 TS x / z ; " U.486 x 52(0.00696) 1 'V ~ ^ U
W
This increase in average depth from 4.4 to 5.2 ft (1.3 to 1.6 m) represents an 18 percent increase in average channel depth in order to maintain a similar hydraulic capacity between the old and new channels.
18

HYDRAULIC PROPERTIES OF OPEN CHANNELS
Determination of Manning's Roughness Coefficient
As part of the design or evaluation of channels, it is necessary to esti mate the flow capacity of the channel. All formulas based on continuity of flow that relate the discharge capacity of a channel to its geometry include an estimate of friction losses. The three equations in general use for estimating friction losses are referred to as the Chezy, Manning, and Darcy-Weisbach equa tions, each of which has a resistance coefficient (designated, respectively, as C, n, and f). Each roughness coefficient is a function of the size of the bed and bank material and of other flow obstructions. The coefficients are related as follows:
C _ R1/6 _ 10.8 (5)1.486 n
Each particle in a streambed has a minimum, intermediate, and maximum axis (diameter). A particle at rest on the bed generally has its minimum diameter in the vertical position. The intermediate diameter is the one most easily measurable by either sieve analysis or other methods and is the diameter most commonly used as a measure of roughness. The particle size referred to in the following equations is the intermediate diameter. Anderson and others (1970) present a relationship for estimating Manning's n from median particle size (D 50 ) of the bed material:
n = 0.0395 (D 50 ) 1/6 (6)
This equation was first proposed by Strickler (1923) for estimating Manning's n for streambeds. The relationship has been utilized in studies of roughness coefficients and channel design by a number of other investigators including Normann (1975, p. 9) and Maynord (1978, p. 62).
Another procedure for deriving Manning's roughness coefficient in natural channels is based on a study by Limerinos (1970) of hydraulic and channel prop erties for 11 sites on California streams. In this study, Manning's n values ranged from 0.020 to 0.107. A roughness factor, n/R 1 / 6 , was derived which relates the roughness to the characteristic size of streambed particles and hydraulic radius of the channel. The relationship between roughness factor and particle size using the intermediate diameter and 84 percentile size particle (D84 ) was found to give better results than using the 50 percentile size particle (D 50 ).
19

The equation for relating the roughness factor (n/R 1 / 6 ) to relativesmoothness R/D , is:w'
rV = 0.0926VI = .^°;°9" D (7)W
/ 1Ia+b log R/D I
where f = resistance factor derived by Darcy-Weisbach =
n = Manning's roughness coefficient R = hydraulic radius
D = selected percentile size of bed material measured at the w . ,.intermediate axis
a and b = constants
In riprap design procedures, the 50 percentile size of stones is more commonly used as an indicator of bed and bank material size than is the 84 per centile size. A relationship of the roughness factor and relative roughness of the bed, using the intermediate diameter of stone (Dso) as developed by Limerinos (1970), is described by the equation:
n 0.0926R 1 ' 6 ~ 0.35 + 2.0 log R/Dso (8)
The coefficients a and b in equation 7 are 1.16 and 2.0 if the Dg4 size rather than D 50 size is used. The 1.8 percent loss in accuracy that results when using D 50 instead of D8 4 is not considered significant for channel design pur poses .
Equation 8 is not directly comparable to roughness relationships presented in the National Cooperative Highway Research Program (NCHRP) Report 108 by Anderson and others (1970) or to those in Figure C-4 of Hydrologic Engineering Circular-15 by Normann (1975). In order to make the equations comparable, the equation was modified by substituting mean depth for hydraulic radius and adding the gravitational acceleration.
Since R and d are nearly equivalent, and the constant 0.0926 includes the3.
gravitational acceleration (g), equation 8 can be modified to:
0.5254(9)0.35 + 2.0 log d /D 50
a
Rearranging terms gives the following equation for n:
0.0926 d °' 167= _________a_______ (10)
n 0.35 + 2.0 log d /D 50a
20

The roughness factor ngda1 6 in equation 9 has been used as the basis for comparing the roughness relationship derived by Anderson and others (1970) with bed roughness values obtained during field surveys for Manning's n verifi cation. The variation of Manning's n with the relative roughness of the channel bed was analyzed using hydraulic data for boulder, cobble, gravel, and sand bed channels, assembled by Culbertson and Bawdy (1964), Barnes (1967), Limerinos (1970), and Jarrett (1984), and from various site surveys made during this project. These data are summarized in table 8. An important criterion in selecting sites for this study was that they be relatively free from velocity- retarding influences such as bed and bank forms so that the effect of stone size on the channel bed would be measured. A comparison of relationships between the roughness factor and corresponding bed particle size derived from laboratory flume and natural channel data is shown in figure 7.
The scatter of data points in figure 7 is attributed to one or a combina tion of the following factors:
o Errors in measuring hydraulic properties, such as discharge, slope, cross section, and area, that are used in determining Manning's n.
o Effects of bank shape irregularities, changes in channel alinement, and occasional large boulders or bedrock outcrops that create high local energy losses.
o The size of bed and bank material, expressed as DSQ, may vary throughout the reach but is usually based on data obtained at one cross section.
To simplify the evaluation of data presented in figure 7, roughness factors for gravel bed channels were separated from sand bed channels. This distinction was made by selecting the bed material size (D 5 o) for sand bed channels to be 0.00328 ft or 1 mm, which is the maximum size of coarse sand given by Guy (1969). The range in Manning's roughness coefficient, n, for the data in figure 7 for gravel, cobble, and boulder bed channels is 0.020 to 0.159, and for sand bed channels, the range in Manning's n is 0.013 to 0.046.
Referring to figure 7, curve A is an enveloping curve for upper limits of roughness factor data for gravel bed channels. The median bed material size (D 50 ) is larger than 0.00328 ft (1 mm). This curve is arbitrarily truncated at a relative roughness value (Da/D 50 ) of 35, although the largest ratio measured for gravel or cobble beds was about 185.
Curve B is an enveloping curve for sand bed channels. This curve has been arbitrarily extended into the zone of smaller size gravel bed channels in order to intersect curve A. The variation in roughness factor data for sand channels represents the effect of various bed forms (dune, antidune) as well as varia tions in bed material size.
Curve C is a least squares fit of roughness factor data for gravel and cobble bed channels using procedures similar to those described by Limerinos (1970). Curve D is a least squares fit of roughness factor data for sand bed channels. Curve E is a lower limit curve for gravel, cobble, and boulder bed channels based on laboratory data and published by Anderson and others (1970) and Normann (1975).
21

10.0
CO dCO
T
J
1.0
cc
o K-
O CO
CO
LU z
I CD z>
o
cc
0.10 0.01
Ran
ge in
rou
ghne
ss
coef
ficie
nt,
n, f
or g
rave
l, co
bble
, an
d bo
ulde
r be
d ch
anne
ls = 0.
159
' N
OT
ES
'
=
Dat
a Fr
om F
HW
A S
tudy
,C
ulbe
rtso
n (1
964)
, B
arne
s (1
967)
, Li
mer
inos
(19
70),
and
Jarr
ett
(198
4)
CU
RV
ES
A A
ND
B A
RE
EN
VE
LO
PIN
G L
INE
S
CU
RV
E
= 1
.2/d
a V
0-5
LIM
ITS
1.5
D<
35
50
06
7
= 0
-20
da
35 <
- <
30,
000
D50
0.5
25
da
, 0.
167
Ja0
.79
4 +
1.8
5 lo
g50
185
50
Ave
rage
cur
ve f
or
grav
el b
ed c
hann
els
Tra
nsiti
on z
one
j//
for e
xten
sion
of
[//e
nve
lop
ing
//,
Line
B
=
0.1
05;
n =
0.0
185 d
aO
-167
18
5 <
-2.
< 3
0,0
00
0.16
7,0
.16
7
50
1.5
<-2
- <
18
5
D50
^
n =
0.02
0
From
lab
orat
ory
flum
e st
udy
data
, cu
rve
publ
ishe
d in
HE
C -
15
(Nor
man
n, 1
975)
and
NC
HR
P
Stu
dy 1
08 (
And
erso
n, 1
970)
%«
*
\vp v
««»
*
»
*
«
Ave
rage
cur
ve f
or
sand
bed
cha
nnel
sd
a U
pper
lim
it of
rat
ios
D,-n
for
grav
el b
ed c
hann
els
(D5Q
>0.0
0328
fee
t)
n =
0.04
6
n =
0.01
3
Ran
ge in
rou
ghne
ss
coef
ficie
nt,
n,
for
sand
bed
cha
nnel
s
Low
er l
imit
of r
atio
s pr
for
san
d be
d ch
anne
ls (
D5Q
<0.0
0328
fee
t)_
__
__
__
__
__
T5
Q_
________________________
1010
0
RE
LAT
IVE
RO
UG
HN
ES
S,
1,00
010
,000
100,
000
da
D50
FIG
UR
E 7
. C
ompa
riso
n of
Man
ning
s ro
ughn
ess
coef
fici
ent,
n, d
eriv
ed f
rom
lab
orat
ory
and
nat
ural
cha
nnel
dat
a.

Table 8. Hydraulic data for estimating Manning's roughness coefficient, n.
[Sources: 1, Barnes, 1967; 2, Culbertson and Dawdy, 1964; 3, Limerinos, 1970; 4, sitesurveys made for this project; and 5, Jarrett, 1984. 'so is median bed material size]
Dis- Water- charge, D5O surface
Station name Q (ft) slope,(ft»/») sw
Arkansas River at Pine CreekSchool above Buena Vista, CO
Austin Creek near Cazadero, CA
Blackfoot River near Ovando, MT
Bearing Fork River atGlenwood Springs , CO
Boundary Creek near Porthill, IDBuckeye Creek near Cool, CACache Creek at Yolo, CA
Clark Fork above Missoula, MTClark Fork at St. Regis , IDClear Creek near Lawson, CO
Coeur D'Alene River nearPrichard, ID
Cottonwood Creek below HotSprings near Buena Vista, CO
Crystal River above AvalancheCreek near Redstone, CO
Eagle River below Gypsum, CO
9251,4502,1202,7604,530
672853
1,3704,3005,0506,150
8,200
571650
1,1703,260
2,53014.0
277944
2,180
31,50068,900
53.0214360765
11,300
31.0115281
83.0272530
1,220
204224233577
2,3003,710
1.401.401.401.401.40
.056
.056
.056
.056
.056
.056
.509
.500
.500
.500
.500
.689
.035
.024
.024
.024
.574
.443
.600
.600
.600
.600
.338
.500
.500
.500
.400
.400
.400
.400
.400
.400
.400
.400
.400
.400
0.026.022.020.024.023
.003
.003
.002
.002
.002
.003
.002
.003
.003
.003
.004
.018
.032
.001
.001
.001
.001
.001
.015
.017
.018
.020
.008
.030
.034
.039
.003
.005
.005
.006
.003
.004
.002
.044
.004
.005
Mean depth,
V (ft)
3.64.75.25.86.6
1.92.02.65.26.27.8
6.1
1.71.72.33.3
4.4.5
1.32.64.4
12.816.41.01.52.12.7
7.9
.91.21.4
.731.31.72.3
1.21.41.42.03.54.1
Manning ' s roughness coeffi
cient, n
0.142.132.112.110.086
.038
.036
.036
.032
.036
.060
.036
.044
.041
.043
.032
.073
.016
.023
.022
.020
.030
.028
.138
.084
.084
.067
.032
.159
.097
.052
.045
.046
.041
.028
.054
.051
.052
.050
.041
.037
Source
5
3
1
5
143
115
1
5
5
5
23

Table 8. Hydraulic data for estimating Manning's roughness coefficient, n (continued).
Dis- Water- charge, D5O surface
Station name Q (ft) slope,(ft3/s) S
w
Elk River at Clark, CO
Galisteo Creek at Domingo, NM
Grande Ronde River at La Grande ,OR
Half Moon Creek near Malta, CO
Hermosa Creek near Hermosa, CO
Kaweah River at Three Rivers , CA
Kings River below North Forknear Trimmer, CA
Lake Creek above Twin LakesReservoir, CO
Mad Creek near Steamboat Springs ,CO
Mainbar Canyon Creek nearGreenwood, CA
Merced River at Clarks Bridgenear Yosemite, CA
39.0254
1,0501,410
5.920.530.875.0
119448
1,73011,700
4,620
12.094.0
242
4931,3801,5801,800
405869
1,050
2,4403,2003,6603,690
148830
1,360
48.092.0
331409
276
622666983
1,1701,3401,6501,840
0.700.700.700.700
.001
.001
.001
.001
.001
.001
.001
.001
.305
.300
.300
.300
.800
.800
.800
.800
.520
.520
.520
.530
.530
.530
.530
1.001.001.00
.400
.400
.400
.400
.310
.400
.400
.400
.400
.400
.400
.400
0.003.004.005.005
.004
.004
.004
.004
.004
.004
.004
.004
.004
.011
.016
.015
.019
.014
.014
.014
.008
.007
.008
.004
.005
.005
.005
.019
.023
.024
.026
.026
.027
.023
.054
.002
.003
.002
.003
.002
.002
.002
Mean depth,
da>
(ft)
0.661.52.33.0
.3
.4
.4
.6
.7
.72.14.9
5.4
.51.11.3
2.32.93.13.1
1.41.92.1
3.33.63.73.8
1.32.32.7
.6
.81.52.0
1.7
2.72.83.12.93.63.43.6
Manning 1 s roughness coeffi
cient, n
0.058.052.034.044
.028
.025
.019
.017
.025
.018
.020
.025
.043
.109
.062
.042
.087
.052
.054
.049
.083
.067
.071
.066
.064
.059
.064
.098
.062
.056
.117
.108
.082
.105
.042
.064
.068
.052
.050
.044
.036
.035
Source
5
2
1
5
5
3
3
5
5
4
3
24

Table 8. - Hydraulic data for estimating Manning's roughness coefficient, n (continued)
Dis
charge, Station name Q
(ft3/s)
Merced River at Happy IslesBridge near Yosemite, CA
MF Eel River below Black ButteRiver near Covelo , CA
MF Flathead River near Essex, MT
MF Smith River at Gasquet, CA
MF Eel River below Black ButteRiver, CA
Outlet Creek near Longvale, CA
Piedra River at Piedra, CO
Rio Grande at Angostrua HD nearAlgodones , NM
Rio Grande at Cochiti, NM
211622666983
1,1701,3401,6501,8401,9501,9501,9501,990
1,3509,000
14,500
1,5701,9503,0003,000
1,3509,000
348542
1,1301,2001,2101,6104,4205,64015,200
2,9203,170
902946
1,200
347667709
2,0404,9905,0607,9608,6808,9008,920
Water-
D5O surface (ft) slope,
S w
0.830.830.830.830.830.830.830.830.830.830.830.830
.078
.078
.466
.510
.510
.510
.510
.078
.078
.100
.100
.100
.100
.100
.100
.100
.100
.100
.400
.400
.001
.001
.001
.001
.001
.003
.002
.002
.002
.001
.001
.001
.001
0.008.009.011.010.010.010.011.011.021.021.021.021
.006
.002
.004
.004
.004
.001
.004
.006
.002
.002
.000
.001
.001
.000
.002
.001
.034
.001
.004
.005
.001
.001
.001
.001
.001
.001
.001
.001
.001
.001
.001
.001
.001
Mean depth,
V (ft)
1.52.12.42.62.83.03.03.24.34.54.03.8
1.54.9
8.8
3.13.54.04.1
1.65.0
2.73.33.34.24.13.37.86.2
11.5
3.84.1
1.81.82.0
1.51.71.22.23.64.03.94.84.14.3
Manning ' s roughness coeffi
cient, n
0.100.074.087.070.066.065.058.060.065.060.068.067
.043
.035
.041
.047
.044
.042
.042
.043
.038
.038
.036
.025
.029
.028
.028
.036
.035
.034
.034
.037
.032
.033
.029
.033
.040
.031
.028
.026
.031
.020
.024
.020
.021
Source
3
4
1
3
3
3
5
2
2
25

Table 8. - Hydraulic data for estimating Manning's roughness coefficient, n (continued)
Dis
charge , Station name Q
(ft3/s)
Rio Grande at Otowi Bridge nearSan Ildefonso, NM
Rio Grande at San Antonio , NM
Rio Grande at San Felipe , NM
Rio Grande at Wagonwheel Gap, CO
Rio Grande Floodway at SanMarcial, NM
Rio Grande near Belen, CasaColorada Reach, NM
3091,1305,0007,3209,34010,100
378739
1,4204,0906,1806,9408,500
360414755762
2,2005,0107,5208,2008,5909,1409,720
1512,0604,040
3,8104,5706,4207,710
833930
1,2001,8302,6102,7603,0603,2303,4103,5803,6003,6003,6903,7303,800
Water-
050 surface (ft) slope,
Sw
0.002.002.002.002.002.002
.001
.001
.001
.001
.001
.001
.001
.001
.001
.001
.001
.002
.001
.002
.003
.001
.001
.003
.300
.300
.300
.000
.000
.000
.000
.001
.001
.001
.001
.001
.001
.001
.001
.001
.001
.001
.001
.001
.001
.001
0.002.002.002.002.002.002
.001
.001
.001
.001
.001
.001
.001
.001
.001
.001
.001
.001
.001
.001
.001
.001
.001
.001
.004
.004
.004
.004
.004
.004
.004
.001
.001
.001
.001
.001
.001
.001
.001
.001
.001
.001
.001
.001
.001
.001
Mean depth,
da'
(ft)
1.01.47.28.110.210.2
1.21.71.63.33.94.35.0
1.21.41.51.62.74.54.55.66.05.96.2
.93.04.0
3.64.15.06.2
1.82.71.72.31.81.82.22.01.82.32.21.82.02.32.4
Manning ' s roughness coeffi
cient, n
0.030.026.046.040.046.046
.025
.015
.010
.014
.013
.014
.014
.035
.035
.034
.036
.026
.025
.026
.025
.027
.025
.026
.058
.041
.035
.013
.013
.013
.016
.019
.041
.029
.016
.017
.018
.017
.014
.013
.014
.016
.012
.014
.014
.015
Source
2
2
2
5
2
2
26

Table 8. - Hydraulic data for estimating Manning's roughness coefficient, n (continued)
Dis
charge, Station name Q
(ft3/s)
Rio Grande near Belen, Casa 4,150Colorada Reach, NM Continued 4,160
4,4405,7605,8006,0206,1506,5106,5807,1607,3107,3107,3707,4408,270
Rio Grande near Bernalillo, NM 4251,2701,3201,3401,4101,4301,4301,4301,4501,5401,5702,0602,4002,5702,7302,9104,0004,3004,7204,8305,4406,0406,1006,4906,7307,3608,1608,2008,3108,6809,8109,970
Water-
D5O surface (ft) slope,
Sw
0.001.001.001.001.001.001.001.001.001.001.001.001.001.001.001
.001
.001
.001
.001
.001
.001
.001
.001
.001
.001
.001
.001
.001
.001
.001
.001
.001
.001
.001
.001
.001
.001
.001
.001
.001
.001
.001
.001
.001
.001
.001
.001
0.001.001.001.001.001.001.001.001.001.001.001.001.001.001.001
.001
.001
.001
.001
.001
.001
.001
.001
.001
.001
.001
.001
.001
.001
.001
.001
.001
.001
.001
.001
.001
.001
.001
.001
.001
.001
.001
.001
.001
.001
.001
.001
Mean depth,
V(ft)2.54.62.32.52.32.92.43.32.72.72.83.53.12.93.8
1.01.81.72.11.52.02.01.61.32.21.82.71.42.72.51.23.02.82.43.52.13.42.23.62.23.74.34.02.64.14.42.6
Manning ' s roughness coeffi- Source cient, n
0.015 2.022.014.014.013.014.013.016.014.015.015.014.015.014.015
.028 2
.022
.024
.033
.022
.033
.023
.019
.022
.029
.023
.031
.021
.025
.021
.013
.019
.016
.015
.021
.016
.016
.014
.017
.014
.015
.018
.015
.014
.015
.021
.015
27

Table 8. - Hydraulic data for estimating Manning's roughness coefficient, n (continued)
Dis
charge, Station name Q
(ft3/s)
Rio Grande near Secorro Reach, NM
Rio Puerco near Bernardo, NM
Rock Creek near Darby, MT
Rock Creek Canal near Darby, MT
Sacramento River at E-10 nearChico, CA
Sacramento River at Freeport, CA
697697697874891
3,600
159197259283301313343595603775790
1,4101,4701,6001,9002,0103,4404,3405,4406,620
1,500
138
5,9009,590
21,00027,700
40,00040,70041,90043,60050,10050,20050,40051,20059,60060,10061,60062,40080,00080,20090,100
Water-
Dso surface (ft) slope,
S w
0.001.001.001.001.001.001
.001
.001
.001
.001
.001
.001
.001
.001
.001
.001
.001
.001
.001
.001
.001
.001
.001
.001
.001
.001
.722
.689
.072
.072
.072
.072
.001
.001
.001
.001
.001
.001
.001
.001
.001
.001
.001
.001
.001
.001
.001
0.001.001.001.001.001.001
.001
.001
.001
.001
.001
.001
.001
.001
.001
.001
.001
.001
.001
.001
.001
.001
.001
.001
.001
.001
.043
.021
.001
.000
.001
.001
.000
.000
.000
.000
.000
.000
.000
.000
.000
.000
.000
.000
.000
.000
.000
Mean depth ,
da>
(ft)
1.0.7
1.51.11.22.3
1.01.21.41.41.21.31.51.92.02.22.02.62.92.63.22.63.23.53.97.0
3.7
1.3
7.47.98.610.3
26.526.826.627.028.128.028.628.629.730.130.330.633.934.135.9
Manning' s roughness coeffi
cient, n
0.014.013.021.017.018.012
.015
.017
.018
.016
.012
.015
.016
.012
.016
.013
.012
.014
.014
.014
.014
.012
.014
.019
.020
.023
.075
.060
.047
.022
.025
.026
.028
.029
.029
.029
.029
.028
.028
.029
.029
.029
.029
.029
.031
.031
.032
Source
2
1
1
4
4
28
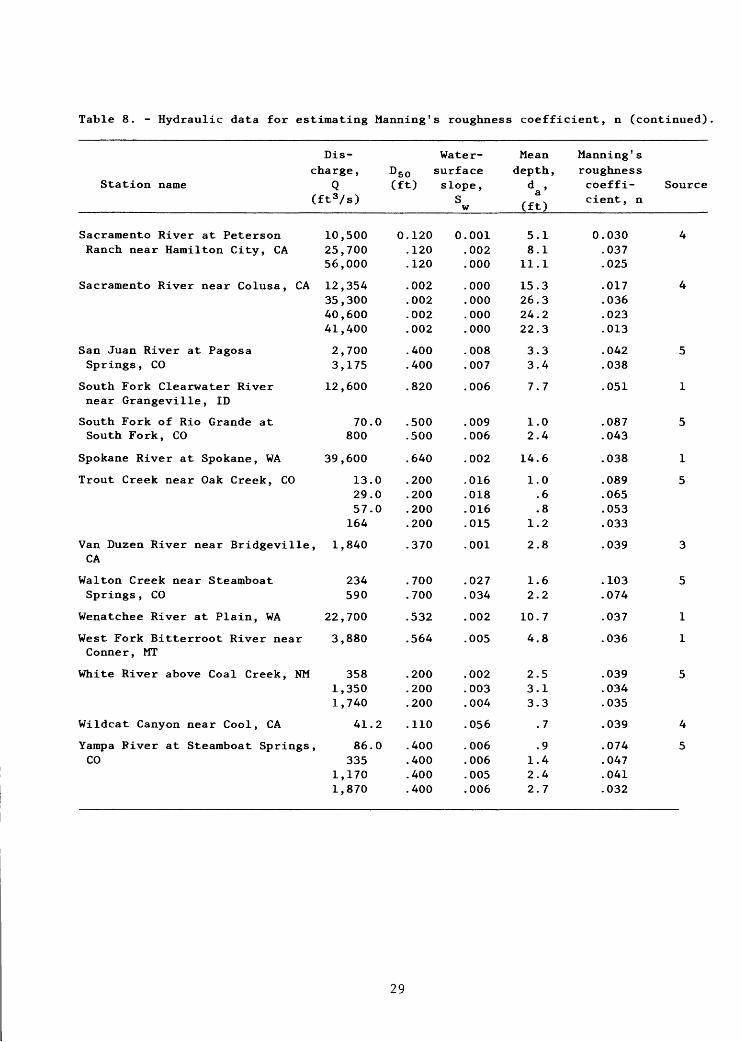
Table 8. - Hydraulic data for estimating Manning's roughness coefficient, n (continued)
Dis
charge , Station name Q
(ft3/s)
Sacramento River at PetersonRanch near Hamilton City, CA
Sacramento River near Colusa, CA
San Juan River at PagosaSprings, CO
South Fork Clearwater Rivernear Grangeville, ID
South Fork of Rio Grande atSouth Fork, CO
Spokane River at Spokane , WA
Trout Creek near Oak Creek, CO
Van Duzen River near Bridgeville,CA
Walton Creek near SteamboatSprings , CO
Wenatchee River at Plain, WA
West Fork Bitterroot River nearConner, MT
White River above Coal Creek, NM
Wildcat Canyon near Cool, CA
Yampa Piver at Steamboat Springs ,CO
10,50025,70056,000
12,35435,30040,60041,400
2,7003,175
12,600
70.0800
39,600
13.029.057.0164
1,840
234590
22,700
3,880
3581,3501,740
41.2
86.0335
1,1701,870
Water-
D5O surface (ft) slope,
Sw
0.120.120.120
.002
.002
.002
.002
.400
.400
.820
.500
.500
.640
.200
.200
.200
.200
.370
.700
.700
.532
.564
.200
.200
.200
.110
.400
.400
.400
.400
0.001.002.000
.000
.000
.000
.000
.008
.007
.006
.009
.006
.002
.016
.018
.016
.015
.001
.027
.034
.002
.005
.002
.003
.004
.056
.006
.006
.005
.006
Mean depth,
da>
(ft)
5.18.111.1
15.326.324.222.3
3.33.4
7.7
1.02.4
14.6
1.0.6.8
1.2
2.8
1.62.2
10.7
4.8
2.53.13.3
.7
.91.42.42.7
Manning' s roughness coeffi
cient, n
0.030.037.025
.017
.036
.023
.013
.042
.038
.051
.087
.043
.038
.089
.065
.053
.033
.039
.103
.074
.037
.036
.039
.034
.035
.039
.074
.047
.041
.032
Source
4
4
5
1
5
1
5
3
5
1
1
5
4
5
29
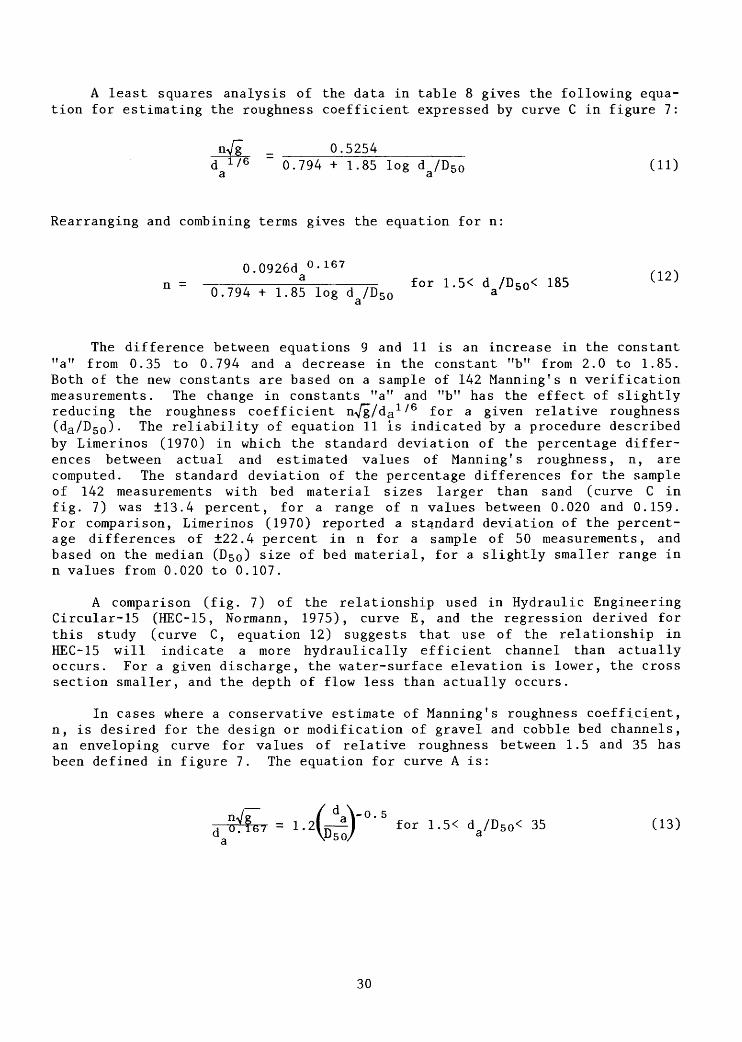
A least squares analysis of the data in table 8 gives the following equa tion for estimating the roughness coefficient expressed by curve C in figure 7:
0.52540.794 + 1.85 log d /D 50 (11) a
Rearranging and combining terms gives the equation for n:
0.0926d °- 1673 185
0.794 + 1.85 log d /D 503
The difference between equations 9 and 11 is an increase in the constant "a" from 0.35 to 0.794 and a decrease in the constant "b" from 2.0 to 1.85. Both of the new constants are based on a sample of 142 Manning's n verification measurements. The change in constants "a" and "b" has the effect of slightly reducing the roughness coefficient nVg/da 1/6 for a given relative roughness (da/D50 ). The reliability of equation 11 is indicated by a procedure described by Limerinos (1970) in which the standard deviation of the percentage differ ences between actual and estimated values of Manning's roughness, n, are computed. The standard deviation of the percentage differences for the sample of 142 measurements with bed material sizes larger than sand (curve C in fig. 7) was ±13.4 percent, for a range of n values between 0.020 and 0.159. For comparison, Limerinos (1970) reported a standard deviation of the percent age differences of ±22.4 percent in n for a sample of 50 measurements, and based on the median (D 50 ) size of bed material, for a slightly smaller range in n values from 0.020 to 0.107.
A comparison (fig. 7) of the relationship used in Hydraulic Engineering Circular-15 (HEC-15, Normann, 1975), curve E, and the regression derived for this study (curve C, equation 12) suggests that use of the relationship in HEC-15 will indicate a more hydraulically efficient channel than actually occurs. For a given discharge, the water-surface elevation is lower, the cross section smaller, and the depth of flow less than actually occurs.
In cases where a conservative estimate of Manning's roughness coefficient, n, is desired for the design or modification of gravel and cobble bed channels, an enveloping curve for values of relative roughness between 1.5 and 35 has been defined in figure 7. The equation for curve A is:
1.5< d/D50 < 35 (13)d °- lb ' i '"\D^n/ a a
30

The location of this relationship in figure 7 is very near the upper 95 percent confidence limit of regression described by equation 11. The corresponding equation for Manning's roughness coefficient is:
0 911 f) 0.50for 1.5< da/D50 < 35 (14)
Sand-bed channels are defined as those in which the median grain size (D 50 ) is equal to 0.00328 ft (1.0 mm) or smaller. The boundary roughness of sand bed channels is related to bed form and depth of flow as well as to grain size. Because the bed form is dependent on the flow and viscosity, its effect on Manning's roughness cannot be predicted. Therefore, curve B has been drawn as an enveloping curve in figure 7 for values of da /D50 between 35 and 30,000. The enveloping curve for estimating the roughness coefficient of sand bed chan nels is:
7 = 0.20 for 35< d /D 50< 30,000 (15)_j (j I Q / *_* * *_» j_v^o_ *«/i-»- v*
a
The equation for estimating the upper limiting value of Manning's rough ness coefficient, n, for sand channels with mobile beds is then:
n = 0.0352 d °- 167 for 35< d /D50 < 30,000 (16) a a
This equation will generally give conservative estimates of n for channels with variable roughness due to changes in bed form.
For average roughness conditions in channels with sand beds, the equation for estimating Manning's coefficient, n, is defined by curve D in figure 7 as:
n = 0.0185 d °- 167 for 185< d /D 50 < 30,000 (17) a a
The enveloping curve (curve B) for sand bed channels (fig. 7) was extended to intersect curve A at da/D50 of 35.
A comparison of Manning's roughness coefficient, n, estimated by methods described in Hydraulic Engineering Circular-15 (Normann, 1975), in Limerinos (1970), and in procedures derived in this study, is given in table 9. The comparison is based on an assumed hydraulic radius, R, of 4.7 that represents a relatively small channel with a water-surface width, T, of 54 ft (16.4 m); area, A, of 275 ft2 (25.6 m2 ); discharge, Q, of 2,250 fts /s (63.68 m3 /s); aver age depth, d a , of 5.09 ft (1.56 m) ; and maximum depth, dm, of 8.3 ft (2.5 m).
31

Table 9. Comparison of methods to compute Manning's roughness coefficient, n,based on selected channel conditions.
[Mean depth, d = 5.09 ft]3.
Manning's roughness coefficient, nD50 Bed HEC-15 Limerinos(ft)
0.0030.010.10.250.50
0.801.01.52.0
material (Equation6)
Coarse sand 40.Very fine gravel 4 .Coarse gravel 4 .Small cobbleLarge cobble
Large cobbleBouldersBouldersBoulders
Equations applicable for
1Limits: 1.5< d /D«. n a 502Limits: 1.5< d /D 5O
a3Limits: 35< d /D5O<
i
015018027031035
038040042044
median
< 185.
< 35.
30,000
(EquationID 1
40.0184 .0214 .032.041.052
.064
.071
.086
.105
size (D50 )
.
Blodgett Enveloping curve(Equation (Equa-
12) i
40.0184 .0214 .031.038 0.046
.053
.058
.069
.079
of bed material
tion13) 2
--
.061
.087
.110
.123
.150
.174
:
(Equation15) 3
0.046.046.046----
--------
3.
4For comparison of equations.
To simplify the application of the various equations for estimating
Manning's coefficient, n, table 10 has been prepared. This table presents
values of Manning's n for selected mean depths and median bed material size.
The table is based on curve C in figure 7 (eq. 12) for gravel and cobble bed
channels with roughness coefficient values between 1.5 and 185. For sand bed
channels with larger values of the coefficient, (185< d /D 5o< 30,000), the3
curve D (eq. 17) has been used. Because three variables are involved in appli
cation of these equations, the table has been arranged using arbitrary values
of mean depth and median size of bed material. Application of data for site
conditions not included in the table may be interpolated. For the full range
of relative roughness (d /D 50 in fig. 7), bank and alinement conditions as wella
as bed material size at the site should be considered in selecting Manning's n.
32

Table 10.
Manning's roughness coefficient, n, for selected values of
mean depth and median bed material size.
u>
u>
Mean
Median diameter
depth,
d Fine
Medium
Coarse
a ,
<. sand
sand
sand
C tj
0.0005
0.001
0
1 0.019
0.019
02
.021
.021
3 .022
.022
4 .023
.023
5 .024
.024
6 .025
.025
7 .026
.026
8 .026
.026
9 .0
27
.027
10
.027
.027
12
.028
.028
14
.029
.029
15
.029
.029
20
.031
.031
25
.032
.032
30
.033
.033
35
.033
.033
40
.034
.034
Relationships used
.005
.019
.021
.022
.023
.024
.025
.026
.026
.027
.027
.028
.029
.029
.031
.032
.033
.033
.034
Fine
0.010
0
0.021
0.021
.022
.023
.024
.025
.026
.026
.027
.027
.028
.029
.029
.031
.032
.033
.033
.034
gravel
.015
0
.022
0
.022
.022
.023
.024
.025
.026
.026
.027
.027
.028
.029
.029
.031
.032
.033
.033
.034
.020
.024
.023
.023
.023
.024
.025
.026
.026
.027
.027
.028
.029
.029
.031
.032
.033
.033
.034
of bed material, D5O
Medium
gravel
0.10
0.035
.032
.032
.031
.031
.031
.030
.030
.030
.030
.030
.030
.030
.031
.032
.033
.033
.034
, in
Coarse
Small
gravel
cobble
0.20
0.
0.044
0..039
.038
.036
.036
.035
.035
.035
.035
.035
.034
.034
.034
.034
.034
.034
.034
.034
30 053
045
042
041
040
039
038
038
038
038
037
037
037
037
036
036
036
036
feet
Medium
cobble
0.40
0.061
.050
.046
.044
.043
.042
.041
.041
.041
.040
.040
.039
.039
-039
.039
.038
.038
.038
Large
cobble
0.50
0.068
.054
.050
.047
.046
.045
.044
.053
.043
.042
.042
.042
.041
.041
.040
.040
.040
.040
Boulders
1.0
0.117
.077
.066
.061
.058
.056
.054
.053
.052
.051
.050
.049
.049
.048
.047
.046
.046
.046
1.25
0.151
.089
.074
.068
.064
.061
.059
.057
.056
.055
.054
.053
.052
.050
.050
.049
.048
.048
1.50
0.198
.101
.082
.074
.069
.066
.063
.061
.060
.059
.057
.056
.055
.053
.052
.051
.050
.050
in preparing table:
0.0926 d
o.ie?
Equation 12
Equation 17
n =
n =
0.794+1.
0.0185d °
a
a85 log d
167
for
a/Dso
185<
f ̂
1tor 1
d /D50
<a
5<
d /D
50<
1a
30,000
QC
OD

The procedures by Strickler (1923) and Limerinos (1970) and the relation ships shown in figure 7 require streambed particle-size information. Jarrett (1984) suggests that a relationship exists between resistance, expressed as Manning's n, and channel slope, and that there is an interrelationship between channel slope and particle size of the bed material in gravel, cobble, and boulder streams. With steeper slopes, and predominantly coarse bed material and limited amounts of sand, the finer particles are removed, leaving larger particles, which in turn provide greater resistance to movement and an increased friction slope. Using a sample of 21 sites on Colorado streams, Jarrett (1984) derived a relationship between bed roughness, friction slope, and size of channel as:
n - 0.395 S f °- 38 R-o.ie (18)
where n - Manning's roughness coefficient, n
S = friction slope
R = hydraulic radius
By substituting water-surface slope (S ) for S and mean depth (d ) for R, equation 18 may then be modified to:
n = 0.395 S °- 38 d -°- 16 (19) w a
The standard deviation of the percentage differences using equation 18 was 31 percent, compared with 23 percent for the Limerinos approach and 13 percent based on the 142 measurements in this study.
The method suggested by Jarrett (1984) is based on bed material sizes (D 5 o) larger than 0.2 ft, which is very coarse gravel or cobble (Guy, 1969). Equation 19 is considered applicable to natural channels without overbank flow and with stable beds of gravels, cobble, and boulders, and slopes between 0.002 and 0.034. The hydraulic radius (R) or mean depth (da ) may vary between 0.5 and 7 ft. Results of Jarrett's study indicate that values of n do not vary significantly for hydraulic radius (R) or mean depths (d a ) greater than 7 ft, suggesting equation 19 can be extended to larger flows or da/D50=185, provided the channel bed remains stable; the procedure is not recommended, however, for da /D 50 values greater than 35.
Table 11 has been prepared to simplify the estimation of Manning's n values for different flow depths and channel slopes. Because the relationship given by equation 19 is not applicable to sand bed channels, values of n less than 0.028 are not given. The procedure for estimating n based on channel slope is not recommended for use in channels with unstable sand beds. In addi tion, values of n for mean depths greater than 7 ft are based on an extension of the relationship given by equation 19, and may not be reliable.
34

Table 11. Manning's roughness coefficient, n, for selected values of channel slope.
[Adapted from Jarrett, 1984. Equation given by Jarrett is
n=0.395S 0<38 R" 0>16 . Because R is approximately equal to d , i a
and S is approximately equal to S , the equation has been
modified to n = 0.395S °- 38 d "°- 16 . Values of n for meanw a
depths greater than 7 ft are based on an extension of the
relationship given by equation 19 and may not be reliable]
Mean _______________Channel slope (ft/ft)_______________depth, 0.001 0.003 0.005 0.007 0.100 d (ft)
1 0.028 0.043 0.052 0.059 0.1632 .038 .047 .053 .1463 .036 .044 .050 .1364 .034 .042 .047 .1305 .033 .040 .046 .1266 .033 .039 .044 .1227 .031 .038 .043 .119
89
101214152025303540
.031
.030
.030
.029
.028
.028
.037
.037
.036
.035
.034
.034
.032
.031
.030
.029
.029
.042
.042
.041
.040
.039
.038
.037
.036
.034
.034
.033
.117
.114
.112
.109
.107
.105
.101
.097
.094
.092
.090
Velocity-Head Coefficient
Channel bank and bed irregularities, variation in roughness, channel cur vature, and obstructions cause the velocity of a stream to vary nonuniformly in a cross section. The variation may be in both the vertical and horizontal planes, and may cause the value of velocity head or kinetic energy, as computed from the expression V2 /2g, to be lower than actually occurs in the cross sec tion. The actual velocity head may be expressed as a V2 /2g where alpha is the velocity-(energy-)head coefficient. The derivation of the velocity-head coefficient a (Chow, 1959) is given by the equation:
35

a = A I(v3AA)V 3A a
(20)
where v = point velocity
d = subunit area applicable to the point velocityr\
M = approximate subunit area applicable to the point velocity
V = average velocity in cross section aA = area of cross section
The coefficient is generally assumed to be 1.0 for unit channels. Hulsing and others (1966) show that this is seldom the case, because velocity is not dis tributed uniformly within a cross section. Factors that cause nonuniform dis tribution of velocity are size and arrangement of bed material, vegetation, channel geometry, bends, and obstructions. A summary of the coefficients com puted by Hulsing and others for 645 discharge measurements in natural channels and canals is given in table 12, which shows median values of 1.40 where the flow was confined to the main channel and 1.46 where overbank flow occurred. Figure 8 shows the error that can result for different values of the true alpha if alpha is assumed to be 1.0. For example, a discharge that was computed to be 10,000 ft3/s for an alpha of 1.0 in a reach that contracts 10 percent in area would be 6 percent larger than if an alpha of 1.4 had been used. If the reach were expanding by 10 percent, the computed discharge would be 6 percent smaller than if an alpha of 1.4 had been used.
Table 12. Summary of alpha coefficients for various types ofcross sections.
[Modified from report by Hulsing and others, 1966]
Type of cross sectionNumber of
measurementsAlpha coefficient (a)
Minimum Maximum Median
Natural channel without overbank 402flow.
Canal or manmade channel 73 Natural channel with overbank 170
flow.
1.09
1.031.18
2.90
1.762.99
1.40
1.101.46
36

UJ 0 CC
+20
O +10
§zss585 SQ. °2 zo ~~ o
O CC CC UJ
-20
Flow expanding
10 percent A = 0.9A
Flow contracting
10 percent
A =1.1A
10 100 1,000
DISCHARGE, IN CUBIC FEET PER SECOND
10,000 100,000
+20
100 1,000
DISCHARGE, IN CUBIC FEET PER SECOND
10,000 100,000
A 1 IS UPSTREAM CROSS SECTION
A2 IS DOWNSTREAM CROSS SECTION
FIGURE 8. Magnitude of errors in computed discharge and cross-sectional areas for various velocity- head coefficients (alpha) if the value is assumed to be 1.0.
37
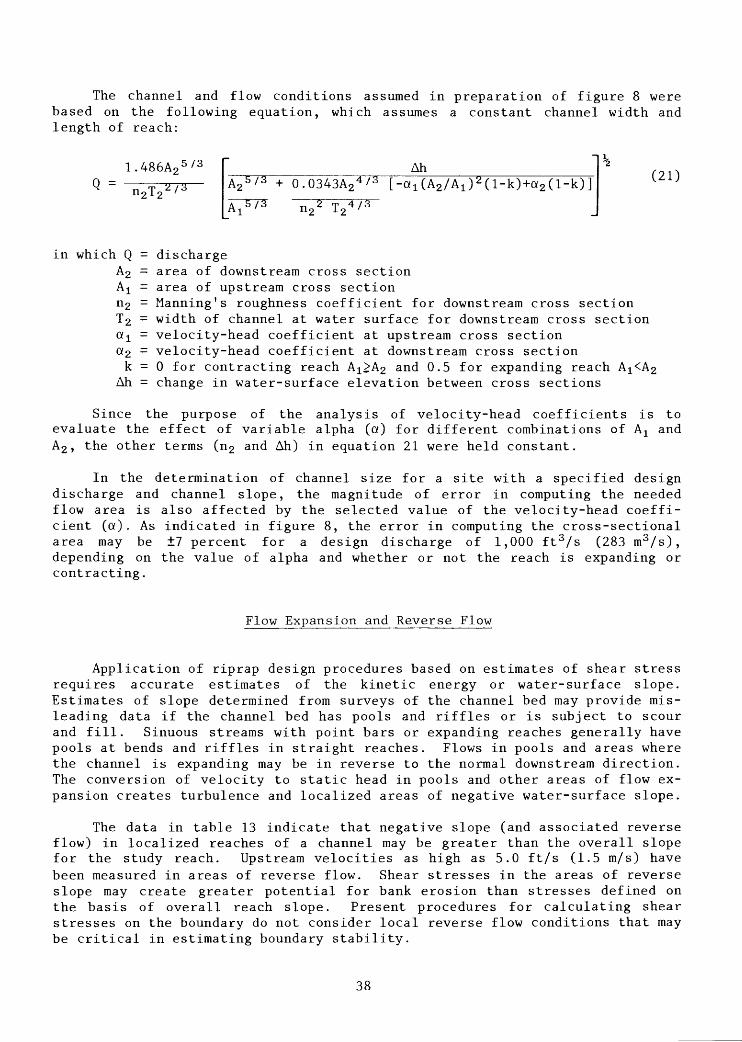
The channel and flow conditions assumed in preparation of figure 8 were based on the following equation, which assumes a constant channel width and length of reach:
1.486A9 5/3Q =
2
n2T 2 '
Ah0.0343A2 4 / 3 [-a 1 (A2 /A 1 ) 2 (l-k)+a2 (l-k)] n2 * T 2 «/3
(21)
in which Q = dischargeA2 = area of downstream cross sectionA! = area of upstream cross sectionn2 = Manning's roughness coefficient for downstream cross sectionT 2 = width of channel at water surface for downstream cross section«! = velocity-head coefficient at upstream cross sectiona 2 = velocity-head coefficient at downstream cross sectionk = 0 for contracting reach A X >A2 and 0.5 for expanding reach A X <A2
Ah = change in water-surface elevation between cross sections
Since the purpose of the analysis of velocity-head coefficients is to evaluate the effect of variable alpha (a) for different combinations of A x and A 2 , the other terms (n2 and Ah) in equation 21 were held constant.
In the determination of channel size for a site with a specified design discharge and channel slope, the magnitude of error in computing the needed flow area is also affected by the selected value of the velocity-head coeffi cient (a). As indicated in figure 8, the error in computing the cross-sectional area may be ±7 percent for a design discharge of 1,000 ft 3 /s (283 m3 /s), depending on the value of alpha and whether or not the reach is expanding or contracting.
Flow Expansion and Reverse Flow
Application of riprap design procedures based on estimates of shear stress requires accurate estimates of the kinetic energy or water-surface slope. Estimates of slope determined from surveys of the channel bed may provide mis leading data if the channel bed has pools and riffles or is subject to scour and fill. Sinuous streams with point bars or expanding reaches generally have pools at bends and riffles in straight reaches. Flows in pools and areas where the channel is expanding may be in reverse to the normal downstream direction. The conversion of velocity to static head in pools and other areas of flow ex pansion creates turbulence and localized areas of negative water-surface slope.
The data in table 13 indicate that negative slope (and associated reverse flow) in localized reaches of a channel may be greater than the overall slope for the study reach. Upstream velocities as high as 5.0 ft/s (1.5 m/s) have been measured in areas of reverse flow. Shear stresses in the areas of reverse slope may create greater potential for bank erosion than stresses defined on the basis of overall reach slope. Present procedures for calculating shear stresses on the boundary do not consider local reverse flow conditions that may be critical in estimating boundary stability.
38

Table 13. Comparison of water-surface slopes in channels with areas of flow expansion.
Dis
charge Site Date (ft3/s)
Water-surface slopeOverall Negative reach of slope in area channel of expansion
(next to boundary)
Length of reach (ft)
Overall Area of channel expansion
(next to boundary)
Sacramento River at cross section 5.3 near Chico, CA.
Aptos Creek near
Aptos, CA.
Sacramento River at
Scotty's Landing near Chico, CA.
Cosumnes River at site 2 near Dillard
Road Bridge near Sloughhouse, CA.
Sacramento River at
Hamilton City, CA.
2-18-82 76,000
1-4-82
2-17-82
3-4-82
3-31-83
3,930
78,800
33,700
3,970
2-20-80 73,900
0.000758
.002728
.000863
.000648
.000604
.000422
-0.00125
-.00147
-.000496
-.000909
-.00202
-.000417
1,055
843
834
445
440
1,350
398
326
564
304
54
96
Failure of rock riprap in areas of flow expansion has been documented at three sites. At these sites (Sacramento River at Scotty's Landing, Pinole Creek at Pinole, and Cosumnes River at site 2 near Dillard Road Bridge), flows were not impinging on the bank in the vicinity of the failure. The riprap at these locations probably failed due to undermining of the toe of the riprap. The failures at these and other sites indicate that bank riprap design criteria based only on the shear stress, with adjustments for radius and degree of chan nel curvature, may not take into account the significant hydraulic conditions that create stresses on the boundary.
Superelevation at Bends
Superelevation of the water surface at bends is caused by the centrifugal force acting on the flow. With superelevated conditions, the water surface on the outer bank is higher than on the inside bank. Associated with flow at bends is an irregular distribution of velocity across the channel that gives values of velocity coefficient alpha (a) and momentum coefficient beta (p) (Chow, 1959) greater than unity.
39

According to Chow (1959), flow characteristics associated with supereleva tion for subcritical flow are a smooth water surface and a spiral flow pattern in the vicinity of the bend. The spiral flow pattern represents the movement of water particles in a helical path in the general direction of flow. Associ ated with spiral flow is the component of transverse velocity that creates a secondary flow movement normal to the direction of the channel. The spiral flow represents a friction phenomenon whose magnitude is associated with the Reynolds number. When flows are supercritical and the water surface is rough, there are strong patterns of cross wave disturbances and a large amount of superelevation. The cross waves represent the effect of gravity on the water surface, and an analysis of supercritical flow conditions is based on the Froude number. For simplicity, the amount of superelevation in curved channels may be estimated, assuming that the water surface across a section is a straight line, and that all incremental velocities in the cross section are equal to the mean velocity.
The magnitude of superelevation at a channel bend may be estimated for subcritical flow by the simplified equation:
V 2T
where Ay = superelevation of water surfaceC = coefficient that relates free vortex motion to velocity
streamlines for unequal radius of curvature V = mean velocity
T = water-surface width of channel g = gravitational acceleration
R = mean radius of channel centerline at bend; R, is mean radius° of outside bank of bend = (R + T/2)
o
The value of the coefficient C has been determined for 28 flow events (table 14) at channel bends whose radius of curvature ranged from 190 to 4,280 ft (58 to 1,305 m) . For these events, the superelevation ranged from 0 to 0.7 ft (0.2 m) and is independent of the angle of the bend. Larger amounts of superelevation are probable. The mean coefficient C, derived from the data in table 14 for equation 22, is 1.5. The values of superelevation observed at the study sites are affected by channel gradient, bed and bank roughness, and by perturbations along the channel bank.
An allowance for channel freeboard is needed to prevent overtopping of the riprap material. Freeboard is measured as the vertical distance above design water surface to the top of the channel bank. The allowance for freeboard should include the effect of superelevation at channel bends.
40

Table 14.
Superelevation of water surface at
channel bends.
[Coefficient, C, relates fr
ee vortex motion to velocity streamlines for unequal radius of curvature]
Station
East Fork Carson River near
Markleeville, CA
Donner Creek near Truckee, CA
Hoh River near Forks, WA
, site 1
Hoh River near Forks, WA
, site 2
Sacramento River at
Peterson
Ranch near Hamilton Ci
ty,
CA
Sacramento River near Chico, CA
Sacramento River at Princeton, CA
Sacramento River near Colusa, CA
Truckee River at
Reno ,
NV
Truckee River at
Sparks, NV
W. Walker River nr Coleville, CA
:Site 2
Site 4
Cosumnes River at
Dillard Road
near Sloughhouse, CA
:Site 1
Site 1
Site 2
Site 3
Site 4
Russian River near Cloverdale, CA
Pinole Creek at
Pinole, CA
Santiam River at Albany, OR
Dis
charge ,
Date
Q
(ft3/s
)
90382
63082
61582
110482
110382
110282
11383
41482
121681
121581
120181
21783
11183
31083
11083
112581
62982
52782
61182
61082
113082
12783
33183
60783
41583
112081
10382
102782
215
730
211
5,060
2,170
2,140
10,500
56,000
25,700
27,700
21,000
71,200
12,300
41,400
12,400
35,300
2,800
3,740
1,450
1,280
9,110
14,100
3,970
1,743
1,330
917
2,250
7,440
Froude
number,
F 0.415
.834
.402
.423
.258
.284
.379
.309
.337
.349
.337
.182
.170
.142
.115
.127
.568
.314
1.051
.949
.172
.173
.239
.272
.267
.419
.602
.178
Width,
T
(ft) 35 49 30
121 94
127
450
863
482
448
388
425
275
470
274
330 90
108 45 42
358
508
293
112
155
147 57 191
Aver-
Angle
age
Radius,
of
velo-
R
bend
City
' Va
(ft)
A
(ft/s)
a Ut)
3.28
7.56
3.22
6.22
3.67
3.52
4.73
5.83
5.82
6.42
5.85
5.61
2.71
3.83
2.69
3.91
6.83
5.22
9.93
9.14
2.90
3.04
2.92
3.33
2.70
3.28
7.72
3.41
367
379
215
991
991
748
1,224
1,224
1,224
4,280
4,280
2,030
2,030
981
964
964
608
646
760
634
587
585
671
458
999
852
190
3,220
76.0
75.0
63.0
80.5
80.5
53.5
25.0
25.0
25.0
11.0
11.0
45.0
45.0
51.0
51-0
51.0
22.0
18.0
24.0
28.0
100.0
102.0
47.0
99.0
41.0
44.0
93.5
16.0
Superelevation
of water
surface (f
t)Meas
ured
0.12
.44
.29
.08
.11
.13
.09
.16
.42
.09
.09
.41
.03
.20
.03
.27
.17
.27
.26
.24
.07
.28
.07
.25
.08
.07
.72
.00
Com
puted
0.032
.229
.045
.147
.040
.065
.255
.744
.414
.134
.096
.205
.031
.218
.064
.163
.214
.141
.181
.172
.159
.249
.116
.084
.035
.058
.556
.021MEAN
Coeffi
cient,
C
3.77
1.92
6.45
.55
2.77
1.94
.352
.215
1.01
.672
.934
2.00
.97
.916
.470
1.66
.793
1.91
1.43
1.40
.439
1.12
.605
2.97
2.28
1.21
1.29 .00
1.50

The difficulties in estimating the freeboard needed at a site are related to the need to assess the following hydraulic factors:
o Design discharge.o Water-surface elevation for the corresponding design discharge.o Effect of channel bed and bank perturbations (irregularities in bank
alinement) and roughness. o Effect of channel curvature. o Height of wind- or boat-generated waves.
For small drainage channels with a prismatic cross section, about 1 ft (0.3 m) of freeboard, as recommended by Normann (1975), should be adequate. Large channels may require more freeboard, especially natural channels that are not prismatic and have perturbations on the bank that cause localized changes in water-surface elevation. The U.S. Army Corps of Engineers (EM-1913, 1978) requires a freeboard of 2 ft (0.6 m) for levees in agricultural areas and 3 ft (0.9 m) for levees in urban areas. These guidelines are increased by 0.5 to 1 . 0 f t (0.15 m to 0.3 m) at locations near the upstream end of protective rip rap, in the vicinity of structures on the levee or bank, near bridges, and in situations in which wave action caused by boat traffic or wind is likely.
Supercritical Flow
The occurrence of supercritical flow in open channels is usually associ ated with steep gradient streams. However, supercritical flow may occur at flow control or drop structures in channels with low slopes. Several hydraulic conditions that characterize supercritical flow are as follows:
o The specific energy is a minimum for a given discharge.o The velocity head is half the mean depth.o Bed slope is equal to or greater than critical slope, S >S .o The Froude number is approximately 1.0.o The flow is uniform and critical when the depth of flow = d .
The Froude number is a measure of the effect of gravity on the flow, and is determined as the ratio of inertia to gravity forces:
- Va (23)
where V = mean velocity in the cross section ag = acceleration of gravity
d = mean depth a
When flow conditions approach the critical state (F=1.0), relatively large changes in flow depth will occur in a short distance. Flows are in a state of transition, in which inertia and gravity forces are unbalanced, and excessive wave action, hydraulic jumps, localized changes in water-surface slope (known as drawdown or pileup) , and flow turbulence occur. All of these actions create stresses on the boundary that are difficult to assess quantitatively.
42
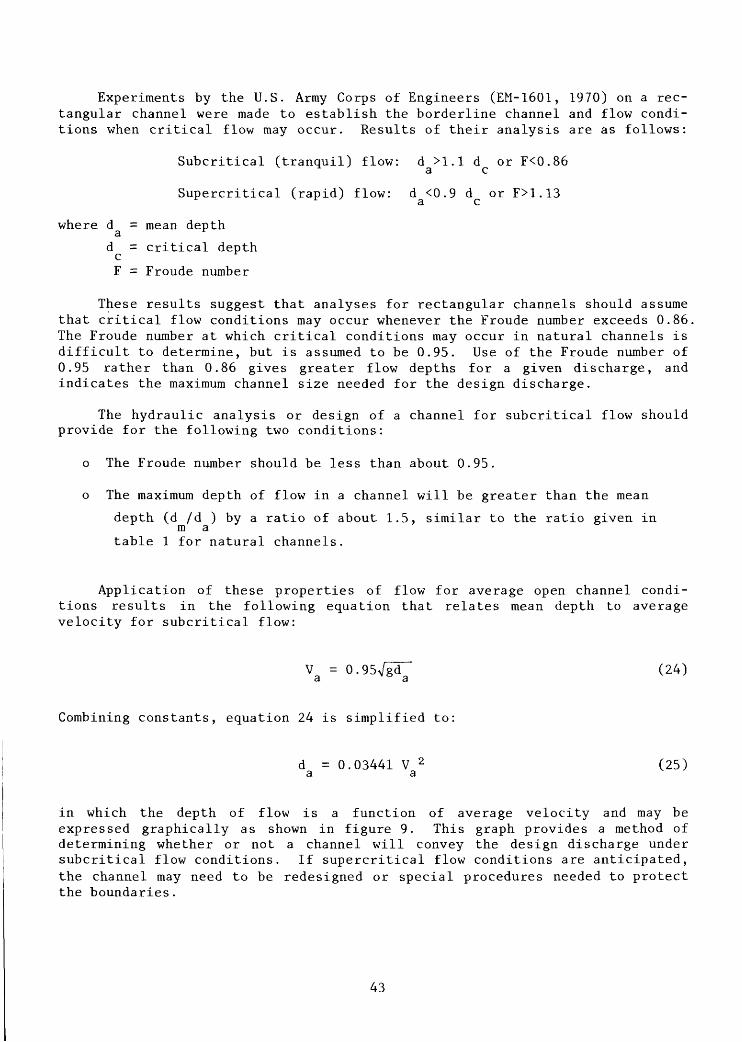
Experiments by the U.S. Army Corps of Engineers (EM-1601, 1970) on a rec tangular channel were made to establish the borderline channel and flow condi tions when critical flow may occur. Results of their analysis are as follows:
Subcritical (tranquil) flow: d >1.1 d or F<0.86a c
Supercritical (rapid) flow: d <0.9 d or F>1.13
where d = mean depth
d = critical depth cF = Froude number
These results suggest that analyses for rectangular channels should assume that critical flow conditions may occur whenever the Froude number exceeds 0.86, The Froude number at which critical conditions may occur in natural channels is difficult to determine, but is assumed to be 0.95. Use of the Froude number of 0.95 rather than 0.86 gives greater flow depths for a given discharge, and indicates the maximum channel size needed for the design discharge.
The hydraulic analysis or design of a channel for Subcritical flow should provide for the following two conditions:
o The Froude number should be less than about 0.95.
o The maximum depth of flow in a channel will be greater than the mean
depth (d /d ) by a ratio of about 1.5, similar to the ratio given in m a
table 1 for natural channels.
Application of these properties of flow for average open channel condi tions results in the following equation that relates mean depth to average velocity for Subcritical flow:
V = 0.95Vgd~~ (24) a a
Combining constants, equation 24 is simplified to:
d = 0.03441 V 2 (25) a a
in which the depth of flow is a function of average velocity and may be expressed graphically as shown in figure 9. This graph provides a method of determining whether or not a channel will convey the design discharge under subcritical flow conditions. If supercritical flow conditions are anticipated, the channel may need to be redesigned or special procedures needed to protect the boundaries.
43

Another channel characteristic to consider when evaluating the flow condi
tion is that the bed slope (S ) must be equal to or less than critical slope
(S ) or (S <S ) for subcritical flow. For supercritical flow conditions to c o c roccur, the bed slope is greater than the critical slope (S >S ). As an aid in
defining the hydraulics of a channel for classifying the type of flow prior to
design of the riprap, the following equations have been developed.
The bed slope (S ) of a channel may be approximated by the water-surface
slope using the equation:
- h2-h l(26)
where b.2 = water-surface elevation at the upstream sitehi = water-surface elevation at the downstream site L = channel length between sites
This estimate of bed slope is usually more reliable than using channel bed elevations, which are subject to abrupt changes such as between pools and riffles.
Supercritical flow whenF>0.95
F = Froude number
1.0 10 100
AVERAGE VELOCITY (Va), IN FEET PER SECOND
FIGURE 9. Relationship of average velocity and depth for supercritical flow conditions.
44

The minimum slope at which supercritical flow in a channel of any shape may occur is defined as:
S c = (Q/Kc ) 2 (27)
Substituting K^ = ^ AR2 ' 3 , gives:
( Q" . ,. \ ' (28) U.486 AR2 ^3 ; UBJ
c n
2S c
where Q = design discharge
K = minimum channel conveyance at which supercritical flow will occur
n = Manning's n
A = cross-sectional area
R = hydraulic radius
Equation 28 can be modified to include the factor of mean depth (d ) because d and R are nearly equivalent (table 1), as follows:
Because Q/A equals velocity (V ), equation 29 may be expressed in terms of velocity as:
(30)
In this case, the water-surface slope S =S =S . * v w e o
Because the mean depth (d ) and velocity of flow (V ) for open channelsa aare related as shown in figure 9, the critical slope (S ) at which super
critical flow will occur in a channel without overbank flow may be approximated
by combining equations 25 and 30 and simplifying, which gives:
c - 13.1 n2 f , c ~ d 1/3 * '
45
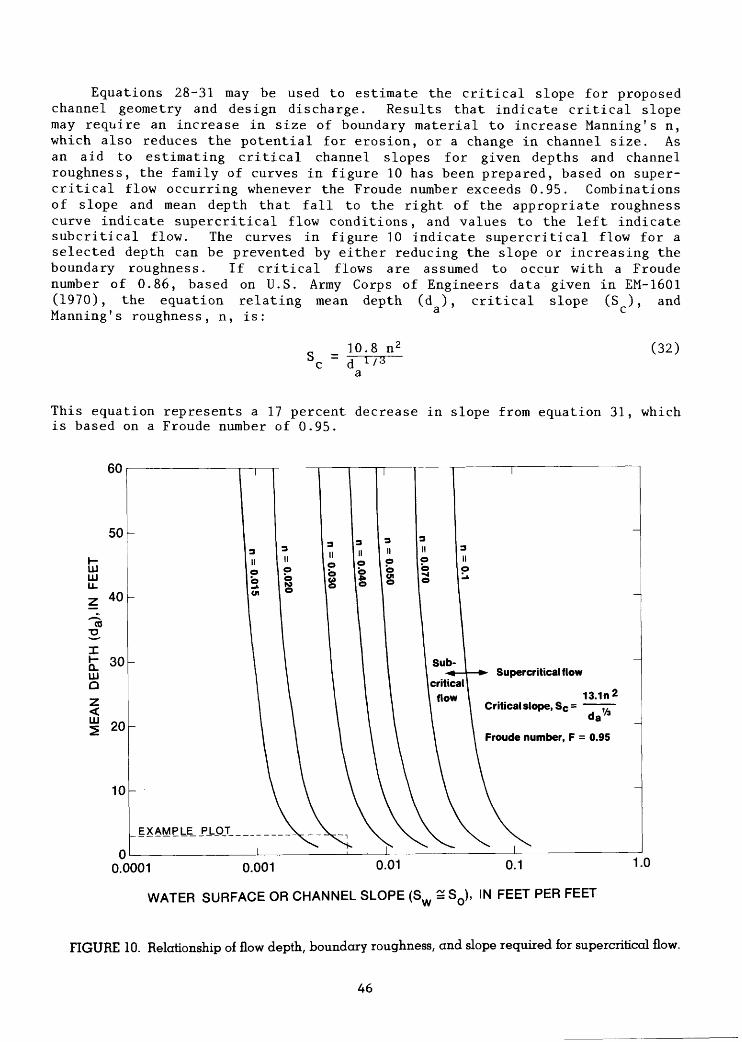
Equations 28-31 may be used to estimate the critical slope for proposed channel geometry and design discharge. Results that indicate critical slope may require an increase in size of boundary material to increase Manning's n, which also reduces the potential for erosion, or a change in channel size. As an aid to estimating critical channel slopes for given depths and channel roughness, the family of curves in figure 10 has been prepared, based on super critical flow occurring whenever the Froude number exceeds 0.95. Combinations of slope and mean depth that fall to the right of the appropriate roughness curve indicate supercritical flow conditions, and values to the left indicate subcritical flow. The curves in figure 10 indicate supercritical flow for a selected depth can be prevented by either reducing the slope or increasing the boundary roughness. If critical flows are assumed to occur with a Froude number of 0.86, based on U.S. Army Corps of Engineers data given in EM-1601 (1970), the equation relating mean depth (d ), critical slope (S ), and Manning's roughness, n, is:
_ 10.8 n2c " d x / 3
(32)
This equation represents a 17 percent decrease in slope from equation 31, which is based on a Froude number of 0.95.
0.0001 0.001
WATER SURFACE OR CHANNEL SLOPE (S^ 2SJ, IN FEET PER FEETw
FIGURE 10. Relationship of flow depth, boundary roughness, and slope required for supercritical flow.
46

As an example of the use of the family of curves in figure 10, the follow ing flow and channel design has been assumed:
Q = 1,000 ft 3 /s (28.3 m3 /s),
S = S =0.005 ft/ft (1.5 mm/mm), o w
n = 0.030, and
d = 3 ft (0.9 m). a
The plotting location in figure 10 for these hydraulic conditions is to the left of the roughness curve (n=0.030) and indicates that the flow will be subcritical. The critical channel slope in this case is about 0.0082 ft/ft (2.5 mm/mm).
SELECTED MORPHOLOGIC CHARACTERISTICS OF OPEN CHANNELS
Both natural and manmade channels may require the use of riprap on the bed or banks to maintain a stable geometry, prevent scour, or prevent changes in alinement. As discussed by Brice and Blodgett (1978), natural channels are at some degree of equilibrium, and a pronounced change in the discharge, sediment transport, alinement, or channel geometry will lead to scour or fill at some location in the reach. When manmade channels are constructed without adequate regard for hydraulic and morphologic characteristics of the stream under con sideration, channel instability in terms of scour, fill, or lateral erosion may then occur until the channel reaches a state of equilibrium.
For a given average discharge, there is a certain combination of width, depth, and velocity of flow that is unique to a site. Channel modifications, such as riprap that restricts the width or depth of flow at a site, will result in a corresponding increase in velocity. In general, the most stable channel characteristic is the overall slope based on a reach length that includes several meander bends. This also assumes no occurrence of degradation or aggradation due to significant but untypical events (such as volcanic activity and gravel mining). The slope along a meandering channel is always less than the valley slope, and the degree of sinuosity is a function of the sediment grain size, ratio of bedload to total load, and discharge of the stream (Bloom, 1978). With the condition of a fixed slope, the channel area and sediment dis charge at a site will vary according to stream discharge. Studies by Leopold and Haddock (1953) show that the width, depth, and velocity increase as a power function of discharge, as shown in the following equations:
T = aQb , d = cQ f , and V = kQm (33A,B,C) a a
where T = water-surface width
d = mean depth of water a
V = mean velocity of flow aQ = flow equal to or less than bankfull discharge
47

For the streams included in table 1, the approximate value of a is 3.9, c is 0.28, and k is 1.3. The exponents for equations 33A-C are 0.46, 0.38, and 0.16, respectively. These constants should be considered approximations and used only to provide guidelines for the analysis of streams in the project area.
The mean depth of a stream is inversely proportional to the width and mean velocity. The design and placement of bank protection should, therefore, attempt to minimize the reduction in channel width or area so that increases in flow depth or velocity, and consequent potential for scour, will be minimized. If the channel width must be decreased, it may be necessary to add riprap to the channel bed or to lower the toe of the bank protection to prevent damage by the action of scour as flows respond to the new channel conditions.
Depth of Scour in Alluvial Channels
The depth of scour in a channel bed is a function of the amount of sus pended sediment, size and placement of bed material, and magnitude of erosion stresses exerted by the stream. In the design of bank protection, estimates of the depth of scour are needed so that the protective layer is placed suffi ciently low in the streambed to prevent undermining. Design procedures in Hydraulic Engineering Circular-11 (Searcy, 1967) recommend that the riprap layer extend a minimum vertical distance of 5 ft (1.5 m) below the streambed, and on a continuous slope with the embankment (fig. 11). The recommendation may not be adequate for reasons described in this report.
For typical channels that are not affected by degradation or aggradation (caused by mining, landslides, or changes in flow regime), scour and fill of the channel boundary is a continuing and natural phenomenon. Changes in chan nel shape and size are related, in part, to discharge and suspended-sediment load, as shown by Leopold and Maddock (1953). Their studies indicate that scour and fill of a riverbed during a flood is directly related to changes in suspended-sediment concentration.
Scour and fill of the channel boundary results in fluctuations about a mean elevation or position as part of a continuing process in natural streams. Therefore, there is some limit in the magnitude of the channel changes unless the stream is aggrading or degrading. Studies of streambed scour at 21 sites were made to determine typical depths of scour for various sizes of bed mate rial and flow conditions. Depths of scour (table 15) were measured at sites on streams with sand, gravel, and cobble beds. Sites were selected that were unaffected by bridge piers or other cultural features, were generally in straight reaches, and were without features such as bedrock or large boulders that may cause localized scour. Measurements of the channel bed elevation were made systematically (either annually or monthly) by soundings or depth fathom eter at the same location from a boat, cableway structure, or by wading.
48

FILTER BLANKETSTONE RIPRAP LAYER
A - STONE LAYER (BLANKET) AND TOE TRENCH DETAIL(adapted from Figure 3, HEC - 11, Searcy, 1967)
FILTER BLANKE1ROCK RIPRAP
THALWEG OF STREAMBED
B - MODIFIED STONE LAYER (BLANKET) AND TOE TRENCH DETAIL
FIGURE 11. Riprap layer (blanket) and toe foundation detail.
49

Table 15. Depth of scour for selected sand, gravel, and cobble bed streams.
[Maximum scour is determined as difference in thalweg elevation from referenceelevation; reference elevation is maximum thalweg elevation for period of sample. Standard deviation of scour was computed only if sample size was 10 or more]
Periodof
Stream record(water years)
Numberof
channelmeasure ments
Mediansize
of bedmaterial D50 (ft)
Channel bed scour (ft)Maxi- Mean,mum, d
s(max)
Standarddeviation
Sacramento River nearButte City, CA: 1Cross-section 1Cross-section 2Cross-section 3Cross-section 4Cross-section 5Cross-section 6Cross-section 7
Sacramento River at E-10,at Chico Landing, CA.Sacramento River atPrinceton, CA:Cross section 2Cross section 3
Sacramento River nearColusa, CA.
Rio Grande near Bernalillo, NM2San Juan River near Bluff, UT2Colorado River at GrandCanyon, AZ2 .
Hassayampa River at BoxCanyon Damsite nearWickenburg, AZ.Santa Maria River nearBagdad, AZ .
Santa Cruz River nearNogales, AZ.Klamath River near SieadValley, CA.Sacramento River above BendBridge near Red Bluff, CA.
Sacramento River near RedBluff, CA.
Hoh River at Highway 101near Forks, WA.
1972-831972-831972-831972-831972-831972-831972-80
1981-83
1981-831981-831981-83
194819411941
1964-75
1976-82
1980-83
1951-83
1968-83
1931-63
1983-84
101010101094
7
367
344
73
26
43
302
173
215
8
0.074.074.059.057.042.033.025
.076
.0072
.0072
.0017
.001063
.000912
.000427
4 .002
.00269
.00164
.403
.335
.235
5 .076
8.86.64.26.38.08.81.6
7.0
5.15.413.0
4.110.637.4
4.4
4.8
1.6
3.3
3.7
1.8
1.4
7.03.72.52.53.64.7.7
2.7
4.51.68.8
2.46.36.8
1.4
.8
.7
1.0
.9
.7
1.0
1.822.601.251.942.19
.85
.94
.33
.61
.39
.36
1Data prior to 1978 adapted from study of flood hydrology of Butte Basin, CA, by Simpson (1978).
2Adapted from study of hydraulic geometry of stream channels by Leopold and Haddock (1953).
3For discharges greater than about 90,000 ft3/s, the sand bed material goes into suspension, exposing a bedrock channel bed.
4Estimated from sand sizes for Santa Maria River near Bagdad, AZ, and Santa Cruz River near Nogales, AZ.
5Estimated.
50

Determination of the depth of scour at these sites required the definition of the reference plane. The reference plane was selected as the highest thal- weg elevation found at the cross section during the period over which a given site was studied (fig. 12). The depth of scour at any given time is defined as the distance between the reference plane and the lowest point in the cross section at the time of the survey.
The data in table 15 indicate that the mean depth of scour for the sample of 21 sites is about 3.1 ft (0.95 m). The relationship of mean depth of scour to size of bed material (fig. 13) for 21 sites indicates that mean scour depths range from about 4 ft (1.2 m) for sand beds to about 2 ft (0.6 m) for gravel and cobble bed channels. In addition to sampling errors, this relationship is influenced by many of the factors that affect the amount of bed scour at a site, such as size of bed material, size distribution (which may cause armoring of the surface material), channel curvature, changes in channel size, variation in suspended-sediment concentrations, bedrock or presence of hardpan, the effects of debris and channel bed irregularities, and shear stress.
CHANNEL BED
HIGHEST THALWEG
ELEVATION = REFERENCE
PLANE
THALWEGELEVATION
AT TIME X
CHANNEL BED AT TIME X
DEPTH OF SCOUR, dg, AT TIME X
FIGURE 12. Definition sketch of channel bed scour.
51

100
UJ £
10
V)
^ cc
I>
o
o
w
u. o I Q.
UJ Q
1.0
0.1 0.00
01
SA
ND
GR
AV
EL
CO
BB
LE
BO
UL
DE
RS
Env
elop
ing
curv
e fo
r upp
er
limit
of o
bser
ved
scou
rd
=6
.5D
-°
-1
s (m
ax)
50
ME
AN
DE
PT
H O
F S
CO
UR
MA
XIM
UM
DE
PT
H O
F S
CO
UR
21 S
ITE
S
I
0.00
1 0.
01
0.1
ME
DIA
N D
IAM
ET
ER
OF
BE
D M
AT
ER
IAL
(D
50),
IN F
EE
T
FIG
UR
E 1
3.
Rel
atio
nshi
p of
sco
ur d
epth
to
med
ian s
ize
of b
ed m
ater
ial
in c
han
nel
.
1.0

The enveloping curve in figure 13 indicates a provisional upper limit of scour that occurred at the sample sites. The slope of the enveloping curve has arbitrarily been drawn parallel to the curve for mean depth of scour. Scour depths greater than those indicated by the enveloping curve may occur during floods larger than those occurring during the sample period or in the vicinity of contracting reaches or sites with bridge piers or at local obstructions such as bedrock formations or large boulders.
To estimate the depth of the toe trench needed to prevent undermining of
riprap (d , figs. 11 and 12), the following s
enveloping curve in figure 13, has been developed:
the riprap (d , figs. 11 and 12), the following relationship, based on the s
where d , ^ - estimated maximum depth of scour for alluvial bed channels s(max) rD 50 = median diameter of bed material
The maximum depth of scour for construction of the toe trench as estimated
by this relationship is greater than the previously recommended value (5 ft or
1.5 m, fig. 11) for all sizes of bed material. In application, the maximum
depth of scour, d , N , determined from equation 34, should be measured from s(max)
the reference plane to define the lowest elevation in the cross section, and
the toe trench constructed and filled as shown in figure 11. Because the
elevation of the surveyed channel bed in relation to the reference plane is not
known, the following relationship for estimating mean depth of scour may be
used:
d , , = 1.42 D 50-°- 115 (35) s(mean) bu
The location of the low point may shift from bank to bank, and the design pro cedure should assume that the low point in the cross section may eventually move adjacent to the riprap.
53

Permissible Nonscour Velocity
A determination of the maximum permissible velocity that will not cause erosion of a channel has been the subject of investigation for years. Chow (1959) presents a table of permissible velocities (table 16) for different materials. This table lists allowable velocities and unit tractive forces for a channel conveying clear water or suspended sediment. Some suspended sediment will be transported in all natural channels, and the relationship of velocity to material size, as derived from table 16 and shown in figure 14, is for water transporting colloidal material. For comparison, data on nonscour velocities for canals in various soil types have been adapted from a study by Keown and others (1977) and from a study by Mamak (1964) and further simplified for this study (table 17), and are also shown in figure 14 for mean depths of 1.3 and 9.8 ft (0.40 m and 3.0 m) . The velocities in table 17, modified from Keown and others (1977), take into account the effect of depth and give the highest per missible nonscour velocities.
Table 16. Maximum permissible velocities recommended by Fortier and Scobey and the corresponding unit-tractive-force values converted by the U.S. Bureau of Reclamation.
[Adapted from Chow, 1959. For straight channels of small slope, after aging. The Fortier and Scobey values were recommended for use in 1926 by the Special Committee on Irrigation Research of the American Society of Civil Engineers]
Material
Clear water Veloc- Unitity tractive
(ft/s) force(lb/ft2 )
Water transporting colloidal silts Veloc- Unitity tractive
(ft/s) force(lb/ft2 )
Fine sand, colloidal Sandy loam, noncolloidal Silt loam, noncolloidal Alluvial silts, noncolloidal Ordinary firm loam Volcanic ash Stiff clay, very colloidal
Alluvial silts, colloidalShales and hardpansFine gravelGraded loam to cobbles when
noncolloidal. Graded silts to cobbles when
colloidal.Coarse gravel, noncolloidal Cobbles and shingles
0.020.020.020.020.020.020.025
1.501.752.002.002.502.503.75
0.027.037.048.048.075.075.26
.025
.025
.020
.030
.030
.025
.035
3.756.002.503.75
4.00
4.005.00
.26
.67
.075
.38
.43
.30
.91
2.502.503.003.503.503.505.00
5.006.005.005.00
5.50
6.005.50
0.075.075.11.15.15.15.46
.46
.67
.32
.66
.80
.67 1.10
54

Table 17. Nonscour velocities for soils.
[Modified from a report by Keown and others, 1977]
Kind of soilGrain dimensions
Millimeters Feet
Approximate nonscour velocities (feet per second) _________Mean depth__________1.3 ft 3.3 ft 6.6 ft 9.8 ft
For noncohesive soils
Boulders Large cobbles Small cobbles Very coarse gravel Coarse gravel
Medium gravel Fine gravel Very fine gravel Very coarse sand Coarse sand Medium sand Fine sand
>256 256-128 128-6464-3232-16
16-8.08.0-4.04.0-2.02.0-1.01.0-0.500.50-0.25
0.25-0.125
>0.840 0.840-0.420 0.420-0.210 0.210-0.105 0.105-0.0525
0.0525-0.02620.0262-0.01310.0131-0.006560.00656-0.003280.00328-0.001640.00164-0.0008200.000820-0.000410
15.111.87.55.24.1
16.713.48.96.24.7
19.015.410.27.25.4
20.316.411.28.26.1
3.3 2.6 2.2 1.8 1.5 1.2 .98
3.7 3.0 2.5 2.1 1.8 1.5 1.3
4.1 3.3 2.8 2.4 2.1 1.8 1.6
4.6 3.8 3.1 2.7 2.3 2.0 1.8
For compact cohesive soils
Sandy loam (heavy) Sandy loam (light) Loess soils in theconditions of finishedsettlement
3.3 3.1
2.6
3.9 3.9
3.3
4.6 4.6
3.9
4.9 4.9
4.3
Effect of Alinement Changes on Channel Slope
Alluvial streams develop meanders that are confined in lateral movement by nonerosive rock or other material at the valley boundary or by levees construc ted to prevent flooding. The degree of stream meandering is indicated by chan nel sinuosity, which is determined as the ratio of a reach length measured along the channel centerline to the reach length measured as a straight line between ends of the reach. A characteristic of all sinuous channels is the migration of the meanders over a period of time. Eventually, the neck of the meander loop may become so small in relation to the width of the channel that a cutoff (referred to as a chute or neck cutoff) between meander loops occurs. Associated with the cutoff is an increase in channel slope, and lateral erosion of the banks at adjacent bends, with the length of reach affected by the cutoff a function of the channel size.
55

100
o oLJJ O)ocLJJ Q.
LU 111
O O-1 LJJ >LJJ-1go</) a)
ocLJJ Q_
10
Keown and others (1977)
0.10.0001 0.001 0.01
MEDIAN PARTICLE SIZE, IN FEET
0.1
FIGURE 14. Comparison of permissible velocities from Chow (1959) and Keown and others (1977).
Meander properties of the Sacramento River between Chico Landing and Woodson Bridge, California, were studied by Blodgett (1981). Data summarized in table 18 indicate that changes in the centerline length and sinuosity of the channel caused by chute cutoffs, meander migration, and other alinement changes in a 24-mi (38.6-km) reach caused changes in slope of the river for reaches between 5 and 12 mi (8.0 and 19.3 km) long up to 23 percent over a 7-year period. The downstream extent of changes in slope is related to the degree of channel straightening and stream size. However, for reaches sufficiently long to include at least three meander loops, and over the long-term period of 35 years (1946-80) , the level of sinuosity and channel slope did not change significantly, and the channel appears to be in a state of equilibrium. The channel slope for the 24-mi (38.6-km) reach during a 31-year period (1950-80) changed only 0.7 percent, with the possibility that this apparent change is due to inaccuracy in the data. If short-term changes in sinuosity and slope for short reaches of the Sacramento River are typical of most rivers, then the overall channel slope may be considered constant. Because channel migration is a continuing process, bank protection activities near highway structures will be needed on a continual basis to restrict lateral erosion. It is also appar ent that riprap placed at a point of active stress on a meander loop may in time be isolated from the active channel if alinement changes and chute cutoffs occur (see fig. 1).
56

Table 18. Morphologic and hydraulic properties of Sacramento River between Chico Landing (site E-10) and Woodson Bridge, California.
[Modified from report by Blodgett, 1981]
Reachdescription
Chico LandingGianella Bridge
Gianella BridgeFreer/Bar chett
Freer/BarchettWoodson Bridge
TOTAL
Rivermiles 1
194 to199
199 to206
206 to218
Number ofmeanderloops
Per Perreach mile
2 2.5
3 2.3
7 1.7
Valleylength(feet)
19,520
24,210
40,660
84,390
April11,
1946 2
1.28
1.04
1.50
1.31
SinuosityMarch
4,19722
1.39
1.07
1.54
1.37
of channelJune 21-July 25,
1980 2
1.13
1.12
1.32
1.22
April2,
1979 2
1.20
1.14
1.46
1.31
Reach description
Valley slope 3
(feet per 1,000 ft)
Water-surface slope 4 (feet per 1,000 for selected floods
Dec. 15, 1950 s
Dec. 23, 1964 5
Jan. 24, 1970 6
Jan. 17, 1978 7
ft)
Feb. 20, 1980 8
Chico Landing to 0.523 0.409 0.394 0.390 Gianella Bridge
Gianella Bridge .587 .564 .579 .543 to Freer/Barchett
Freer/Barchett to .635 .424 .441 .428 Woodson Bridge
MEAN .595 .453 .462 .444
0.372
487
0.443
.507
.437
.456
aAfter U.S. Army Corps of Engineers, 1976. 2Date of aerial photography.3Determined from distances derived from USGS 7.5-minute topographic maps,
Foster Island, Hamilton City, Ord Ferry, Nord, and Woodson, and elevations of water surface during flood of December 15, 1950.
4Date of photography used in defining channel length and slope:5 1946.61972.7 1979.8 1980.
57

SUMMARY
o Guidelines suggested here for hydraulic and morphologic analyses of stream channels are based on field data collected at over 700 sites throughout the United States. A thorough understanding of the characteristics of natural streams and manmade channels is essential to design adequate rock riprap to stabilize the channel and control bank erosion.
o Analyses of natural open channels indicate that hydraulic and morphologic properties that define the flow and channel shape usually exhibit consist ently similar quantitative values, such as ratio of maximum velocity to mean velocity of 1.61, and ratio of hydraulic radius to mean depth of 0.98.
o Channels at curves exhibit a slightly greater ratio of maximum to mean depth (1.7) compared with the ratio of 1.6 for straight reaches.
o Suitable side slopes of channels in all types of material other than solid rock or clay, or lined with material such as concrete, should be flatter than 1.5:1 (table 3).
o For a selected discharge, hydraulic properties that define the geometry of a channel, such as area, hydraulic radius, width, and depth, may change in any given year ±50 percent from the long-term mean, depending on flow con ditions at the site. Because hydraulic analysis of a channel assumes the field data are representative of average conditions at a site, these changes suggest that site surveys may indicate channel conditions that are much different than those needed for adequate design purposes.
o Based on data for 60 sites, Manning's roughness coefficients for gravel, cobble, and boulder bed channels range from 0.020 to 0.159. For 113 measurements of sand bed channels, Manning's roughness coefficients varied between 0.013 to 0.046, depending on the bed configuration. Equations for estimating Manning's roughness coefficient have been developed based on average depth, channel slope, and median bed material size.
o The median velocity-head coefficient (a) for over 400 channels without over- bank flow is 1.40, and if overbank flow occurs, the median value of alpha increases to 1.46. Errors in hydraulic computations assuming an alpha of 1.0 can be significant.
o Localized parts of a channel may be subject to reverse flow as a result of flow expansions or eddies. Sites have been documented in which negative velocities up to 5 ft/s (1.5 m/s) and reverse slopes up to 0.002 ft/ft (0.6 mm/mm) for a distance over 400 ft (120 m) occurred.
o Superelevation of the water surface at bends up to 0.7 ft (0.2 m) has been measured at the study sites. Larger values are probable. Field data indicate the amount of superelevation is independent of bend angle, but is related to the channel gradient, bed and bank roughness, and irregular shape of bank.
58

o Supercritical flow in natural channels may occur when the Froude number exceeds 0.86. Supercritical flow conditions may be prevented by increas ing the depth of flow, reducing the slope, or increasing the boundary roughness by using larger size riprap.
o The depth of scour in natural alluvial channels is related to the size of bed material and armoring. Maximum observed depths of scour at 21 sites unaffected by piers or other obstructions is 13 ft (4.0 m).
o Permissible nonscour velocities are a function of type of bank and bed material and depth of flow. Typical velocities for a flow depth of 10 ft (3.1 m) range from about 2 ft/s (0.6 m/s) for fine sand to 11 ft/s (3.4 m/s) for small cobbles.
o Changes in channel centerline length and sinuosity that occur as a result of natural meander migration or chute cutoff may cause sudden local increases in channel slope. The downstream extent of changes in slope is related to the degree of channel straightening and stream size. For reaches suffi ciently long to include at least three meander loops, and over a long-term period (generally several decades), the level of sinuosity and channel slope remain nearly constant.
REFERENCES
Anderson, A.G., Paintal, A.S., and Davenport, J.T., 1970, Tentative design pro cedure for riprap-lined channels: National Cooperative Highway Research Program report 108, Highway Research Board, 75 p.
Barnes, H.H., Jr., 1967, Roughness characteristics of natural channels: U.S. Geological Survey Water-Supply Paper 1849, 213 p.
Bates, R.L., and Jackson, J.A., (eds), 1980, Glossary of Geology, 2d edition: Falls Church, Va., American Geological Institute, 749 p.
Blodgett, J.C., 1981, Floodflow characteristics of the Sacramento River in the vicinity of Gianella Bridge, Hamilton City, California: U.S. Geological Survey Open-File Report 81-328, 33 p.
Bloom, A.L., 1978, Geomorphology--A systematic analysis of Late Cenozoic land- forms: Englewood Cliffs, New Jersey, Prentice-Hall, Inc., 510 p.
Brice, J.C., and Blodgett, J.C., 1978, Countermeasures for hydraulic problems at bridges, volume I--analysis and assessment: Federal Highway Adminis tration Report No. FHWA-RD-78-162, 169 p.
Chow, V.T., 1959, Open-channel hydraulics: New York, McGraw-Hill Book Co., Inc., 680 p.
Culbertson, J.K., and Dawdy, D.R., 1964, A study of fluvial characteristics and hydraulic variables, Middle Rio Grande, New Mexico: U.S. Geological Survey Water-Supply Paper 1498-F, p. F1-F71.
Guy, H.P., 1969, Laboratory theory and methods for sediment analysis: U.S. Geological Survey Techniques of Water-Resources Investigations, book 5, chap. Cl, 58 p.
59

Hulsing, Harry, Smith, Winchell, and Cobb, E.D., 1966, Velocity-head coeffi cients in open channels: U.S. Geological Survey Water-Supply Paper 1869-C, p. C1-C44.
Jarrett, R.D., 1984, Hydraulics of high-gradient streams: Journal of the Hydraulics Division, American Society of Civil Engineers, v. 110, no. 11, p. 1519-1539.
Keown, M.P., Oswalt, N.R., Perry, E.B., and Dardeau, E.A., Jr., 1977, Litera ture survey and preliminary evaluation of streambank protection methods: Technical Report H-77-9, U.S. Army Engineers Waterways Experiment Station, 151 p.
Leopold, L.B., and Haddock, Thomas, 1953, The hydraulic geometry of stream channels and some physiographic implications: U.S. Geological Survey Professional Paper 252, 57 p.
Limerinos, J.T., 1970, Determination of the Manning coefficient from measured bed roughness in natural channels: U.S. Geological Survey Water-Supply Paper 1898-B, p. B1-B47.
Mamak, W. , 1964, River regulation: Arkady, Warszaw, Poland (translated by Israel Program for Scientific Translations).
Maynord, S.T., 1978, Practical riprap design: Miscellaneous Paper H-78-7, Hydraulics Laboratory, U.S. Army Engineer Waterways Experiment Station, Vicksburg, Miss., 66 p.
Normann, J.M., 1975, Design of stable channels with flexible linings: U.S. Department of Transportation, Federal Highway Administration, Hydraulic Engineering Circular No. 15, 136 p.
Searcy, J.K., 1967, Use of riprap for bank protection: U.S. Department ofTransportation, Federal Highway Administration, Hydraulic EngineeringCircular No. 11, 43 p.
Simpson, R.G., 1978, Flood hydrology of Butte Basin, 1973-77 water years, Sacramento Valley, California: U.S. Geological Survey Water-Resources Investigations Report 78-86, 70 p.
Strickler, Alfred, 1923, Some contributions to the problem of the velocity formula and roughness factors for rivers, canals, and closed conduits: Bern, Switzerland, Mitt. Eidgeno assischen Amtes Wasserwirtschaft, no. 16.
U.S. Army Corps of Engineers, 1970, Hydraulic design of flood control channels: Engineer Manual EM-1110-2-1601, 67 p.
------1976, Sacramento River, California, aerial atlas, March 1972 index:29 sheets.
------1978, Design and construction of levees: Engineer Manual EM-1110-2-1913.
60 687-597/58415