robustness evaluation of crashworthiness using ls- … · ansys conference & 25th cadfem...
TRANSCRIPT

ANSYS Conference & 25th CADFEM Users’ Meeting 2007 November 21-23, 2007 Congress Center Dresden, Germany 1
Robustness Evaluation of Crashworthiness using LS-DYNA and optiSLang
Johannes Will*, Uli Stelzmann**
*Dynardo GmbH, Weimar, Germany
**CADFEM GmbH, Grafing, Germany
Summary
The numerical robustness of simulation results from explicit time integration is an important topic. We know for real world applications of passive safety and crashworthiness that we have some numerical noise, but the interesting question is if that really does influence significantly our simulation results. Furthermore, today the robustness of the designs against naturally given input scatter, in loading conditions, geometry or material become part of the virtual product development process. Then, the prognosis of the variation of important simulation results using stochastic analysis procedure is necessary. Again the question arises how much of the calculated variation is coming from numerical noise. The paper will present a procedure of numerical robustness evaluation using stochastic analysis to quantify the scatter of simulation results. Using coefficients of determination, a procedure of deselecting variation identified by correlation to physical input scatter and "undefined" variation is introduced. The breakthrough in practical application and the acceptance of stochastic analysis for robustness evaluations was achieved by using linear and quadratic correlations and the corresponding measures of determination as well as by projection of statistical measures on the finite element structure.
Keywords
Robustness Evaluation, Coefficient of Determination, Latin Hypercube Sampling

ANSYS Conference & 25th CADFEM Users’ Meeting 2007 November 21-23, 2007 Congress Center Dresden, Germany 2
1. Introduction The numerical robustness of simulation results from explicit time integration is an important topic. We know for real world applications of passive safety and crashworthiness that we have some numerical noise, but the interesting question is if that really does influence significantly our simulation results. The normal procedure to evaluate that is the running of some variants and evaluating the differences in results, but because of the highly nonlinear behaviour, it is often not possible to deselect numerical and physical sources of differences. Furthermore, today the robustness of the designs against naturally given input scatter, in loading conditions, geometry or material become part of the virtual product development process. Then, the prognosis of the variation of important simulation results using stochastic analysis procedure is necessary. Again the question arises how much of the calculated variation is coming from numerical noise. The paper will present a procedure of numerical robustness evaluation using stochastic analysis to quantify the scatter of simulation results. Using coefficients of determination, a procedure of deselecting variation defined by correlation to physical input scatter and "undefined" variation is introduced. That procedure is used for two years at BMW for virtual development of passive safety systems [1,2]. Here, very often multi body formulations (MADYMO) are used. The procedure can be used for FEM-application in the same manner, “only” the model complexity increases significantly and deselecting physical and numerical scatter sources becomes more complicated. Furthermore fore for finite element applications, a projection of the statistical results on the finite element meshes [3] is necessary to evaluate the source of variation. An example for front crash application using ULSAB finite element car model is shown. Because in passive safety and crashworthiness it is usually not necessary to account small event probabilities, robustness evaluations using variation analysis [4] are the methodology of choice. The primary goal of robustness evaluations is the prognosis of a variation range of significant response variables and their evaluation using definitions of system robustness. These requirements should be met by the majority of the vehicles. If small probabilities (for example less than 1 in 100000) are to be verified, one should use methods from reliability analysis [5-6]. The secondary goal of robustness evaluations is the identification of correlations between input and response scatter and a quantification of the thereby explainable components of the variation of result variables as well as the quantification of the influence of “numerical” noise on the output scatter.
2. Computational Robustness Evaluation using Variational Analysis For the evaluation of robustness, all potential input scatter of material, car or test condition are introduced into the virtual product design process by using scattering input variables in the numerical models. Using appropriate sampling methods, a sample set of n-possible vehicles and n-possible crash test conditions is generated and then computed. Choice and complexity of the sampling methods have to be adjusted according to the important statistical measures which are to be estimated. Normally, the sampling method is adjusted according to a reliable identification of linear coefficients of correlation. Thereby, the number of computations for robustness evaluations of restraint systems results in about 100 to 200 per load case that is to evaluate [4]. The most suitable method for this is a Latin-Hypercube method which fulfills the input distribution function as well as it minimizes the deviation between defined and created input correlations. After the computation, the sample set is then evaluated by using statistical methods for estimation of variance and correlation. In order to estimate the scatter of the result variables from the sample, usually the mean value, standard deviation, coefficient of variation and the range of variation (min/max value) are determined for every important response variable. If the detected ranges of variation lie too close to the limit values or even exceed these, one has to ask for the frequency (probability) of exceeding the limits. If overstepping occurs in the calculated support point set, the frequency can be counted. In statistics, one would talk about determining the empirical probabilities directly from the histogram. Alternatively, distribution functions of the result variables can be assumed and the probabilities can then be computed from the characteristic values of the distribution function. For significantly scattered result variables or overstepping of limits, the responsible input scatter is identified by using correlation analysis. For this purpose, pair wise linear and quadratic correlation coefficients of result and input scatter are computed. The correlation coefficients can obtain values

ANSYS Conference & 25th CADFEM Users’ Meeting 2007 November 21-23, 2007 Congress Center Dresden, Germany 3
between 0 and 1 (-1) and show the pair wise correlation between a single input scatter and a single output scatter. For the identification of mechanisms in which multiple input scattering affects the output scatter, the principal components (the eigenvectors of the correlation matrices) can be evaluated. In the following, it is estimated how much of the result variation can be explained by using the identified (linear and quadratic) correlations. This is done by using measures of determination [4]. The determinedness of a result variable regarding the variation of all input scatter describes which percentage of the result variation can be explained by the found correlations to the input variables. If the coefficient of determination of a result variable is high (>90%), the fundamental interrelations can be described by using the underlying correlation hypothesis. The smaller the coefficients of determination are, the larger the part of the variation of result variables becomes which can not yet be explained by the correlation hypothesis (e.g. linear and quadratic). Then non-linear correlations, clustering, “outliers” or a high amount of “numerical noise” exist. So the measure of determination provides information about the possible ratio of numerical noise and it should be used as an important quality measure for the used modeling. In the robustness evaluations performed so far, it could be detected that for coefficients of determination larger than 80%, the influence of numerical noise on the performance variables was acceptable. 2.1 On Numerical Robustness of Crash Test Computations
The inspection of numerical robustness of numerical models of crash-test computation results from the experience that the variation of numerical parameters of the approximation method or the variation of demonstrable insignificant physical parameters can lead to large scattering of the result variables or respectively lead to obviously unfeasible results. If n-designs are to be computed and their variation is to be evaluated statistically, the question arises which proportion of the resulting variation can be attributed to problems of the approximation method and the numerical modeling respectively. The quantitative influence of numerical noise on the result variable can be estimated by using the coefficients of determination of robustness evaluation for the naturally occurring scatter. If the measure of determination of the robustness evaluation is high, only a small proportion of unexplained variation, which could be caused by numerical noise, is left. In order to use the measure of determination of result variables as a quantitative measure for the numerical model robustness, the proportion of determination of the found correlations has to be estimated with sufficient statistical security. This formulates standards for the sampling method, the number of computations and the statistical algorithms for the evaluation of measures of determination. After a positive experience of evaluating the influence of numerical noise via measures of determination from robustness evaluation, this method is used for the serial production at BMW since 2006 [3]. For “numerically” robust models, measures of determination considering linear and quadratic correlations and after elimination of outliers and clustering of over 80% could be determined. If the measures of determination decreased significantly below 80%, it usually indicated that the corresponding result variable possesses a significant amount of numerical noise. A reason here for may be insufficiencies in the result extraction or insufficiencies of the numerical models interacting with the approximation methods. After repairing the numerical modeling, the measure of determination usually increased to over 80%. It shall be stated that in theory it is impossible to determine without doubt the proportion of numerical noise. The subject of bifurcation points is surely to be discussed separately. For the purpose of robust designs, one would want to vastly avoid systems with bifurcation points which can be traversed in multiple ways within the scatter range of input variables and then lead to significantly different system responses. As a matter of principle, one would have to be able to find correlations between indicators of bifurcation or results heavily influenced by bifurcation and the input scatter. Otherwise the bifurcation occurs randomly which implies that we are dealing with a very sensitive dynamic system. For robust designs, the correlations between input variation and output variation should basically be identifiable with high certainty. These correlations also show the possibilities for influencing the result scatter. In order to reduce transgression probabilities, it is possible for example to reposition the mean value in the linear case or to change the transmission behavior between input and output scatter. This diagnosis of course excludes systematical errors or the inability to actually map significant physical effects in the numerical models. The fundamental prognosis ability of the numerical models has to be verified using experimental data.
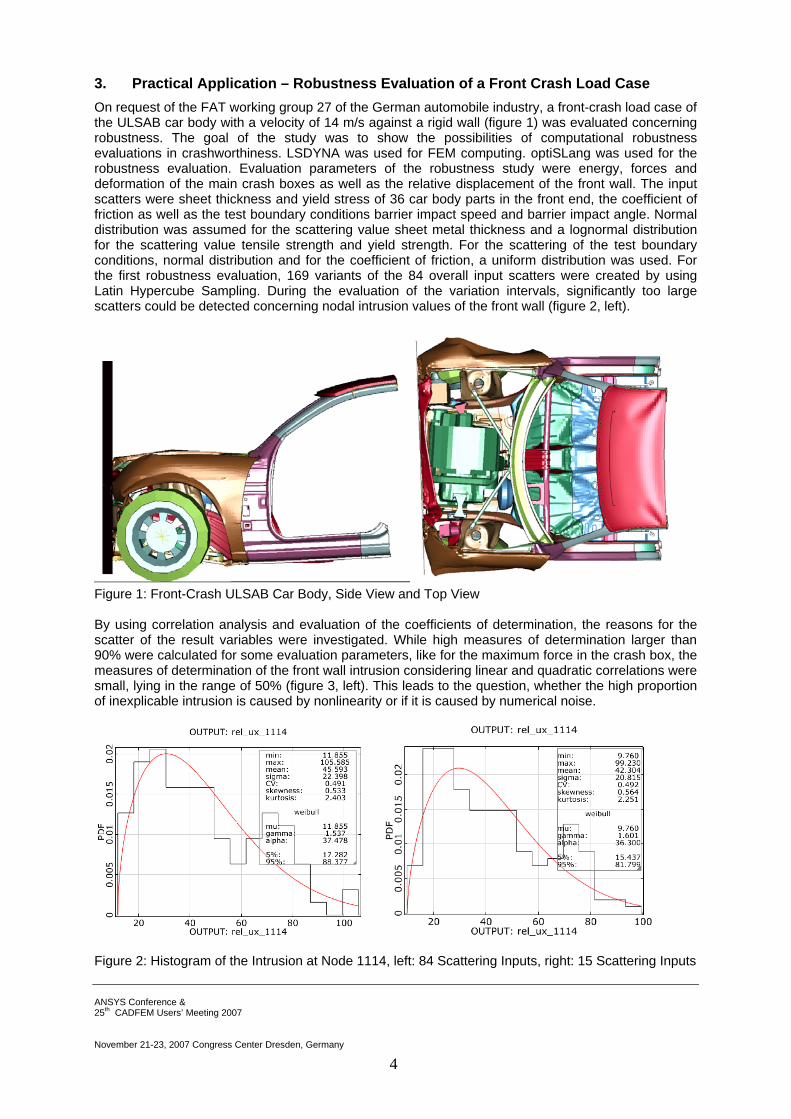
3. Practical Application – Robustness Evaluation of a Front Crash Load Case On request of the FAT working group 27 of the German automobile industry, a front-crash load case of the ULSAB car body with a velocity of 14 m/s against a rigid wall (figure 1) was evaluated concerning robustness. The goal of the study was to show the possibilities of computational robustness evaluations in crashworthiness. LSDYNA was used for FEM computing. optiSLang was used for the robustness evaluation. Evaluation parameters of the robustness study were energy, forces and deformation of the main crash boxes as well as the relative displacement of the front wall. The input scatters were sheet thickness and yield stress of 36 car body parts in the front end, the coefficient of friction as well as the test boundary conditions barrier impact speed and barrier impact angle. Normal distribution was assumed for the scattering value sheet metal thickness and a lognormal distribution for the scattering value tensile strength and yield strength. For the scattering of the test boundary conditions, normal distribution and for the coefficient of friction, a uniform distribution was used. For the first robustness evaluation, 169 variants of the 84 overall input scatters were created by using Latin Hypercube Sampling. During the evaluation of the variation intervals, significantly too large scatters could be detected concerning nodal intrusion values of the front wall (figure 2, left).
Figure 1: Front-Crash ULSAB Car Body, Side View and Top View By using correlation analysis and evaluation of the coefficients of determination, the reasons for the scatter of the result variables were investigated. While high measures of determination larger than 90% were calculated for some evaluation parameters, like for the maximum force in the crash box, the measures of determination of the front wall intrusion considering linear and quadratic correlations were small, lying in the range of 50% (figure 3, left). This leads to the question, whether the high proportion of inexplicable intrusion is caused by nonlinearity or if it is caused by numerical noise.
ANSYS Conference & 25th CADFEM Users’ Meeting 2007 November 21-23, 2007 Congress Center Dresden, Germany 4
Figure 2: Histogram of the Intrusion at Node 1114, left: 84 Scattering Inputs, right: 15 Scattering Inputs

Figure 3: COD of Intrusion at Node 1114, left: 84 Scattering Inputs, right: 15 Scattering Inputs In order to determine the significance of the statistical measures, the parameter space was reduced to those 15 variables which had shown significant linear or quadratic correlations in the 84-dimensional response space and a second robustness evaluation was performed. Essentially, those scattering parameters were the sheet thickness and yield strength of crash box, further sheet metal component in the load transfer path as well as scattering of the test boundary conditions. In the 15-dimensional space, 100 variants were generated and evaluated by using Latin Hypercube Sampling. Fortunately, the variation prognosis (figure 2, right) as well as the measure of determination (figure 3 right) turned out to be very stable. Thereby, it could be shown that the variables which were preliminary selected as of no importance indeed had no significant influence on the result scattering and that the determined statistical measures are trustworthy. However, still only about 50% of the result variation could be described by linear and quadratic correlation.
Figure 4: left: Measure of Determination of the Relative Displacement, right: Standard Deviation of the Relative Displacement In order to further investigate the cause of the unexplained variation components of the front wall intrusion, the statistic measures of the 100 computations on the FE-structure were investigated by using the post-processor Statistics_on_Structure [9]. The evaluation of the measures of determination (figure 4, left), standard deviation (figure 4, right) and correlations at the finite element structure show the largest differences in the interconnection between the crash box in the front wall. The comparison of load cases with minimal and maximal (figure 5) relative displacement at this point showed that the crash box sometimes fails during the crash loading and one could have reasoned that the low
ANSYS Conference & 25th CADFEM Users’ Meeting 2007 November 21-23, 2007 Congress Center Dresden, Germany 5

determination of the relative displacement could have been associated to this bifurcation problem of the buckling crash box.
Figure 5: left: Design with Minimal Front Wall Intrusion, right: Design with Maximal Front Wall Intrusion In order to verify, if the robustness of the structure is depending on the amount of scattering, the input scatter was decreased. A third robustness evaluation, only concerning the input scatter of the test boundary conditions velocity and impact angle, was performed. Furthermore, the input scatter of impact velocity and impact angel was reduced by 90% in the fourth robustness evaluation. By using the Latin Hypercube Sampling, 36 variants were created and computed. As can be seen in table 1, the variation interval of the relative displacement is only reduced by 30%, even if the input of the two variables is reduced to 10% of the original values. This leads to the conclusion that either the connected “physical” correlation is relatively independent of the input scatter (and therefore the structural response is very instable) or that numerical perturbation causes a significant amount of scatter in the response behavior. Intrusion = relative X-Displacement Node 1114 [mm]
Robustness 1 84 scattering parameters
Robustness 2 15 scattering parameters
Robustness 3 2 scattering parameters
Robustness 4 2 scattering parameters 10% scatter
Mean Value 42.5 44.5 52 53 Variation Interval Max-Min
89.5 93.7 63 68
Coefficient of Determination R2/adjustedR2
61/23 56/47 43/35
Table 1: Comparison of Statistical Measures Therefore, a “numerical” robustness evaluation, only concerning the time step of the explicit time step integration, was performed. The 10 computations showed a significant amount of numerical noise varying from 20 to 60 mm (figure 6), nearly the same variation like robustness evaluations 3 and 4. Following, further analysis for identifying the problem was performed and an insufficient meshing of some parts of the crash box and their supporting structure was assumed to be a reason for numerical problems. Therefore, the crash box and the supporting structure were meshed with a finer mesh size. The robustness analysis was repeated in the 15 dimensional subspace of important scattering input variables using 100 Latin Hypercube samples (Robustness 5). Because of the finer mesh, the crash mechanism of the crash box (figure 8/9), the crash box cross section force history (figure 7) and the statistical values (table 2) of the front wall intrusion (a little bit unexpectedly) changed dramatically. The evaluation of the crash box deformation showed much more and frequently failure scenarios using the fine mesh (figure 8).
ANSYS Conference & 25th CADFEM Users’ Meeting 2007 November 21-23, 2007 Congress Center Dresden, Germany 6
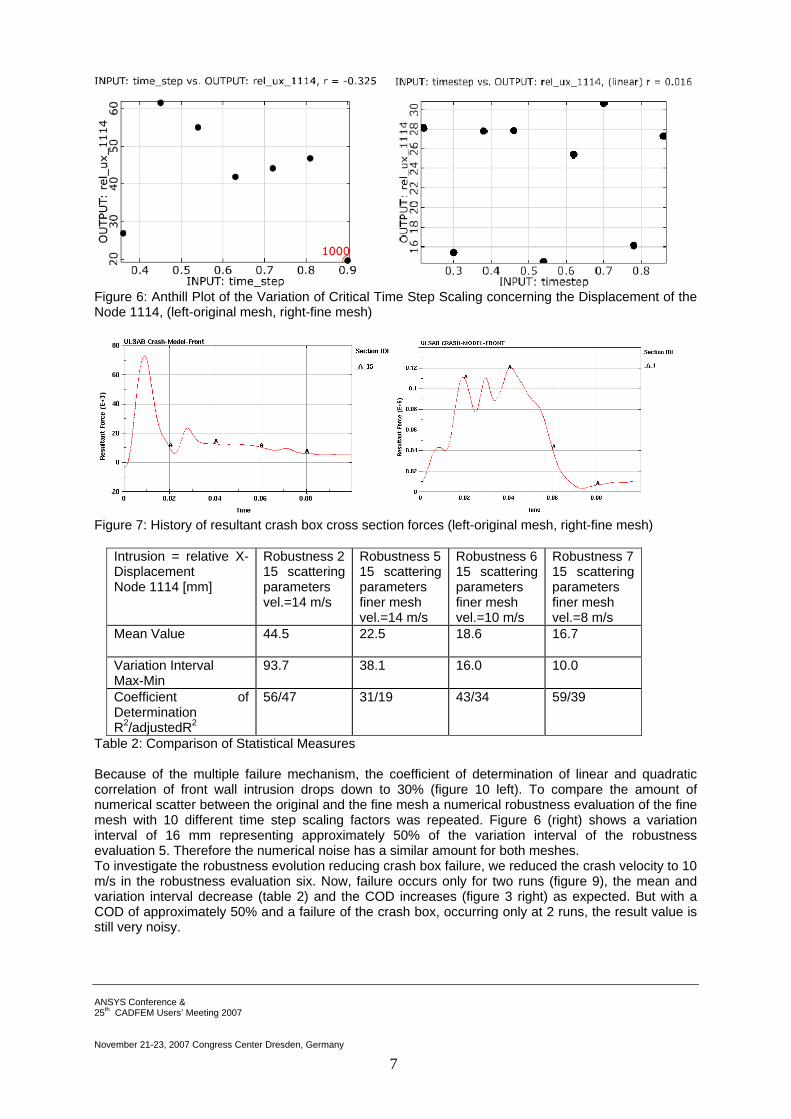
Figure 6: Anthill Plot of the Variation of Critical Time Step Scaling concerning the Displacement of the Node 1114, (left-original mesh, right-fine mesh)
Figure 7: History of resultant crash box cross section forces (left-original mesh, right-fine mesh)
Intrusion = relative X-Displacement Node 1114 [mm]
Robustness 2 15 scattering parameters vel.=14 m/s
Robustness 5 15 scattering parameters finer mesh vel.=14 m/s
Robustness 6 15 scattering parameters finer mesh vel.=10 m/s
Robustness 7 15 scattering parameters finer mesh vel.=8 m/s
Mean Value 44.5 22.5 18.6
16.7
Variation Interval Max-Min
93.7 38.1 16.0
10.0
Coefficient of Determination R2/adjustedR2
56/47 31/19 43/34 59/39
Table 2: Comparison of Statistical Measures Because of the multiple failure mechanism, the coefficient of determination of linear and quadratic correlation of front wall intrusion drops down to 30% (figure 10 left). To compare the amount of numerical scatter between the original and the fine mesh a numerical robustness evaluation of the fine mesh with 10 different time step scaling factors was repeated. Figure 6 (right) shows a variation interval of 16 mm representing approximately 50% of the variation interval of the robustness evaluation 5. Therefore the numerical noise has a similar amount for both meshes. To investigate the robustness evolution reducing crash box failure, we reduced the crash velocity to 10 m/s in the robustness evaluation six. Now, failure occurs only for two runs (figure 9), the mean and variation interval decrease (table 2) and the COD increases (figure 3 right) as expected. But with a COD of approximately 50% and a failure of the crash box, occurring only at 2 runs, the result value is still very noisy.
ANSYS Conference & 25th CADFEM Users’ Meeting 2007 November 21-23, 2007 Congress Center Dresden, Germany 7

Figure 8: different failure mechanisms, fine mesh, velocity 14 m/s
Figure 9: different failure mechanisms, fine mesh, velocity 10 m/s
Figure 10: COD of Intrusion at Node 1114, fine mesh, left: 14 m/s, right: 10 m/s We further reduced the crash velocity to 8 m/s in the robustness evaluation seven. Now, failure occurs only for one run (figure 11), the mean and variation interval decrease (table 2) and the COD increases (figure 3 right) as expected. Now for the first time „outlier“ can be identified in the Anthill plots and after removing the failed design the Coefficient of Determination reach 80% (figure 12) and the robustness of design can be evaluated with sufficient levels of determination. Comparing the coefficients of determination of figure 11 and 12 it can be seen how much outlier influence the statistical measurements of importance. Thereby, this benchmark example could demonstrate within different sub spaces of the robustness problem in exemplary manner that robustness evaluations can provide reliable statistical measures for variation and correlation prognosis of result variables.
ANSYS Conference & 25th CADFEM Users’ Meeting 2007 November 21-23, 2007 Congress Center Dresden, Germany 8

Figure 11: CoD, Anthill and deformation plot of „outlier“design 7, fine mesh, velocity 8 m/s
igure 12: CoD, Anthill and deformation plot of design 39, fine mesh, velocity 8 m/s F
ANSYS Conference & 25th CADFEM Users’ Meeting 2007 November 21-23, 2007 Congress Center Dresden, Germany 9

ANSYS Conference & 25th CADFEM Users’ Meeting 2007 November 21-23, 2007 Congress Center Dresden, Germany 10
It could be shown that for velocities higher than 8 m/s the design is not robust. For velocity higher than 8 m/s large front wall intrusions occur and only about 50% of the scatter in the front wall intrusion can be explained with identified correlations to input scatter. Thereby the amount of scatter is relatively independent from the amount of input scatter and large variation occurs also by varying critical time step factor only. That indicates that a significant amount of numerical scatter exist and influences significantly the failure mechanisms of the crash box. In practical applications, it would be advisable after the first robustness evaluation with high amount of failure and small measures of determination to search for the cause of failure and to increase the robustness of the model with numerical (improved modeling) or structural (additional resistance) improvements.
4. Conclusions
A new systematic approach was developed for determining the robustness of important performance parameters of crash test computation qualitatively and quantitatively. Primary result of the robustness evaluation is the estimation of the scatter of important result variables. Furthermore, sensitive scattering input variables can be identified and the determination of result variables can be examined. Assumptions concerning activated nonlinear correlations (clustering/outliers/bifurcation) caused by input scatter can be verified. By using measures of determination, the quantitative influence of numerical noise on the variation of result variables can be estimated and thereby, an important contribution to the reliability of prognosis and quality of the crash test computations can be given. The breakthrough in practical application and the acceptance of stochastic analysis for robustness evaluations was achieved by using linear and quadratic correlations and the corresponding measures of determination as well as by projection of statistical measures on the finite element structure. The quantitative estimation of the measures of determination and the securing of large measures of determination are not only meaningful in robustness evaluations of final designs. If crash tests are an integral part of multi-disciplinary optimization tasks [9], the measures of determination should also be secured for the result values. Here, the measures of determination in the design space of optimization can be used as quality criteria for the applicability of results in constraints or objective functions [10].
5. References
[1] Will, J.; Baldauf, H.: Integration rechnerischer Robustheitsbewertungen in die virtuelle Auslegung passiver Fahrzeugsicherheit bei der BMW AG, VDI-Berichte Nr. 1976, Berechnung und Simulation im Fahrzeugbau, 2006, Seite 851-873
[2] Will, J.; Bucher, C.; Ganser, M.; Grossenbacher, K.:Computation and visualization of statistical measures on Finite Element structures for forming simulations; Proceedings Weimarer Optimierung- und Stochastiktage 2.0, 2005, Weimar, Germany; www.dynardo.de
[3] Will, J., Baldauf, H.; Bucher, C.: Robustness Evaluations in Virtual Dimensioning of Passive Passenger Safety and Crashworthiness, Proceedings Weimarer Optimierungs- und Stochastiktage 3.0, 2006, Weimar, Germany
[4] Will, J.: Bucher, C.: Statistische Maße für rechnerische Robustheitsbewertungen CAE-gestützter Berechnungsmodelle, Proceedings Weimarer Optimierungs- und Stochastiktage 3.0, 2006, Weimar, Germany.
[5] Macke, M.; Bucher, C.: Importance sampling for randomly excited dynamical systems. Journal of Sound and Vibration, (268):269–290, 2003.
[6] Roos, D.; Adam, U.; Bayer, V.: Design Reliability Analysis; Proceedings Weimarer Optimierungs- und Stochastiktage 3.0, 2006, Weimar, Germany
[7] optiSLang - the Optimizing Structural Language, Version 2.1, DYNARDO, Weimar, 2006, www.dynardo.de
[8] SoS - Statistics_on_Structure, Version 1.0, DYNARDO 2007, Weimar, www.dynardo.de [9] Duddeck, F.: Multidisziplinäre Optimierung im Produktentwicklungsprozess der
Automobilindustrie; Proceedings Weimarer Optimierung- und Stochastiktage 2.0, 2005, Weimar, Germany
[10] Blum, S.; Will, J.: Combining Robustness Evaluation with Current Automotive MDO Application, Proceedings Weimarer Optimierungs- und Stochastiktage 3.0, 2006, Weimar, Germany