robust co-occurrence quantification for lexical ...mpurver/papers/milajevs-et-al14acl.pdfrobust...
TRANSCRIPT

Robust Co-occurrence Quantification for Lexical Distributional Semantics
Dmitrijs Milajevs Mehrnoosh Sadrzadeh Matthew PurverQueen Mary University of London
London, UK{d.milajevs,m.sadrzadeh,m.purver}@qmul.ac.uk
Abstract
Previous optimisations of parameters af-fecting the word-context association mea-sure used in distributional vector spacemodels have focused either on high-dimensional vectors with hundreds ofthousands of dimensions, or dense vec-tors with dimensionality of few hundreds;but dimensionality of few thousands is of-ten applied in compositional tasks as it isstill computationally feasible and does notrequire the dimensionality reduction step.We present a systematic study of the in-teraction of the parameters of the associ-ation measure and vector dimensionality,and derive parameter selection heuristicsthat achieve performance across word sim-ilarity and relevance datasets competitivewith the results previously reported in theliterature achieved by highly dimensionalor dense models.
1 Introduction
Words that occur in similar context have simi-lar meaning (Harris, 1954). Thus the meaningof a word can be modeled by counting its co-occurrence with neighboring words in a corpus.Distributional models of meaning represent co-occurrence information in a vector space, wherethe dimensions are the neighboring words and thevalues are co-occurrence counts. Successful mod-els need to be able to discriminate co-occurrenceinformation, as not all co-occurrence counts areequally useful, for instance, the co-occurrencewith the article the is less informative than with aword existence. Another fundamental question isthe vector space dimensionality and what neighborwords correspond to them.
Levy et al. (2015) propose optimisations forco-occurrence-based distributional models, us-ing parameters adopted from predictive mod-els (Mikolov et al., 2013): shifting and contextdistribution smoothing. Their experiments andthus their parameter recommendations use high-dimensional vector spaces with word vector di-mensionality of almost 200K, and many recentstate-of-the-art results in lexical distributional se-mantics have been obtained using vectors withsimilarly high dimensionality (Baroni et al., 2014;Kiela and Clark, 2014; Lapesa and Evert, 2014).
In contrast, much work on compositional dis-tributional semantics employs vectors with muchfewer dimensions: e.g. 2K (Grefenstette andSadrzadeh, 2011; Kartsaklis and Sadrzadeh, 2014;Milajevs et al., 2014), 3K (Dinu and Lapata, 2010;Milajevs and Purver, 2014) or 10K (Polajnar andClark, 2014; Baroni and Zamparelli, 2010). Themost common reason thereof is that these modelsassign tensors to functional words. For a vectorspace V with k dimensions, a tensor V ⊗V · · ·⊗Vof rank n has kn dimensions. Adjectives and in-transitive verbs have tensors of rank 2, transitiveverbs are of rank 3; for coordinators, the rank cango up to 7. Taking k = 200K already results ina highly intractable tensor of 8 × 10¹⁵ dimensionsfor a transitive verb.
An alternative way of obtaining a vector spacewith few dimensions, usually with just 100–500, isthe use of SVD as a part of Latent Semantic Anal-ysis (Dumais, 2004) or another models such asSGNS (Mikolov et al., 2013) and GloVe (Penning-ton et al., 2014). However, these models take moretime to instantiate in comparison to weighting of aco-occurrence matrix and bring more parametersto explore. In this work we focus on vector spacesthat directly weight a co-occurrence matrix and re-port results for SVD, GloVe and SGNS from thestudy of Levy et al. (2015) for comparison.

Parameter Values
Dimensionality D1K, 2K, 3K, 5K10K, 20K, 30K, 40K, 50K
discr PMI, CPMI, SPMI, SCPMIfreq 1, n, lognneg 0.2, 0.5, 0.7, 1, 1.4, 2, 5, 7cds global, 1, 0.75Similarity Cosine, Correlation
Table 1: Model parameters and their values.
The mismatch of experiments with non-densemodels in vector dimensionality between lexicaland compositional tasks gives rise to a number ofquestions:
• To what extent does model performance de-pend on vector dimensionality?
• Do parameters influence 200K and 1K di-mensional models similarly? Can the find-ings of Levy et al. (2015) be directly appliedto models with few thousand dimensions?
• If not, can we derive suitable parameter se-lection heuristics which take account of di-mensionality?
To answer these questions, we perform a sys-tematic study of distributional models with a richset of parameters on SimLex-999 (Hill et al.,2014), a lexical similairty dataset, and test selectedmodels on MEN (Bruni et al., 2014), a lexical re-latedness dataset.
2 Parameters
2.1 PMI variants (discr)
Most co-occurrence weighting schemes in distri-butional semantics are based on point-wise mutualinformation (PMI, Equation 1) (see e.g. Churchand Hanks (1990), Turney and Pantel (2010), Levyand Goldberg (2014)).
PMI(x, y) = logP (x, y)
P (x)P (y)(1)
As commonly done, we replace the infinite PMIvalues with zeroes and use PMI hereafter to referto a weighting with this fix. An alternative solutionis to increment the probability ratio by 1; we referto this as compressed PMI (CPMI):
CPMI(x, y) = log(1 +
P (x, y)
P (x)P (y)
)(2)
2.2 Shifted PMI (neg)
Many approaches use only positive PMI values, asnegative PMI values may not positively contributeto model performance (Turney and Pantel, 2010).This can be generalised to an additional cutoff pa-rameter k (neg) following Levy et al. (2015), giv-ing our third PMI variant (abbreviated as SPMI):
SPMIk = max(0,PMI(x, y)− log k) (3)
We can apply the same idea to CPMI:
SCPMIk = max(0,CPMI(x, y)− log 2k) (4)
2.3 Frequency weighting (freq)
Another issue with PMI is its bias towards rareevents (Levy et al., 2015); one way of solving thisissue is to weight the value by the co-occurrencefrequency (Evert, 2005):
LMI(x, y) = n(x, y) PMI(x, y) (5)
where n(x, y) is the number of times x was seentogether with y. For clarity, we refer to n-weightedPMIs as nPMI, nSPMI, etc. When this weightingcomponent is set to 1, it has no effect; we can ex-plicitly label it as 1PMI, 1SPMI, etc.
In addition to the extreme 1 and n weightings,we also experiment with a log n weighting.
2.4 Context distribution smoothing (cds)
Levy et al. (2015) show that performance is af-fected by smoothing the context distribution P (x):
Pα(x) =n(x)α∑c n(c)
α(6)
We experiment with α=1 (no smoothing) and α =0.75. We call this estimation method local contextprobability; we can also estimate a global contextprobability based on the size of the corpus C:
P (x) =n(x)
|C|(7)
2.5 Vector dimensionality (D)
As context words we select the 1K, 2K, 3K, 5K,10K, 20K, 30K, 40K and 50K most frequent lem-matised nouns, verbs, adjectives and adverbs. Allcontext words are part of speech tagged, but wedo not distinguish between refined word types(e.g. intransitive vs. transitive versions of verbs).
−0.05
0.00
0.05
0.10
0.15
0.20
0.25
0.30
0.35
0.40
Sim
Lex9
99
freq = 1 | discr = pmi freq = 1 | discr = cpmi freq = 1 | discr = spmi freq = 1 | discr = scpmi
−0.05
0.00
0.05
0.10
0.15
0.20
0.25
0.30
0.35
0.40
Sim
Lex9
99
freq = n | discr = pmi freq = n | discr = cpmi freq = n | discr = spmi freq = n | discr = scpmi
1000 2000 3000 5000 10000 20000 30000 40000 50000dimensionality
−0.05
0.00
0.05
0.10
0.15
0.20
0.25
0.30
0.35
0.40
Sim
Lex9
99
freq = logn | discr = pmi
1000 2000 3000 5000 10000 20000 30000 40000 50000dimensionality
freq = logn | discr = cpmi
1000 2000 3000 5000 10000 20000 30000 40000 50000dimensionality
freq = logn | discr = spmi
1000 2000 3000 5000 10000 20000 30000 40000 50000dimensionality
freq = logn | discr = scpmi
cdsglobal10.75
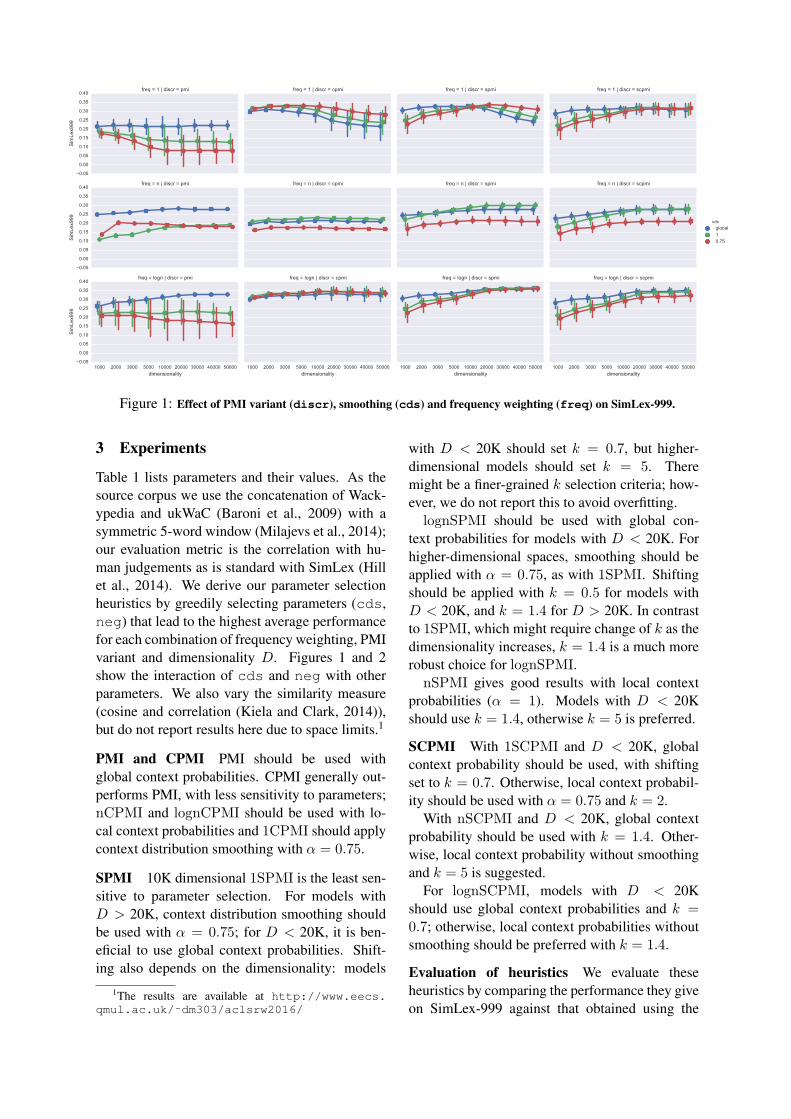
Figure 1: Effect of PMI variant (discr), smoothing (cds) and frequency weighting (freq) on SimLex-999.
3 Experiments
Table 1 lists parameters and their values. As thesource corpus we use the concatenation of Wack-ypedia and ukWaC (Baroni et al., 2009) with asymmetric 5-word window (Milajevs et al., 2014);our evaluation metric is the correlation with hu-man judgements as is standard with SimLex (Hillet al., 2014). We derive our parameter selectionheuristics by greedily selecting parameters (cds,neg) that lead to the highest average performancefor each combination of frequency weighting, PMIvariant and dimensionality D. Figures 1 and 2show the interaction of cds and neg with otherparameters. We also vary the similarity measure(cosine and correlation (Kiela and Clark, 2014)),but do not report results here due to space limits.1
PMI and CPMI PMI should be used withglobal context probabilities. CPMI generally out-performs PMI, with less sensitivity to parameters;nCPMI and lognCPMI should be used with lo-cal context probabilities and 1CPMI should applycontext distribution smoothing with α = 0.75.
SPMI 10K dimensional 1SPMI is the least sen-sitive to parameter selection. For models withD > 20K, context distribution smoothing shouldbe used with α = 0.75; for D < 20K, it is ben-eficial to use global context probabilities. Shift-ing also depends on the dimensionality: models
1The results are available at http://www.eecs.qmul.ac.uk/˜dm303/aclsrw2016/
with D < 20K should set k = 0.7, but higher-dimensional models should set k = 5. Theremight be a finer-grained k selection criteria; how-ever, we do not report this to avoid overfitting.lognSPMI should be used with global con-
text probabilities for models with D < 20K. Forhigher-dimensional spaces, smoothing should beapplied with α = 0.75, as with 1SPMI. Shiftingshould be applied with k = 0.5 for models withD < 20K, and k = 1.4 for D > 20K. In contrastto 1SPMI, which might require change of k as thedimensionality increases, k = 1.4 is a much morerobust choice for lognSPMI.nSPMI gives good results with local context
probabilities (α = 1). Models with D < 20Kshould use k = 1.4, otherwise k = 5 is preferred.
SCPMI With 1SCPMI and D < 20K, globalcontext probability should be used, with shiftingset to k = 0.7. Otherwise, local context probabil-ity should be used with α = 0.75 and k = 2.
With nSCPMI and D < 20K, global contextprobability should be used with k = 1.4. Other-wise, local context probability without smoothingand k = 5 is suggested.
For lognSCPMI, models with D < 20Kshould use global context probabilities and k =0.7; otherwise, local context probabilities withoutsmoothing should be preferred with k = 1.4.
Evaluation of heuristics We evaluate theseheuristics by comparing the performance they giveon SimLex-999 against that obtained using the

−0.1
0.0
0.1
0.2
0.3
0.4
0.5
Sim
Lex9
99
discr = spmi | freq = 1 discr = spmi | freq = n discr = spmi | freq = logn
1000 2000 3000 5000 10000 20000 30000 40000 50000dimensionality
−0.1
0.0
0.1
0.2
0.3
0.4
0.5
Sim
Lex9
99
discr = scpmi | freq = 1
1000 2000 3000 5000 10000 20000 30000 40000 50000dimensionality
discr = scpmi | freq = n
1000 2000 3000 5000 10000 20000 30000 40000 50000dimensionality
discr = scpmi | freq = logn
neg0.20.50.711.4257
Figure 2: The behaviour of shifted PMI (SPMI) on SimLex-999.
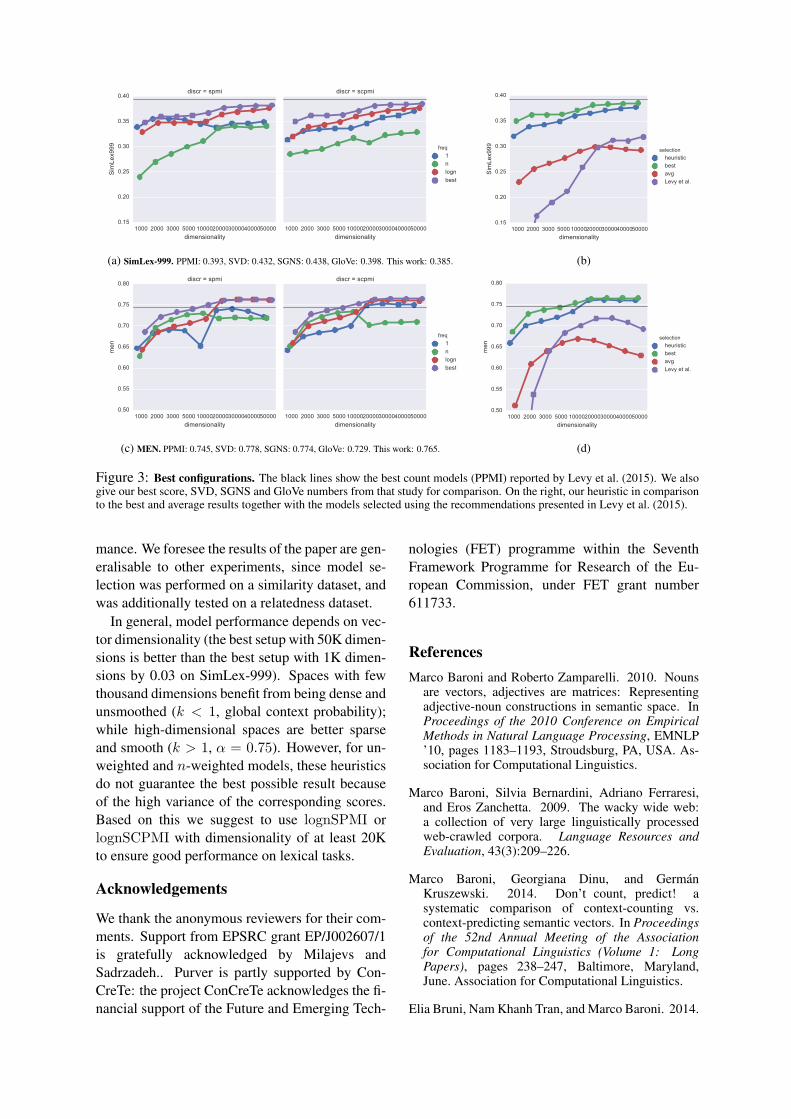
best possible parameter selections (determined viaan exhaustive search at each dimensionality set-ting). We also compare them to the best scoresreported by Levy et al. (2015) for their model(PMI and SVD), word2vec-SGNS (Mikolov et al.,2013) and GloVe (Pennington et al., 2014) – seeFigure 3a (only the better-performing SPMI andSCPMI are shown).
For lognPMI and lognCPMI, our heuristicspick the best possible models. For lognSPMI,where performance variance is low, the heuris-tics do well, giving a performance of no morethan 0.01 points below the best configuration. For1SPMI and nSPMI the difference is higher. WithlognSCPMI and 1SCPMI, the heuristics followthe best selection, but with a wider gap than theSPMI models. In general n-weighted models donot perform as well as others.
Overall, log n weighting should be used withPMI, CPMI and SCPMI. High-dimensional SPMImodels show the same behaviour, but if D <10K, no weighting should be applied. SPMI andSCPMI should be preferred over CPMI and PMI.As Figure 3b shows, our heuristics give perfor-mance close to the optimum for any dimensional-ity, with a large improvement over both an averageparameter setting and the parameters suggested by(Levy et al., 2015) in a high-dimensional setting.2
Finally, to see whether the heuristics transferrobustly, we repeat this comparison on the MENdataset (see Figures 3c, 3d). Again, PMI and
2Our results using (Levy et al., 2015)’s parameters differslightly from theirs due to different window sizes (5 vs 2).
Model SimLex-999 MEN
PPMI∗ 0.393 0.745SVD∗ 0.432 0.778SGNS∗ 0.438 0.774GloVe∗ 0.398 0.729
This work 0.385 0.765
Table 2: Our model in comparison to the pre-vious work. On the similarity dataset our modelis 0.008 points behind a PPMI model, however onthe relatedness dataset 0.020 points above. Notethe difference in dimensionality and source cor-pora, and window size. SVD, SGNS and GloVenumbers are given for comparison. ∗Results re-ported by Levy et al. (2015).
CPMI follow the best possible setup, with SPMIand SCPMI showing only a slight drop below idealperformance; and again, the heuristic settings giveperformance close to the optimum, and signifi-cantly higher than average or standard parameters.
4 Conclusion
This paper presents a systematic study of co-occurrence quantification focusing on the se-lection of parameters presented in Levy et al.(2015). We replicate their recommendation forhigh-dimensional vector spaces, and show thatwith appropriate parameter selection it is possibleto achieve comparable performance with spaces ofdimensionality of 1K to 50K, and propose a set ofmodel selection heuristics that maximizes perfor-
1000 2000 3000 5000 1000020000300004000050000dimensionality
0.15
0.20
0.25
0.30
0.35
0.40
Sim
Lex9
99
discr = spmi
1000 2000 3000 5000 1000020000300004000050000dimensionality
discr = scpmi
freq1nlognbest
(a) SimLex-999. PPMI: 0.393, SVD: 0.432, SGNS: 0.438, GloVe: 0.398. This work: 0.385.
1000 2000 3000 5000 1000020000300004000050000dimensionality
0.15
0.20
0.25
0.30
0.35
0.40
Sim
Lex9
99 selectionheuristicbestavgLevy et al.
(b)
1000 2000 3000 5000 1000020000300004000050000dimensionality
0.50
0.55
0.60
0.65
0.70
0.75
0.80
men
discr = spmi
1000 2000 3000 5000 1000020000300004000050000dimensionality
discr = scpmi
freq1nlognbest
(c) MEN. PPMI: 0.745, SVD: 0.778, SGNS: 0.774, GloVe: 0.729. This work: 0.765.
1000 2000 3000 5000 1000020000300004000050000dimensionality
0.50
0.55
0.60
0.65
0.70
0.75
0.80
men
selectionheuristicbestavgLevy et al.
(d)
Figure 3: Best configurations. The black lines show the best count models (PPMI) reported by Levy et al. (2015). We alsogive our best score, SVD, SGNS and GloVe numbers from that study for comparison. On the right, our heuristic in comparisonto the best and average results together with the models selected using the recommendations presented in Levy et al. (2015).
mance. We foresee the results of the paper are gen-eralisable to other experiments, since model se-lection was performed on a similarity dataset, andwas additionally tested on a relatedness dataset.
In general, model performance depends on vec-tor dimensionality (the best setup with 50K dimen-sions is better than the best setup with 1K dimen-sions by 0.03 on SimLex-999). Spaces with fewthousand dimensions benefit from being dense andunsmoothed (k < 1, global context probability);while high-dimensional spaces are better sparseand smooth (k > 1, α = 0.75). However, for un-weighted and n-weighted models, these heuristicsdo not guarantee the best possible result becauseof the high variance of the corresponding scores.Based on this we suggest to use lognSPMI orlognSCPMI with dimensionality of at least 20Kto ensure good performance on lexical tasks.
Acknowledgements
We thank the anonymous reviewers for their com-ments. Support from EPSRC grant EP/J002607/1is gratefully acknowledged by Milajevs andSadrzadeh.. Purver is partly supported by Con-CreTe: the project ConCreTe acknowledges the fi-nancial support of the Future and Emerging Tech-
nologies (FET) programme within the SeventhFramework Programme for Research of the Eu-ropean Commission, under FET grant number611733.
ReferencesMarco Baroni and Roberto Zamparelli. 2010. Nouns
are vectors, adjectives are matrices: Representingadjective-noun constructions in semantic space. InProceedings of the 2010 Conference on EmpiricalMethods in Natural Language Processing, EMNLP’10, pages 1183–1193, Stroudsburg, PA, USA. As-sociation for Computational Linguistics.
Marco Baroni, Silvia Bernardini, Adriano Ferraresi,and Eros Zanchetta. 2009. The wacky wide web:a collection of very large linguistically processedweb-crawled corpora. Language Resources andEvaluation, 43(3):209–226.
Marco Baroni, Georgiana Dinu, and GermanKruszewski. 2014. Don’t count, predict! asystematic comparison of context-counting vs.context-predicting semantic vectors. In Proceedingsof the 52nd Annual Meeting of the Associationfor Computational Linguistics (Volume 1: LongPapers), pages 238–247, Baltimore, Maryland,June. Association for Computational Linguistics.
Elia Bruni, Nam Khanh Tran, and Marco Baroni. 2014.

Multimodal distributional semantics. J. Artif. Int.Res., 49(1):1–47, January.
Kenneth Ward Church and Patrick Hanks. 1990. Wordassociation norms mutual information, and lexicog-raphy. Computational Linguistics, 16(1):22–29.
Georgiana Dinu and Mirella Lapata. 2010. Measuringdistributional similarity in context. In Proceedingsof the 2010 Conference on Empirical Methods inNatural Language Processing, EMNLP ’10, pages1162–1172, Stroudsburg, PA, USA. Association forComputational Linguistics.
Susan T. Dumais. 2004. Latent semantic analysis. An-nual Review of Information Science and Technology,38(1):188–230.
Stefan Evert. 2005. The statistics of word cooccur-rences: word pairs and collocations. Ph.D. the-sis, Universitt Stuttgart, Holzgartenstr. 16, 70174Stuttgart.
Edward Grefenstette and Mehrnoosh Sadrzadeh. 2011.Experimental support for a categorical composi-tional distributional model of meaning. In Proceed-ings of the Conference on Empirical Methods inNatural Language Processing, EMNLP ’11, pages1394–1404, Stroudsburg, PA, USA. Association forComputational Linguistics.
Z.S. Harris. 1954. Distributional structure. Word.
Felix Hill, Roi Reichart, and Anna Korhonen. 2014.Simlex-999: Evaluating semantic models with(genuine) similarity estimation. arXiv preprintarXiv:1408.3456.
Dimitri Kartsaklis and Mehrnoosh Sadrzadeh. 2014. Astudy of entanglement in a categorical framework ofnatural language. In Proceedings of the 11th Work-shop on Quantum Physics and Logic (QPL), Kyoto,Japan, June.
Douwe Kiela and Stephen Clark. 2014. A systematicstudy of semantic vector space model parameters.In Proceedings of the 2nd Workshop on Continu-ous Vector Space Models and their Compositionality(CVSC), pages 21–30, Gothenburg, Sweden, April.Association for Computational Linguistics.
Gabriella Lapesa and Stefan Evert. 2014. A large scaleevaluation of distributional semantic models: Pa-rameters, interactions and model selection. Transac-tions of the Association for Computational Linguis-tics, 2:531–545.
Omer Levy and Yoav Goldberg. 2014. Neuralword embedding as implicit matrix factorization.In Z. Ghahramani, M. Welling, C. Cortes, N.D.Lawrence, and K.Q. Weinberger, editors, Advancesin Neural Information Processing Systems 27, pages2177–2185. Curran Associates, Inc.
Omer Levy, Yoav Goldberg, and Ido Dagan. 2015. Im-proving distributional similarity with lessons learnedfrom word embeddings. Transactions of the Associ-ation for Computational Linguistics, 3:211–225.
Tomas Mikolov, Kai Chen, Greg Corrado, and Jef-frey Dean. 2013. Efficient estimation of wordrepresentations in vector space. arXiv preprintarXiv:1301.3781.
Dmitrijs Milajevs and Matthew Purver. 2014. Inves-tigating the contribution of distributional semanticinformation for dialogue act classification. In Pro-ceedings of the 2nd Workshop on Continuous VectorSpace Models and their Compositionality (CVSC),pages 40–47, Gothenburg, Sweden, April. Associa-tion for Computational Linguistics.
Dmitrijs Milajevs, Dimitri Kartsaklis, MehrnooshSadrzadeh, and Matthew Purver. 2014. Evaluatingneural word representations in tensor-based compo-sitional settings. In Proceedings of the 2014 Con-ference on Empirical Methods in Natural LanguageProcessing (EMNLP), pages 708–719, Doha, Qatar,October. Association for Computational Linguistics.
Jeffrey Pennington, Richard Socher, and ChristopherManning. 2014. Glove: Global vectors for wordrepresentation. In Proceedings of the 2014 Con-ference on Empirical Methods in Natural LanguageProcessing (EMNLP), pages 1532–1543, Doha,Qatar, October. Association for Computational Lin-guistics.
Tamara Polajnar and Stephen Clark. 2014. Improv-ing distributional semantic vectors through contextselection and normalisation. In Proceedings of the14th Conference of the European Chapter of the As-sociation for Computational Linguistics, pages 230–238, Gothenburg, Sweden, April. Association forComputational Linguistics.
Peter D. Turney and Patrick Pantel. 2010. From fre-quency to meaning: Vector space models of seman-tics. J. Artif. Int. Res., 37(1):141–188, January.