roboads: anomaly detection against sensor and actuator...
TRANSCRIPT

RoboADS: Anomaly Detection against Sensor andActuator Misbehaviors in Mobile Robots
Pinyao Guo∗, Hunmin Kim†, Nurali Virani‡, Jun Xu∗, Minghui Zhu† and Peng Liu∗∗College of Information Sciences and Technology, Pennsylvania State University, University Park, PA 16802, USA
{pug132,jxx13,pliu}@ist.psu.edu†School of Electrical Engineering and Computer Science, Pennsylvania State University, University Park, PA 16802, USA
{huk164,muz16}@psu.edu‡GE Global Research, Niskayuna, NY 12309, USA
Abstract—Mobile robots such as unmanned vehicles inte-grate heterogeneous capabilities in sensing, computation, andcontrol. They are representative cyber-physical systems wherethe cyberspace and the physical world are strongly coupled.However, the safety of mobile robots is significantly threatenedby cyber/physical attacks and software/hardware failures. Thesethreats can thwart normal robot operations and cause robotmisbehaviors. In this paper, we propose a novel anomaly detectionsystem, which leverages physical dynamics of mobile robotsto detect misbehaviors in sensors and actuators. We exploreissues raised in real-world implementations, e.g., distinctiverobot dynamic models, sensor quantity and quality, decisionparameters, etc., for practicality purposes. We implement thedetection system on two types of mobile robots and evaluatethe detection performance against various misbehavior scenarios,including signal interference, sensor spoofing, logic bomb andphysical jamming. The experiments show detection effectivenessand small detection delays.
I. INTRODUCTION
Recent years have witnessed a rapid growth in the robotics
industry. According to market intelligence prediction [1],
global spending on robotics and related services will reach
$188 billion in 2020. The sheer size of robotics volume
is deployed in various applications, including defense and
homeland security, agricultural, and manufacture [2]. Recent
market predicts a major growth in household and entertainment
applications [3]. Mobile robots, as a typical type of robot
systems, have capabilities of movement in particular work
environments and carry out specific missions. Some repre-
sentative mobile robots include household cleaning robots,
military surveillance drones, warehouse robots, autonomous
vehicles, ships, etc. Major tech companies (e.g., Google, Uber,
Tesla) are leading intensive developments of autonomous cars
to replace human drivers in near future [4].
Unlike traditional cyber systems such as computers or
mobile phones, mobile robots are characterized by a strong
coupling of the cyberspace and the physical world in which
they operate. Mobile robots are equipped with sensors, actu-
ators, and control units. In a typical control iteration, sensors
(e.g., GPS, accelerometer) measure the states (e.g., position,
orientation) of robots and their surrounding environment. The
readings are fed to control units (e.g., electrical control unit
(ECU)) for control command generation based on mission
specifications. Actuators (e.g., rotor, wheel) execute control
commands in the physical world. However, a variety of sources
could significantly threaten normal operation and safety of mo-
bile robots, leading to misbehaviors that deviate robots from
planned mission executions. Firstly, the cyber components are
inherently vulnerable to cyber attacks or software failures.
These vulnerabilities can be exploited to transcend cyber
defenses and further escalate into disastrous consequences in
the physical world. Secondly, physical attacks and hardware
failures can cause misperception of the environment or unpre-
dictable maneuvers. In 2011, an American surveillance drone
was claimed to be brought down by Iranian cyber warfare
units through GPS spoofing attacks [5]. Several researchers
demonstrated jamming, spoofing, and DoS attacks on sensors
including ultrasonic, radar [6], gyroscope [7], GPS [8], and
LiDAR [9] on modern robots. Besides sensors, researchers
launched remote hacks into multiple vehicle models such
as Ford Escape [10], Jeep Cherokee [11] and Tesla Model
S [12]. They were able to manipulate crucial actuators such
as steering wheels and gas pedals. During 2009-11, Toyota
recalled millions of sedans because of a software design defect
that could potentially cause unintended acceleration [13].
According to California DMV [14], Google reported 272 au-
tonomous vehicle disengagements because of sensor, actuator
or communication failures in 2015.
In this paper, we focus on the detection of misbehaviors
that actively influence robot behavior and cause damages in
the physical world. Down to their consequences, active misbe-
haviors can be classified into sensor misbehaviors and actuator
misbehaviors. Sensor misbehaviors, e.g., GPS spoofing, alter
authentic sensor readings received by controller units. Actuatormisbehaviors, e.g., steering wheel take-over, directly alter
control commands executed by robot actuators. A misbehavior
could be caused by multiple sources. In this paper, we focus
on the detection of misbehaviors, rather than identifying how
they originate in the first place. In addition, we do not consider
passive attacks or failures that do not affect robot motion
behaviors, e.g., eavesdropping attacks.
To detect the two types of mobile robot misbehaviors, we
propose a robot anomaly detection system (RoboADS) using a
model-based estimation approach. In this approach, sensor and
574
2018 48th Annual IEEE/IFIP International Conference on Dependable Systems and Networks
2158-3927/18/$31.00 ©2018 IEEEDOI 10.1109/DSN.2018.00065

actuator misbehaviors are modeled as data corruptions in the
sensor readings and control commands, respectively, regardless
of where and how they originate. Leveraging robot dynamic
models, RoboADS builds correlations between potentially
corrupted sensor readings and control commands. Using robot
states as intermediate, authentic sensor readings and control
commands are estimated. The discrepancies found between
estimated values and measured values indicate the occurrence
of misbehaviors.It is challenging to build a practically effective anomaly
detection system (ADS) for mobile robots. Firstly, real-world
robots are mostly nonlinear systems subject to noises in
sensing and actuation. If not properly considered, nonlinearity
and noises can result in estimation errors and detection fail-
ures. Secondly, as shown in previous paragraphs, both sensor
and actuator misbehaviors can cause disastrous consequences
to robots. A practical ADS should detect both categories
simultaneously. Thirdly, since any sensor can be potentially
corrupted, the defender has no knowledge about its sensor
condition, i.e., which sensor(s) is/are clean or corrupted. How
to correctly identify the sensor condition and use appropriate
sensor readings during estimation need to be addressed. De-
spite a wide spectrum of model-based anomaly detection [15]–
[23] has been studied in recent years, no existing approach iscapable of handling all these challenges (details in II-C).
In this work, we develop a multi-mode unknown input andstate estimation algorithm (NUISE) to tackle the challenges.
The multi-mode NUISE considers fully nonlinear systems and
propagates noises along each derivation step. It includes a bank
of estimators where each estimator is associated with a partic-
ular sensor condition hypothesis. Each estimator conducts tests
and calculates a likelihood for its corresponding hypothesis.
The hypothesis with the highest likelihood can be used to
determine the ground truth of sensor conditions.An estimation-based ADS relies on several decision param-
eters to achieve an acceptable detection performance. Besides,
real-world mobile robots often have quite different properties,
such as sensor quantity and quality. How these properties and
parameters affect the performance of an ADS remains an open
problem. We evaluate the practicality issues for the real world
application of RoboADS.Our main contributions are summarized as follows:
• We propose a generalizable model-based anomaly detec-
tion system RoboADS for the detection of sensor and
actuator misbehaviors in nonlinear mobile robots subject
to stochastic noises on sensing and actuation.
• We provide quantitative understandings of how the robot
properties and ADS decision parameters affect the per-
formance of misbehavior detection in real-world robots.
• We build RoboADS prototypes on two types of mobile
robots and evaluate them with respect to its effectiveness
and efficiency against various attacks and failures. Both
evaluations show less than 3% of false positive rate and
less than 1% of false negative detection rate on average.
Detection delays remain within an average of 0.40s. In
addition, benchmark comparisons also demonstrate that
PlannerControl Units RoboADS Module
Communication Module
Actuator 1
Sensor 1Driver
Sensor 1
UtilityProcess 4
Actuator 1Driver
Utility Process 1
Sensor 2Driver
Sensor 2
Utility Process 2
...
...
SensingWorkflow 1
SensingWorkflow 2
ActuationWorkflow 1
Sensor 3Driver
Sensor 3
Utility Process 3
SensingWorkflow 3
Actuator 2
UtilityProcess 5
Actuator 2Driver
ActuationWorkflow 2
Robot Platform
...
Fig. 1. Mobile robot system model. Physical signals go through sensingworkflows and reach to the planner. The control units in the planner generatecontrol commands to accomplish given missions. Control commands areexecuted in the physical world via actuators. (Hollow arrows stand for sensorreading data flows, and filled arrows stand for control command data flows.)
the effectiveness of our RoboADS is significantly better
than a representative existing work for linear systems.
The remainder of this paper is organized as follows. Sec-
tion II provides the background of mobile robots and related
works in anomaly detection. Section III formalizes the prob-
lem. Section IV presents our approach. Section V presents the
evaluations on mobile robots. Section VI discusses issues in
the application of our approach. Section VII concludes.
II. OVERVIEW
This section firstly describes the system model for general
mobile robots considered in the paper. Then, we present a
categorization of active misbehaviors. We synthesize related
works in anomaly detection in mobile robots at the end. For
succinctness, mobile robots are referred to as robots in the
remaining of the paper.
A. Robot System Model
Figure 1 shows a general robot system model. It consists
of a robot platform and a planner. The planner is the control
center of a robot. It communicates with other parts of the
system, receives sensor readings, and generates control com-
mands. A communication bus connects all parts of the robot
and enables data transmission relying on protocols such as
CAN [24]. The robot interacts with the physical world through
sensors and actuators on its physical-layer. Robot cyber-layer
runs programs including device drivers, utility processes that
process data, etc. We define each sensing procedure including
the capture of physical signals (e.g., electromagnetic waves,
acoustic waves), signal digitization, data processing, encod-
ing, etc., as a sensing workflow. Analogously, we define the
counterpart procedure that receives, decodes, amplifies and
executes control commands in an actuator as an actuation
575
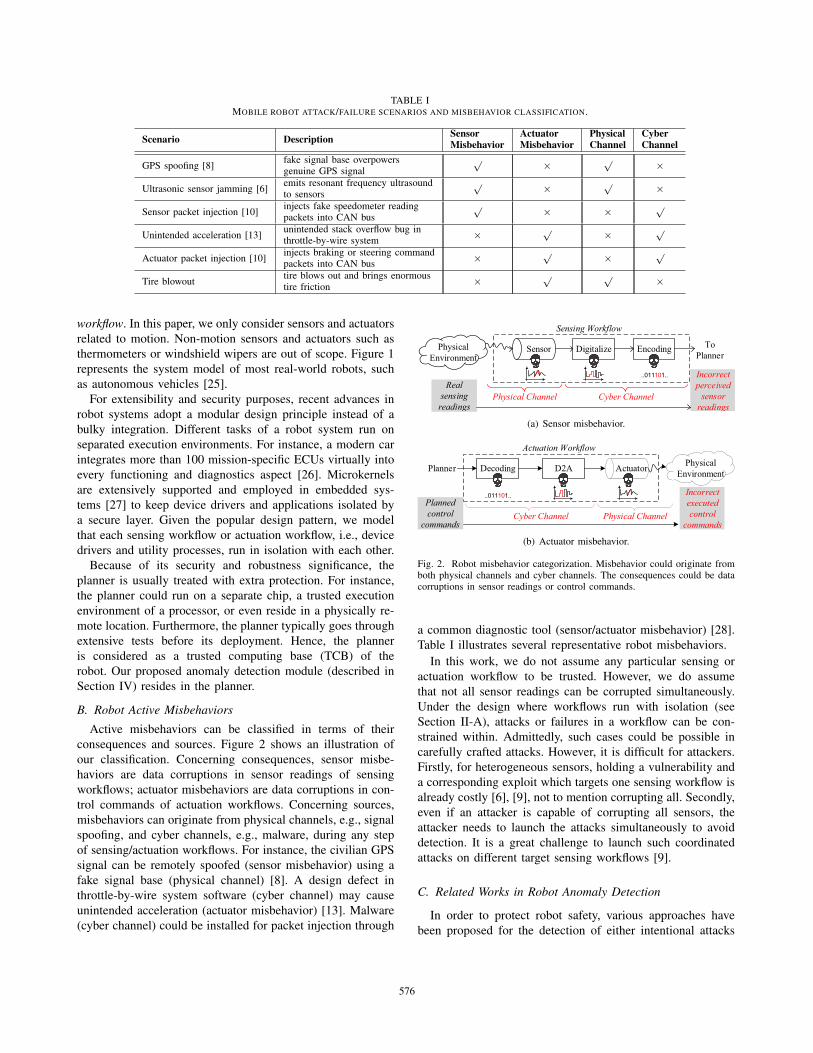
TABLE IMOBILE ROBOT ATTACK/FAILURE SCENARIOS AND MISBEHAVIOR CLASSIFICATION.
Scenario Description SensorMisbehavior
ActuatorMisbehavior
PhysicalChannel
CyberChannel
GPS spoofing [8]fake signal base overpowersgenuine GPS signal
√ × √ ×
Ultrasonic sensor jamming [6]emits resonant frequency ultrasoundto sensors
√ × √ ×
Sensor packet injection [10]injects fake speedometer readingpackets into CAN bus
√ × × √
Unintended acceleration [13]unintended stack overflow bug inthrottle-by-wire system
× √ × √
Actuator packet injection [10]injects braking or steering commandpackets into CAN bus
× √ × √
Tire blowouttire blows out and brings enormoustire friction
× √ √ ×
workflow. In this paper, we only consider sensors and actuators
related to motion. Non-motion sensors and actuators such as
thermometers or windshield wipers are out of scope. Figure 1
represents the system model of most real-world robots, such
as autonomous vehicles [25].
For extensibility and security purposes, recent advances in
robot systems adopt a modular design principle instead of a
bulky integration. Different tasks of a robot system run on
separated execution environments. For instance, a modern car
integrates more than 100 mission-specific ECUs virtually into
every functioning and diagnostics aspect [26]. Microkernels
are extensively supported and employed in embedded sys-
tems [27] to keep device drivers and applications isolated by
a secure layer. Given the popular design pattern, we model
that each sensing workflow or actuation workflow, i.e., device
drivers and utility processes, run in isolation with each other.
Because of its security and robustness significance, the
planner is usually treated with extra protection. For instance,
the planner could run on a separate chip, a trusted execution
environment of a processor, or even reside in a physically re-
mote location. Furthermore, the planner typically goes through
extensive tests before its deployment. Hence, the planner
is considered as a trusted computing base (TCB) of the
robot. Our proposed anomaly detection module (described in
Section IV) resides in the planner.
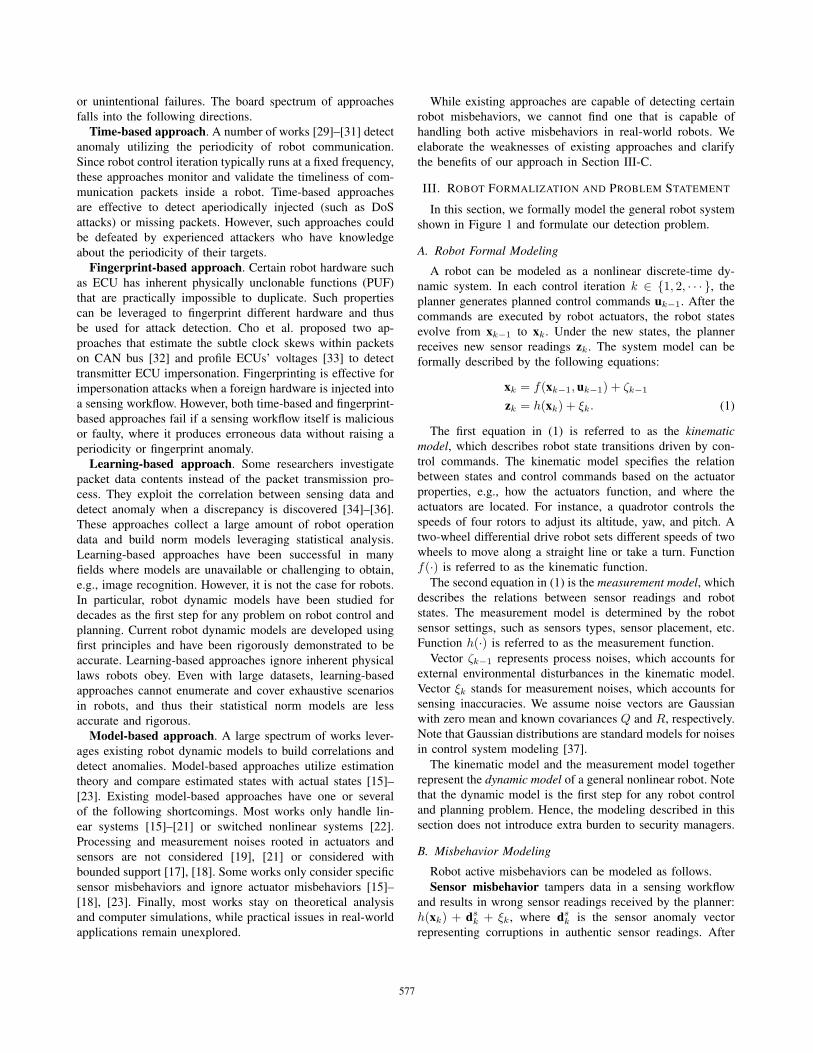
B. Robot Active Misbehaviors
Active misbehaviors can be classified in terms of their
consequences and sources. Figure 2 shows an illustration of
our classification. Concerning consequences, sensor misbe-
haviors are data corruptions in sensor readings of sensing
workflows; actuator misbehaviors are data corruptions in con-
trol commands of actuation workflows. Concerning sources,
misbehaviors can originate from physical channels, e.g., signal
spoofing, and cyber channels, e.g., malware, during any step
of sensing/actuation workflows. For instance, the civilian GPS
signal can be remotely spoofed (sensor misbehavior) using a
fake signal base (physical channel) [8]. A design defect in
throttle-by-wire system software (cyber channel) may cause
unintended acceleration (actuator misbehavior) [13]. Malware
(cyber channel) could be installed for packet injection through
DigitalizePhysicalEnvironment
Encoding ToPlanner
Sensing Workflow
..011101..
Sensor
Cyber ChannelPhysical ChannelReal
sensing readings
Incorrectperceived
sensor readings
(a) Sensor misbehavior.
D2A PhysicalEnvironmentDecodingPlanner
Actuation Workflow
..011101..
Actuator
Cyber Channel Physical ChannelPlanned control
commands
Incorrectexecuted control
commands
(b) Actuator misbehavior.
Fig. 2. Robot misbehavior categorization. Misbehavior could originate fromboth physical channels and cyber channels. The consequences could be datacorruptions in sensor readings or control commands.
a common diagnostic tool (sensor/actuator misbehavior) [28].
Table I illustrates several representative robot misbehaviors.
In this work, we do not assume any particular sensing or
actuation workflow to be trusted. However, we do assume
that not all sensor readings can be corrupted simultaneously.
Under the design where workflows run with isolation (see
Section II-A), attacks or failures in a workflow can be con-
strained within. Admittedly, such cases could be possible in
carefully crafted attacks. However, it is difficult for attackers.
Firstly, for heterogeneous sensors, holding a vulnerability and
a corresponding exploit which targets one sensing workflow is
already costly [6], [9], not to mention corrupting all. Secondly,
even if an attacker is capable of corrupting all sensors, the
attacker needs to launch the attacks simultaneously to avoid
detection. It is a great challenge to launch such coordinated
attacks on different target sensing workflows [9].
C. Related Works in Robot Anomaly Detection
In order to protect robot safety, various approaches have
been proposed for the detection of either intentional attacks
576
or unintentional failures. The board spectrum of approaches
falls into the following directions.
Time-based approach. A number of works [29]–[31] detect
anomaly utilizing the periodicity of robot communication.
Since robot control iteration typically runs at a fixed frequency,
these approaches monitor and validate the timeliness of com-
munication packets inside a robot. Time-based approaches
are effective to detect aperiodically injected (such as DoS
attacks) or missing packets. However, such approaches could
be defeated by experienced attackers who have knowledge
about the periodicity of their targets.
Fingerprint-based approach. Certain robot hardware such
as ECU has inherent physically unclonable functions (PUF)
that are practically impossible to duplicate. Such properties
can be leveraged to fingerprint different hardware and thus
be used for attack detection. Cho et al. proposed two ap-
proaches that estimate the subtle clock skews within packets
on CAN bus [32] and profile ECUs’ voltages [33] to detect
transmitter ECU impersonation. Fingerprinting is effective for
impersonation attacks when a foreign hardware is injected into
a sensing workflow. However, both time-based and fingerprint-
based approaches fail if a sensing workflow itself is malicious
or faulty, where it produces erroneous data without raising a
periodicity or fingerprint anomaly.
Learning-based approach. Some researchers investigate
packet data contents instead of the packet transmission pro-
cess. They exploit the correlation between sensing data and
detect anomaly when a discrepancy is discovered [34]–[36].
These approaches collect a large amount of robot operation
data and build norm models leveraging statistical analysis.
Learning-based approaches have been successful in many
fields where models are unavailable or challenging to obtain,
e.g., image recognition. However, it is not the case for robots.
In particular, robot dynamic models have been studied for
decades as the first step for any problem on robot control and
planning. Current robot dynamic models are developed using
first principles and have been rigorously demonstrated to be
accurate. Learning-based approaches ignore inherent physical
laws robots obey. Even with large datasets, learning-based
approaches cannot enumerate and cover exhaustive scenarios
in robots, and thus their statistical norm models are less
accurate and rigorous.
Model-based approach. A large spectrum of works lever-
ages existing robot dynamic models to build correlations and
detect anomalies. Model-based approaches utilize estimation
theory and compare estimated states with actual states [15]–
[23]. Existing model-based approaches have one or several
of the following shortcomings. Most works only handle lin-
ear systems [15]–[21] or switched nonlinear systems [22].
Processing and measurement noises rooted in actuators and
sensors are not considered [19], [21] or considered with
bounded support [17], [18]. Some works only consider specific
sensor misbehaviors and ignore actuator misbehaviors [15]–
[18], [23]. Finally, most works stay on theoretical analysis
and computer simulations, while practical issues in real-world
applications remain unexplored.
While existing approaches are capable of detecting certain
robot misbehaviors, we cannot find one that is capable of
handling both active misbehaviors in real-world robots. We
elaborate the weaknesses of existing approaches and clarify
the benefits of our approach in Section III-C.
III. ROBOT FORMALIZATION AND PROBLEM STATEMENT
In this section, we formally model the general robot system
shown in Figure 1 and formulate our detection problem.
A. Robot Formal Modeling
A robot can be modeled as a nonlinear discrete-time dy-
namic system. In each control iteration k ∈ {1, 2, · · · }, the
planner generates planned control commands uk−1. After the
commands are executed by robot actuators, the robot states
evolve from xk−1 to xk. Under the new states, the planner
receives new sensor readings zk. The system model can be
formally described by the following equations:
xk = f(xk−1, uk−1) + ζk−1
zk = h(xk) + ξk. (1)
The first equation in (1) is referred to as the kinematicmodel, which describes robot state transitions driven by con-
trol commands. The kinematic model specifies the relation
between states and control commands based on the actuator
properties, e.g., how the actuators function, and where the
actuators are located. For instance, a quadrotor controls the
speeds of four rotors to adjust its altitude, yaw, and pitch. A
two-wheel differential drive robot sets different speeds of two
wheels to move along a straight line or take a turn. Function
f(·) is referred to as the kinematic function.
The second equation in (1) is the measurement model, which
describes the relations between sensor readings and robot
states. The measurement model is determined by the robot
sensor settings, such as sensors types, sensor placement, etc.
Function h(·) is referred to as the measurement function.
Vector ζk−1 represents process noises, which accounts for
external environmental disturbances in the kinematic model.
Vector ξk stands for measurement noises, which accounts for
sensing inaccuracies. We assume noise vectors are Gaussian
with zero mean and known covariances Q and R, respectively.
Note that Gaussian distributions are standard models for noises
in control system modeling [37].
The kinematic model and the measurement model together
represent the dynamic model of a general nonlinear robot. Note
that the dynamic model is the first step for any robot control
and planning problem. Hence, the modeling described in this
section does not introduce extra burden to security managers.
B. Misbehavior Modeling
Robot active misbehaviors can be modeled as follows.
Sensor misbehavior tampers data in a sensing workflow
and results in wrong sensor readings received by the planner:
h(xk) + dsk + ξk, where ds
k is the sensor anomaly vector
representing corruptions in authentic sensor readings. After
577
sensor misbehaviors occur where dsk �= 0, the planner uses
deviated sensor readings to generate control commands.
Actuator misbehavior directly alters the control commands
executed by the actuators in an actuation workflow: uk−1 +dak−1, where da
k−1 is the actuator anomaly vector representing
corruptions in planned control commands.
C. Problem Statement
Consider a robot that receives sensor readings zk from psensing workflows and sends control commands uk−1 to qactuation workflows. Considering potential robot misbehaviors
that corrupt sensor readings with an anomaly vector dak−1
and/or control commands with an anomaly vector dsk. The
dynamic model (1) becomes:
xk = f(xk−1, uk−1 + dak−1) + ζk−1
zk = h(xk) + dsk + ξk (2)
In this work, we aim to detect sensor and actuator mis-
behaviors, i.e., check the existence of dak−1 and ds
k. For
forensics purposes, we intend to quantify the magnitude of the
anomaly by estimating dak−1 and ds
k. In addition, we intend
to identify the specific sensing workflow(s) i ∈ {1, 2, · · · , p}from which sensing misbehaviors originate. Moreover, we
study the influence of several key parameters to the detection
performance, including robot dynamic model f(·), h(·), sensor
quantity p, sensor quality ξk, etc.
Pertaining previous works discussed in Section II-C, time-
based and fingerprint-based anomaly detection approaches
analyze packet metadata and are agnostic to data contents.
Learning-based approaches ignore the accurate dynamic model
in (2). Existing model-based approaches either 1) cannot han-
dle nonlinear functions f(·), h(·), 2) cannot handle stochastic
noises ζk−1, ξk, 3) assume that dak−1 = 0, i.e., no actuator
misbehavior, or 4) fail to identify sensing workflow(s) i. Our
approach is dedicated to providing a holistic approach that
addresses these problems.
IV. ROBOT ANOMALY DETECTION SYSTEM DESIGN
To solve the above problems, we propose RoboADS. It
runs inside the planner (see Figure. 1) and detects active
misbehaviors in real-time. Figure 3 shows the schematic of
RoboADS, and Algorithm 1 describes the detailed procedures.
In each control iteration, the detection goes through four
modules sequentially: a monitor, a multi-mode estimation
engine, a mode selector, and a decision maker. We explain
each module in the sequel.
A. Monitor
In each control iteration, control units send a copy of control
commands uk−1 to the monitor (Algorithm 1 line 2). After the
execution of control commands, the monitor collects sensor
readings data zk from all sensors through the communication
module (line 3). Then, the monitor sends all received data to
the multi-mode estimation engine.
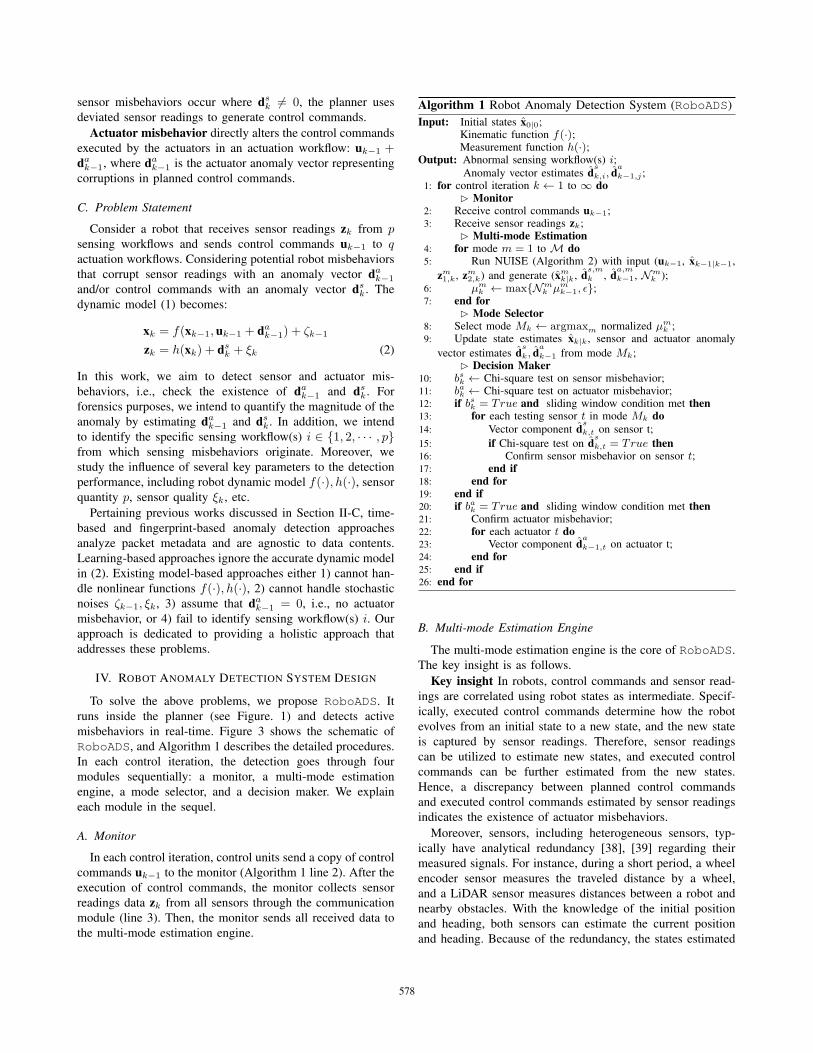
Algorithm 1 Robot Anomaly Detection System (RoboADS)
Input: Initial states x0|0;Kinematic function f(·);Measurement function h(·);
Output: Abnormal sensing workflow(s) i;Anomaly vector estimates d
s
k,i, da
k−1,j ;1: for control iteration k ← 1 to ∞ do
� Monitor2: Receive control commands uk−1;3: Receive sensor readings zk;
� Multi-mode Estimation4: for mode m = 1 to M do5: Run NUISE (Algorithm 2) with input (uk−1, xk−1|k−1,
zm1,k, zm2,k) and generate (xmk|k, d
s,m
k , da,m
k−1, Nmk );
6: μmk ← max{Nm
k μmk−1, ε};
7: end for� Mode Selector
8: Select mode Mk ← argmaxm normalized μmk ;
9: Update state estimates xk|k, sensor and actuator anomaly
vector estimates ds
k, da
k−1 from mode Mk;� Decision Maker
10: bsk ← Chi-square test on sensor misbehavior;11: bak ← Chi-square test on actuator misbehavior;12: if bsk = True and sliding window condition met then13: for each testing sensor t in mode Mk do14: Vector component d
s
k,t on sensor t;
15: if Chi-square test on ds
k,t = True then16: Confirm sensor misbehavior on sensor t;17: end if18: end for19: end if20: if bak = True and sliding window condition met then21: Confirm actuator misbehavior;22: for each actuator t do23: Vector component d
a
k−1,t on actuator t;24: end for25: end if26: end for
B. Multi-mode Estimation Engine
The multi-mode estimation engine is the core of RoboADS.
The key insight is as follows.
Key insight In robots, control commands and sensor read-
ings are correlated using robot states as intermediate. Specif-
ically, executed control commands determine how the robot
evolves from an initial state to a new state, and the new state
is captured by sensor readings. Therefore, sensor readings
can be utilized to estimate new states, and executed control
commands can be further estimated from the new states.
Hence, a discrepancy between planned control commands
and executed control commands estimated by sensor readings
indicates the existence of actuator misbehaviors.
Moreover, sensors, including heterogeneous sensors, typ-
ically have analytical redundancy [38], [39] regarding their
measured signals. For instance, during a short period, a wheel
encoder sensor measures the traveled distance by a wheel,
and a LiDAR sensor measures distances between a robot and
nearby obstacles. With the knowledge of the initial position
and heading, both sensors can estimate the current position
and heading. Because of the redundancy, the states estimated
578
Multi- mation Enginemode Esti
MonitorSensor readings , Control commands
Reference sensor readings ( )
Control commands ( )
NUISE Algorithm
)estimates (Sensor anomaly Actuator anomaly
estimates ( )makd ,
1ˆ�
Testing sensors readings )( m
kz ,1m
kz ,2 1�ku
Stateestimates ( )m
kxLikelihood
)( mkN
To Mode selector
Estimates from selected mode Mk to decision maker
NUISE for mode m=2
... NUISE for mode m=M
NUISE for mode m=1
Decision Maker
Actuator anomaly vectorSensor anomaly vector
Y... YY Y... NYSlidingwindow
2�
kz
kx
Previous state estimates ( )1ˆ �kx
New stateestimate
akd 1
ˆ�
skd
dks,m
ModeSelector mode Mk
test for test for
ajkd ,1
ˆ�
1�ku
Check each testing sensor
2�skd a
kd 1ˆ
�
sikd ,
ˆtest for2�
sikd ,
ˆ
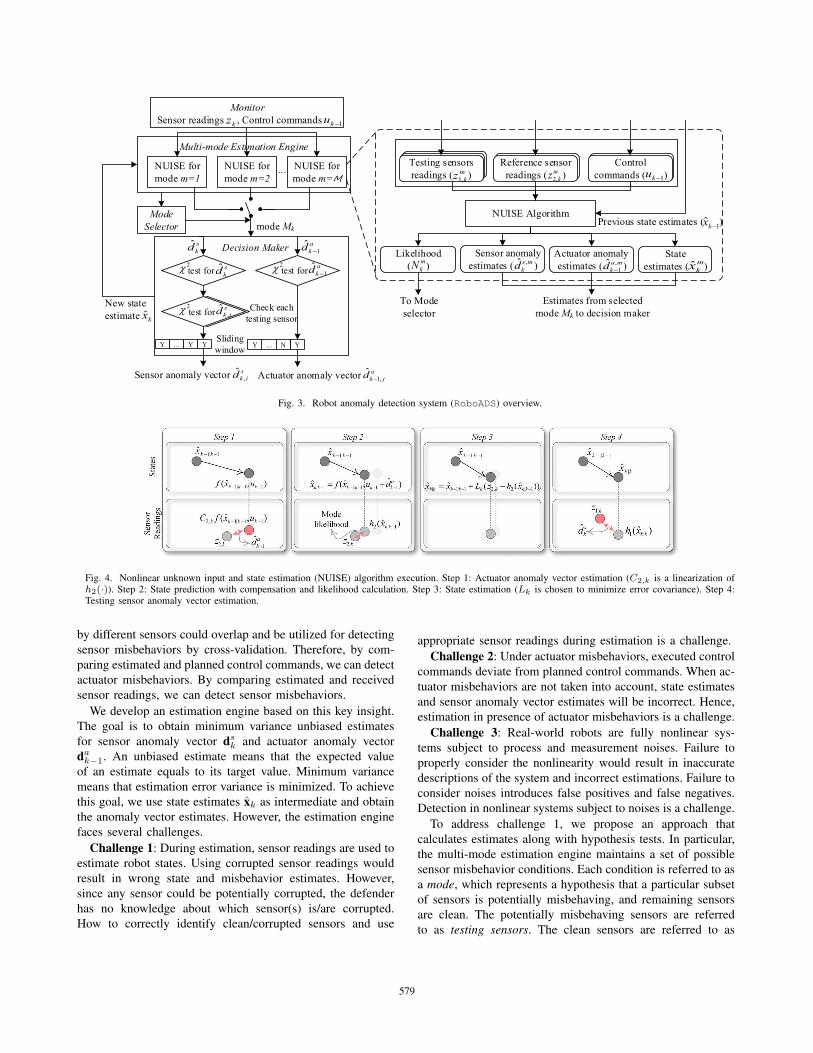
Fig. 3. Robot anomaly detection system (RoboADS) overview.
Fig. 4. Nonlinear unknown input and state estimation (NUISE) algorithm execution. Step 1: Actuator anomaly vector estimation (C2,k is a linearization ofh2(·)). Step 2: State prediction with compensation and likelihood calculation. Step 3: State estimation (Lk is chosen to minimize error covariance). Step 4:Testing sensor anomaly vector estimation.
by different sensors could overlap and be utilized for detecting
sensor misbehaviors by cross-validation. Therefore, by com-
paring estimated and planned control commands, we can detect
actuator misbehaviors. By comparing estimated and received
sensor readings, we can detect sensor misbehaviors.
We develop an estimation engine based on this key insight.
The goal is to obtain minimum variance unbiased estimates
for sensor anomaly vector dsk and actuator anomaly vector
dak−1. An unbiased estimate means that the expected value
of an estimate equals to its target value. Minimum variance
means that estimation error variance is minimized. To achieve
this goal, we use state estimates xk as intermediate and obtain
the anomaly vector estimates. However, the estimation engine
faces several challenges.
Challenge 1: During estimation, sensor readings are used to
estimate robot states. Using corrupted sensor readings would
result in wrong state and misbehavior estimates. However,
since any sensor could be potentially corrupted, the defender
has no knowledge about which sensor(s) is/are corrupted.
How to correctly identify clean/corrupted sensors and use
appropriate sensor readings during estimation is a challenge.
Challenge 2: Under actuator misbehaviors, executed control
commands deviate from planned control commands. When ac-
tuator misbehaviors are not taken into account, state estimates
and sensor anomaly vector estimates will be incorrect. Hence,
estimation in presence of actuator misbehaviors is a challenge.
Challenge 3: Real-world robots are fully nonlinear sys-
tems subject to process and measurement noises. Failure to
properly consider the nonlinearity would result in inaccurate
descriptions of the system and incorrect estimations. Failure to
consider noises introduces false positives and false negatives.
Detection in nonlinear systems subject to noises is a challenge.
To address challenge 1, we propose an approach that
calculates estimates along with hypothesis tests. In particular,
the multi-mode estimation engine maintains a set of possible
sensor misbehavior conditions. Each condition is referred to as
a mode, which represents a hypothesis that a particular subset
of sensors is potentially misbehaving, and remaining sensors
are clean. The potentially misbehaving sensors are referred
to as testing sensors. The clean sensors are referred to as
579
reference sensors. Each mode runs a nonlinear unknown input
and state estimation (NUISE) algorithm in parallel (line 4-7).
Leveraging the reference sensor readings and planned control
commands from the last iteration, NUISE estimates new states,
corruptions in testing sensor readings, corruptions in control
commands, and a likelihood for each mode.
NUISE is illustrated in Figure 4. The full algorithm is
presented as Algorithm 2 in the Appendix. At control iteration
k − 1, the algorithm predicts the states at next iteration
using current state estimates xk−1|k−1 and planned control
commands uk−1. The predicted states should reflect a match
with the reference sensor readings z2,k in each mode (subscript
1 and 2 refer to testing sensor and reference sensor related
variables, respectively). Whenever a deviation is detected
between z2,k and the reflected readings, actuator misbehaviors
can be detected (Step 1). With the identified actuator anomaly
estimates da
k−1 from step 1, we conduct a new state prediction
with corrected control commands uk−1+ da
k−1 (Step 2). Then
the predicted states are corrected by reference sensor readings
z2,k, and we obtain the state estimates xk|k (Step 3). Finally,
sensor readings reflected by the state estimates should match
testing sensor readings z1,k. The deviations in between indicate
sensor misbehaviors ds
k,t (Step 4).
When a mode is not consistent with the actual condition, i.e.,
corrupted sensors are mistakenly used as reference sensors,
the actuator anomaly estimates da
k−1 calculated from step
1 would deviate from the ground truth. Subsequently, the
state prediction in step 2 cannot be correctly compensated,
and thus the reference sensor readings z2,k would have a
larger discrepancy with the state prediction. NUISE generates
a likelihood inversely proportional to the discrepancy.
It is noteworthy that the algorithm is not based on voting
mechanisms. Even when a majority of sensor readings are
corrupted, NUISE could generate a higher likelihood for the
mode that reflects the ground truth. Noticeably, NUISE does
not rely on actuator redundancy. In our approach, we select
modes that have only one reference sensor. Hence, the number
of modes M grow linearly with the number of sensors, and
the computational complexity grows accordingly. Mode set
selection is further discussed in Section VI.
Challenge 2 is also addressed in NUISE algorithm. We cal-
culate and compensate the actuator anomaly vector estimates
da,j
k−1 into the state prediction step (Step 2) to obtain unbiased
state prediction.
To address challenge 3, we model noises as error covari-
ance matrices. Matrix propagations are tracked during each
calculation step in Algorithm 2. The matrices serve two pur-
poses: 1) minimizing the variances of the estimates during the
estimation process; 2) normalizing anomaly vector estimate
errors for hypothesis tests. In terms of the nonlinearity of the
system, we incorporate nonlinear kinematic and measurement
models to minimize estimation errors and use their linearized
models to obtain minimum variance estimates. Note that the
linearization is performed at the states and controls of each
iteration. In contrast, model-based approaches such as [20]
are restricted to linear systems. When dealing with nonlinear
systems, they only perform linearization once at the beginning.
In Section V-G, we demonstrate that such approaches have low
detection effectiveness.
C. Mode Selector
After normalization (line 6), the mode selector compares the
likelihood of each mode μmk , and selects the mode Mk with the
highest likelihood (line 8) to reflect the ground truth. The state
estimates are updated for the next iteration, and the anomaly
vector estimates of the selected mode will be leveraged for the
decision-making process (line 9).
D. Decision Maker
The decision maker conducts Chi-square tests to check
whether estimated sensor and actuator anomaly vectors exceed
thresholds with a certain level of confidence (line 10-11).
To reduce the impact of transient faults, e.g., uneven ground
or bumps, test results go through sliding windows, and the
detector raises an alarm only when a certain number of
positives appear in consecutive iterations (line 12 and line 20).
When the number of sensor anomaly positives exceeds de-
cision criteria, the decision maker raises a sensor misbehavior
alarm. To further confirm the misbehaving sensors, we split
the sensor anomaly estimates and conduct Chi-square test
separately for each individual testing sensor (line 13-18). The
decision maker analogously raises an actuator misbehavior
alarm and calculates actuator anomaly vector estimates for
each actuator. Note that no Chi-square test is conducted on an
individual actuator. Instead, it only checks the aggregate test
statistics (explained in the technical report [40]).
Finally, the decision maker reports confirmed abnormal
workflow(s) and anomaly vector estimates as outputs.
V. EVALUATION
While a large body of works conduct theoretical analysis
and computer simulations, how to build, profile, and tune a
practically effective anomaly detection system for real-world
robots are not explored. In this section, we intend to evaluate
and provide new quantitative understandings of RoboADS.
Metrics. The performance of RoboADS can be measured
by detection effectiveness and efficiency. To evaluate the effec-
tiveness, we define a true positive as an event where the system
raises an alarm and correctly identifies the sensor/actuator
misbehaving condition. Otherwise, a positive detection result
is considered as a false positive. A false negative is defined as
an event where the system does not raise an alarm when the
robot is misbehaving. If all workflows are free of misbehaviors
and the system does not raise any alarm, the event is referred
to as a true negative. To evaluate the efficiency, detection delay
1False positive rate and false negative rate.2A and S are defined in Table III. The subscript i → j stands for a transition
from sensor/actuator mode i to mode j. W, I, and L stand for wheel encoder,IPS, and LiDAR, respectively.
580
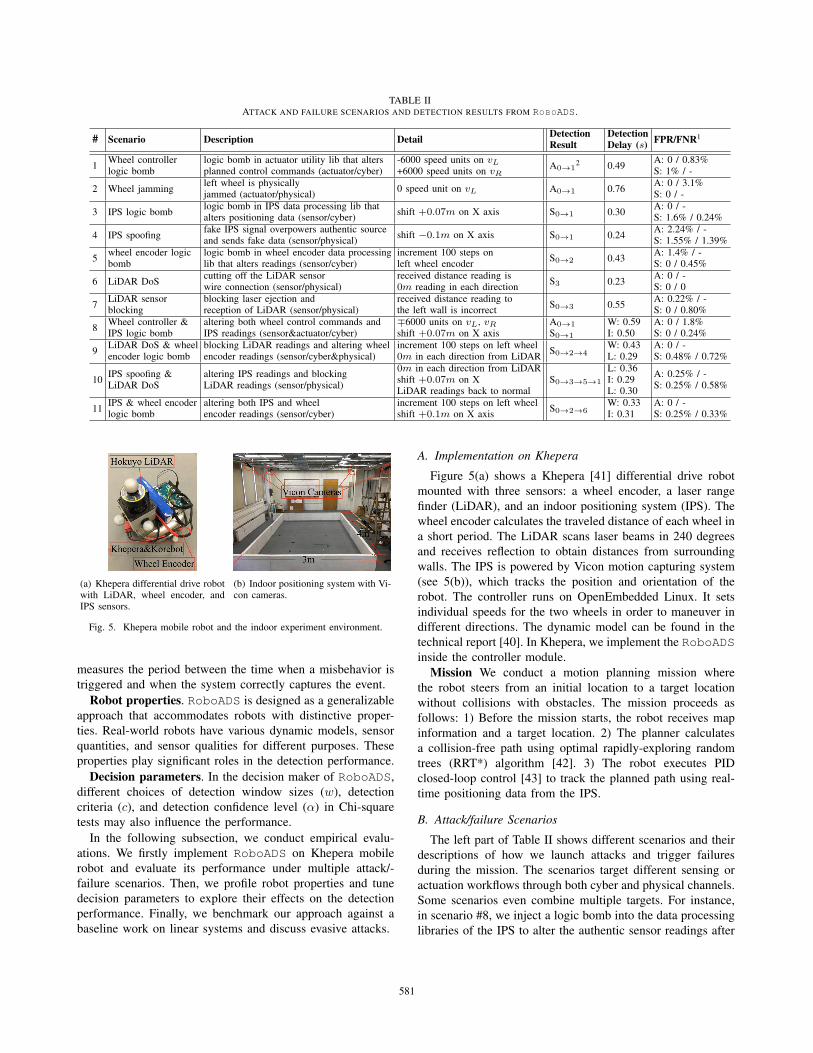
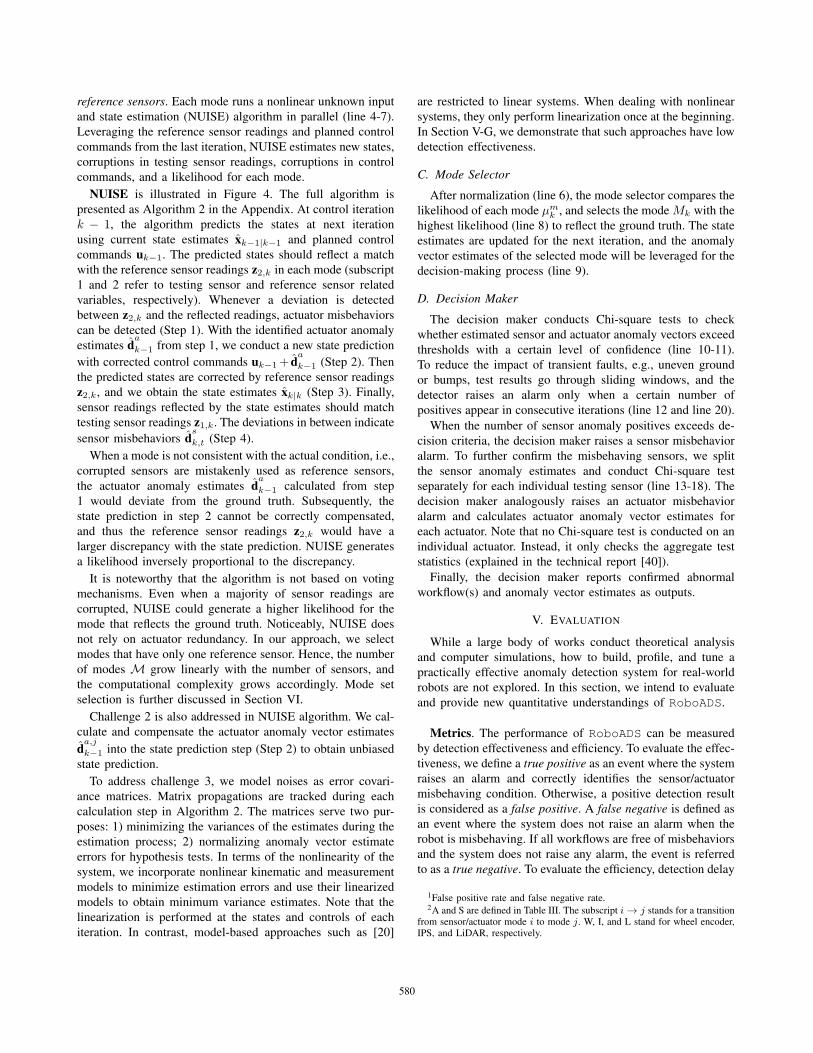
TABLE IIATTACK AND FAILURE SCENARIOS AND DETECTION RESULTS FROM ROBOADS.
# Scenario Description Detail DetectionResult
DetectionDelay (s) FPR/FNR1
1Wheel controllerlogic bomb
logic bomb in actuator utility lib that altersplanned control commands (actuator/cyber)
-6000 speed units on vL+6000 speed units on vR
A0→12 0.49
A: 0 / 0.83%S: 1% / -
2 Wheel jammingleft wheel is physicallyjammed (actuator/physical)
0 speed unit on vL A0→1 0.76A: 0 / 3.1%S: 0 / -
3 IPS logic bomblogic bomb in IPS data processing lib thatalters positioning data (sensor/cyber)
shift +0.07m on X axis S0→1 0.30A: 0 / -S: 1.6% / 0.24%
4 IPS spoofingfake IPS signal overpowers authentic sourceand sends fake data (sensor/physical)
shift −0.1m on X axis S0→1 0.24A: 2.24% / -S: 1.55% / 1.39%
5wheel encoder logicbomb
logic bomb in wheel encoder data processinglib that alters readings (sensor/cyber)
increment 100 steps onleft wheel encoder
S0→2 0.43A: 1.4% / -S: 0 / 0.45%
6 LiDAR DoScutting off the LiDAR sensorwire connection (sensor/physical)
received distance reading is0m reading in each direction
S3 0.23A: 0 / -S: 0 / 0
7LiDAR sensorblocking
blocking laser ejection andreception of LiDAR (sensor/physical)
received distance reading tothe left wall is incorrect
S0→3 0.55A: 0.22% / -S: 0 / 0.80%
8Wheel controller &IPS logic bomb
altering both wheel control commands andIPS readings (sensor&actuator/cyber)
∓6000 units on vL, vRshift +0.07m on X axis
A0→1
S0→1
W: 0.59I: 0.50
A: 0 / 1.8%S: 0 / 0.24%
9LiDAR DoS & wheelencoder logic bomb
blocking LiDAR readings and altering wheelencoder readings (sensor/cyber&physical)
increment 100 steps on left wheel0m in each direction from LiDAR
S0→2→4W: 0.43L: 0.29
A: 0 / -S: 0.48% / 0.72%
10IPS spoofing &LiDAR DoS
altering IPS readings and blockingLiDAR readings (sensor/physical)
0m in each direction from LiDARshift +0.07m on XLiDAR readings back to normal
S0→3→5→1
L: 0.36I: 0.29L: 0.30
A: 0.25% / -S: 0.25% / 0.58%
11IPS & wheel encoderlogic bomb
altering both IPS and wheelencoder readings (sensor/cyber)
increment 100 steps on left wheelshift +0.1m on X axis
S0→2→6W: 0.33I: 0.31
A: 0 / -S: 0.25% / 0.33%
(a) Khepera differential drive robotwith LiDAR, wheel encoder, andIPS sensors.
(b) Indoor positioning system with Vi-con cameras.
Fig. 5. Khepera mobile robot and the indoor experiment environment.
measures the period between the time when a misbehavior is
triggered and when the system correctly captures the event.
Robot properties. RoboADS is designed as a generalizable
approach that accommodates robots with distinctive proper-
ties. Real-world robots have various dynamic models, sensor
quantities, and sensor qualities for different purposes. These
properties play significant roles in the detection performance.
Decision parameters. In the decision maker of RoboADS,
different choices of detection window sizes (w), detection
criteria (c), and detection confidence level (α) in Chi-square
tests may also influence the performance.
In the following subsection, we conduct empirical evalu-
ations. We firstly implement RoboADS on Khepera mobile
robot and evaluate its performance under multiple attack/-
failure scenarios. Then, we profile robot properties and tune
decision parameters to explore their effects on the detection
performance. Finally, we benchmark our approach against a
baseline work on linear systems and discuss evasive attacks.
A. Implementation on Khepera
Figure 5(a) shows a Khepera [41] differential drive robot
mounted with three sensors: a wheel encoder, a laser range
finder (LiDAR), and an indoor positioning system (IPS). The
wheel encoder calculates the traveled distance of each wheel in
a short period. The LiDAR scans laser beams in 240 degrees
and receives reflection to obtain distances from surrounding
walls. The IPS is powered by Vicon motion capturing system
(see 5(b)), which tracks the position and orientation of the
robot. The controller runs on OpenEmbedded Linux. It sets
individual speeds for the two wheels in order to maneuver in
different directions. The dynamic model can be found in the
technical report [40]. In Khepera, we implement the RoboADSinside the controller module.
Mission We conduct a motion planning mission where
the robot steers from an initial location to a target location
without collisions with obstacles. The mission proceeds as
follows: 1) Before the mission starts, the robot receives map
information and a target location. 2) The planner calculates
a collision-free path using optimal rapidly-exploring random
trees (RRT*) algorithm [42]. 3) The robot executes PID
closed-loop control [43] to track the planned path using real-
time positioning data from the IPS.
B. Attack/failure Scenarios
The left part of Table II shows different scenarios and their
descriptions of how we launch attacks and trigger failures
during the mission. The scenarios target different sensing or
actuation workflows through both cyber and physical channels.
Some scenarios even combine multiple targets. For instance,
in scenario #8, we inject a logic bomb into the data processing
libraries of the IPS to alter the authentic sensor readings after
581
Time/s0 5 10 15 20
(1)
IPS
Sen
sor A
nom
aly
-0.05
0
0.05
0.1
0.15
dk,Is, x
dk,Is, y
-0.2
0
0.2
0.4
0.6dk,Is, θ
Time/s0 5 10 15 20
(2)
WE
Sen
sor A
nom
aly
-0.05
0
0.05
0.1
0.15
dk,Ws, x
dk,Ws, y
-0.2
0
0.2
0.4
0.6dk,Ws, θ
Time/s0 5 10 15 20
(3)
LiD
AR
Sen
sor A
nom
aly
-0.05
0
0.05
0.1
0.15
dk,Ls, 1
dk,Ls, 2
dk,Ls, 3
-0.2
0
0.2
0.4
0.6dk,Ws, θ
Time/s0 5 10 15 20
(4)
Act
uato
r Ano
mal
y
-0.1
0
0.1
0.2dk
a, L
dka, R
0 5 10 15 20
(5)
Sen
sor A
nom
aly
Test
Sta
tistic
0
20
40
60
Chi-square3(α=0.005)
5 10 15 20(6
)S
enso
r Mod
e S
elec
tion
0
2
4
6
0 5 10 15 20
(7)
Act
uato
r Ano
mal
y Te
st S
tatis
tic
0
20
40
60
80
100
Chi-square2(α=0.05)
5 10 15 20
(8)
Act
uato
r Mod
e S
elec
tion
0
0.5
1
1.5
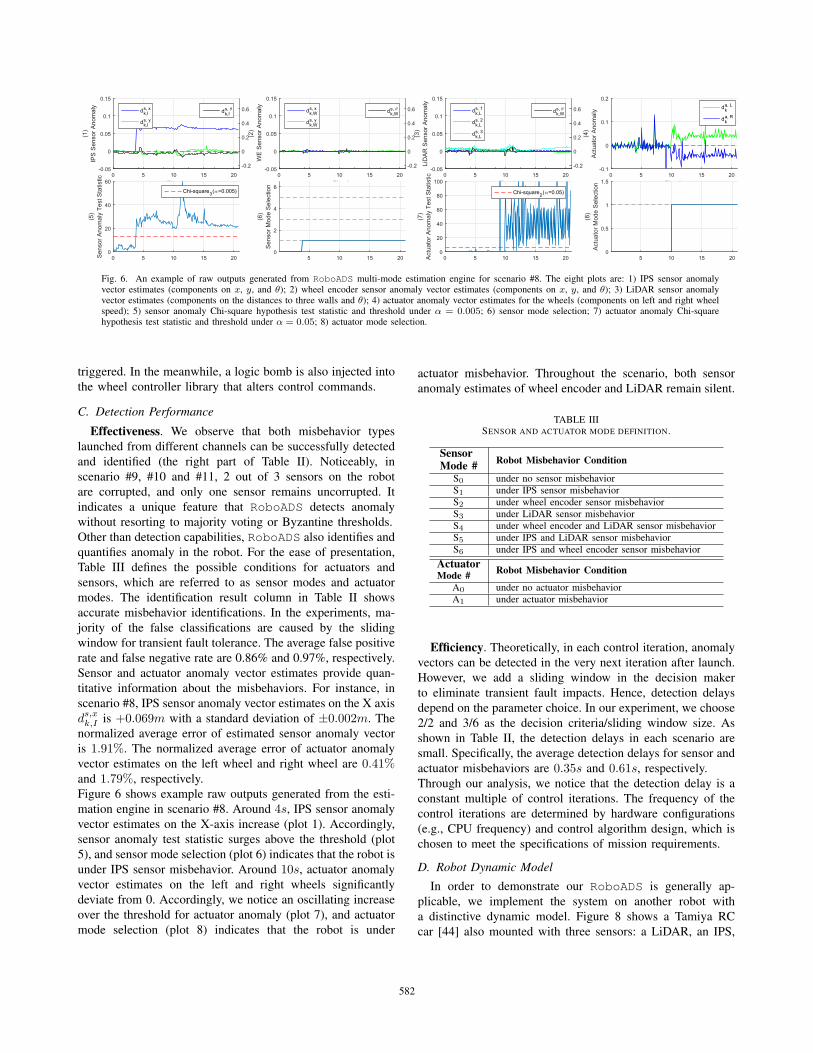
Fig. 6. An example of raw outputs generated from RoboADS multi-mode estimation engine for scenario #8. The eight plots are: 1) IPS sensor anomalyvector estimates (components on x, y, and θ); 2) wheel encoder sensor anomaly vector estimates (components on x, y, and θ); 3) LiDAR sensor anomalyvector estimates (components on the distances to three walls and θ); 4) actuator anomaly vector estimates for the wheels (components on left and right wheelspeed); 5) sensor anomaly Chi-square hypothesis test statistic and threshold under α = 0.005; 6) sensor mode selection; 7) actuator anomaly Chi-squarehypothesis test statistic and threshold under α = 0.05; 8) actuator mode selection.
triggered. In the meanwhile, a logic bomb is also injected into
the wheel controller library that alters control commands.
C. Detection Performance
Effectiveness. We observe that both misbehavior types
launched from different channels can be successfully detected
and identified (the right part of Table II). Noticeably, in
scenario #9, #10 and #11, 2 out of 3 sensors on the robot
are corrupted, and only one sensor remains uncorrupted. It
indicates a unique feature that RoboADS detects anomaly
without resorting to majority voting or Byzantine thresholds.
Other than detection capabilities, RoboADS also identifies and
quantifies anomaly in the robot. For the ease of presentation,
Table III defines the possible conditions for actuators and
sensors, which are referred to as sensor modes and actuator
modes. The identification result column in Table II shows
accurate misbehavior identifications. In the experiments, ma-
jority of the false classifications are caused by the sliding
window for transient fault tolerance. The average false positive
rate and false negative rate are 0.86% and 0.97%, respectively.
Sensor and actuator anomaly vector estimates provide quan-
titative information about the misbehaviors. For instance, in
scenario #8, IPS sensor anomaly vector estimates on the X axis
ds,xk,I is +0.069m with a standard deviation of ±0.002m. The
normalized average error of estimated sensor anomaly vector
is 1.91%. The normalized average error of actuator anomaly
vector estimates on the left wheel and right wheel are 0.41%and 1.79%, respectively.
Figure 6 shows example raw outputs generated from the esti-
mation engine in scenario #8. Around 4s, IPS sensor anomaly
vector estimates on the X-axis increase (plot 1). Accordingly,
sensor anomaly test statistic surges above the threshold (plot
5), and sensor mode selection (plot 6) indicates that the robot is
under IPS sensor misbehavior. Around 10s, actuator anomaly
vector estimates on the left and right wheels significantly
deviate from 0. Accordingly, we notice an oscillating increase
over the threshold for actuator anomaly (plot 7), and actuator
mode selection (plot 8) indicates that the robot is under
actuator misbehavior. Throughout the scenario, both sensor
anomaly estimates of wheel encoder and LiDAR remain silent.
TABLE IIISENSOR AND ACTUATOR MODE DEFINITION.
SensorMode # Robot Misbehavior Condition
S0 under no sensor misbehaviorS1 under IPS sensor misbehaviorS2 under wheel encoder sensor misbehaviorS3 under LiDAR sensor misbehaviorS4 under wheel encoder and LiDAR sensor misbehaviorS5 under IPS and LiDAR sensor misbehaviorS6 under IPS and wheel encoder sensor misbehavior
ActuatorMode # Robot Misbehavior Condition
A0 under no actuator misbehaviorA1 under actuator misbehavior
Efficiency. Theoretically, in each control iteration, anomaly
vectors can be detected in the very next iteration after launch.
However, we add a sliding window in the decision maker
to eliminate transient fault impacts. Hence, detection delays
depend on the parameter choice. In our experiment, we choose
2/2 and 3/6 as the decision criteria/sliding window size. As
shown in Table II, the detection delays in each scenario are
small. Specifically, the average detection delays for sensor and
actuator misbehaviors are 0.35s and 0.61s, respectively.
Through our analysis, we notice that the detection delay is a
constant multiple of control iterations. The frequency of the
control iterations are determined by hardware configurations
(e.g., CPU frequency) and control algorithm design, which is
chosen to meet the specifications of mission requirements.
D. Robot Dynamic Model
In order to demonstrate our RoboADS is generally ap-
plicable, we implement the system on another robot with
a distinctive dynamic model. Figure 8 shows a Tamiya RC
car [44] also mounted with three sensors: a LiDAR, an IPS,
582
False Positive Rate0 0.2 0.4 0.6 0.8 1
Tru
e P
ositi
ve R
ate
0
0.5
1
c/w=1/1c/w=3/3c/w=6/60 0.01 0.02
0.95
1
(a) ROC curve of sensor misbehaviordetection under different confidence levelα with a range of w and c.
False Positive Rate0 0.2 0.4 0.6 0.8 1
Tru
e P
ositi
ve R
ate
0
0.5
1
c/w=1/1c/w=3/3c/w=6/60 0.05
0.9
0.95
1
(b) ROC curve of actuator misbehaviordetection under different confidence levelα with a range of w and c.
decision criteria c1 2 3 4 5 6
Sen
sor M
isbe
havi
or F
1
0.98
0.985
0.99
window size w=1window size w=2window size w=3window size w=4window size w=5window size w=6
(c) Sensor misbehavior detection F1 un-der α = 0.005 with different w and c.
decision criteria c1 2 3 4 5 6 7
Act
uato
r Mis
beha
vior
F1
0.85
0.9
0.95
1
window size w=1window size w=2window size w=3window size w=4window size w=5window size w=6window size w=7
(d) Actuator misbehavior detection F1
under α = 0.05 with different w and c.
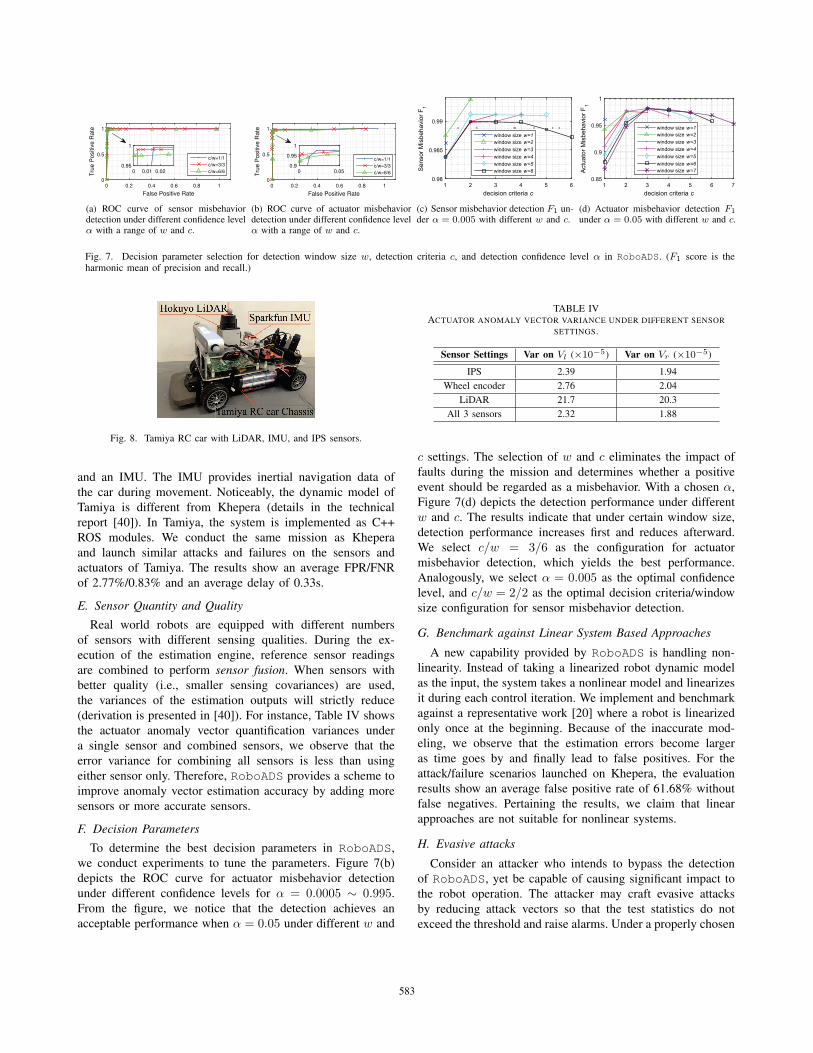
Fig. 7. Decision parameter selection for detection window size w, detection criteria c, and detection confidence level α in RoboADS. (F1 score is theharmonic mean of precision and recall.)
Fig. 8. Tamiya RC car with LiDAR, IMU, and IPS sensors.
and an IMU. The IMU provides inertial navigation data of
the car during movement. Noticeably, the dynamic model of
Tamiya is different from Khepera (details in the technical
report [40]). In Tamiya, the system is implemented as C++
ROS modules. We conduct the same mission as Khepera
and launch similar attacks and failures on the sensors and
actuators of Tamiya. The results show an average FPR/FNR
of 2.77%/0.83% and an average delay of 0.33s.
E. Sensor Quantity and Quality
Real world robots are equipped with different numbers
of sensors with different sensing qualities. During the ex-
ecution of the estimation engine, reference sensor readings
are combined to perform sensor fusion. When sensors with
better quality (i.e., smaller sensing covariances) are used,
the variances of the estimation outputs will strictly reduce
(derivation is presented in [40]). For instance, Table IV shows
the actuator anomaly vector quantification variances under
a single sensor and combined sensors, we observe that the
error variance for combining all sensors is less than using
either sensor only. Therefore, RoboADS provides a scheme to
improve anomaly vector estimation accuracy by adding more
sensors or more accurate sensors.
F. Decision Parameters
To determine the best decision parameters in RoboADS,
we conduct experiments to tune the parameters. Figure 7(b)
depicts the ROC curve for actuator misbehavior detection
under different confidence levels for α = 0.0005 ∼ 0.995.
From the figure, we notice that the detection achieves an
acceptable performance when α = 0.05 under different w and
TABLE IVACTUATOR ANOMALY VECTOR VARIANCE UNDER DIFFERENT SENSOR
SETTINGS.
Sensor Settings Var on Vl (×10−5) Var on Vr (×10−5)
IPS 2.39 1.94
Wheel encoder 2.76 2.04
LiDAR 21.7 20.3
All 3 sensors 2.32 1.88
c settings. The selection of w and c eliminates the impact of
faults during the mission and determines whether a positive
event should be regarded as a misbehavior. With a chosen α,
Figure 7(d) depicts the detection performance under different
w and c. The results indicate that under certain window size,
detection performance increases first and reduces afterward.
We select c/w = 3/6 as the configuration for actuator
misbehavior detection, which yields the best performance.
Analogously, we select α = 0.005 as the optimal confidence
level, and c/w = 2/2 as the optimal decision criteria/window
size configuration for sensor misbehavior detection.
G. Benchmark against Linear System Based Approaches
A new capability provided by RoboADS is handling non-
linearity. Instead of taking a linearized robot dynamic model
as the input, the system takes a nonlinear model and linearizes
it during each control iteration. We implement and benchmark
against a representative work [20] where a robot is linearized
only once at the beginning. Because of the inaccurate mod-
eling, we observe that the estimation errors become larger
as time goes by and finally lead to false positives. For the
attack/failure scenarios launched on Khepera, the evaluation
results show an average false positive rate of 61.68% without
false negatives. Pertaining the results, we claim that linear
approaches are not suitable for nonlinear systems.
H. Evasive attacks
Consider an attacker who intends to bypass the detection
of RoboADS, yet be capable of causing significant impact to
the robot operation. The attacker may craft evasive attacks
by reducing attack vectors so that the test statistics do not
exceed the threshold and raise alarms. Under a properly chosen
583

configuration (α, w, c, and sensor quality), the vectors need to
be extremely small to remain alarm silence. For instance, we
find that the distance shift in a stealthy IPS sensor spoofing
needs to remain under 0.02m in order to avoid detection. The
speed alteration in a wheel controller logic bomb needs to
remain under 900 units (0.006m/s). Hence, we believe that an
attacker cannot make a significant impact with reduced attack
vectors.
VI. DISCUSSION
Limitations. In our approach, at least one sensor that is
capable of estimating robot states should be clean and serve
as the reference sensor. Admittedly, an attacker could launch
attacks that exploit shared software or hardware vulnerabilities
and thus corrupt all workflows. For instance, sensing/ac-
tuation workflows might run on the same type of micro-
processing chips, where an exploitable vulnerability exists in
their firmware. Another weakness is that a misbehavior is
modeled as an aggregate data corruption on a sensing/actuation
workflow. Hence, our approach cannot pinpoint the root cause
of a detected misbehavior. Further, experienced attackers could
frequently switch attack targets, making mode estimation chal-
lenging. The resilience of our approach against such attacks
should be explored.
Sensor capabilities. During estimation, NUISE estimates
robot states using reference sensor readings of each mode. A
requirement is that the reference sensors can reconstruct states,
i.e., the system is observable using the reference sensors.
However, it is not the case for some sensors. For instance,
a magnetometer only measures the orientation of a robot.
If RoboADS only takes the magnetometer as the reference
sensor, RoboADS fails to estimate states and anomaly vectors.
Under such cases, we can group multiple sensors together
to ensure the reference sensors can reconstruct states. For
instance, a magnetometer can be grouped together with a GPS
sensor to measure both the orientation and the position.
Mode set selection. In the multi-mode estimation engine,
the choice of M is a trade-off between computational com-
plexity and detection accuracy. In particular, with p sensing
workflows, the number of possible sensor conditions grows
exponentially where Mcomplete = 2p − 1 (exclude the
condition when all sensors are corrupted). As explained in
Section V-E, when there are multiple reference sensors in a
mode, the estimation process can perform sensor fusion and
reduce estimation variances. In our approach, we only choose
the modes where one particular reference sensor is clean
and all other sensors are potentially corrupted, for the favor
of computational complexity, and we’ve already observed
favorable estimation results. Designers may choose a different
mode set for their own purposes.
VII. CONCLUSION AND FUTURE WORK
Sensor and actuator misbehaviors impose huge safety threats
in mobile robots. In this study, we propose a practical robot
anomaly detection system, RoboADS, that is capable of de-
tecting both types of misbehaviors in real-world robots. In
order to bridge the gap from a detection method to a practical
system, we explore several issues raised in system implemen-
tations and shed light on the application. We implement the
detection system on two distinctive robots. We evaluate the
performance under various attack and failure scenarios. Our
evaluation results show satisfactory detection effectiveness and
small detection delays.
For forensic purposes, future work will focus on further
identifying the point of attack/failure once a misbehavior is
detected in a workflow. Designing computationally efficient
response algorithms is also worth exploring.
VIII. ACKNOWLEDGMENTS
This work was supported by NSF CNS-1505664, ARO
W911NF-13-1-0421 (MURI), and ARO W911NF-15-1-0576.
APPENDIX
A. NUISE Algorithm
The nonlinear unknown input and state estimation algorithm
is presented as Algorithm 2. Derivations of the algorithm can
be found in the technical report [40].
Algorithm 2 Nonlinear Unknown Input and State Estimation
Algorithm (NUISE)
Input: uk−1, xk−1|k−1, z1,k, z2,kOutput: xk|k, d
s
k, da
k−1, Nk
1: Initialize;� Actuator anomaly vector da
k−1 estimation2: Pk−1 ← Ak−1P
xk−1(Ak−1)
T +Qk−1;
3: R∗2,k ← C2,kPk−1(C2,k)T +R2,k;
4: M2,k ← ((Gk−1)T (C2,k)
T (R∗2,k)−1C2,kGk−1)
−1
(Gk−1)T (C2,k)
T (R∗2,k)−1;
5: da
k−1 ←M2,k(z2,k − C2,kf(xk−1|k−1, uk−1));6: P a
k−1 ←M2,kR∗2,k(M2,k)
T ;� State prediction
7: xk|k−1 ← f(xk−1|k−1, uk−1 + da
k−1);8: Ak−1 ← (I −Gk−1M2,kC2,k)Ak−1;9: Qk−1 ← (I − Gk−1M2,kC2,k)Qk−1(I − Gk−1M2,kC2,k)
T +Gk−1M2,kR2,k(M2,k)
T (Gk−1)T ;
10: P xk|k−1 ← Ak−1P
xk−1(Ak−1)
T + Qk−1;� State estimation
11: R2,k ← C2,kPxk|k−1(C2,k)
T + R2,k + C2,kGk−1M2,kR2,k +
R2,k(M2,k)T (Gk−1)
T (C2,k)T ;
12: Lk ← (C2,kPxk|k−1 +R2,k(M2,k)
T (Gk−1)T )T (R2,k)
−1;13: xk|k ← xk|k−1 + Lk(z2,k − h2(xk|k−1));14: P x
k ← (I−LkC2,k)Pxk|k−1(I−LkC2,k)
T+LkR2,k(Lk)T−(I−
LkC2,k)Gk−1M2,kR2,k(Lk)T −LkR2,k(M2,k)
T (Gk−1)T (I −
LkC2,k)T ;
� Sensor anomaly vector dsk estimation
15: ds
k ← z1,k − h1(xk|k);16: P s
k ← C1,kPxk (C1,k)
T +R1,k;� Likelihood of the mode
17: νk ← z2,k − h2(xk|k−1);18: Pk|k−1 ← C2,kP
xk|k−1(C2,k)
T +R2,k −C2,kGk−1M2,kR2,k −R2,k(M2,k)
T (Gk−1)T (C2,k)
T ;19: n← rank(Pk|k−1);
20: Nk ← 1
(2π)n/2|Pk|k−1|1/2+
exp(− (νk)T (Pk|k−1)
†νk2
);3
584

REFERENCES
[1] IDC, “IDC media center,” https://www.idc.com/getdoc.jsp?containerId=prUS42213817, 2017.
[2] A. D. Luca, “Executive summary of world robotics 2009,”https://www.dis.uniroma1.it/∼deluca/rob1 en/2009 WorldRoboticsExecSummary.pdf, 2009.
[3] K. D. Akdemir, D. Karakoyunlu, T. Padir, and B. Sunar, “An emergingthreat: eve meets a robot,” in International Conference on TrustedSystems, 2010.
[4] T. Litman, “Autonomous vehicle implementation predictions. Implica-tions for transport planning.” http://www.vtpi.org/avip.pdf, 2014.
[5] Wikipedia, “Iran-U.S. RQ-170 incident,” 2016.[6] C. Yan, W. Xu, and J. Liu, “Can you trust autonomous vehicles:
Contactless attacks against sensors of self-driving vehicle,” DEF CON,2016.
[7] Y. Son, H. Shin, D. Kim, Y. Park, J. Noh, K. Choi, J. Choi, and Y. Kim,“Rocking drones with intentional sound noise on gyroscopic sensors,”in USENIX Security Symposium, 2015.
[8] T. E. Humphreys, B. M. Ledvina, M. L. Psiaki, B. W. OHanlon,and P. M. Kintner Jr, “Assessing the spoofing threat: Development ofa portable GPS civilian spoofer,” in Proceedings of the ION GNSSinternational technical meeting of the satellite division, 2008.
[9] J. Petit, B. Stottelaar, M. Feiri, and F. Kargl, “Remote attacks onautomated vehicles sensors: Experiments on camera and lidar,” BlackHat Europe, 2015.
[10] A. Greenberg, “Hackers reveal nasty new car attacks–with me behindthe wheel,” https://www.forbes.com/sites/andygreenberg/2013/07/24/hackers-reveal-nasty-new-car-attacks-with-me-behind-the-wheel-video/#55e2cfa8228c, 2013.
[11] C. Miller and C. Valasek, “Remote exploitation of an unaltered passengervehicle,” Black Hat USA, 2015.
[12] Tencent Keen Security Lab, “Car hacking research: Remote attacktesla motors,” http://keenlab.tencent.com/en/2016/09/19/Keen-Security-Lab-of-Tencent-Car-Hacking-Research-Remote-Attack-to-Tesla-Cars/,2016.
[13] Wikipedia, “200911 toyota vehicle recalls,” 2017.[14] DMV, “Google self-driving car testing report on disengagements
of autonomous mode december 2015,” https://www.dmv.ca.gov/portal/wcm/connect/dff67186-70dd-4042-bc8c-d7b2a9904665/googledisengagement report.pdf?MOD=AJPERES, 2015.
[15] N. Bezzo, J. Weimer, M. Pajic, O. Sokolsky, G. J. Pappas, and I. Lee,“Attack resilient state estimation for autonomous robotic systems,” inIntelligent Robots and Systems, IEEE/RSJ International Conference on,2014.
[16] Y. Mo, E. Garone, A. Casavola, and B. Sinopoli, “False data injectionattacks against state estimation in wireless sensor networks,” in Decisionand Control, IEEE Conference on, 2010.
[17] J. Park, R. Ivanov, J. Weimer, M. Pajic, and I. Lee, “Sensor attackdetection in the presence of transient faults,” in Proceedings of theACM/IEEE Sixth International Conference on Cyber-Physical Systems,2015.
[18] M. Pajic, P. Tabuada, I. Lee, and G. J. Pappas, “Attack-resilient stateestimation in the presence of noise,” in Decision and Control, IEEEAnnual Conference on, 2015.
[19] H. Fawzi, P. Tabuada, and S. Diggavi, “Secure estimation and control forcyber-physical systems under adversarial attacks,” Automatic Control,IEEE Transactions on, 2014.
[20] S. Yong, M. Zhu, and E. Frazzoli, “Resilient state estimation againstswitching attacks on stochastic cyber-physical systems,” in Decision andControl, IEEE Conference on, 2015.
[21] F. Pasqualetti, F. Dorfler, and F. Bullo, “Attack detection and identifica-tion in cyber-physical systems,” Automatic Control, IEEE Transactionson, 2013.
[22] H. Kim, P. Guo, M. Zhu, and P. Liu, “On attack-resilient estimationof switched nonlinear cyber-physical systems,” in American ControlConference, 2017.
[23] Y. Shoukry, P. Martin, Y. Yona, S. Diggavi, and M. Srivastava, “PyCRA:Physical challenge-response authentication for active sensors underspoofing attacks,” in Proceedings of the 22nd ACM SIGSAC Conferenceon Computer and Communications Security, 2015.
3Notations † and | · |+ refer pseudoinverse and pseudodeterminant, respec-tively. n refers to the rank of Pk|k−1.
[24] R. Bosch et al., “CAN specification version 2.0,” Rober Bousch GmbH,Postfach, vol. 300240, 1991.
[25] J. Scobie and M. Stachew, “Electronic control system partitioningin the autonomous vehicle,” http://www.eenewsautomotive.com/content/electronic-control-system-partitioning-autonomous-vehicle, 2015.
[26] K. Koscher, A. Czeskis, F. Roesner, S. Patel, T. Kohno, S. Checkoway,D. McCoy, B. Kantor, D. Anderson, H. Shacham et al., “Experimentalsecurity analysis of a modern automobile,” in Security and Privacy, IEEESymposium on, 2010.
[27] R. M. A. de Almeida, L. H. de Carvalho Ferreira, and C. H. Valerio,“Microkernel development for embedded systems,” Journal of SoftwareEngineering and Applications, 2013.
[28] S. Checkoway, D. McCoy, B. Kantor, D. Anderson, H. Shacham,S. Savage, K. Koscher, A. Czeskis, F. Roesner, T. Kohno et al.,“Comprehensive experimental analyses of automotive attack surfaces.”in USENIX Security Symposium, 2011.
[29] C. Miller and C. Valasek, “Adventures in automotive networks andcontrol units,” DEF CON, 2013.
[30] A. Taylor, N. Japkowicz, and S. Leblanc, “Frequency-based anomalydetection for the automotive CAN bus,” in Industrial Control SystemsSecurity, World Congress on, 2015.
[31] H. M. Song, H. R. Kim, and H. K. Kim, “Intrusion detection systembased on the analysis of time intervals of CAN messages for in-vehicle network,” in Information Networking, International Conferenceon, 2016.
[32] K.-T. Cho and K. G. Shin, “Fingerprinting electronic control units forvehicle intrusion detection.” in USENIX Security Symposium, 2016.
[33] K.-T. Cho and K. Shin, “Viden: Attacker identification on in-vehiclenetworks,” arXiv preprint arXiv:1708.08414, 2017.
[34] A. Taylor, S. Leblanc, and N. Japkowicz, “Anomaly detection in auto-mobile control network data with long short-term memory networks,” inData Science and Advanced Analytics, IEEE International Conferenceon, 2016.
[35] M. Muter, A. Groll, and F. C. Freiling, “A structured approach toanomaly detection for in-vehicle networks,” in Information Assuranceand Security, IEEE International Conference on, 2010.
[36] A. Ganesan, J. Rao, and K. Shin, “Exploiting consistency amongheterogeneous sensors for vehicle anomaly detection,” SAE TechnicalPaper, Tech. Rep., 2017.
[37] J. H. Kotecha and P. M. Djuric, “Gaussian particle filtering,” IEEETransactions on signal processing, 2003.
[38] E. Y. Chow and A. S. Willsky, “Analytical redundancy and the design ofrobust failure detection systems,” Automatic Control, IEEE Transactionson, 1984.
[39] L. Sha, R. Rajkumar, and M. Gagliardl, “A software architecture fordependable and evolvable industrial computing systems.” Carnegie-Mellion Univ Pitts PA Software Engineering Inst, Tech. Rep., 1995.
[40] P. Guo, H. Kim, N. Virani, J. Xu, M. Zhu, and P. Liu, “Nonlinearunknown input and state estimation algorithm in mobile robots,” arXivpreprint arXiv:1804.02814, 2018.
[41] “K-team mobile robotics - Khepera III,” http://www.k-team.com/mobile-robotics-products/old-products/khepera-iii, 2016.
[42] S. Karaman and E. Frazzoli, “Sampling-based algorithms for optimalmotion planning,” The International Journal of Robotics Research, 2011.
[43] D. E. Rivera, M. Morari, and S. Skogestad, “Internal model control: PIDcontroller design,” Industrial & engineering chemistry process designand development, 1986.
[44] “RC TT02 Chassis,” https://www.tamiyausa.com/items/radio-control-kits-30/rc-semi-assembled-chassis-35900/rc-tt02-chassis-57984?product-id=57984, 2017.
585