robinson, a dissertation - university of oxford€¦ · as a result, debate emerged over the...
TRANSCRIPT

Dissertation
Title: 1991 Economic Liberalisation Reforms in India: A Micro-Level Analysis
Word count: 9,997
Anna Robinson
School of Interdisciplinary Area Studies University of Oxford
Paper submitted in partial fulfilment of the requirements for the Degree of Master of Science
in Contemporary India at the University of Oxford
2
Table of Contents Appendix: List of Abbreviations ............................................................................................ 3
1. Introduction .......................................................................................................................... 4 2. Literature review ................................................................................................................. 7
2.1 The theory: liberalisation leads to economic growth ....................................................... 7 2.2 Liberalisation reforms in India ......................................................................................... 8 2.3 Two dominant orthodoxies .............................................................................................. 9
2.3.1 Orthodoxy 1: Growth in the 1990s ........................................................................... 9 2.3.2 Orthodoxy 2: Growth in the 1980s ......................................................................... 10
2.4 Lagged effects of growth ............................................................................................... 11 2.5 Research questions ......................................................................................................... 12
3. Methodology ....................................................................................................................... 14 3.1 Analytical framework .................................................................................................... 14
3.1.1 Corporates change the way they do business ......................................................... 14 3.1.2 Factors of production become more mobile ........................................................... 15 3.1.3 Individual attitudes change ..................................................................................... 16
3.2 Collection and dissemination of data ............................................................................. 17 4. Analysis ............................................................................................................................... 19
4.1 Corporates change the way they do business ................................................................. 19 4.1.1 Improving firm competitiveness .............................................................................. 20 4.1.2 Pursuing growth ...................................................................................................... 22 4.1.3 Strengthening corporate expertise .......................................................................... 24
4.2 Factors of production become more mobile .................................................................. 26 4.2.1 Labour ..................................................................................................................... 26 4.2.2 Land ........................................................................................................................ 28 4.2.4 Capital ..................................................................................................................... 30 4.2.4 Entrepreneur ........................................................................................................... 31
4.3 Individual attitudes change ............................................................................................ 34 4.3.1 Attitudes to female employment .............................................................................. 34 4.3.2 Attitudes to work ..................................................................................................... 37 4.3.3 Attitudes to saving ................................................................................................... 39
5. Conclusions ......................................................................................................................... 40 5.1 Limitations ..................................................................................................................... 43
6. References Cited ................................................................................................................. 44

3
Appendix: List of Abbreviations
FP Factors of Production GDP Gross Domestic Product GNP Gross National Product LFPR Labour Force Participation Rate M&A Mergers and Acquisitions MNE Multi-national Enterprise MRTP Monopolies and Restrictive Trade Practices Act MUL Maruti Udoyog Ltd NSS National Sample Survey OECD Organisation for Economic Co-operation and Development PUCL Peoples Union for Civil Liberties PUDR Peoples Union for Democratic Rights Rs Rupees SAIL Steel Authority of India Limited SCs Scheduled Castes SME Small and Medium Enterprises STs Scheduled Tribes TFP Total Factor Productivity TISCO Tata Iron and Steel Company US United States of America WVS World Values Survey
4
1. Introduction
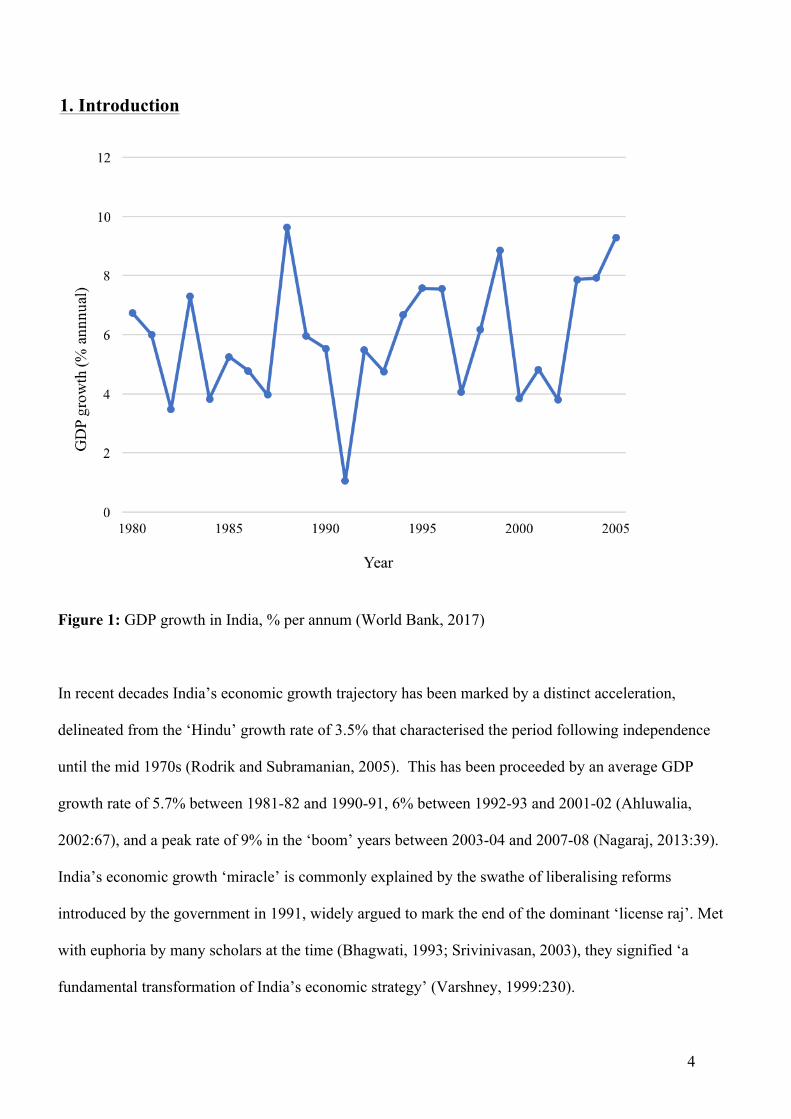
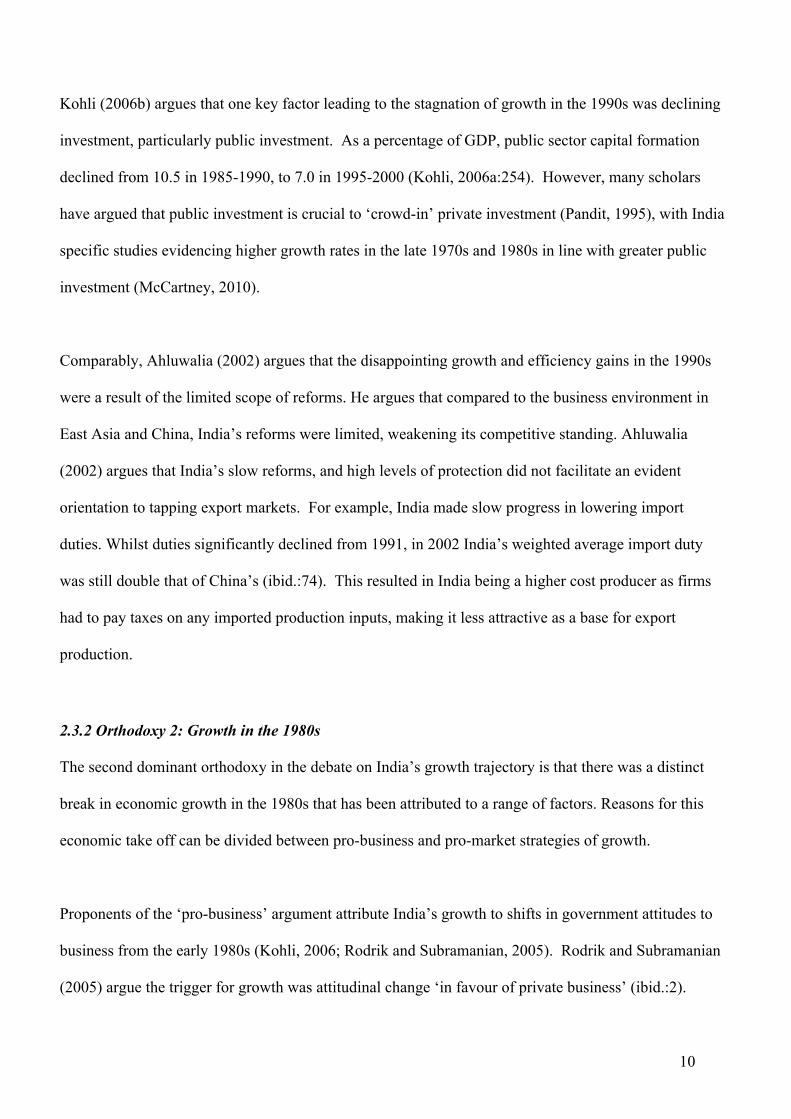
Figure 1: GDP growth in India, % per annum (World Bank, 2017)
In recent decades India’s economic growth trajectory has been marked by a distinct acceleration,
delineated from the ‘Hindu’ growth rate of 3.5% that characterised the period following independence
until the mid 1970s (Rodrik and Subramanian, 2005). This has been proceeded by an average GDP
growth rate of 5.7% between 1981-82 and 1990-91, 6% between 1992-93 and 2001-02 (Ahluwalia,
2002:67), and a peak rate of 9% in the ‘boom’ years between 2003-04 and 2007-08 (Nagaraj, 2013:39).
India’s economic growth ‘miracle’ is commonly explained by the swathe of liberalising reforms
introduced by the government in 1991, widely argued to mark the end of the dominant ‘license raj’. Met
with euphoria by many scholars at the time (Bhagwati, 1993; Srivinivasan, 2003), they signified ‘a
fundamental transformation of India’s economic strategy’ (Varshney, 1999:230).

5
However, whilst anticipated economic growth was likened to unleashing the ‘caged tiger’ (Crook,
1991:5), substantial increases in growth and efficiency failed to materialise throughout the 1990s, only
shifting significantly in 2003. As a result, debate emerged over the proximate causes and timing of the
break in India’s economic growth. Two orthodoxies dominate this literature: that liberalisation in the
1990s led to disappointing macro-economic outcomes, and that there was a distinct break in economic
growth in the 1980s that can be attributed to a range of factors.
Comparable to these dominant growth orthodoxies, several scholars (Virmani and Hashim, 2011) have
argued that the 1991 liberalisation reforms did lead to increases in growth and productivity, but with a
lagged effect, manifest in the 2003 growth boom. They contend that a major structural adjustment in the
economy, such as the 1991 reforms, leads to an initial slowdown in productivity and output as firms
adjust to the novel environment. Once they have adapted, an acceleration in growth and production
ensues. Whilst this proposition is supported by macro studies of India’s aggregate economy, there is
limited explanation of the changes reforms initiated at the micro level of the economy, inclusive of
firms and individuals, and how these contributed to growth in the 2000s.
From delineating this gap in the literature, I identify the following research question: To what extent did
the 1991 liberalisation policies in India lead to the economic boom in 2003? In responding to this
query, I will utilise a three-pronged analytical framework drawing from economic theory of what
constitutes the necessary preconditions for liberalisation to be a ‘success’, in terms of enhancing GDP
growth and efficiency. These preconditions are as follows: corporates change the way they do business
(Aggarwal, 2003); factors of production (land, labour, capital and entrepreneur) become more mobile
(Onyemelukwe, 2016); and individual attitudes change (Heller, 2009). This will evaluate the micro
level impacts of the 1991 reforms, and in doing so will develop comprehension on the intermediary step
to growth, between the macro level reforms and aggregate growth. As a result, it intends to determine
6
the origins of growth, as well as delineate the changes that liberalisation needs to induce to generate
growth and productivity. Furthermore, it will contribute to the wider debates about liberalisation and
growth.
This dissertation argues that liberalisation did lead to growth in India, but with a lagged effect. It
further contends that liberalisation facilitated changes at the micro level; leading to dynamic shifts in
the functioning of the economy and the economic actors within, which proceeded to become more profit
and market oriented. By 2003 this gave rise to the emergence of a more competitive, focused and
productive corporate force. This was aligned to the benign global environment at the time; a boom in
world trade, growing at 16.5% per annum in 2003-2008; high capital flows to emerging markets,
doubling in 5 years; and a global communications revolution enabling extensive opportunities for
outsourcing (Nagaraj, 2013:41). This combination resulted in the substantial growth boom of 2003.
It is worth mentioning at this point what this study does not aim to do. It will not assess changes in the
informal sector. Rather, it will analyse changes in the formal corporate sector, primarily in industry and
services, as this is where the growth boom of the 2000s that this study seeks to explain was focused. In
addition, it will not quantify the impact of liberalisation reforms on the 2003 boom, nor assess the
comparable scale of the impact of liberalisation on growth in the 2000s.
Following the introduction, this paper proceeds as follows: section 2 will outline the theory that
liberalisation leads to economic growth, dissect the orthodoxies of India’s growth debate and literature
on its lagged growth, and then outline the research questions; section 3 will delineate the analytical
framework, and collection of data; section 4 will present the analysis of findings; and section 5 will
present the conclusions, including recommendations for further research.

7
2. Literature review
This section will firstly define key terms, delineate the theoretical argument that economic liberalisation
leads to increased growth and productivity, then outline the 1991 reforms in India. It will proceed to
critically engage with the two orthodox sides of the growth debate in India to ‘situate the project in its
relevant context’ (Hart, 2010:19) and identify existing gaps in the literature. India’s recent economic
growth acceleration can be demarcated into two lines of debate: that liberalisation in the 1990s led to
disappointing macro-economic outcomes; and that there was a distinct break in economic growth in the
1980s which has been attributed to a range of factors. It will conclude with the research questions.
In this paper, economic growth refers to the rate of GDP growth. This can be derived from an increase
in total factors of production (FP), labour, land, capital, and entrepreneur; or from a more efficient
combination of FP (McCartney, 2015:5). Productivity increase uses the Total Factor Productivity (TFP)
index, a measure of efficiency gains in the use of inputs (FP) (Corbridge et al. 2013:35).
2.1 The theory: liberalisation leads to economic growth
Proponents of liberalisation argue that it leads to an increase in economic growth and productivity
(McCartney, 2010). Rooted in neoliberal principles, it advocates the movement from a planned or
highly regulated economy to a market economy; implying a roll back of the state and advance of the
private sector. The market economy denotes an economic system in which the interaction of supply and
demand decisions by private sector agents determine economic decisions and the prices of goods and
services. Neoclassical economics assumes that it accelerates growth based on the model of a perfectly
competitive market1. This model predicts that if an imbalance in supply or demand exists in the market,
it will generate either excess profits or losses, and lead agents to reallocate resources in response to 1 The model of a market in perfect competition rests on the following assumptions: large number of buyers and sellers; no buyers or sellers can influence the ruling market by their own action; all buyers and sellers can trade as much as they wish at the ruling market price; all buyers and sellers possess perfect market information; a uniform product; free entry and exit.

8
those price signals. It will further generate forces pushing it back to a state of equilibrium, in which
price and quantity is equal to supply and demand; theoretically resulting in the most efficient allocation
of resources. For example, the software sector boom in India in the 1990s led to a shortage of skilled
labour in India, which resulted in higher wages for software engineers, and attracted more people to
university to learn the relevant skills. In addition, this led to the opening of specialised universities,
facilitating more labour in this area. This exemplifies the functioning of demand and supply to improve
the efficiency of resource allocation, and thus lead to economic growth.
Proposed advantages of a market economy are increased efficiency, productivity and innovation. With
less government intervention, such as using import tariffs to protect domestic firms from foreign
competition, it is proposed that competition will increase and drive out inefficiency as businesses are
forced to control costs to compete in the open market. In addition, as competition increases, individuals
and businesses are more motivated to increase their productivity, and innovate products.
2.2 Liberalisation reforms in India
In 1991, India’s Finance Minister introduced the New Economic Policy, entailing a swathe of
liberalising reforms leading to a breakdown of the previously dominant ‘license raj’ (Alfaro and Chari,
2013). These deregulation reforms can be rooted in a combination of external and internal pressures,
including stalling economic growth, a balance of payments crisis, and pressures from big businesses to
pursue growth opportunities (Aggarwal, 2003:181). In addition, many scholars at the time (Bhagwati,
1993; Srivinivasan, 2003) supported the reforms, insisting that liberalisation would generate faster
economic growth. They condemned the previous interventionist policy framework for stifling growth,
and thus reforms were met with euphoria, with Varshney (1999:230) declaring they marked ‘a
fundamental transformation of India’s economic strategy’.
9
Kotwal et al. (2011:1157) outlines the reforms as addressing four major elements of the pre-reform
regime: restrictions in the form of tariff and nontariff barriers on imports; restrictions on both the
domestic and foreign private sector; state control of banking and insurance; and public sector
monopolies. The premise of reforms was that they would facilitate a more competitive environment,
improve efficiency and pursue growth (Chaudhuri, 2002:155).
2.3 Two dominant orthodoxies
India’s accelerated growth trajectory has been subject to debate in two areas; its proximate causes, and
the timing of its structural break (Sen, 2009). This section will outline the two dominant orthodoxies in
India’s growth trajectory debate: that liberalisation in the 1990s led to disappointing macro-economic
outcomes; and that there was a distinct break in economic growth in the 1980s which has been
attributed to a range of factors.
2.3.1 Orthodoxy 1: Growth in the 1990s
The first orthodoxy of India’s growth debate is that liberalisation in 1991 led to disappointing macro-
economic outcomes. Despite significant reforms in 1991, it is apparent that neither growth nor
productivity increased significantly in the 1990s. GDP growth evidenced only a marginal increase;
with an average annual rate of 5.7% between 1981-82 and 1990-91 increasing to 6% between 1992–
1993 and 2001–2002 (Ahluwalia, 2002:67). Disaggregated by sector, only the services sector witnessed
a distinct increase from 6.9% in 1981-91to 8.1% in 1991-01 (Panagariya, 2004:27). The second
expectation, that it would lead to enhanced productivity was equally disappointing. Economic
efficiency gains measured by TFP increased at 1.57% per annum between 1990-99, compared to 2.49%
per annum between 1980-90 (Rodrik and Subramanian, 2005:31). Thus, many concluded that
liberalisation reforms had a negligible impact on growth (Ahluwalia, 2002) and scholars have sought to
explain these disappointing macro-economic outcomes.
10
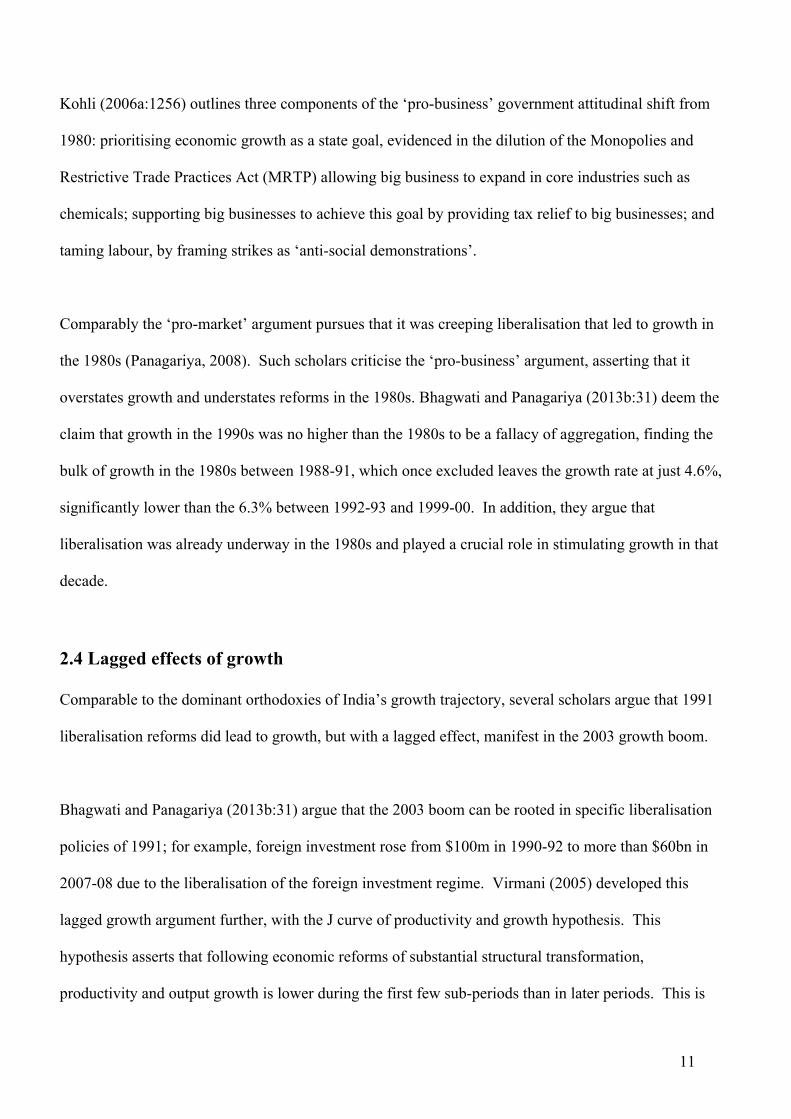
Kohli (2006b) argues that one key factor leading to the stagnation of growth in the 1990s was declining
investment, particularly public investment. As a percentage of GDP, public sector capital formation
declined from 10.5 in 1985-1990, to 7.0 in 1995-2000 (Kohli, 2006a:254). However, many scholars
have argued that public investment is crucial to ‘crowd-in’ private investment (Pandit, 1995), with India
specific studies evidencing higher growth rates in the late 1970s and 1980s in line with greater public
investment (McCartney, 2010).
Comparably, Ahluwalia (2002) argues that the disappointing growth and efficiency gains in the 1990s
were a result of the limited scope of reforms. He argues that compared to the business environment in
East Asia and China, India’s reforms were limited, weakening its competitive standing. Ahluwalia
(2002) argues that India’s slow reforms, and high levels of protection did not facilitate an evident
orientation to tapping export markets. For example, India made slow progress in lowering import
duties. Whilst duties significantly declined from 1991, in 2002 India’s weighted average import duty
was still double that of China’s (ibid.:74). This resulted in India being a higher cost producer as firms
had to pay taxes on any imported production inputs, making it less attractive as a base for export
production.
2.3.2 Orthodoxy 2: Growth in the 1980s
The second dominant orthodoxy in the debate on India’s growth trajectory is that there was a distinct
break in economic growth in the 1980s that has been attributed to a range of factors. Reasons for this
economic take off can be divided between pro-business and pro-market strategies of growth.
Proponents of the ‘pro-business’ argument attribute India’s growth to shifts in government attitudes to
business from the early 1980s (Kohli, 2006; Rodrik and Subramanian, 2005). Rodrik and Subramanian
(2005) argue the trigger for growth was attitudinal change ‘in favour of private business’ (ibid.:2).
11
Kohli (2006a:1256) outlines three components of the ‘pro-business’ government attitudinal shift from
1980: prioritising economic growth as a state goal, evidenced in the dilution of the Monopolies and
Restrictive Trade Practices Act (MRTP) allowing big business to expand in core industries such as
chemicals; supporting big businesses to achieve this goal by providing tax relief to big businesses; and
taming labour, by framing strikes as ‘anti-social demonstrations’.
Comparably the ‘pro-market’ argument pursues that it was creeping liberalisation that led to growth in
the 1980s (Panagariya, 2008). Such scholars criticise the ‘pro-business’ argument, asserting that it
overstates growth and understates reforms in the 1980s. Bhagwati and Panagariya (2013b:31) deem the
claim that growth in the 1990s was no higher than the 1980s to be a fallacy of aggregation, finding the
bulk of growth in the 1980s between 1988-91, which once excluded leaves the growth rate at just 4.6%,
significantly lower than the 6.3% between 1992-93 and 1999-00. In addition, they argue that
liberalisation was already underway in the 1980s and played a crucial role in stimulating growth in that
decade.
2.4 Lagged effects of growth
Comparable to the dominant orthodoxies of India’s growth trajectory, several scholars argue that 1991
liberalisation reforms did lead to growth, but with a lagged effect, manifest in the 2003 growth boom.
Bhagwati and Panagariya (2013b:31) argue that the 2003 boom can be rooted in specific liberalisation
policies of 1991; for example, foreign investment rose from $100m in 1990-92 to more than $60bn in
2007-08 due to the liberalisation of the foreign investment regime. Virmani (2005) developed this
lagged growth argument further, with the J curve of productivity and growth hypothesis. This
hypothesis asserts that following economic reforms of substantial structural transformation,
productivity and output growth is lower during the first few sub-periods than in later periods. This is

12
the result of an initial slowdown in productivity and output growth, due to the obsolescence of product
lines and capital, the gradual adoption of new technology, and the diversion of human resources to
learning (Virmani and Hashim, 2011:5). Once firms adjust to the new situation and develop capacity,
they experience a rise in productivity and output growth. Virmani and Hashim (2011:27) test this
hypothesis in the context of India’s 1991 reforms, concluding that the data broadly supports the
hypothesis, with the J curve entering a high steady state of growth by 2007-8.
2.5 Research questions
From studying the existing literature on India’s growth debate, it is evident that a distinct gap exists;
analysis of micro level responses to liberalisation in 1991, and their contribution to growth in 2003.
Dominant orthodoxies of India’s growth trajectory discussed in section 2.3 assume that liberalisation in
1991 failed to have an impact on growth, due to the disappointing GDP growth and TFP figures in the
1990s. This paper will question this assumption by assessing the micro economic responses to
liberalisation in the 1990s, and the extent to which these initiated deep, structural changes in the
functioning of the economy, leading to a lagged effect of growth at the aggregate level.
This paper will go beyond macro-economic accounts of liberalisation, focused on aggregate measures
of output and productivity. Instead, it will focus on the micro-economic impacts of liberalisation,
assessing the responses of firms, factors of production (labour, land, capital, entrepreneur) and
individuals; and evaluate how these changes contributed to lagged growth in the 2000s. For example,
whilst existing studies have demonstrated shifting TFP rates, they fail to consider the factors that have
driven these changes, such as a more efficient use of labour. As a result, they assume that liberalisation
makes the economy more competitive, rather than looking at measures of competition or gauging the
behaviour of firms to assess this assumption. To this end, this study will provide a micro level

13
explanation for Virmani’s (2005) J curve hypothesis, developing comprehension on the intermediary
step to growth, between the macro level reforms and increased output. In addition, it intends to pursue
understanding of what liberalisation needs to induce in order to generate growth and efficiency.
To this end, I identify the following research question: To what extent did the 1991 liberalisation
policies in India lead to the economic boom in 2003? This is broken down into three sub questions.
a) To what extent did liberalisation policies in 1991 change how corporates do business during
the 1990s?
b) To what extent did liberalisation policies in 1991 increase the mobility of factors of
production in the 1990s?
c) To what extent did liberalisation policies in 1991 lead a change in individual attitudes and
values throughout the 1990s?

14
3. Methodology
Firstly, this section will outline the three-pronged analytical framework and its theoretical justification:
changes in how corporates do business; increases in the mobility of factors of production; and changes
in individual attitudes. It will then discuss the collection and dissemination of data.
3.1 Analytical framework
As highlighted in section 2.5, this study intends to build on the shortcomings of existing literature by
examining the micro-level economic impacts of India’s liberalisation reforms in 1991, and their
implications for the 2003 boom.
In doing so, the study will employ a distinct three-pronged analytical framework. This will be
structured around factors highlighted in the literature as both expectations of liberalisation and
preconditions to facilitate its ‘success’, thereby resulting in increased growth and productivity. These
components are: changes in how corporates do business (Aggarwal, 2003); increases in the mobility of
factors of production (Onyemelukwe, 2016); and changes in individual attitudes (Heller, 2009).
Analysis intends to evaluate the extent to which liberalisation reforms enacted these factors, and further
probe how they facilitated enhanced growth and efficiency in the 2000s, thus opening the causal link
between liberalisation and growth.
3.1.1 Corporates change the way they do business
The first expectation of liberalisation, and precondition of its success is that corporates change the way
they do business (Aggarwal, 2003). Analysis of change will be assessed in three areas; improving
competitiveness, pursuing growth and enhancing expertise.

15
Aggarwal (2003) utilises transaction cost economics as a theoretical framework to explain the changing
structure of firms in response to liberalisation. This theory states that the boundaries of a firm depend
inversely on the efficiency of external markets; the more inefficient the external markets, the wider the
firm’s boundaries (ibid.:187). Prior to reforms, the Indian business environment was dominated by
widely diversified, vertically integrated groups (Khanna and Palepu, 2000), partially rooted in industrial
expansion restrictions in the licence raj. This can be further attributed to high external transaction
costs, and the inefficiency of external markets for corporate inputs, making it more efficient to
internalise these markets. However, with a move to a market economy it is anticipated that transaction
costs will decline and external markets will become more efficient, due to the replacement of
bureaucratic controls with market mechanisms (Aggarwal, 2003). This leads to the consolidation of the
structure of firms, and a shift in focus to their core competencies.
Furthermore, a shift in corporate behaviour from government seeking to market seeking is anticipated.
Prior to liberalisation, business behaviour was government seeking. They were used to dealing with
bureaucracy to boost profits, for example by persuading the government to raise subsidies, give them
licenses or increase protection from imports. In an increasingly liberalised economy firms must adopt
market seeking behaviour to remain viable; seeking to control costs, introduce new products, compare
themselves to other firms, and emulate best practice (Aggarwal, 2003). Economic deregulation thus
changes the structure of incentives in the economy.
3.1.2 Factors of production become more mobile
The second expectation of liberalisation, and precondition of its success is that FP, defined as inputs
used to produce goods and services in an economy, will become more mobile (Onyemelukwe, 2016).
Analysis of change will be assessed across the four FP (Marshall, 1890): labour, land, capital and
entrepreneur.

16
To attain the maximum growth in a dynamic situation Onyemelukwe (2016:198) asserts that FP need to
be mobile, to maximise factor employment. Schumpeter’s (1942) theory of creative destruction
expands on this, stating that the innovation mechanism, which leads to the replacement of outdated
products with new ones, facilitates growth and efficiency. This process of creation and destruction leads
to the deconstruction of FP combinations, freeing up these factor resources to be deployed elsewhere.
Hence, FP mobility is imperative to this process, and thus to growth and efficiency. This process can be
evidenced in the example of the expanding software sector in India in the 1990s. Whilst the expansion
was facilitated by technology development and the liberalisation of trade enabling imports of foreign
technology, to grow successfully, labour had to be mobile, entering engineering schools, then software
firms; land had to be acquired to build offices; financial capital had to be borrowed from banks to
finance investments; and an entrepreneur had to have an innovative business idea to combine these FP.
3.1.3 Individual attitudes change
The third expectation of liberalisation, and precondition of its success is that attitudes of individuals
change (Heller, 2009). Analysis of change will be assessed in three areas; attitudes to female
employment, attitudes to work, and attitudes to saving.
Changing individual attitudes as a precondition to benefit from liberalisation is rooted in scholarship
that links economic performance to specific cultural values, being the informal ‘norms, meanings and
behaviours’ within human society (Fukuyama, 2001: 3130). Durkheim (1933) and Weber (1992)
argued that economic systems could not be understood without a consideration of how cultural norms
impact the system. Weber (1992) further made the case that the success of capitalism and growth in
17th century Europe was a result of the cultural values of Protestantism, notably the moral duty of hard
work and the imperative to save. Contemporary scholarship has also specified gender egalitarian values

17
as facilitative of economic growth (Ghani et al., 2016), enabling more women to enter the labour force
and thus enable a more efficient allocation of labour resources.
In assessing the implications of liberalisation to change individual attitudes, and potential implications
for economic growth, I will analyse changes in India’s cultural values following the 1991 reforms using
data from the World Values Survey (WVS). The analysis will firstly assess attitudes to female
employment. As societal values become more gender egalitarian, more women enter the labour force,
in theory leading to the more efficient allocation of resources and economic growth. It will then assess
attitudes towards work, with values focused on the merit of labour and hard work proven to positively
affect productivity and economic growth (McCartney, 2015:25). Finally, it will assess changing
attitudes towards saving, linked to economic growth as saving increases the pool of resources available
for investment (McCartney, 2015:250).
3.2 Collection and dissemination of data
Data for this study was obtained from a range of secondary sources. With the aim of ensuring the
validity of findings, I employed the triangulation of sources methodology to corroborate evidence
across themes. For sections 4.1 and 4.2 of the analysis, I primarily obtained data from academic
literature from 1991 onwards. To analyse the impact of reforms at the firm level, data on specific firms
was acquired from academic case studies and the Financial Times archives. I then utilised the case
study approach to examine the commonalties and intricacies of the resultant impacts (Yin, 2009).
Quantitative data was acquired from a range of literature, employing data from various studies,
including the National Sample Survey (NSS), and the Prowess database. The limitations of these
databases and potential impacts on this study should be noted. The NSS provides large scale sample
surveys in India, and therefore is useful to assess longitudinal changes, for example in female labour
force participation rate (LFPR). However, due to noted changes in the methodology, questions and

18
sample size at various stages, this may negatively impact the consistency of results over time. The
Prowess dataset is well suited to assessing how Indian firms change over time, as it provides data on a
panel of firms (Alfaro and Chari, 2013). However, Goldberg et al. (2009) note that it only includes
larger firms, for which entry and exit are not significant margins of adjustment, therefore this may
constrain the findings for the impacts of liberalisation.
Data for section 4.3 of the analysis was obtained from the World Values Survey (WVS) website.
Conducted since 1981, this global research project utilises a standardised questionnaire to explore
people’s values and how they change over time, assessing values concerning gender roles, work
motivations and good governance, among others (WVS, 2017). By 1999-2004, it surveyed 67 countries
with 96,000 respondents (WVS, 2017: 5). Results provide novel evidence, indicating the effect of
people’s beliefs at the micro level for societal changes at the macro level; including economic
development and the emergence of democratic institutions (WVS, 2017). For example, Inglehart et al.
(2004) have evidenced links between specific value dimensions and GNP per capita; with values of
survival/self-expression linked to high income countries, and traditional/secular-rational values linked
to low income countries. Similarly, in a study of 25 OECD countries, Fortin (2005) demonstrated the
relationship between gender egalitarian attitudes and stronger female labour market outcomes.
WVS questions were selected based on their content and the waves in which they were used, with those
in 1989/93, 1990/94, 1995/99, and 2000/04 favoured as they cover the period following 1991 reforms
until the 2003 economic boom. For this paper, the WVS provided a useful source of longitudinal data
to assess changes in attitudes and values in India. However, there are two key drawbacks pertinent to
this study. As the surveys are conducted orally, the respondent may be hesitant to answer truthfully
particularly in culturally sensitive areas. In addition, the translation and meaning of words may vary
leading to misinterpretation (Weniger, 2012).
19
4. Analysis
This section will investigate the extent to which 1991 liberalisation reforms in India enacted change at
the micro-level of the economy, and evaluate the contribution of these changes to the lagged growth
effect. This section is ordered as follows:
4.1 Corporates change the way they do business
4.2 Factors of Production become more mobile
4.3 Individual attitudes change
4.1 Corporates change the way they do business
Prior to reforms, the functioning of business in India was largely dictated by the state, with industry
expansion limited under the MRTP, sectors under public control, minimal foreign engagement and
industrial licensing. The 1991 reforms instigated two substantial changes to the corporate environment:
liberalisation of industrial licensing meant that new domestic players could emerge in previously
controlled sectors; and the reduction of import tariffs and barriers to entry for foreign companies eased
the introduction of new firms, products and services to the market (Kumar et al., 2009:36). To remain
viable, firms had to adapt to this novel environment, initiating a decade of restructuring, with profound
consequences for the operations, strategy, organisation and management of firms (Khandwalla, 2002).
Figure 2 displays Khandwalla’s (2002:427) model of a successful corporate response to liberalisation.
The following analysis will assess Indian companies against three of these elements: organisational
redesign (improving firm competitiveness); global growth opportunities (improving profitability) and
professional and employee oriented modes of management (strengthening corporate expertise).

20
Figure 2: Economic liberalisation and effective corporate response (Khandwalla, 2002: 427) 4.1.1 Improving firm competitiveness
The onset of liberalisation reforms in 1991 led Indian corporations to increasingly shift their behaviour
from government seeking to market seeking, due to changing structural incentives in the economy.
This section discusses the strategies firms adopted including restructuring, increasing productivity,
controlling costs, and becoming more innovative.
As discussed in section 3.1.1, transaction cost economics can be employed as a theoretical framework
to explain the changing structure of Indian firms in response to liberalisation. This predicts that moving
towards a market economy will narrow the boundaries of a firm and lead to greater consolidation, away
from the dominant widely diversified, vertically integrated structures of Indian corporates (Aggarwal,
2003). Following liberalisation, external markets become more efficient and transaction costs decline.

21
Furthermore, many advantages of the diversified corporate structure declined; firms suffered from
bounded rationality in managing diverse operations, and sheltering of weak operations, and it inhibited
benefits of the economies of scale in production (ibid.).
Dynamic changes were evidenced across Indian business houses. Business literature from the time
focused on the substantial restructuring of conglomerates. Guha (1998c:34) in the Financial Times
noted that ‘focus is the new buzzword’, citing examples of the restructuring of the Birla and Tata
groups; converting companies from a loose collection of holdings to corporate groups with strict lines
of accountability. For example, the Aditya Birla companies undertook a portfolio analysis of each
business to quantify value creation for shareholders, with non-performers being either restructured or
sold. Similarly, the Tata group undertook a programme to consolidate its management and improve
accountability. In 1991, the ownership structure within the group shifted to increase Tata Son’s share
of each group company to 26% (Witzel, 2010:62), facilitating more centralised management and
accountability. Many firms also restructured their operations to hone in on industries in which they
dominated. For example, in the steel industry, groups integrated their upstream and downstream
operations, with the Mittal and Essar groups expanding steel production, and manufacturing the raw
materials for it, thus upgrading products to create a competitive edge in a market that was previously
nationalised (D’Costa, 2000). Similarly, in the aluminium sector, the National Aluminium Company
expanded its smelting capacity from 230k tonnes to 345k tonnes in 1996 (Bose, 1996:21).
Another factor utilised to enhance a firm’s relative standing was to increase productivity, initiated by
cheaper factor services and greater competition from liberalisation (Kotwal et al., 2011). In the
manufacturing sector, Topalova and Khandelwal (2011) found that a 10% fall in tariffs from reforms
led to a 0.5% increase in TFP for the average firm. At a firm level, this productivity increase is

22
evidenced at Mahindra and Mahindra where in 1991, it took 1,230 workers to manufacture 70 engines a
day, whilst by 1994 it only took 760 workers to manufacture 125 engines a day (Kumar et al., 2009:39).
Many firms have also sought to improve cost efficiency. Tata Steel is a prominent example. At the
onset of liberalisation, the company was protected by high tariffs and limited competition, resulting in
outdated processes and high unit costs of production (Kumar et al., 2009). Since then, it has embarked
on a modernisation process to improve its cost efficiency, investing $2.5bn in capital upgrades and
reducing employees in Bihar from 78,000 to 38,000 (Kumar et al., 2009:170). By 2003, Tata Steel
emerged as the world’s lowest cost steel producer, with the company’s return on invested capital
increasing from 5.6% in 2000-01 to 36.5% in 2004-2005 (Anand and Singh, 2006:140).
A notable strategy post reforms has been to improve a firm’s level of innovation. Goldberg et al.’s
(2013) study assessed shifting product innovation in manufacturing firms and its contribution to
industry growth. Following the removal of high tariffs in the reforms, it was found that manufacturing
firms expanded the volume and variety of their imported inputs, increasing their import to GDP ratio
from 7.6 in 1990 to 11.6 in 2000 (ibid.:170). Furthermore, they estimated that new products accounted
for 35% of the increase in output growth of manufacturing.
4.1.2 Pursuing growth
As firms sought to become more competitive routes for growth, including mergers and acquisitions
(M&A) and foreign partnerships increased. These were facilitated by the removal of restrictive
provisions of the MRTP in 1991 relating to licensing for enterprise expansion, amalgamations and
takeovers of enterprises, and acquisition of foreign technology and investment (Beena, 2014:12).

23
Drawing on the theory of transaction cost economics discussed in section 3.1.1, Aggarwal (2003) states
that a move towards a market economy leads to the use of M&A and divestments as a tool for corporate
restructuring. During the 1990s there was substantial growth in corporate M&A in India, evidenced in
Figure 3 (Beena, 2014). The number of M&A deals increased from 268 in 1980-90 to 1034 in 1990-00.
In addition, Merchant (2001:12) found that the number of deals in 2000, 802, was double that in 1999.
Year Non-Manufacturing Manufacturing Total
1990-95 116 175 291 (20)
1995-00 233 510 743 (236)
1990-00 349 685 1034 (256)
M&A is commonly employed by a firm as a strategy for growth; to expand its capacity, enhance its
efficiency, or consolidate its business focus (Beena, 2014). Such strategies are evident in the M&A
activity in India. Many firms undertook deals to develop areas of core competency. For example, India
Cement’s takeover of Raasi Cement in 1998 strengthened its focus, and was driven by the logic that it
was cheaper to buy than to build, with it costing Rs10bn to build new plants with the capacity of Raasi
Cement, for which it paid Rs4bn (Guha, 1998b:34). In addition, to facilitate its ambitions to become a
global corporate leader, from the mid 1990s to 2003, Tata acquired one company a year on average,
with this figure increasing in the 2000s, with 5 acquired in 2004 (Kumar et al., 2009:162).
Another growth strategy has been joint ventures with foreign firms. This is particularly notable in the
automobile industry, with Maruti Udoyog Ltd (MUL) established in 1982 as a joint venture between the
Government of India and Suzuki Motors. By the late 1990s, MUL had achieved remarkable growth in
production, with 53 cars produced per employee per year, compared to 5 for Hindustan Motors (Okada,
2009: 93). Part of the reason for its success was the sharing of technological expertise. This included
Figure 3: M&A deals 1990-2000. Figures in brackets represent the number of MNE related deals. (Beena, 2014: 11)

24
the adoption of subcontracting, internalising external market linkages with suppliers, overcoming
supply bottlenecks, and increasing productivity without cost escalation (D’Costa, 2000:152).
4.1.3 Strengthening corporate expertise
Following reforms, Aggarwal (2003) notes a discernible shift towards valuing professional and
technical expertise within corporates. For many firms, this trend has been strengthened by the listing
companies on the stock market, meaning that corporate standards are subject to greater scrutiny.
The increasing value placed on professional management was notable in many Indian firms, where
positions were previously taken by family members (Kumar et al., 2009). Limited appreciation of
managerial competitive advantage was reflected in salaries, with top executives in the 1980s earning as
little as $5,000 per year (Kumar et al., 2009:40). From the 1990s salaries have moved in line with
global trends. A pertinent example of increased managerial value is at ArcelorMittal, a global steel
conglomerate. In 1995, Mittal acquired Ispat Karmet steel works in Kazakhstan and brought in skilled
managers from India. These were predominantly poached from the state-owned Steel Authority of India
Limited (SAIL), offering them attractive salaries in return for outstanding performance. This proved to
be a successful strategy, as SAIL managers were highly skilled and experienced (Kumar et al.,
2009:65). The increased corporate desire for managerial expertise and leadership is further evidenced
by the use of consulting services, with Srivastava and Srivastava (2012) noting that India has been one
of the fastest growing management consulting markets since 2000.
Increasingly, firms sought to create a competitive advantage through the employment of technical
expertise. Kumar et al. (2009) discusses the expansion of the technical workforce at Bharat Forge as
fundamental to the firm’s substantial growth. In the early 1990s, the firm’s chairman Baba Kalyani
acquired automated press lines for manufacturing forgings, and hired white collar employees with

25
science degrees to operate them. The firm shifted from an 85% blue collar workforce in 1989 to an 85%
white collar in 2000 (ibid.:87). This technical shift resulted in increased quality and speed, and reduced
costs. These results facilitated Bharat Forge’s trajectory to become a global leader in the market.

26
4.2 Factors of production become more mobile
Factors of production (labour, land, entrepreneur and capital) are the inputs used to produce goods and
services in an economy. As discussed in section 3.1.2, for increases in GDP growth and productivity to
be maximised, these factors need to become increasingly mobile (Onyemelukwe, 2016). This section
will evaluate changes in the mobility of FP (land, labour, capital and enterprise) following liberalisation
reforms in 1991.
4.2.1 Labour
Neoclassical economic theory states that a freely functioning and efficient labour market employs
people based on skills and productivity, not on discrimination characteristics. Becker’s (1957) model of
taste based employer discrimination further predicts that as an economy becomes more market oriented
and competitive, such as the case of post-1991 India, employer discrimination declines as rents that
were previously used to ‘pay’ for discriminatory behaviour are reduced, for example lowering trade
protection. Therefore, it was anticipated that following liberalisation in India discrimination in the
labour market, notably towards lower castes (Scheduled Castes, SCs and Scheduled Tribes, STs) and
females would decline. Whilst there are many measures of discrimination, this paper will utilise LFPR.
Studies assessing changes in levels of caste based discrimination in the labour market show a negligible
shift. Papola (2012:14) examines growth rates of employment for different caste groups in the periods
1983-1993/94, and 1993/94-2009/10, displayed in Figure 4. He found that all groups had similar rates
of employment growth over the two periods, apart from a higher rate of growth for SCs between 1983
and 1993/94. He concluded that SCs experienced gains in employment, however STs performed below
average, thus there have been marginal declines to caste based discrimination in the labour force.

27
Social Group Growth of Employment (% per annum)
1983/1993-94 (R) 1993-94/2009-10 (R)
SCs 2.7 (1.0) 1.7 (3.6)
STs 1.8 (-0.4) 0.9 (1.9)
Others 1.9 (2.6) 1.1 (1.5)
Figure 4: Growth of employment in % per annum for different social groups. Figures in brackets are for regular workers (Papola, 2012:14; NSSO 1983; 1993; 2009)
Studies assessing changes in gender based discrimination in the labour market also show a negligible
change. Bhalla and Kaur (2011:7) assess changes in female LFPR between 1983 and 2004/5, as
displayed in Figure 5. They found limited change since 1983, with the overall female LFPR remaining
constant at around 40%, and evidencing a decline in 1999/00 and 2004/05; rural women’s LFPR around
45%, and urban women’s LFPR around 23%. They state the divide between urban and rural women is
due to a higher incidence of poverty in rural areas, leading to the necessity of female employment.
1983 1993/94 1999/00 2004/05
All India 68.3 71.2 62.8 62.5
Females 40 46.5 38.9 38.6
Males 90.5 90.2 85.6 85.5
Rural India 70.5 75.5 66.3 65.9
Females 45.1 53.1 45.2 44.7
Males 91.1 92 87 86.9
Urban India 61.8 54.3 54.2 55
Females 23 23 22.5 24.3
Males 88.6 82.4 82.4 82.7
Figure 5: Percentage of the population in the labour force, ages 15-59 (Bhalla and Kaur, 2011:7)

28
These figures pose the query as to why liberalisation has failed to instigate higher LFPR for women in
India, as it has in many other developing countries. Ghani et al. (2013) suggest factors including cultural
norms, and the skew of growth in the manufacturing technology and capital intensive production,
aligned to male employment. This query exemplifies the need for a gendered analysis of economic
activity, examining how supposedly objective economic laws of market competition ‘work through and
within gendered structures’ in society (Humphrey, 1985:219) adding complexity to implementation.
4.2.2 Land
To derive the maximum economic growth from liberalisation, it is conceived that land markets must
become more mobile. This is rooted in North’s (1990:3) argument that strong institutions, inclusive of
property rights, are a fundamental source of economic growth as they determine incentives and
constraints on economic actors. Acemoglu et al. (2005) further asserts the importance of property rights
to enabling capital accumulation, stating that they facilitate incentives for individuals to invest in
physical or human capital. Despite the expectation outlined by Subramanian (2007) that economic
growth leads to improved institutional quality, in India the reality contradicts this expectation.
Following liberalisation reforms in 1991, Ghatak and Ghosh (2011:65) note there was ‘a voracious
appetite for space’ to meet the demands of industrialisation, resource extraction and urban expansion.
Levien (2015:3) notes the shift in land acquisition; from a regime that dispossessed land to produce
commodities, to one that dispossessed land for private investment, and thus commodified land.
However, distinct barriers to the smooth transaction of land remained prevalent. These include the
prevalence of fragmented and marginal landholdings; in 1995-96 43% of agricultural land in West
Bengal was in 1 hectare or less landholdings (Dasgupta, 2005:20), and ‘unclear’ land titles; estimated at
90% of titles (McKinsey, 2001:19). Due to the growing demand and complexity of transactions, state
governments increasingly played the role of land brokers (D’Costa and Chakraborty, 2017). This was
29
further incited by incentives to compete against other states for investment (Jenkins, 1999), and to
generate substantial rents (Levien, 2015). To acquire land from multiple landholders, states have
employed the ‘public purpose’ component of the Land Acquisition Act of 1894 (Sud, 2014). A notable
‘pro-business’ state, Gujarat has increased its land acquisition for industry from 2891 hectares in 1947-
60, to 136,596 hectares in 1981-2004 (Lobo and Kumar et al., 2009: 54-55).
Despite the state’s role as ‘broker’ businesses have faced significant problems in the acquisition and
proposed use of land. For example, in 1995 the Tata Iron and Steel Company (TISCO) was granted
permission to set up a steel plant, involving the acquisition of 7,000 acres (PUDR, 1997). Following
this, TISCO faced problems including indigenous protests, and the acquisition of infrastructure
including water and rail links; resulting in the abandonment of the project in 2000 (PUDR, 1997).
Similarly, a proposed steel plant in the Kalinganagar industrial complex, with land acquisition
commencing in 1992-94 resulted in large scale protests and police firing in 2006 (PUCL, 2006). These
examples exemplify the widespread difficulties a corporation undergoes to acquire land for business.
Whilst trade liberalisation has reduced barriers to trade participation, Duranton et al. (2015) asserts that
land markets remain highly distorted. As a result, these distortions have been cited as one of the largest
constraints on economic growth accounting for close to 1.3% of lost GDP growth per annum
(McKinsey, 2001:4). The continued difficulties in this area are evidenced in the Ease of Doing Business
reports, with land regulations hindering the ability to do business. In 2015 India stood at 142 out of 189
countries, close to the bottom in two categories, ‘Dealing with Construction Permits’ and ‘Enforcing
Contracts’, both fundamental to the mobility of land (World Bank, 2014:4).
30
4.2.4 Capital
Capital as a FP consists of the tools and machinery used to produce a good or service. This section
focuses on the mobility of financial capital, fundamental to the growth of a business. It is anticipated
that following liberalisation, constraints on the supply of funds for investment are eased.
It is noted that in India many businesses, particularly in the SME (Small and Medium Enterprise) sector
have difficulty acquiring finance through the traditional route of banks. Covering the period 1995-
2004, Ghosh (2006) examined whether financial liberalisation led to an easing in sourcing external
finance for manufacturing firms. He finds that following liberalisation the cash flow variable became
less important for the firm’s investments, implying that financial liberalisation improved access of small
firms to external finance.
Evaluating the proposed investment projects of industrial firms throughout the 1990s also demonstrates
increasing financial capital mobility within firms. The number of industrial investment intentions filed
through the industrial entrepreneurs’ memorandum increased from 3084 in 1991 to 6502 in 1995, and
decreased to 2948 in 1999. However, proposed investment consecutively increased from Rs763.10bn in
1991 to Rs1288.92bn in 1999 (Government of India, 2001).
Building on from the importance of the availability of financial capital to the growth of firms, it is noted
that venture capital evidences the maturity of the capital market and the incentive to mobilise the
entrepreneur. Figure 6 displays the amount of capital under management by the venture capital industry
in India (Dossani and Kenney, 2002:244). It shows a substantial increase, particularly after 1995.
Furthermore, it indicates that the source of this increase was the entrance of foreign institutional
investors. Dossani and Kenney (2002) trace the development of India’s venture capital industry to the
booming IT sector, entry of private venture capitalists particularly from the US, and the influence of

31
non-resident Indians in directing attention to the potential of entrepreneurs in India. This growth of the
venture capital industry is fundamental to the mobility of the entrepreneur, providing funds to bring its
ideas into fruition.
Figure 6: Capital under management by the Indian venture capital industry in US$ millions (Dossani and Kenney, 2002:244)
4.2.4 Entrepreneur
The ‘entrepreneur’ factor is the individual who attempts to make an economic profit from an idea by
combining it with all other FP, taking on the risks and rewards. Liberalisation provides enhanced
incentives for individual gains, therefore it is anticipated that entrepreneurial activity will rise.
At an aggregate level, increased mobilisation of entrepreneurs is expected to increase firm entry, and
competition between firms. Alfaro and Chari (2010) examined the impact of India’s liberalisation
reforms on competition between firms. From 1989 to 2005 they found that the entry of new private
firms across sectors increased from 3,031 in 1988-90 to 8,864 by 2005. Whilst their findings can be
32
assumed to indicate increased mobility of the entrepreneur, it should be noted that firm entry is a
reasonable, but not perfect proxy for entrepreneurial activity, as new firms may be owned by existing
corporations.
Once new entrants enter the liberalised market, it is predicted that they will have substantial
opportunities to grow and dominate. Sarkar (2012:304-305) assessed this prediction analysing changes
in the list of top Indian firms over time, at 10 year intervals: 1969, 1980, 1990, 2000, 2006. She found
there to be an increase in ‘corporate churning’ after 1990. In the period 1990-2000, there was a
significant turnover of rankings among the top twenty, with only nine remaining in the list while eleven
new groups entered. Guha (1998a:V) evidences this corporate churning with the comparison of
traditional company Century Textiles, controlled by Birla, and Wipro, a software company. In 1994,
Century Textiles was the 12th biggest private business, but by 1998 it posted losses of Rs867m.
Comparably Wipro didn’t rank in the top 1000 companies in 1994, yet in 1998 it ranked 4th, with
profits of Rs857m. This evidences Schumpeter’s (1942) theory of creative destruction, as more efficient
firms enter, those that are more inefficient or in lagged industries decline.
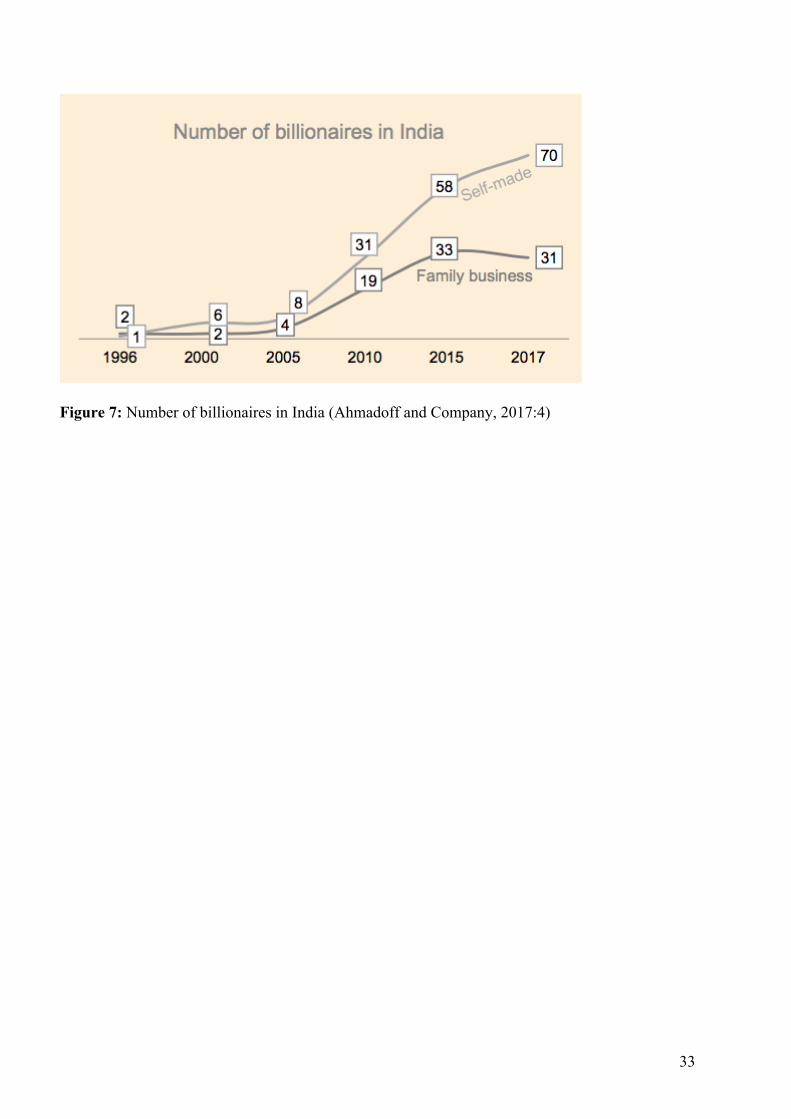
Another factor indicative of increasing mobilisation of the entrepreneur is the number of billionaires in
India. As the entrepreneur takes on the rewards of entrepreneur activity, liberalisation enables them to
acquire significant financial gains. In the mid 1990s, there were only two billionaires with a combined
wealth of $3.2 billion. However, by 2012, there were 46 with a net worth of $176.3bn (Biswas, 2012).
In addition, a large proportion of these are self-made billionaires suggestive of entrepreneurial mobility,
as displayed in Figure 7 (Ahmadoff and Company, 2017:4).
33
Figure 7: Number of billionaires in India (Ahmadoff and Company, 2017:4)

34
4.3 Individual attitudes change
Increasingly links between culture and economic performance have been emphasised by scholars
(Inglehart, 1997). As discussed in section 3.1.3, this section will evaluate changes in individual
attitudes following 1991 liberalisation reforms in India across three areas; attitudes to female
employment, attitudes to work, and attitudes to saving. These value areas were selected as each has
been evidenced by previous scholars to link to increased economic growth and productivity at the
aggregate level. Using WVS data, changes in cultural values will be assessed from the early 1990s to
the early 2000s.
4.3.1 Attitudes to female employment
As discussed in section 3.1.3, gender egalitarian values, and a positive attitude towards women in
employment have been linked to economic growth at the macro level (Ghani et al., 2016). The WVS
features several questions that are indicative of societal gender attitudes and female employment. For
the questions assessed here, respondents were asked the extent to which they agreed with a statement.
The following questions were analysed: ‘When jobs are scarce, men should have more of a right to a job
than women’ (Figure 8), ‘Both the husband and wife should contribute to household income’ (Figure 9),
and ‘Being a housewife is just as fulfilling as working for pay' (Figure 10).
Perhaps surprisingly, responses evidence a decline in gender egalitarian values. In the instance of both
the husband and wife contributing to household income, there is a decline in those who ‘agree’ from
48% in 1989-93 to 41% in 1999-2004. In addition, those who ‘strongly agree’ only increases from 32%
in 1989-93 to 36% in 1999-2004. The question of whether being a housewife is considered as fulfilling
as working for pay received a consecutive increase in those who ‘agree strongly’, from 11% in 1989-93
to 22% in 1999-2004. Those who ‘disagree’ or ‘strongly disagree’ declined significantly over the
waves. In the statement regarding men having more right to a job than women when jobs are scarce,
those who ‘agree’ increased from 48% in 1989-93 to 51% in 1999-2004 and those who ‘disagree’

35
declined from 45% to 28% over the same period. These apparently contradictory findings exemplify
the need for a micro level gendered analysis of the impacts of liberalisation, to determine why
expectations of the market reducing discrimination and enhancing gender egalitarian values is not
evidenced. Furthermore, it demonstrates the need for policy to specifically target these attitudes, and
resultant labour force discrimination.
Figure 8 (WVS, 1990;1995;2001)

36
Figure 9 (WVS, 1990;1995;2001)
Figure 10 (WVS, 1990;1995;2001)

37
4.3.2 Attitudes to work
As discussed in section 3.1.3, attitudes to work can be linked to growth, with the dignity of labour and
hard work affecting labour productivity and TFP, and thus economic growth (McCartney, 2015:250).
The following WVS questions were analysed, implicating attitudes towards work: ‘Important in life:
work’ (Figure 11), ‘Important in a job: that you can achieve something’ (Figure 12), and ‘Important
child qualities: hard work’ (Figure 13). Response type varied, with some asking respondents the extent
to which a factor was important, and others assessing whether a respondent ‘mentioned’ a factor or not.
Responses were indicative of the value of hard work becoming an increasingly prominent factor in
people’s lives. Work as a ‘very important’ factor in people’s lives declined from 86% in 1989-93 to
76% in 1999-04. As a ‘rather important’ factor however, it increased from 12-18% over the same
period. The proportion of respondents who ‘mentioned’ hard work as an important quality in children
increased from 67% in 1989-93 to 85% in 1999-04. Furthermore, the proportion of respondents who
‘mentioned’ the opportunity to achieve something in your job as important increased from 61% in 1989-
1993 to 69% in 1999-04. These findings evidence a shift towards survival, self-interest values, noted by
Inglehart et al. (2004) as prevalent in high income countries. The shifting predominance of work and
individual gain as important values in society can be partially attributed to liberalisation, and the
changing structure of incentives for firms and individuals, leading to the importance of market seeking
behaviour to maximise individual gains.

38
Figure 11 (WVS, 1990;1995;2001)
Figure 12 (WVS, 1990;1995;2001)
Figure 13 (WVS, 1990;1995;2001)

39
4.3.3 Attitudes to saving
Attitudes to saving can be linked to economic growth due to the tendency to save increasing the pool of
resources available for investment (McCartney, 2015:250). One question in the WVS that is indicative
of attitudes to saving is ‘Important child qualities: thrift saving money and things’, displayed in Figure
14. Over the three time periods, thrift mentioned as an ‘important’ quality increases from 24% in 1989-
93 to 62% in 1999-04. This distinct increase in thrift as an important value could be presumed
indicative of higher saving among individuals, potentially facilitating future growth. However, it can
also be considered an individual response to the increasing prevalence of the market, and declining
supportive role of the state. Furthermore, as discussed in section 3.1.2, the process of creative
destruction leads to areas of ‘destruction’, thus potential unemployment may increasingly incite the
importance of individuals to save.
Figure 14 (WVS, 1990;1995;2001)

40
5. Conclusions
This section will firstly outline the key findings of this paper, before responding to the initial inquiry of
the extent to which 1991 liberalisation reforms facilitated the growth boom in 2003. It will then discuss
limitations of the study and suggestions for further research.
Section 4.1 assessed changes in how corporates do business. Transaction cost economics predicts a
move towards a market economy will narrow the boundaries of a firm and lead to greater consolidation
(Aggarwal, 2003). Findings in section 4.1.1 align to this expectation, with corporate houses including
Birla and Tata restructuring to enhance consolidation of management and production. Corporates were
also found to increasingly shift to market seeking behaviour, enhancing productivity, innovation, and
cost efficiency; intending to improve their competitive standing. Thus, there is extensive evidence that
liberalisation reforms instigated changes in the functioning, management and strategy of corporates.
The increasing mobility of FP (land, labour, capital, entrepreneur) was assessed in section 4.2. As
Onyemelukwe (2016) attests, to ensure maximum growth FP must be increasingly mobile. Findings
provided conflicting results. Capital and entrepreneur both demonstrated enhanced mobility, with a
growing venture capital industry, and greater corporate churning among the top twenty businesses in
India after 1991. However, land and labour proved contradictory to predictions. Labour discrimination
along the lines of caste and gender failed to evidence a significant decline, with female LFPR
paradoxically declining in 1999/00 and 2004/05 (Bhalla and Kaur, 2011:7). Furthermore, the mobility
of land became increasingly constrained, with businesses facing substantial difficulties in its successful
acquisition through the market. It is evident that limitations in the mobility of labour and land hinders
economic growth, for example, McKinsey (2001:4) states that land market distortions account for close
to 1.3% of lost GDP growth per annum.

41
Shifting individual attitudes were assessed in section 4.3. It was found that the value of hard work and
thrift increased in the 1990s, and achievement became an increasingly important value. This can be
determined as evidence of shifting normative values more inclined to economic growth. However,
attitudes towards women in work were found to regress. This opposes successful examples of
economic growth, such as contemporary Bangladesh and Sri Lanka, in which an increasing shift
towards female employment outside the household has been instrumental to their growth stories. This
may be conceived as an explanatory factor for stagnant female LFPR evidenced in section 4.2.1.
I will now address the initial inquiry, looking at the extent to which changes in the Indian economy
induced by liberalisation reforms in 1991 facilitated the growth boom in 2003. In doing so, it is useful
to firstly outline the boom’s proximate causes, before assessing how micro level changes identified in
section 4 contributed to this growth. Nagaraj (2008:55) attributes the boom to three factors: an
industrial recovery, a sustained growth in service, and increasing exports during a boom in world trade.
The industrial recovery, led by capital goods, is evidenced in the manufacturing growth rates of 8.8%
between 2002-03 and 2006-07, comparable to 5.6% in the previous 5 years (Nagaraj, 2008:56). Over
this period, Nagaraj (2008) states that private corporate profitability also improved. Linking this to the
findings in this paper, it can be conceived that the industrial pick up was determined by a decade of
restructuring and alterations among Indian firms to improve their competitiveness. Evidenced in section
4.1, improvements to cost efficiency, innovation and increasing rates of M&A, will all have contributed
to the proceeding competitive strength of the sector when faced with the benign global environment in
2003 (Nagaraj, 2013). In addition, increasing mobility of entrepreneurs, evidenced in section 4.2.3 will
have further initiated this recovery with innovation leading to output growth.
42
The sustained growth in services has been led by increases in communications and business services,
both witnessing an upsurge in growth in the 2000s; with the growth rate of telephone services
increasing from 8% in 1992-93, to 18.8% in 2006-07, and business services from 13% in 1992-93 to
23.3% in 2006-07 (Nagaraj, 2008:56). Specific findings in section 4 contribute to an explanation. The
increasing mobility of entrepreneur and capital facilitated the initiation and growth of IT firms such as
Infosys. These sought to focus on their comparative advantage, mobilising low-cost engineering skills
to produce software services for export which aligned to the communications ‘revolution’ at the time, in
which the US liberalised rules for outsourcing (Nagaraj, 2008). Shifts in individual attitudes valuing
hard work and innovation, evidenced in section 4.3.2, will have contributed to this phenomenal growth.
Findings in this paper hold noteworthy implications for the debate on India’s growth trajectory. It
evidences substantial changes initiated by the reforms at the micro level of the economy; across
corporates, FP, and individuals. It then demonstrates the ways in which these changes have contributed
to the lagged effect of growth, manifest in 2003. Whilst this paper argues that the 1991 reforms led to a
lagged effect of growth, thus disputing the argument that liberalisation did not lead to growth, it also
contends that the market has its limits in initiating the changes needed to ensue growth and productivity,
and thus tailored analysis and policy must be utilised. For example, the negligible change in attitudes
towards women in work and female LFPR evidence that initiating a market economy is not enough to
redirect labour inputs to their most efficient and productive use. Going forward, it is crucial to apply a
gendered frame to the analysis of economic activity, and develop policy accordingly to counteract these
gender market distortions, such as reforming women’s rights to property (Palmer, 2001). Furthermore,
in seeking to address land market distortions and further facilitate growth, policies should be directly
targeted to enhance its mobility; inclusive of improving transparency of transfer, clarifying ownership,
and consolidating landholdings (McKinsey, 2001).

43
This study evidences the necessity of going beyond an aggregate analysis of the economy to provide an
understanding of whether liberalisation leads to economic growth, and if so through what channels. In
doing so, this paper contributes to wider debates about liberalisation and growth. For example, after
2008 dominant ideas were that excessive liberalisation and under-regulation of financial markets led to
the global economic crash and subsequent recession, which would similarly benefit from a micro level
analysis.
5.1 Limitations
One limitation of this study is that it has taken the assumption of a one-way process between the
initiation of liberalisation and changes in the three factors outlined in section 3.1. In reality this
relationship is more complex, with these factors being both a cause and effect of growth and freer
markets. For example, regarding individual attitudes, it can be noted that Weber (1992) argued that the
culture of Protestantism provided an ideal environment for capitalism to flourish, whereas in this study I
have assessed whether liberalisation has induced changes to cultural values that have later facilitated
economic growth. Thus, a further research agenda could be to explore the complex relationship
between liberalisation and these factors in greater depth. Another limitation of this study is that I do not
quantify how much each delineated change instigated by liberalisation at the micro-level contributed to
growth in 2003. Thus, a potential area of further research would be to quantify the contribution of each
factor to facilitating 2003 growth, inclusive of those highlighted in this paper, and others such as the
boom in world trade; and assess the comparable contributions to the resultant boom.
Word count: 9,997

44
6. References Cited
Acemoglu, D., Johnson, S. and Robinson J.A. (2005) ‘Institutions as a Fundamental Cause of Long-Run Growth’, In: Aghion, P. and Durlauf, S.N. (eds.) Handbook of Economic Growth 1A, Amsterdam; Boston: Elsevier, pgs. 386-472
Aggarwal, R. (2003) ‘Business Strategy and Corporate Restructuring in India: The Mutually Reinforcing Impacts of Economic Liberalization and Technology’, In: Richter, F.J. and Banerjee P. (eds.) The Knowledge Economy in India, Palgrave Macmillan: London, pgs. 178-196
Ahluwalia, M.S. (2002) ‘Economic Reforms in India since 1991: Has Gradualism Worked?’ Journal of Economic Perspectives, 16(3), pgs. 67-88
Ahmadoff and Company (2017) ‘Private Wealth in Modern India, Entrepreneurship at Heart’, Amadoff and Company resources, April 2017, Available at: http://ahmadoff.com/resources/docs/Private_Wealth_in_Modern_India.pdf (Accessed: 30/09/17)
Alfaro, L. and Chari, A. (2010) ‘India Transformed? Insights from the Firm Level 1988-2007’, Brookings India Policy Forum Journal 6, pgs. 155-228
Alfaro, L. and Chari, A. (2013) ‘Reforms and the Competition Environment’, In: Bhagwati, J. and Panagariya, A. (eds.) Reforms and Economic Transformation in India, New Delhi: Oxford University Press, pgs. 200-226
Anand, M. and Singh, K. (2006) ‘Reinventing the giant corporation: The case of Tata Steel – diagnosis’, Vikalpa Journal for Decision Makers, 31(3), pgs. 138-142, Available at: http://ssrn.com/abstract=936037 (Accessed: 30/09/17)
Becker, G. S. (1957) The Economics of Discrimination, Chicago: Chicago University Press
Beena, P. (2004) ‘Towards understanding the merger-wave in the Indian corporate sector: A comparative perspective’, IDEAS Working Paper Series from RePEc, WP No. 355
Bhagwati, J and Panagariya, A. (2013b) Why Growth Matters: How Economic Growth in India Reduced Poverty and the Lessons for Other Developing Countries, New York: Public Affairs
Bhagwati, J. (1993) India in transition: Freeing the economy, Oxford: Clarendon Press
Bhagwati, J. and Panagariya, A. (2013a) Reforms and Economic Transformation in India, New Delhi: Oxford University Press
Bhalla, S. and Kaur, R. (2011) Labour force participation of women in India: some facts, some queries, WP No. 40, Asia Research Centre, London: London School of Economics and Political Science
Biswas, S. (2012) ‘India’s billionaires and the wealth of the nation’, BBC News, October 12 2012, Available at: http://www.bbc.co.uk/news/world-asia-india-19921501 (Accessed: 30/09/17)
Bose, K. (1996) ‘Indian Aluminium Group Sees Bright Future’, Financial Times, January 4 1996, pg.21

45
Chaudhuri, S. (2002) ‘Economic Reforms and Industrial Structure in India’, Economic and Political Weekly, 37(2), pgs. 155-162
Corbridge, S, Hariss, J. and Jeffrey, C. (2013) India Today: Economy, Politics and Society, Cambridge: Polity
Crook, C. (1991) ‘A Survey of India’, The Economist, May 4 1991, pgs.1-18
D'Costa, A (2000) ‘Capitalist Maturity and Responses to Liberalisation', Contemporary South Asia, 9(2), pgs.141-63
D’Costa, A. and Chakraborty, A. (2017) The Land Question in India: State, Dispossession and Capitalist Transition, Oxford: Oxford University Press
Dasgupta, A. (2005) ‘Agrarian Reforms in West Bengal since 1977: A Closer Look at Actual Facts’ Mimeographed paper, University of California, Riverside: Riverside CA
Dossani, R. and Kenney, M. (2002) ‘Creating an Environment for Venture Capital in India’, World Development, 30(2), pgs. 227-253
Duranton, G., Ghani, E., Goswami, A.G. and Kerr, W. (2015) ‘Effects of Land Misallocation on Capital Allocations in India’, World Bank Working Paper 7451, Washington DC: World Bank
Durkheim, E. (1993) The Division of Labour in Society, New York: The Free Press
Fortin, N. M. (2005) ‘Gender role attitudes and the labour-market outcomes of women across OECD countries’, Oxford Review of Economic Policy, 21(3), pgs. 416-438
Fukuyama, F. (2001) ‘Culture and Economic Development: Cultural Concerns’, International Encyclopedia of the Social and Behavioral Sciences, pgs. 3130-3134
Ghani, E., Goswami, A.G., Kerr, S. and Kerr, W. (2016) ‘Will market competition trump gender discrimination in India?’, Policy Research Working Paper Series 7814, World Bank Group, Washington DC: World Bank
Ghatak, M. and Ghosh, P. (2011) ‘The Land Acquisition Bill: A Critique and a Proposal’, Economic and Political Weekly, 46(41), pgs. 65-72
Ghosh, S. (2006). Did financial liberalization ease financing constraints? Evidence from Indian firm level data, Emerging Markets Review, 7, pgs.176-190
Goldberg, P., Khandelwal, A. and Pavcnik, N. (2013) ‘Variety In, Variety Out: imported Input and Product Scope Expansion in India’, In: Bhagwati, J. and Panagariya, A. (eds.) Reforms and Economic Transformation in India, New Delhi: Oxford University Press, pgs.168-199
Goldberg, P., Khandelwal, A., Pavcnik, N. and Topalova, P. (2009), ‘Trade Liberalization and Imported Inputs’, American Economic Review, 99(2), pgs. 494-500.
Government of India (2001) Economic Survey 2000-2001, New Delhi: Ministry of Finance, Available at: http://indiabudget.nic.in/es2001-02/welcome.html (Accessed: 30/09/17)
Guha, K. (1998a) ‘Upheaval in private sector’, Financial Times, October 26 1998, pg.V

46
Guha, K. (1998b) ‘Corporate shock-waves’, Financial Times, April 28 1998, pg.34
Guha, K. (1998c) ‘A painful revolution is gathering pace’, Financial Times, April 28 1998, pg.34
Hart, C. (2010) Doing a Literature Review: Releasing the Social Science Imagination, Oxford: Sage Publications
Heller, M.G. (2009) Capitalism, Institutions and Economic Development, London: Routledge
Humphrey, J. (1985) ‘Gender, pay and skill: manual workers in Brazilian industry’, In: Afshar, H. (eds.) Women, Work and Ideology in the Third World, London: Tavistock, pgs. 214-231
Inglehart, R. (1997) Modernization and Postmodernization: Cultural, Economic and Political Change in 43 Societies, Princeton: Princeton University Press
Inglehart, R., Basáñez, M., Díez-Medrano, J., Halman, L. and Luijkx, R. (2004) Human Beliefs and Values. A Cross-cultural Sourcebook Based on the 1999–2002 Values Surveys. Mexico: L Siglo XXI Editores
Jenkins, R. (1999) Democratic Politics and Economic Reform in India, Cambridge: Cambridge University Press
Joshi, V. and Little, I.M.D. (1994) India: Macroeconomics and Political Economy:1961– 91, World Bank Comparative Macroeconomic Studies, Washington DC: The World Bank
Khandwalla, P. N. (2002) ‘Effective Organisational Response by Corporates to India’s Liberalisation and Globalisation’, Asia Pacific Journal of Management, 19(2–3), pgs.423–448
Khanna, T. and Palepu, K. (2000) ‘Is Group Affiliation Profitable in Emerging Markets? An Analysis of Diversified Indian Groups’, Journal of Finance, 55(2), pgs. 867-981
Kohli, A (2006a), ‘Politics of Economic Growth in India, 1980-2005, Part I: The 1980s’, Economic and Political Weekly, 41(13), pgs. 1251-1259
Kohli, A. (2006b) ‘Politics of Economic Growth in India, 1980-2005, Part II: The 1990s and Beyond’, Economic and Political Weekly, 41(14), pgs.1361-1370
Kotwal, A., Ramaswami, B. and Wadhwa, W. (2011) ‘Economic Liberalization and Indian Economic Growth: What's the Evidence’, Journal of Economic Literature, 49(4), pgs.1152-1199
Kumar, N., Mohapatra, P.K. and Chandrasekhar, S. (2009) India's global powerhouses: how they are taking on the world, London: Harvard Business Press; McGraw-Hill
Levien, M. (2015) From primitive accumulation to regimes of dispossession: Six theses on India's land question, Economic and Political Weekly, 50 (22), pg.146-157
Lobo, L. and Kumar, K. (2009) Land acquisition, displacement and resettlement in Gujarat: 1947-2004, Delhi: Sage Publications
Marshall, A. (1890) Principles of Economics, London: Macmillan

47
McCartney, M. (2010) India: Political Economy, Growth and Liberalisation, 1991-2008, London: Routledge
McCartney, M. (2015) Economic Growth and Development: A Comparative Introduction, Basingstoke: Palgrave Macmillan
McKinsey (2001) India: The Growth Imperative, McKinsey, McKinsey Global Institute, October, Available at: https://www.mckinsey.com/global-themes/india/growth-imperative-for-india (Accessed: 30/09/17)
Merchant, K. (2001) ‘Domestic companies lead M&A surge in India’, Financial Times, February 15 2001, pg.12
Nagaraj, R. (2008), ‘India’s Recent Economic Growth: A Closer Look’, Economic and Political Weekly, 43(15), pgs. 55-61
Nagaraj, R. (2013) ‘India’s Dream Run, 2003-08: Understanding the Boom and its Aftermath’, Economic and Political Weekly, 48(20), pgs.38-51
North, D. (1990) Institutions, Institutional Change and Economic Performance, Cambridge: Cambridge University Press
NSSO (1983) India Employment and Unemployment Survey, January to December 1983, NSS 38th Round, Ministry of Statistics and Programme Implementation, http://164.100.34.62/index.php/catalog/38 (Accessed: 03/10/17)
NSSO (1993) India Employment and Unemployment Survey, January 1993 to June 1994, NSS 50th Round, Ministry of Statistics and Programme Implementation, Available at: http://164.100.34.62/index.php/catalog/44 (Accessed: 03/10/17)
NSSO (2009) India Employment and Unemployment Survey, July 2009 to June 2010, NSS 66th Round, Ministry of Statistics and Programme Implementation, Available at: http://164.100.34.62/index.php/catalog/18 (Accessed: 03/10/17)
Okada, A. (2009) ‘Institutional Change and Industrial Development: The Experience of the Indian Automobile Industry’, In: Kumar, R. and Patibandla, M. (eds.) Institutional Dynamics and the Evolution of the Indian Economy, New York: Palgrave Macmillan, pgs. 83-113
Onyemelukwe, C.C. (2016) The science of economic development and growth: the theory of factor proportions, London: Routledge
Palmer, I. (1991) Gender and Population in the Adjustment of African Economies: Planning for Change, Geneva: ILO
Panagariya, A. (2004) ‘India in the 1980s and 1990s: A Triumph of Reforms’, Working Paper 04/43, International Monetary Fund, Washington DC: IMF
Panagariya, A. (2008) India: The Emerging Giant, Oxford: Oxford University Press
Pandit, V. (1995) ‘Macroeconomic Character of the Indian Economy: Theories, Facts and Fancies’, In: Patnaik, P. (eds.) Macroeconomics, Delhi: Oxford University Press

48
Papola, T.S. (2012) ‘Social Exclusion and Discrimination in the Labour Market’, Working Paper No. 2012/04, Institute for Studies in Industrial Development, New Delhi
PUCL (2006) ‘Police Firing at Kalinganagar’, PUCL Bulletin, April 2006, Available at: http://www.pucl.org/Topics/Dalit-tribal/2006/kalinganagar.htm (Accessed: 30/09/17)
PUDR (1997) ‘Gopalpur: steel plant, displacement and people’s struggle’, People’s Union for Democratic Rights, Delhi, May 1997 Available at: http://www.unipune.ac.in/snc/cssh/HumanRights/05%20STATE%20AGRICULTURE%20FOREST%20DALITS%20AND%20TRIBALS/24.pdf (Accessed: 30/09/17)
Richter, F. and Banerjee, P. (2003) The knowledge economy in India, Basingstoke: Palgrave Macmillan
Rodrik and Subramanian (2005) ‘From ‘Hindu Growth’ to Productivity Surge: The Mystery of the Indian Growth Transition’, IMF Staff Papers, 52(2), pgs.192-236
Sarkar, J. (2012) ‘Business Groups in India’, In: Colpan, A.M., Hikino, T. and Lincoln, J.R (eds.) The Oxford handbook of business groups, New York: Oxford University Press, pgs. 294-324
Schumpeter, J. (1942) Capitalism, Socialism, and Democracy, New York: Harper and Brothers
Srinivasan, T.N. (2003) ‘Indian Economic Reforms: A Stocktaking’, Working Paper No. 190, Stanford Centre for International Development, Working Paper No. 190
Srivastava, U.K. and Srivastava, P. (2012) Management Consulting in India: Practice and Experiences for Business Excellence, Los Angeles; London: SAGE
Subramanian, A. (2007) ‘The Evolution of Institutions in India and its Relationship with Economic Growth’, Oxford Review of Economic Policy, 23(2), pgs.196-220
Sud, N. (2014) Governing India’s Land, World Development, 60, pgs. 43-56
Topalova, P.B. and Khandelwal, A. (2011) ‘Trade liberalization and firm productivity: The case of India’, Review of Economics and Statistics, 93, pgs. 995–1009
Varshney, A. (1999) ‘Mass Politics or Elite Politics? India’s Economic Reforms in Comparative Perspective’, In: Sachs, J., Varshney, A., and Bajpai, N. (eds.) India in the era of economic reforms, New Delhi: Oxford University Press, pgs. 222–60.
Virmani, A. (2005) ‘Policy Regimes, Growth and Poverty in India: Lessons of Government Failure and Entrepreneurial Success’, ICRIER, Working Paper No. 170, New Delhi
Virmani, A. and Hashim, D.A. (2011) ‘J-Curve of Productivity and Growth: Indian Manufacturing Post-Liberalization’, Working Paper 11/163, International Monetary Fund, Washington DC: IMF
Weber, M. (1992) (1930) The Protestant Ethic and the Spirit of Capitalism, London: Routledge
Weniger, M. P. (2012) Work values and economic growth (Doctoral dissertation), ProQuest Dissertations Publishing, Available from: ProQuest Digital Dissertations and Theses database (UMI No. 928144044)
Witzel, M. (2010) Tata: the evolution of a corporate brand, New Delhi: Penguin Portfolio

49
World Bank (2014) Doing Business 2015: Going Beyond Efficiency, Washington, DC: World Bank, Available at: http://www.doingbusiness.org/~/media/WBG/DoingBusiness/Documents/Annual-Reports/English/DB15-Full-Report.pdf (Accessed: 30/09/17)
World Bank (2017) World Bank national accounts data: GDP growth (annual %), World Bank, Available at: https://data.worldbank.org/indicator/NY.GDP.MKTP.KD.ZG?contextual=default&end=2008&locations=IN&start=1980&view=chart (Accessed: 04/10/17)
WVS (1990) ‘World Values Survey Wave 2 1990-1994: India 1990’, World Values Survey Association, Available at: http://www.worldvaluessurvey.org/WVSDocumentationWV2.jsp (Accessed: 30/09/17)
WVS (1995) ‘World Values Survey Wave 3 1995-1998: India 1995’, World Values Survey Association, Available at: http://www.worldvaluessurvey.org/WVSDocumentationWV3.jsp (Accessed: 30/09/17)
WVS (2001) ‘World Values Survey Wave 4 1999-2004: India 2001’, World Values Survey Association, Available at: http://www.worldvaluessurvey.org/WVSDocumentationWV4.jsp (Accessed: 30/09/17)
WVS (2017) ‘Values change the world: World Values Survey’, Available at: https://www.iffs.se/media/1931/wvs-brochure-web.pdf (Accessed: 30/09/17)
Yin, R.K. (2009) Case study research: design and methods, London: Sage