robertson, fitzpatrick, park, and iragavarapu 1docs.trb.org/prp/14-0838.pdf · robertson,...
TRANSCRIPT

Robertson, Fitzpatrick, Park, and Iragavarapu 1
Determining Level of Service on Freeways and Multilane Highways with Higher Speeds 1
2
By 3
4
James Robertson 5
(Corresponding author) 6
Assistant Transportation Researcher 7
Texas A&M Transportation Institute, 3135 TAMU 8
College Station, TX 77843-3135 9
phone: 979/845/9896 10
email: [email protected] 11
12
Kay Fitzpatrick, Ph.D., P.E. 13
Senior Research Engineer 14
Texas A&M Transportation Institute, 3135 TAMU 15
College Station, TX 77843-3135 16
phone: 979/845-7321, fax: 979/845-6006 17
email: [email protected] 18
19
Eun Sug Park, Ph.D. 20
Research Scientist 21
Texas A&M Transportation Institute 22
College Station, TX 77843-3135 23
phone: 979/845-9942, fax: 979/845-6008 24
email: [email protected] 25
26
and 27
28
Vichika Iragavarapu, P.E. 29
Assistant Research Engineer 30
Texas A&M Transportation Institute, 3135 TAMU 31
College Station, TX 77843-3135 32
phone: 979/845-7321, fax: 979/845-6006 33
email: [email protected] 34
35
For the TRB 2014 Annual Meeting 36
37
To AHB40 Call for Papers: 38
Innovative Applications of the HCM 2010 Methodologies 39
40
Revision date: November 11, 2013 41
Total Words: 6,808 [3,308 Words, 14 Tables & Figures (3,500)] 42
43
TRB 2014 Annual Meeting Paper revised from original submittal.

Robertson, Fitzpatrick, Park, and Iragavarapu 2
ABSTRACT 1
The Highway Capacity Manual provides a means for evaluating level of service on freeways, 2
highways, and urban streets. Presently, the Highway Capacity Manual methodology is not able 3
to evaluate level of service on freeways with free-flow speeds greater than 75 mi/h or multilane 4
highways with free-flow speeds greater than 60 mi/h; and, since the repeal of the national 5
maximum speed limit, many states now have facilities with posted speed limits that exceed these 6
free-flow speeds. Recent research, conducted by the Texas A&M Transportation Institute (TTI), 7
developed speed prediction equations for uninterrupted flow facilities with higher posted speed 8
limits. From these equations, this paper develops procedures for calculating free-flow speed on 9
facilities with higher posted speed limits and develops methods for estimating level of service on 10
freeways with free-flow speeds up to 85 mi/h and multilane highways with free-flow speeds up 11
to 80 mi/h. For freeways, the authors recommend utilizing the TTI speed prediction equations to 12
calculate free-flow speed, and using the calculated free-flow speeds to determine level of service 13
from speed-flow curves developed within this paper. For multilane highways, the authors 14
recommend utilizing the TTI speed prediction equations to calculate base free-flow speed 15
(BFFS), which is part of the equation for calculating free-flow speed; and then using the 16
calculated free-flow speed to determine level of service from speed-flow curves developed 17
within this paper. To aid practitioners, the authors provide step-by-step procedures for applying 18
the TTI speed prediction equations within the Highway Capacity Manual methodology. 19
20
INTRODUCTION 21
Since the repeal of the national maximum speed limit, many states have increased posted speed 22
limits to values that exceed those used to estimate level of service on freeways and multilane 23
highways within the 2010 Highway Capacity Manual (HCM) (1). For example, in 2012, the 24
state of Texas had posted speed limits of 80 mi/h on freeways and posted speed limits of 75 mi/h 25
on multilane highways. Presently, the HCM does not have a methodology for evaluating level of 26
service on freeways with free-flow speeds greater than 75 mi/h or multilane highways with free-27
flow speeds greater than 60 mi/h. As state legislatures continue increasing posted speed limits, 28
the profession would benefit from a procedure for evaluating level of service on facilities with 29
higher free-flow speeds. 30
31
Recent research conducted by The Texas A&M Transportation Institute (TTI) for the Texas 32
Department of Transportation developed speed prediction equations for freeways with posted 33
speed limits up to 80 mi/h and multilane highways with posted speed limits up to 75 mi/h (2). 34
With these equations, this paper develops procedures for calculating free-flow speed on freeways 35
and multilane highways, and uses these procedures to propose methodologies for estimating 36
level of service on these facilities. For freeways, the authors recommend utilizing the TTI speed 37
prediction equation to calculate mean free-flow speed, and then estimating level of service from 38
speed-flow curves developed within this paper. For multilane highways, the authors recommend 39
utilizing the TTI speed prediction equation to calculate base free-flow speed (BFFS) and from 40
TRB 2014 Annual Meeting Paper revised from original submittal.

Robertson, Fitzpatrick, Park, and Iragavarapu 3
the calculaed BFFS, calculating free-flow speed. Then, from the calculated free-flow speed, 1
estimating level of service for the facility with the speed-flow curves developed within this 2
paper. 3
4
BACKGROUND 5
When free-flow speed data are not available, the Highway Capacity Manual procedure provides 6
equations for calculating the free-flow speed on these facilities given certain roadway 7
characteristics (1). With these calculated free-flow speeds, analysts then select a speed-flow 8
curve to use when determining level of service. For freeways and multilane highways, Level of 9
service is determined from the density thresholds shown in Table 1. 10
11
Table 1. Level of Service Density Thresholds 12
for Freeways and Multilane Highways (1). 13
Level of Service Freeway’s
Density (pc/mi/ln)
Multilane Highway’s
Density (pc/mi/ln)
LOS A ≤ 11 to 11 ≤ 11
LOS B > 11 to 18 > 11 to 18
LOS C > 18 to 26 > 18 to 26
LOS D > 26 to 35 > 26 to 35
LOS E > 35 to 45
> 35 to 40, for FFS of 80 to 60 mi/h
> 35 to 41, for FFS of 55 mi/h bbbb
> 35 to 43, for FFS of 50 mi/h bbbb
> 35 to 45, for FFS of 45 mi/h bbbb
LOS F > 45 to 11
> 40, for FFS of 80 to 60 mi/h
> 41, for FFS of 55 mi/h bbbb
> 43, for FFS of 50 mi/h bbbb
> 45, for FFS of 45 mi/h bbbb
FFS = free-flow speed
14
A limitation of the 2010 Highway Capacity Manual methodology is a lack of free-flow speed 15
curves for freeways with free-flow speeds greater than 75 mi/h and multilane highways with 16
free-flow speeds greater than 60 mi/h. For states with higher free-flow speeds and posted speed 17
limits, such as Texas and other western states, a method for estimating level of service on 18
facilities with higher speeds would increase the usefulness of the HCM methodology for 19
freeways and multilane highways. 20
21
DATA COLLECTION 22
The focus of this paper is the development and use of the speed prediction equations within the 23
2010 Highway Capacity Manual methodology. To explore the relationship between geometric 24
design and operating speed, the Texas Department of Transportation sponsored the collection of 25
free-flow speed data on freeways and multilane highways within the state of Texas. TTI 26
researchers used data from 22 sites (44 approaches) to produce speed prediction equations on 27
freeways and data from 18 sites (26 approaches) to produce speed prediction equations for 28
multilane highways. Speed data were collected using Texas Department of Transportation 29
Weigh-In-Motion (WIM) sites and portable SmartSensor HD Radar Units (3). The distribution 30
TRB 2014 Annual Meeting Paper revised from original submittal.

Robertson, Fitzpatrick, Park, and Iragavarapu 4
of the approaches by posted speed limit and data collection method (Radar or WIM) are provided 1
in Table 2. 2
3
Table 2. Number of Approaches by Facility Type and 4
Data Collection Method (Radar or WIM). 5
Posted Speed Limit (mi/h) Freeways Multilane
Highways Total
Car
Day
Car
Night
Truck
Day
Truck
Night Radar WIM Total Radar WIM Total All
65 65 65 65 - - - 04 00 04 4
70 65 70 65 06 14 20 10 16 26 46
75 65 70 65 06 02 08 06 00 06 14
80 65 70 65 12 04 16 - - - 16
Total 24 20 44 20 16 36 80
- = not a common or not an available posted speed limit combination for the given facility type.
Radar = SmartSensor HD Radar Unit Data.
WIM = Weigh-In-Motion Data.
6
Speed Data 7
Researchers obtained individual truck speed data using WIM sensors and portable radar. A 8
limitation of the WIM data is that these data only contains individual speed-readings for trucks 9
and total hourly volume for passenger vehicles and trucks. This means researchers could 10
determine truck free-flow speed and percent trucks at the WIM sites, but researchers were unable 11
to evaluate individual passenger vehicle speeds at WIM sites. To determine individual passenger 12
vehicle speed data, researchers used portable radar units. For data collected using the radar units, 13
researchers classified vehicles with a length less than 40 ft as passenger cars and vehicles with a 14
length greater than 40 ft as trucks. 15
16
In total, the data set contained more than 500,000 individual radar vehicle speeds (trucks and 17
passenger vehicles) and more than 9,700,000 individual WIM truck speeds. For each approach, 18
researchers binned the speed-readings into 1-hour blocks by lane to determine 85th
percentile 19
speeds by time of day and approach. The process of binning the data resulted in approximately 20
2,112 rows of data for determining a speed prediction equation for freeways and 1,728 rows of 21
data for determining a speed prediction equation for multilane highways. 22
23
Individual speed-readings were not included within the final data set if: 24
The vehicle was traveling less than 40 mi/h and greater than 120 mi/h. 25
The vehicle was recorded during dawn (30 minutes before or after sunrise) or dusk (30 26
minutes before or after sunset). 27
The vehicle had a recorded length less than 5 ft or greater than 120 ft. 28
The vehicle was not traveling in a free-flow condition (at Radar sites only). This study 29
defined free flow as a headway of 5 seconds or greater and a tailway of 3 seconds or 30
TRB 2014 Annual Meeting Paper revised from original submittal.

Robertson, Fitzpatrick, Park, and Iragavarapu 5
greater for vehicles traveling in the same travel lane. At WIM sites, researchers were 1
unable to determine if trucks were traveling in a free-flow condition because passenger 2
car data were unavailable. 3
4
Summary Statistics for the speed and traffic data by light condition, facility type, and data 5
collection method are provided in Table 3. 6
7
Table 3. Traffic Characteristics by Light Condition and Facility Type. 8
Light
Condition Variable
Freeways Multilane Highways
Radarc WIM
d Both
e Radar
c WIM
d Both
e
Day
Average Volume (veh/h) a 387 586 446 387 360 379
SD Volume (veh/h) a,b
178 297 237 202 150 188
Minimum Volume (veh/h) 142 149 142 53 106 53
Maximum Volume (veh/h) 809 1092 1092 774 589 774
Average % Trucks (%) 39 30 37 16 26 19
SD % Trucks (%) 9 11 11 7 5 8
Minimum % Trucks (%) 26 14 14 5 17 5
Maximum % Trucks (%) 59 49 59 40 35 40
Night
Average Volume (veh/h) 184 245 202 174 148 166
SD Volume (veh/h) 85 138 107 120 74 109
Minimum Volume (veh/h) 70 66 66 22 32 22
Maximum Volume (veh/h) 401 602 602 505 339 505
Average % Trucks (%) 56 41 51 23 37 27
SD % Trucks (%) 10 14 13 14 9 14
Minimum % Trucks (%) 26 16 16 1 22 1
Maximum % Trucks (%) 76 62 76 56 53 56 aVolume = the volumes given are directional volumes (veh/h).
bSD = standard deviation.
cRadar = passenger car and truck speed data collected using portable radar.
dWIM = truck speed data collected at TxDOT weigh in motion sites.
eBoth = combined speed data from both radar and weigh in motion sites.
9
Site Selection 10
In this study, researchers used data recorded between January 1, 2010 and December 31, 2010 at 11
20 different WIM counting stations. Researchers selected WIM counting stations based upon the 12
completeness of the data available and the research team’s ability to obtain the necessary 13
roadway design variables from aerial photos. 14
15
Researchers selected radar sites such that the final data set would cover the most common speed 16
conditions in the state of Texas. After confirming the speed limit of a selected roadway segment, 17
the data collection team placed radar units at locations meeting the following criteria: 18
19
20
21
TRB 2014 Annual Meeting Paper revised from original submittal.
Robertson, Fitzpatrick, Park, and Iragavarapu 6
Horizontal curvature, tangent. 1
Grade, < 3%. 2
Median width, < 100 ft. 3
Roadside elevation, ≥ Traveled way elevation. 4
Distance to ramp, > 1 mile. 5
Distance to signal, > 1 mile. 6
Distance to stop sign, > 1 mile. 7
Lateral clearance, > 30 ft. 8
9
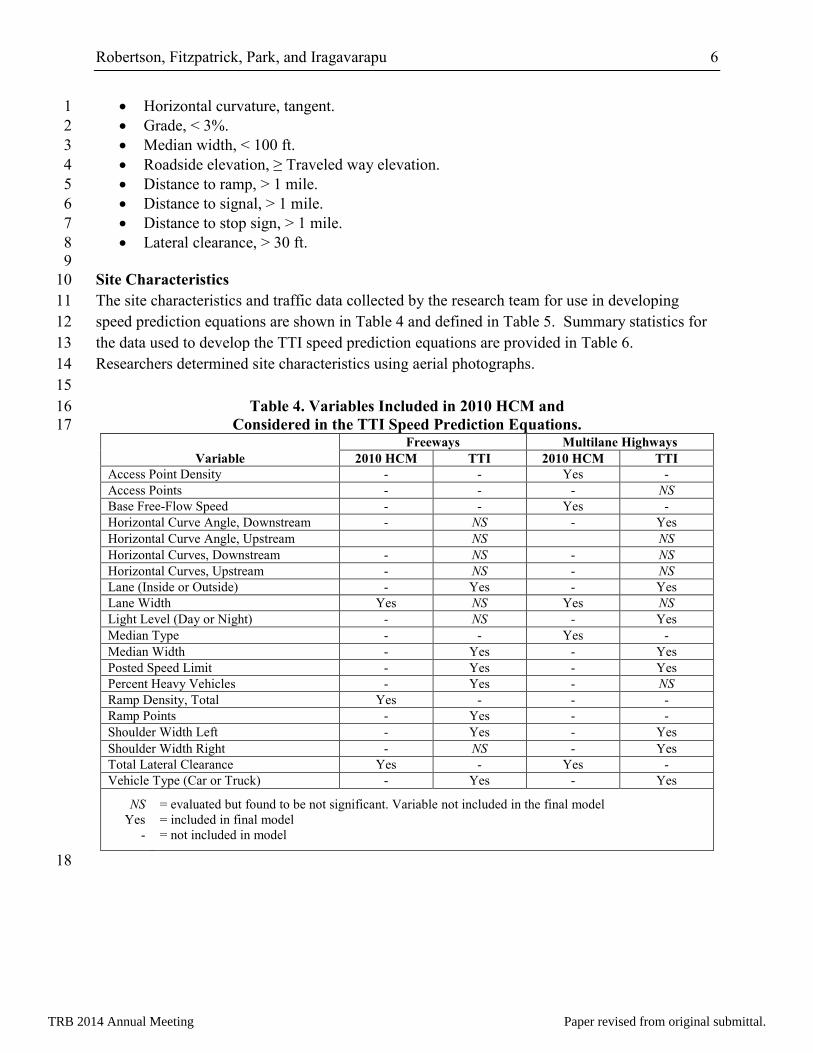
Site Characteristics 10
The site characteristics and traffic data collected by the research team for use in developing 11
speed prediction equations are shown in Table 4 and defined in Table 5. Summary statistics for 12
the data used to develop the TTI speed prediction equations are provided in Table 6. 13
Researchers determined site characteristics using aerial photographs. 14
15
Table 4. Variables Included in 2010 HCM and 16
Considered in the TTI Speed Prediction Equations. 17
Variable
Freeways Multilane Highways
2010 HCM TTI 2010 HCM TTI
Access Point Density - - Yes -
Access Points - - - NS
Base Free-Flow Speed - - Yes -
Horizontal Curve Angle, Downstream - NS - Yes
Horizontal Curve Angle, Upstream NS NS
Horizontal Curves, Downstream - NS - NS
Horizontal Curves, Upstream - NS - NS
Lane (Inside or Outside) - Yes - Yes
Lane Width Yes NS Yes NS
Light Level (Day or Night) - NS - Yes
Median Type - - Yes -
Median Width - Yes - Yes
Posted Speed Limit - Yes - Yes
Percent Heavy Vehicles - Yes - NS
Ramp Density, Total Yes - - -
Ramp Points - Yes - -
Shoulder Width Left - Yes - Yes
Shoulder Width Right - NS - Yes
Total Lateral Clearance Yes - Yes -
Vehicle Type (Car or Truck) - Yes - Yes
NS
Yes
-
= evaluated but found to be not significant. Variable not included in the final model
= included in final model
= not included in model
18
TRB 2014 Annual Meeting Paper revised from original submittal.

Robertson, Fitzpatrick, Park, and Iragavarapu 7
Table 5. Table 3. Definition of Variables in This Study and the 2010 HCM. 1 Variable Source Definition
Access Point Density 2010 HCM
The total number of access points on both sides of the
roadway (intersections, driveways, or openings), divided by
the length of the segment.
Access Points New
The number of access points (intersections or driveways)
within 1000 ft upstream and downstream of the data
collection point.
Base free-flow speed 2010 HCM The free-flow speed under base conditions.
Horizontal Curve Angle,
Downstream New
The angle formed by the tangent segments of roadway
connected to the downstream horizontal curve.
Horizontal Curve Angle,
Upstream New
The angle formed by the tangent segments of roadway
connected to the upstream horizontal curve.
Horizontal Curves,
Downstream New
The number of horizontal curves within one mile
downstream of the data collection point.
Horizontal Curves,
Upstream New
The number of horizontal curves within one mile upstream
of the data collection point.
Lane (Inside or Outside) New
On a four lane roadway, the inside lane is the left lane for
each travel direction and the outside lane is the right lane
for each travel direction.
Lane Width
2010 HCM The lateral distance between stripes for a given lane.
New The average lateral distance between pavement stripes for
lanes in a given travel direction.
Light Level (Day or Night) New
Daytime – the time between 30 minutes after sunrise and 30
minutes before sunset.
Nighttime – the time between 30 minutes after sunset and
30 minutes before sunrise.
Median Type 2010 HCM The type of median along a roadway segment (Undivided,
Two-Way Left-Turn Lanes (TWLTL), and Divided).
Median Width New The lateral distance between edges of pavement in the
median on freeways and divided highways.
Posted Speed Limit New The applicable posted speed limit for the roadway segment
at the data collection point.
Percent Heavy Vehicles New The percentage of vehicles in the traffic stream with a
length of 40 ft, or greater.
Ramp Density, Total 2010 HCM
The average number of on-ramp, off-ramp, major merge,
and major diverge junctions per mile. It applies to a 6 mi
segment of freeway facility, 3 mi upstream and 3 mi
downstream of the midpoint of the study segment.
Ramp Points New The number of entrance or exit ramps within 3 miles
upstream and downstream of the data collection point.
Shoulder Width Left New The lateral distance between the inside travel lane and the
left pavement edge.
Shoulder Width Right New The lateral distance between the outside travel lane and the
right pavement edge.
Total Lateral Clearance 2010 HCM
The sum of the right-side and left-side lateral clearances
along a multilane highway (lateral clearance is the distance
from the travel lane to the nearest roadside obstruction).
Vehicle Type (Car or Truck) New
Cars – vehicles with a length greater than 5 ft and less than
40 ft.
Trucks – vehicles with a length of 40 ft, or greater.
2
TRB 2014 Annual Meeting Paper revised from original submittal.

Robertson, Fitzpatrick, Park, and Iragavarapu 8
Table 6. Summary Statistics for Site Characteristics Used to Develop 1
TTI Speed Prediction Equations 2
Variable
Freeways Multilane Highways
Min Max Average Min Max Average
Access Points - - - 0 6 1.82
Horizontal Curve Angle, Downstream 5.08 55.66 18.01 5.70 41.95 15.50
Horizontal Curve Angle, Upstream 5.08 55.66 18.01 5.70 41.95 15.50
Horizontal Curves, Downstream 0 2 0.25 0 3 0.67
Horizontal Curves, Upstream 0 2 0.25 0 3 0.67
Lane Width 12 13 12.06 12 12.5 12.04
Median Width 32 266 69.44 0 200 64.14
Ramp Points 0 10 3.56 - - -
Shoulder Width Left 4 6 4.41 0 6 3.71
Shoulder Width Right 10 10 10 0 10 9.21
3
TTI SPEED PREDICTION EQUATIONS 4
To meet the objectives of the parent study, researchers predicted 85th
percentile free-flow speeds 5
using Analysis of Covariance (ANCOVA) regression models; however, the HCM methodology 6
uses mean speed. Therefore, for this paper, the 85th
percentile free-flow speed equations are 7
converted to mean free-flow speed equations using the equations shown in Figure 1. The 8
equations within Figure 1 are derived from the same data used to predict 85th
percentile free-flow 9
speed with the Analysis of Covariance (ANCOVA) regression models. While this is not an ideal 10
method for determining mean free-flow speed, it has been applied in previous research (4). The 11
developed, statistically significant (p-values < 0.05), mean free-flow speed prediction equations 12
are: 13
14
M_FFS4L-L = 71.5226 – 7.1769×PSL[65] – 4.6514×PSL[70] – 3.5231×PSL[75] 15
– 0.1106×Ramps_Pts – 2.8641×Per_Trks + 3.0688×Lane[inside] 16
+ 0.01012×MW + 0.3893×SW_L + 4.4638×Vehicle[car] Equation 1. 17
18
M_FFS4L-NL = 64.9684 – 2.1535×PSL[65] – 1.3004×PSL[70] – 0.0266×Down_HC_A 19
+ 2.8156×Lane[inside] + 0.0071×MW + 1.5127×SW_L 20
– 0.4058×SW_R + 1.8900×Light[day] + 3.4556×Vehicle[car] Equation 2. 21
22
Where: 23
Table 7 contains the base scenario values. 24
Down_HC_A = angle of next horizontal curve downstream of site. 25
Lane[inside] = 1 when vehicle is on the inside (or left) lane, 0 if vehicle is on the outside (or 26
right) lane. 27
Light[day] = 1 when the light condition is daytime, 0 if light condition is nighttime. 28
M_FFS4L-NL = predicted mean free-flow speed for a four-lane non-limited access site (mi/h). 29
M_FFS4L-L = predicted mean free-flow speed for a four-lane limited access site (mi/h). 30
MW = median width (ft). 31
Per_Trks = percent trucks present in decimal equivalent for hour. 32
TRB 2014 Annual Meeting Paper revised from original submittal.

Robertson, Fitzpatrick, Park, and Iragavarapu 9
PSL[65] = 1 when posted speed limit is 65 mi/h, 0 otherwise. 1
PSL[70] = 1 when posted speed limit is 70 mi/h, 0 otherwise. 2
PSL[75] = 1 when posted speed limit is 75 mi/h, 0 otherwise. 3
Ramps_Pts = Number of ramp gores within 3 miles upstream or downstream of the site for 4
the direction of travel. 5
SW_L = left shoulder width (ft). 6
SW_R = right shoulder width (ft). 7
Vehicle[car] = 1 when the vehicle type is a car, 0 if the vehicle type is a truck. 8
9
10
(a) Freeways
(b) Multilane Highways
Figure 1. Conversion from 85th Percentile Free-Flow Speed to Mean Free-Flow Speed. 11
12
13
TRB 2014 Annual Meeting Paper revised from original submittal.

Robertson, Fitzpatrick, Park, and Iragavarapu 10
Table 7. Base Values for Mean Free-Flow Speed Equations. 1
Variable
Equation 1
Default Values
Equation 2
Default Values
PSL (mi/h) 80 75
Ramps_Pts 0 -
Per_Trks 0 -
Lane Outside Outside
MW (ft) 0 0
SW_L (ft) 0 0
SW_R (ft) - 0
Vehicle Truck Truck
Light - Night
Down_HC_A - 0
- = not included in model
2
3
HCM AND TTI SPEED PREDICTION EQUATIONS COMPARISON 4
Table 4 provides a comparison between the variables included in the equations for predicting 5
free-flow speed within the Highway Capacity Manual and variables considered for inclusion in 6
the TTI speed prediction equations; additionally, Table 5 provides the definitions for each of the 7
variables in Table 4. The comparison shows that the TTI speed prediction equations often have 8
different variables than those contained within the HCM methodology. Potential reasons for 9
these differences are the speeds of the facilities used to develop the TTI equations and a lack of 10
variability in some of the variables at the Texas sites. For example, none of the freeway sites had 11
a lateral clearance less than 6 ft and all of the study sites had 12- to 13-ft lane widths (the default 12
values in the HCM). The minimum, maximum, and average values for the geometric 13
characteristics for the sites used to develop the TTI speed prediction equations are provided in 14
Table 6. 15
16
FREEWAYS METHODOLOGY 17
This section provides a methodology for predicting mean free-flow speed and estimating level of 18
service on freeways with posted speed limits of 65 mi/h to 80 mi/h. 19
20
Key Assumptions 21
Key assumptions for integrating Equation 1 into a methodology for predicting mean free-flow 22
speed on freeways are: 23
Vehicle Type = Car, which adds 4.46 mi/h to the intercept value. 24
Percent Heavy Vehicles = 0, which removes the variable from the equation (heavy 25
vehicle adjustments occur in step 4 of the HCM methodology). 26
Lane distribution is even, this adds 1.53 mi/h to the intercept value, which is half the 27
coefficient for the lane in Equation 1. 28
Number of ramp points converted to reflect ramp density, the new coefficient is 6 times 29
the coefficient for number of ramps within Equation 1. 30
31
TRB 2014 Annual Meeting Paper revised from original submittal.

Robertson, Fitzpatrick, Park, and Iragavarapu 11
Speed-Flow Curves for Freeways 1
While Equation 1 provides the ability to calculate mean free-flow speed on freeways with higher 2
speeds, the Highway Capacity Manual does not contain speed-flow curves for free-flow speeds 3
of 80 mi/h and 85 mi/h. Therefore, the authors developed 80- and 85-mi/h speed-flow curves 4
using equations with the same form as those in the HCM, which are provided in Figure 2 and 5
Table 8. The authors determined the form of the new curves in Table 8 by determining when 6
these curves meet the 75-mi/h curve at the capacity flow-rate of 2,400 pc/h/ln, given the 7
following assumptions: 8
The capacity on freeways with a free-flow speed of 85 mi/h or 80 mi/h is no greater than 9
the capacity on freeways with a free-flow speed of 70 mi/h, an assumption applied by 10
Roess when determining the form of the 75-mi/h speed-flow curve (5). 11
The break point for the 80-mi/h speed-flow curve is 200 pc/h/ln less than the break point 12
of the 75-mi/h speed-flow curve; and the break point for the 85-mi/h speed-flow curve is 13
400 pc/h/ln less than the break point of the 75-mi/h speed-flow curve. This assumption 14
comes from the HCM’s trend of reducing the break point value by 200 pc/h/ln per 5-mi/h 15
increase in free-flow speed. 16
The level of service density thresholds for freeways with free-flow speeds of 80 mi/h and 17
85 mi/h are the same as the thresholds for other free-flow speeds. 18
19
While the authors recognize the ongoing debate concerning the speed-flow curves within the 20
2010 Highway Capacity Manual, this research effort did not collect the range of volumes 21
required to evaluate the forms and breakpoints of the speed-flow curves (6). Therefore, the 22
curves developed in this paper are extrapolated from the current equations in the 2010 HCM and 23
should be reconsidered when data become available. 24
25
The level of service thresholds for freeways shown in Figure 2 are defined in Table 1. 26
27
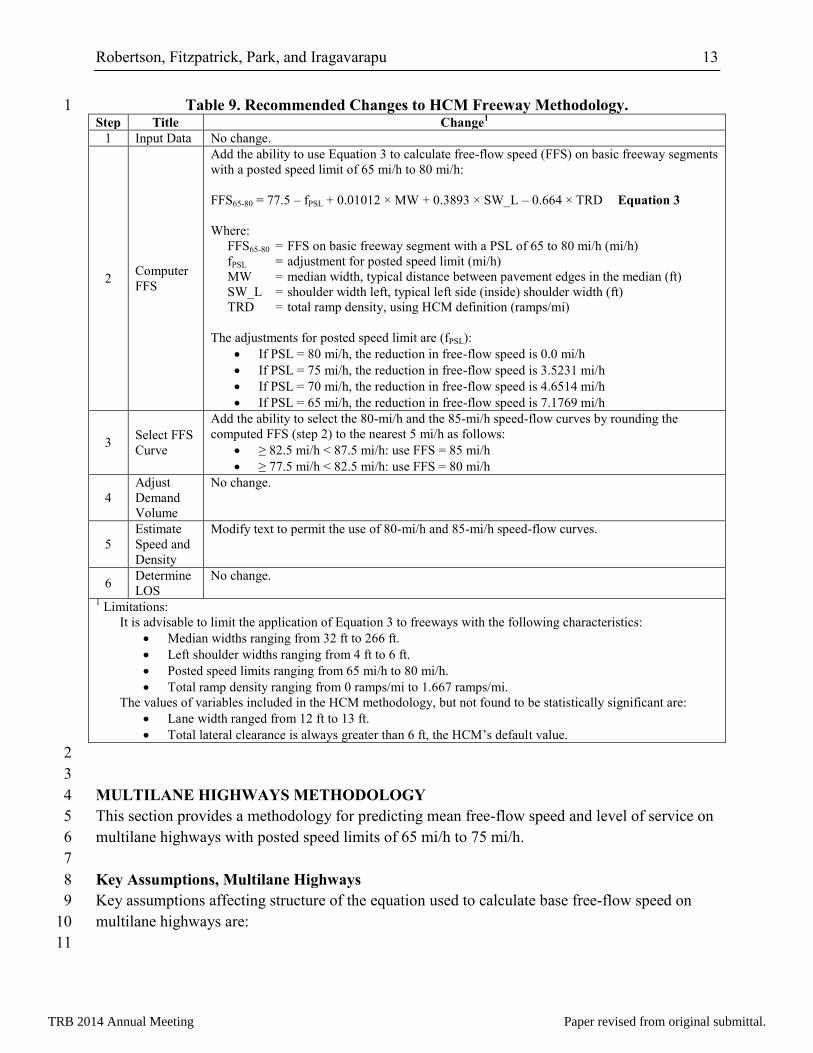
Changes to the HCM Freeways Methodology 28
The recommend changes for each step of the HCM freeways methodology (Chapter 11 of the 29
2010 HCM) are shown in Table 9. 30
31
TRB 2014 Annual Meeting Paper revised from original submittal.

Robertson, Fitzpatrick, Park, and Iragavarapu 12
1 Figure 2. Speed-Flow Curves for Basic Freeway Segments 2
(With New 85-mi/h and 80-mi/h Speed-Flow Curves). 3
4
5
Table 8. Equations Describing the Speed-Flow Curves in Figure 2 6
(With New 80-mi/h and 85-mi/h Speed-Flow Curves). 7
FFS
(mi/h)
Flow Rate Range
Source Breakpoint (pc/h/ln)
Less Than the
Breakpoint
Less Than the Breakpoint &
Greater Than the Capacity
85 1,600 85 85 – 0.00000987 (Flow Rate – 600)^2 New
80 1,800 80 80 – 0.00001043 (Flow Rate – 800)^2 New
75 1,000 75 75 – 0.00001107 (Flow Rate – 1,000)^2 HCM
70 1,200 70 70 – 0.00001160 (Flow Rate – 1,200)^2 HCM
65 1,400 65 65 – 0.00001418 (Flow Rate – 1,400)^2 HCM
60 1,600 60 60 – 0.00001816 (Flow Rate – 1,600)^2 HCM
55 1,800 55 55 – 0.00002469 (Flow Rate – 1,800)^2 HCM
New = equations developed based on assumptions discussed in this paper.
8
9
0
10
20
30
40
50
60
70
80
90
0 500 1,000 1,500 2,000 2,500
Sp
ee
d (
mi/
h)
Flow Rate (pc/h/ln)
85 mi/h free-flow speed
80 mi/h
75 mi/h
70 mi/h
65 mi/h
60 mi/h
55 mi/h
LOS F
LOS ELOS DLOS CLOS BLOS A
TRB 2014 Annual Meeting Paper revised from original submittal.
Robertson, Fitzpatrick, Park, and Iragavarapu 13
Table 9. Recommended Changes to HCM Freeway Methodology. 1 Step Title Change
1
1 Input Data No change.
2 Computer
FFS
Add the ability to use Equation 3 to calculate free-flow speed (FFS) on basic freeway segments
with a posted speed limit of 65 mi/h to 80 mi/h:
FFS65-80 = 77.5 – fPSL + 0.01012 × MW + 0.3893 × SW_L – 0.664 × TRD Equation 3
Where:
FFS65-80 = FFS on basic freeway segment with a PSL of 65 to 80 mi/h (mi/h)
fPSL = adjustment for posted speed limit (mi/h)
MW = median width, typical distance between pavement edges in the median (ft)
SW_L = shoulder width left, typical left side (inside) shoulder width (ft)
TRD = total ramp density, using HCM definition (ramps/mi)
The adjustments for posted speed limit are (fPSL):
If PSL = 80 mi/h, the reduction in free-flow speed is 0.0 mi/h
If PSL = 75 mi/h, the reduction in free-flow speed is 3.5231 mi/h
If PSL = 70 mi/h, the reduction in free-flow speed is 4.6514 mi/h
If PSL = 65 mi/h, the reduction in free-flow speed is 7.1769 mi/h
3 Select FFS
Curve
Add the ability to select the 80-mi/h and the 85-mi/h speed-flow curves by rounding the
computed FFS (step 2) to the nearest 5 mi/h as follows:
≥ 82.5 mi/h < 87.5 mi/h: use FFS = 85 mi/h
≥ 77.5 mi/h < 82.5 mi/h: use FFS = 80 mi/h
4
Adjust
Demand
Volume
No change.
5
Estimate
Speed and
Density
Modify text to permit the use of 80-mi/h and 85-mi/h speed-flow curves.
6 Determine
LOS
No change.
1 Limitations:
It is advisable to limit the application of Equation 3 to freeways with the following characteristics:
Median widths ranging from 32 ft to 266 ft.
Left shoulder widths ranging from 4 ft to 6 ft.
Posted speed limits ranging from 65 mi/h to 80 mi/h.
Total ramp density ranging from 0 ramps/mi to 1.667 ramps/mi.
The values of variables included in the HCM methodology, but not found to be statistically significant are:
Lane width ranged from 12 ft to 13 ft.
Total lateral clearance is always greater than 6 ft, the HCM’s default value.
2
3
MULTILANE HIGHWAYS METHODOLOGY 4
This section provides a methodology for predicting mean free-flow speed and level of service on 5
multilane highways with posted speed limits of 65 mi/h to 75 mi/h. 6
7
Key Assumptions, Multilane Highways 8
Key assumptions affecting structure of the equation used to calculate base free-flow speed on 9
multilane highways are: 10
11
TRB 2014 Annual Meeting Paper revised from original submittal.

Robertson, Fitzpatrick, Park, and Iragavarapu 14
Vehicle = Car, which adds 3.46 mi/h to the intercept value. 1
Light = Day, which adds 1.89 mi/h to the intercept value. 2
Lane distribution is even, this adds 1.41 mi/h to the intercept value, which is half the 3
coefficient for lane in Equation 2. 4
5
Speed-Flow Curves for Multilane Highways 6
While Equation 2 provides the ability to calculate mean free-flow speed on multilane highways 7
with higher speeds, the Highway Capacity Manual does not contain speed-flow curves for free-8
flow speeds of 65 mi/h to 80 mi/h. Therefore, the authors developed four additional speed-flow 9
curves with the equations taking the form of the multilane highway equations currently in the 10
HCM (for 65 mi/h) and the form of the freeways equations (for 70 mi/h to 80 mi/h), which are 11
provided in Figure 3 and Table 10. The authors determined the form of the 80-mi/h to 65-mi/h 12
curves in Table 10 by determining when these curves meet the capacity flow rate of 2,300 13
pc/h/ln for a density of 40 pc/mi/ln, given the following assumptions: 14
The capacity for 65-mi/h multilane highways is higher than the capacity for 60-mi/h 15
multilane highways by 100 pc/h/ln. 16
The capacity for 70-mi/h to 80-mi/h free-flow speeds is no greater than the capacity for 17
65-mi/h free-flow speeds on multilane highways, an assumption applied by Roess when 18
determining the form of the 75-mi/h speed-flow curve for freeways (5). 19
The level of service thresholds for multilane highways with free-flow speeds of 80 mi/h 20
to 65 mi/h are the same as those for multilane highways with a free-flow speed of 21
60 mi/h. 22
The equation for 65 mi/h has the same form as the equation for 60 mi/h; the equations for 23
70 to 80 mi/h have the same form as the freeway speed-flow curve equations because in 24
the judgment of the authors, higher speed multilane highways operate in a manner that is 25
similar to freeways. 26
27
Again, this research effort did not collect the range of volumes required to evaluate the forms 28
and breakpoints of the speed-flow curves; therefore, the curves provided in this paper are 29
extrapolated from the current equations in the 2010 HCM and should be reconsidered when data 30
become available. 31
32
The level of service thresholds for multilane highways shown in Figure 3 are defined in Table 1. 33
34
Changes to the HCM Multilane Highways Methodology 35
The recommend changes for each step of the HCM multilane highways methodology 36
(Chapter 14 of the 2010 HCM) are shown in Table 11. 37
38
TRB 2014 Annual Meeting Paper revised from original submittal.

Robertson, Fitzpatrick, Park, and Iragavarapu 15
1 Figure 3. Speed-Flow Curves for Multilane Highways 2
(With New 80-mi/h to 65-mi/h Speed-Flow Curves). 3
4
5
Table 10. Equations Describing Speed-Flow Curves in Figure 3 6
(With New 80-mi/h to 65-mi/h Speed-Flow Curves). 7
FFS
(mi/h)
Flow Rate Range
Source Breakpoint (pc/h/ln)
Less Than the
Breakpoint
Greater than the Breakpoint &
Less Than the Capacity
80 1,800 80 80 – 0.00001000 (Flow Rate – 800)^2 New
75 1,000 75 75 – 0.00001036 (Flow Rate – 1,000)^2 New
70 1,200 70 70 – 0.00001033 (Flow Rate – 1,200)^2 New
65 1,400 65 65 – 0.00101159 (Flow Rate – 1,400)^1.31 New
60 1,400 60 60 – 0.00078691 (Flow Rate – 1,400)^1.31 HCM
55 1,400 55 55 – 0.00070862 (Flow Rate – 1,400)^1.31 HCM
50 1,400 50 50 – 0.00080066 (Flow Rate – 1,400)^1.31 HCM
45 1,400 45 45 – 0.00080983 (Flow Rate – 1,400)^1.31 HCM
New = equation developed based on assumptions discussed in this paper
8
9
0
10
20
30
40
50
60
70
80
0 400 800 1,200 1,600 2,000 2,400
Sp
ee
d (
mi/
h)
Flow Rate (pc/h/ln)
80 mi/h free-flow speed
75 mi/h
70 mi/h
65 mi/h
60 mi/h
55 mi/h
50 mi/h
45 mi/h
LOS F
LOS E
LOS DLOS CLOS BLOS A
TRB 2014 Annual Meeting Paper revised from original submittal.

Robertson, Fitzpatrick, Park, and Iragavarapu 16
Table 11. Recommended Changes to HCM Multilane Highway. 1 Step Title Change
1
1 Input Data No change.
2 Compute
FFS
Add the ability to use Equation 4 to calculate base free-flow speed on multilane highways with
a posted speed limit of 65 mi/h to 75 mi/h:
BFFS65-75 = 71.7 – fPSL – 0.0266 × HCA + 0.0071 × MW + 1.5127 ×
SW_L – 0.4058 × SW_R Equation 4.
Where:
BFFS65-75 = base free-flow speed for multilane highway segments with a posted speed
limit of 65 to 75 mi/h (mi/h)
fPSL = adjustment for posted speed limit (mi/h)
HCA = horizontal curve angle, the typical angle for horizontal curves on the multilane
highway (degrees)
MW = median width (ft)
SW_L = shoulder width on the left side of the traveled way (ft)
SW_R = shoulder width on the right side of the traveled way (ft)
The adjustments for posted speed limit are (fPSL):
If PSL = 75 mi/h, the reduction in free-flow speed is 0.0 mi/h
If PSL = 70 mi/h, the reduction in free-flow speed is 1.3004 mi/h
If PSL = 65 mi/h, the reduction in free-flow speed is 2.1535 mi/h
Do not adjust the calculated FFS for median type because Equation 4 uses median width.
3 Select FFS
Curve
Add the ability to select the 65-mi/h to 80-mi/h free-flow speed curves by rounding the
calculated FFS (step 2) to the nearest 5 mi/h as follows:
≥ 77.5 mi/h < 82.5 mi/h: use FFS = 80 mi/h
≥ 72.5 mi/h < 77.5 mi/h: use FFS = 75 mi/h
≥ 67.5 mi/h < 72.5 mi/h: use FFS = 70 mi/h
≥ 62.5 mi/h < 67.5 mi/h: use FFS = 65 mi/h
4
Adjust
Demand
Volume
No change.
5
Estimate
Speed and
Density
Recommend adding the ability to use the 65-mi/h to 80-mi/h speed-flow curves.
6 Determine
LOS
No change.
1 Limitations
It is advisable to limit the application of Equation 4 to multilane highways with the following characteristics:
Median width ranging from 0 ft to 200 ft.
Left shoulder width ranging from 0 ft to 10 ft.
Right shoulder width ranging from 0 to 10 ft.
Posted speed limit ranging from 65 mi/h to 75 mi/h.
Horizontal curve angle (when present) ranging from 5.7 degrees to 42.0 degrees.
The values of variables included in the HCM methodology, but not found to be statistically significant are:
Access point density ranged from 0 to 15.8 points/mi.
Lane width ranged from 12 ft to 12.5 ft.
Median type is either none or divided, there were no two-way left turn-lane facilities.
Total lateral clearance is always greater than 6 ft, the HCM’s default value.
2
3
TRB 2014 Annual Meeting Paper revised from original submittal.

Robertson, Fitzpatrick, Park, and Iragavarapu 17
CONCLUSIONS AND RECOMMENDATIONS 1
This paper highlights opportunities for improving level of service estimation on higher speed 2
facilities and provides methods for estimating level of service on freeways with posted speed 3
limits up to 80 mi/h and multilane highways with posted speed limits up to 75 mi/h. These 4
methods provide an opportunity for states with higher posted speed limits to evaluate level of 5
service in a manner consistent with the 2010 HCM methodology. If the trend of increasing 6
posted speed limits continues, the following are opportunities for improving updates to the HCM 7
methodology: 8
Consider posted speed limit in the prediction of free-flow speed. 9
Use data sets that include lower and higher posted speed limits. 10
Reevaluate the use of lateral clearance, instead of shoulder width, when calculating free-11
flow speed. 12
Use data sets with greater variations in lane width at higher posted speed limits. 13
Use data to determine the form of speed-flow curves used within the freeway and 14
multilane highway methodologies for freeways and multilane highways with higher 15
speeds. 16
17
ACKNOWLEDGMENTS 18
This paper uses data generated as part of a Texas Department of Transportation (TxDOT) and 19
the U.S. Department of Transportation, Federal Highway Administration (FHWA) project. The 20
research was performed at the Texas A&M Transportation Institute. The contents of this paper 21
reflect the views of the authors, who are responsible for the facts and the accuracy of the data 22
presented herein. The contents do not necessarily reflect the official views or polices of TxDOT 23
or FHWA. 24
25
TRB 2014 Annual Meeting Paper revised from original submittal.

Robertson, Fitzpatrick, Park, and Iragavarapu 18
REFERENCES 1
1 Transportation Research Board. HCM 2010 Highway Capacity Manual. Washington, DC,
USA: Transportation Research Board of the National Academies, 2010.
2 Texas Department of Transportation, Night Time Speed Limit and Truck Speed Limits,
Project 0-6401. http://trid.trb.org/view.aspx?id=976177.
3 Wavetronix, SmartSensor HD Sidefire Radar Unit.
http://www.wavetronix.com/en/products/smartsensor/hd
4 Dixon, K., C.H. Wu, W. Sarasua, and J. Daniel. “Posted and Free-Flow Speeds for Rural
Multilane Highways in Georgia.” Journal of Transportation Engineering, Vol. 125, No. 6
(1999): 487 – 494.
5 Roess, R. Re-Calibration of the 75-mi/h Speed-Flow Curve and the FFS Prediction
Algorithm for HCM 2010 Task 6 Research Memo, National Cooperative Research Program
Project 3-92, 2009.
6 Roess R. 2011. Speed-Flow Curves for Freeways in Highway Capacity Manual 2010.
Transportation Research Record: Journal of the Transportation Research Board, No. 2257,
Transportation Research Board of the National Academies, Washington, D.C. pp. 10-21.
TRB 2014 Annual Meeting Paper revised from original submittal.