robert mccormick: high octane fuels: benefits and challenges
TRANSCRIPT

NREL is a national laboratory of the U.S. Department of Energy, Office of Energy Efficiency and Renewable Energy, operated by the Alliance for Sustainable Energy, LLC.
High Octane Fuels: Benefits and Challenges
Presenter: Robert L. McCormick
National Ethanol Conference
New Orleans
February 17, 2016
2
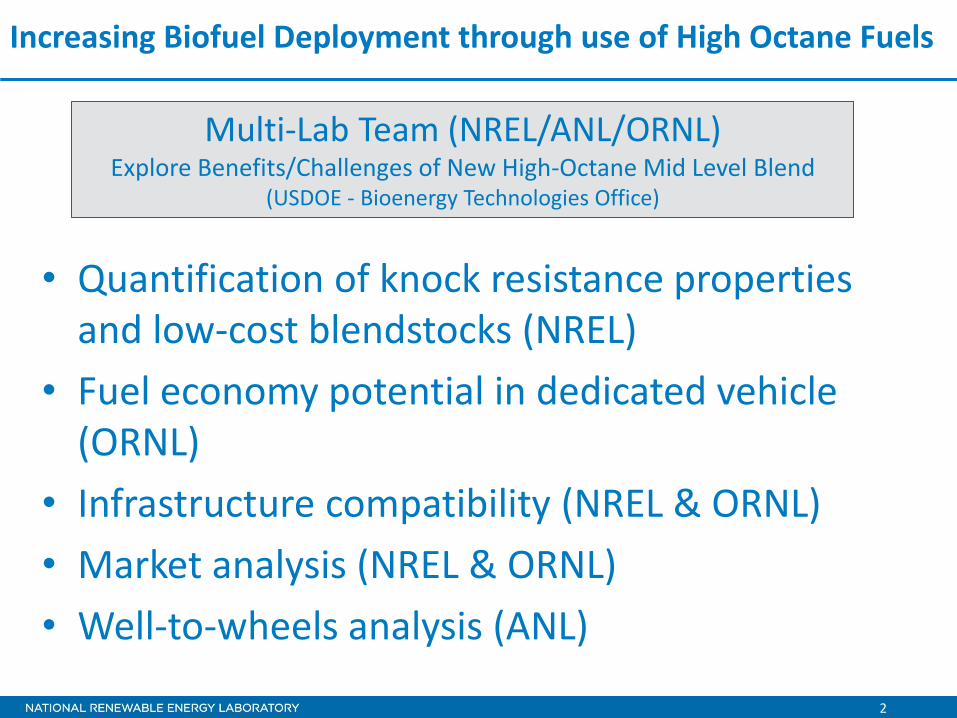
Increasing Biofuel Deployment through use of High Octane Fuels
• Quantification of knock resistance properties and low-cost blendstocks (NREL)
• Fuel economy potential in dedicated vehicle (ORNL)
• Infrastructure compatibility (NREL & ORNL)
• Market analysis (NREL & ORNL)
• Well-to-wheels analysis (ANL)
Multi-Lab Team (NREL/ANL/ORNL) Explore Benefits/Challenges of New High-Octane Mid Level Blend
(USDOE - Bioenergy Technologies Office)
3
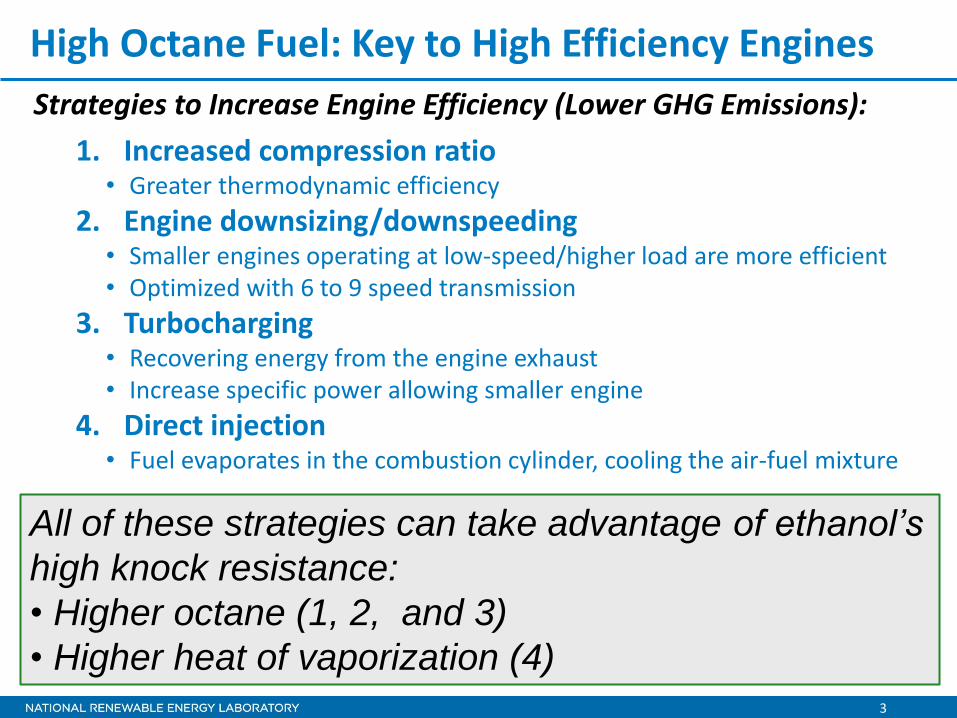
High Octane Fuel: Key to High Efficiency Engines
Strategies to Increase Engine Efficiency (Lower GHG Emissions):
1. Increased compression ratio • Greater thermodynamic efficiency
2. Engine downsizing/downspeeding • Smaller engines operating at low-speed/higher load are more efficient • Optimized with 6 to 9 speed transmission
3. Turbocharging • Recovering energy from the engine exhaust • Increase specific power allowing smaller engine
4. Direct injection • Fuel evaporates in the combustion cylinder, cooling the air-fuel mixture
All of these strategies can take advantage of ethanol’s
high knock resistance:
• Higher octane (1, 2, and 3)
• Higher heat of vaporization (4)

4
Potential Knock Resistance from Charge Cooling
• Developed new methods for measuring gasoline HOV • Winter and summer gasolines, plus
natural gasoline
• Very little variation in hydrocarbon blendstock
• HOV function of temperature and ethanol content only
• Ethanol has almost 3x higher heat of vaporization (HOV)
• Pure compound HOV easily measured • Not applicable to mixtures with
gasoline
Ethanol Content, vol%
0 10 20 30 40 50 60
Hea
t o
f V
ap
ori
zati
on
, kJ
/kg
0
200
400
600
800
wCBOB
CARBOBsCBOBNG
5
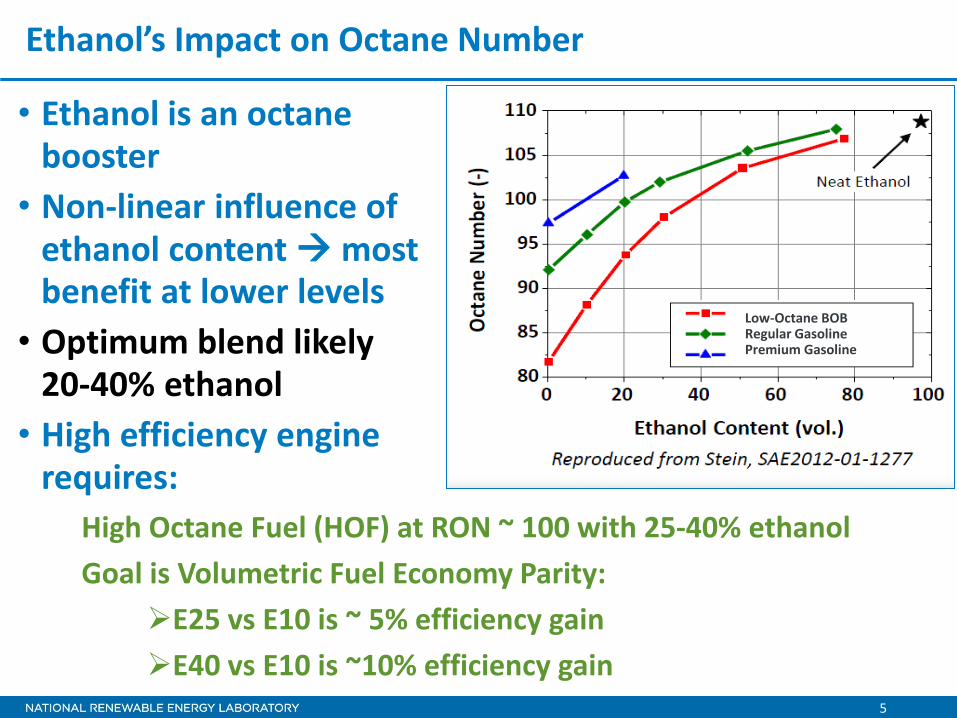
Ethanol’s Impact on Octane Number
• Ethanol is an octane booster
• Non-linear influence of ethanol content most benefit at lower levels
• Optimum blend likely 20-40% ethanol
• High efficiency engine requires:
High Octane Fuel (HOF) at RON ~ 100 with 25-40% ethanol
Goal is Volumetric Fuel Economy Parity:
E25 vs E10 is ~ 5% efficiency gain
E40 vs E10 is ~10% efficiency gain
Low-Octane BOB Regular Gasoline Premium Gasoline
6
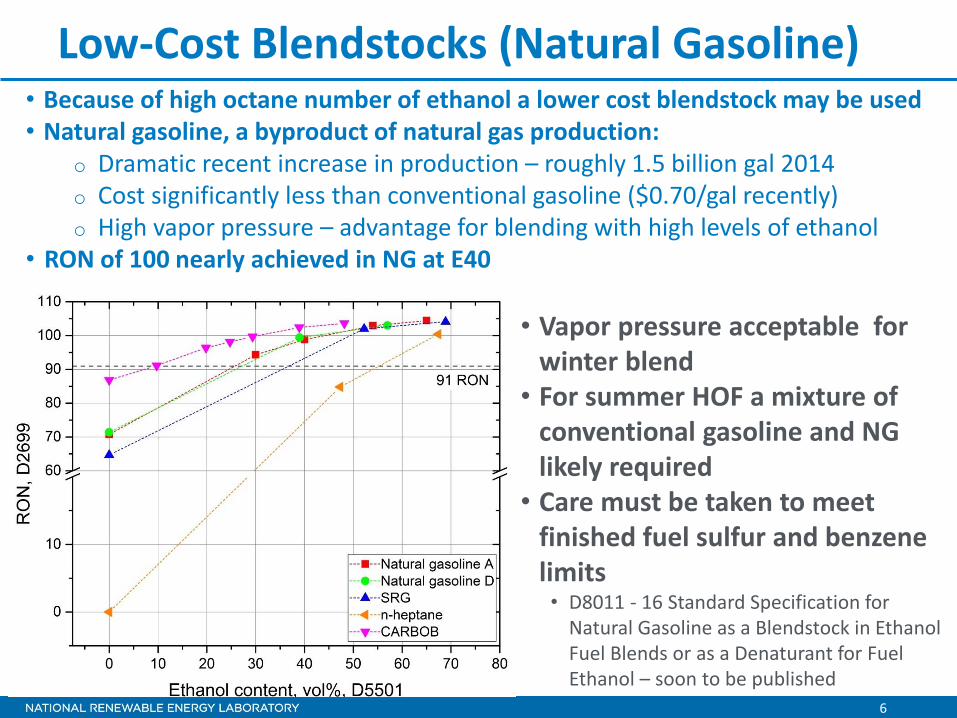
Low-Cost Blendstocks (Natural Gasoline)
• Vapor pressure acceptable for winter blend
• For summer HOF a mixture of conventional gasoline and NG likely required
• Care must be taken to meet finished fuel sulfur and benzene limits • D8011 - 16 Standard Specification for
Natural Gasoline as a Blendstock in Ethanol Fuel Blends or as a Denaturant for Fuel Ethanol – soon to be published
• Because of high octane number of ethanol a lower cost blendstock may be used • Natural gasoline, a byproduct of natural gas production:
o Dramatic recent increase in production – roughly 1.5 billion gal 2014 o Cost significantly less than conventional gasoline ($0.70/gal recently) o High vapor pressure – advantage for blending with high levels of ethanol
• RON of 100 nearly achieved in NG at E40

7
Vehicle Fuel Economy Benefits
Proof of Concept
Courtesy of Oak Ridge National Laboratory

8
Fuel Economy Goals are Feasible
• Fuel Economy normalized to E0 equivalent basis
• Factory compression ratio
• Rear axle and drive wheel change reduces engine speed ~20%
40.1
42.9
41.9
43.9
42.1
44.3
34.0
36.0
38.0
40.0
42.0
44.0
46.0
Stock Downsped
Fue
l Eco
no
my
(E0
MP
Geq
)
HFETE0 Equivalent mpg
Regular E10 Premium E0 HOF E30
10.5%
5.0%
88
AK
I9
1 R
ON
93
AK
I9
7 R
ON
95
AK
I1
01
RO
N
26.1
27.327.3
28.3
27.6
28.7
20.0
21.0
22.0
23.0
24.0
25.0
26.0
27.0
28.0
29.0
30.0
Stock Downsped
Fue
l Eco
no
my
(E0
MP
Geq
)
US06E0 Equivalent mpg
Regular E10 Premium E0 HOF E30
10%
5.7%
88
AK
I9
1 R
ON
93
AK
I9
7 R
ON
95
AK
I1
01
RO
N
• Goal: Volumetric Fuel Economy Parity: o E25 vs E10 requires ~ 5% efficiency gain o E40 vs E10 requires ~10% efficiency gain
• Sedan with 2.0 liter turbocharged, direct-injection engine o Stock: 101 RON E30 demonstrated 5% gain o Downspeed: 101 RON E30 demonstrated 10% gain
• Requires high RON fuel, modern engine capable of adjusting phasing, and downspeeded vehicle

9
Terminal and Refueling Infrastructure
10
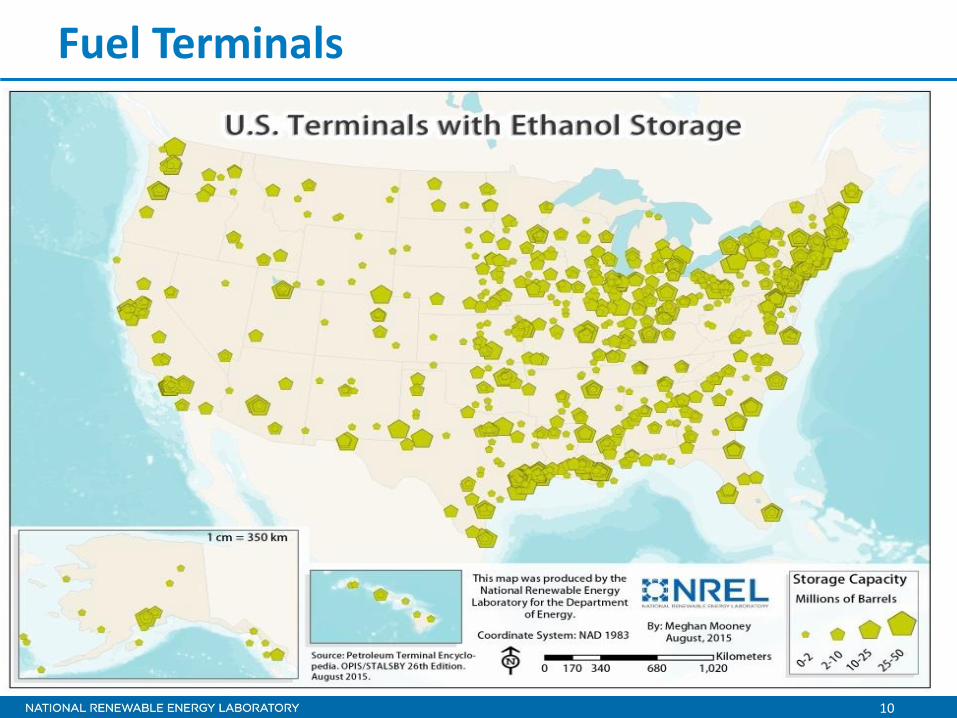
Fuel Terminals

11
Terminals-Ability to Store More Ethanol
• No technical issues
• Several significant practical issues o Nearly all tanks are in-use
o Land availability for additional tanks and unloading facilities
o Lengthy process to change EPA operating permit to add more tanks
o Ability for location to handle increased truck/rail traffic for ethanol deliveries
• Bottom line: terminals may require significant lead time and strong business case for a large increase in ethanol blending

12
Retail Stations and Higher Ethanol Blends
• UL E25 and E85 equipment available o E25/100 RON selected as base
case for this study
• E10+ can be stored in existing tanks with manufacturer letter stating compatibility o Available from most suppliers
• USDA BIP program: $210 million in E85 compatible infrastructure in 2016 o Could potentially offer MLEB-HOF
• Dispensers being replaced by 2017 for chip and pin credit cards o An opportunity to deploy more
E25 and E85 equipment
• Stations may not have equipment records necessary to meet federal compatibility requirements
• Some equipment upgrades are necessary and station profits are small
• Stations with existing compatible tanks would need to decide which fuel to stop selling to accommodate a new fuel o Whether it contained ethanol or
not
o Potentially eliminating mid-grade is an option
Opportunities Barriers

13
Assessment of Market Potential and Barriers to Deployment
14
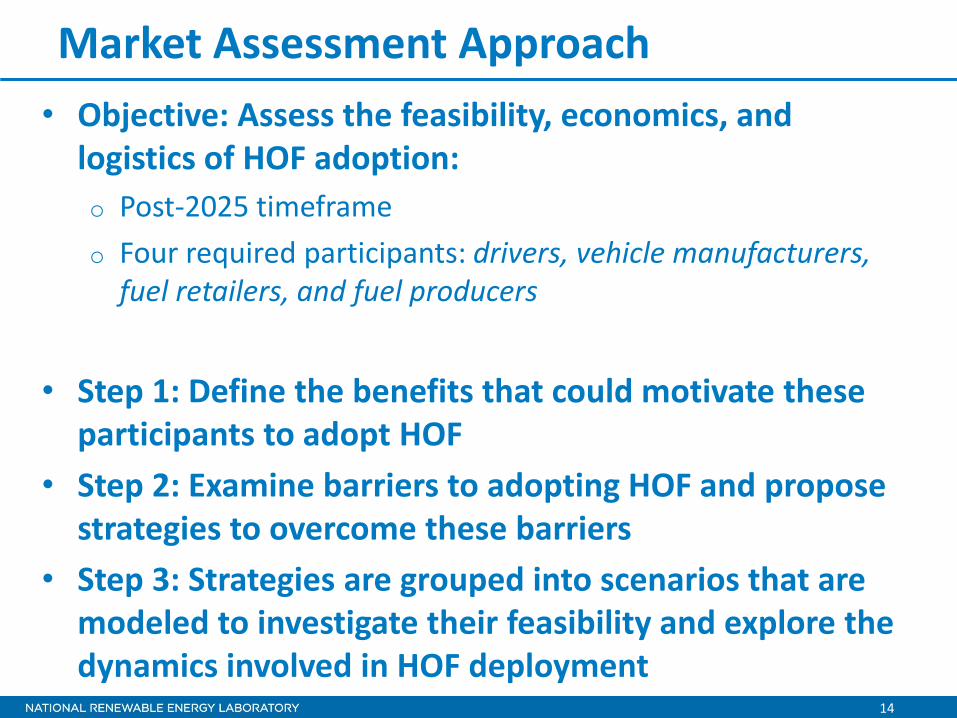
Market Assessment Approach
• Objective: Assess the feasibility, economics, and logistics of HOF adoption:
o Post-2025 timeframe
o Four required participants: drivers, vehicle manufacturers, fuel retailers, and fuel producers
• Step 1: Define the benefits that could motivate these participants to adopt HOF
• Step 2: Examine barriers to adopting HOF and propose strategies to overcome these barriers
• Step 3: Strategies are grouped into scenarios that are modeled to investigate their feasibility and explore the dynamics involved in HOF deployment
15
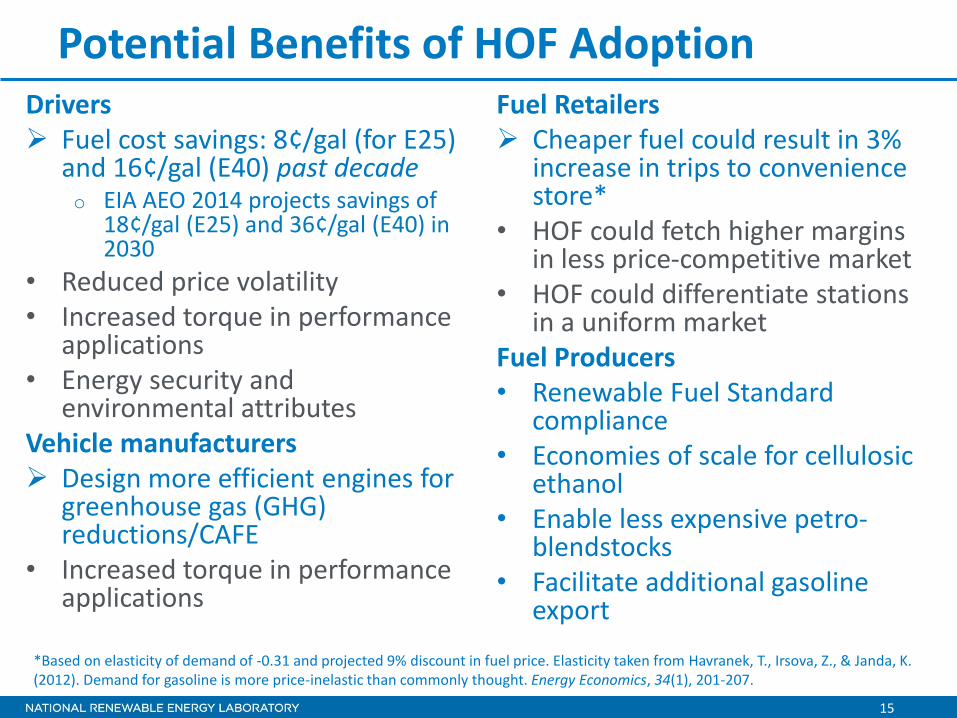
Potential Benefits of HOF Adoption Drivers Fuel cost savings: 8¢/gal (for E25)
and 16¢/gal (E40) past decade o EIA AEO 2014 projects savings of
18¢/gal (E25) and 36¢/gal (E40) in 2030
• Reduced price volatility • Increased torque in performance
applications • Energy security and
environmental attributes Vehicle manufacturers Design more efficient engines for
greenhouse gas (GHG) reductions/CAFE
• Increased torque in performance applications
Fuel Retailers Cheaper fuel could result in 3%
increase in trips to convenience store*
• HOF could fetch higher margins in less price-competitive market
• HOF could differentiate stations in a uniform market
Fuel Producers • Renewable Fuel Standard
compliance • Economies of scale for cellulosic
ethanol • Enable less expensive petro-
blendstocks • Facilitate additional gasoline
export
*Based on elasticity of demand of -0.31 and projected 9% discount in fuel price. Elasticity taken from Havranek, T., Irsova, Z., & Janda, K. (2012). Demand for gasoline is more price-inelastic than commonly thought. Energy Economics, 34(1), 201-207.
16
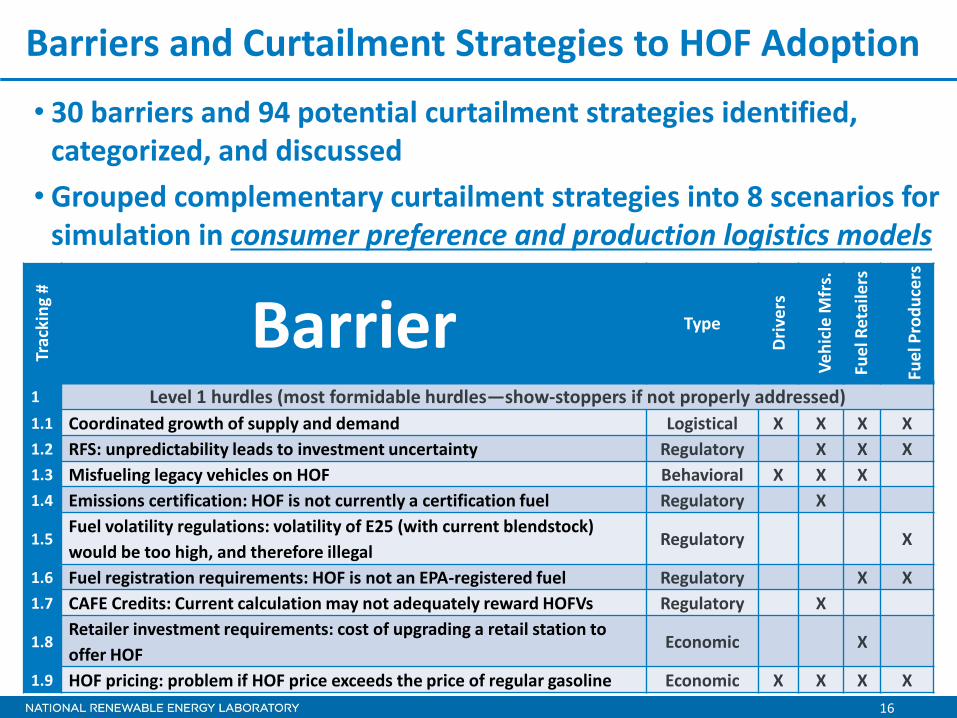
Barriers and Curtailment Strategies to HOF Adoption
• 30 barriers and 94 potential curtailment strategies identified, categorized, and discussed
• Grouped complementary curtailment strategies into 8 scenarios for simulation in consumer preference and production logistics models
Trac
kin
g #
Barrier Type
Dri
vers
Ve
hic
le M
frs.
Fue
l Ret
aile
rs
Fue
l Pro
du
cers
1 Level 1 hurdles (most formidable hurdles—show-stoppers if not properly addressed)
1.1 Coordinated growth of supply and demand Logistical X X X X
1.2 RFS: unpredictability leads to investment uncertainty Regulatory X X X
1.3 Misfueling legacy vehicles on HOF Behavioral X X X
1.4 Emissions certification: HOF is not currently a certification fuel Regulatory X
1.5 Fuel volatility regulations: volatility of E25 (with current blendstock)
would be too high, and therefore illegal Regulatory X
1.6 Fuel registration requirements: HOF is not an EPA-registered fuel Regulatory X X
1.7 CAFE Credits: Current calculation may not adequately reward HOFVs Regulatory X
1.8 Retailer investment requirements: cost of upgrading a retail station to
offer HOF Economic X
1.9 HOF pricing: problem if HOF price exceeds the price of regular gasoline Economic X X X X

17
Fuel Market Modeling
Where are the bottlenecks? 1. Current regulations that have not yet addressed HOF
o HOF registration, HOF certification fuel, continuation of RFS, and adjust future GHG/CAFE regulations to reward HOF
2. Fuel retailers’ investment in HOF equipment is limiting factor in most scenarios o Unless incentivized to invest, equipment cost is reduced, or if only
compatible equipment is sold in advance. In which case:
3. Construction rate of new biorefineries is limiting factor o Unless enough time passes to allow construction to catch up (circa 2025). In
which case:
4. HOF vehicle adoption is limiting factor
o Only in scenarios where adequate retailer investment has been made and biorefinery construction has caught up with demand (post 2025)
5. Feedstock availability and cost are not the limiting factors in any scenarios
Modeling results show potential for significant (≤30 billion gallons ethanol) HOF consumption in 2035 under the scenarios modeled
18
Bottom Line: Well-to-Wheels Greenhouse Gas Emission Benefits
Courtesy of Argonne National Laboratory
19
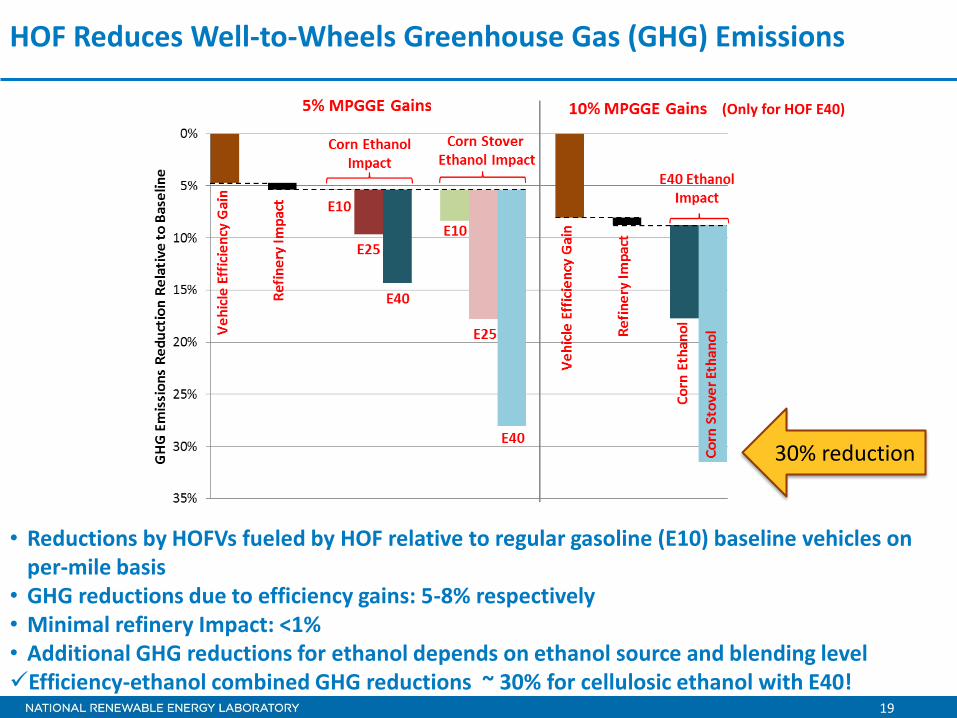
HOF Reduces Well-to-Wheels Greenhouse Gas (GHG) Emissions
• Reductions by HOFVs fueled by HOF relative to regular gasoline (E10) baseline vehicles on per-mile basis
• GHG reductions due to efficiency gains: 5-8% respectively • Minimal refinery Impact: <1% • Additional GHG reductions for ethanol depends on ethanol source and blending level Efficiency-ethanol combined GHG reductions ~ 30% for cellulosic ethanol with E40!
(Only for HOF E40)
30% reduction
20
Summary • Ethanol blended at 25 to 40% provides high octane number and
fuel/air charge cooling
• HOF enables design of more efficient engines
• Biofuel production and vehicle adoption models suggest potential HOF consumption of up to 30 billion gallons ethanol in 2035
• WTW GHG emission reductions range from 9-19% for corn ethanol HOF and 15-33% for cellulosic ethanol HOF
• There are challenges to introduction of ethanol HOF
• Underground storage tanks are likely compatible
• Fuel dispensing equipment will require upgrading
• Logistical issue with adding another fuel at retail
• Challenges of developing supply and demand in concert

Backup for Questions

22
Published Reports
Market Assessment: www.afdc.energy.gov/uploads/publication/high-octane_mid-level_ethanol_mkt_assessment.pdf Refueling and Terminal Infrastructure: http://www.nrel.gov/docs/fy15osti/61684.pdf Fuel Properties: http://www.nrel.gov/docs/fy15osti/63091.pdf Heat of vaporization http://dx.doi.org/10.1021/acs.energyfuels.5b00818 Low-cost blendstocks FFV Performance: http://info.ornl.gov/sites/publications/files/Pub54888.pdf Well-to-Wheels Analysis: https://greet.es.anl.gov/publication-high-octane-various-shares
23
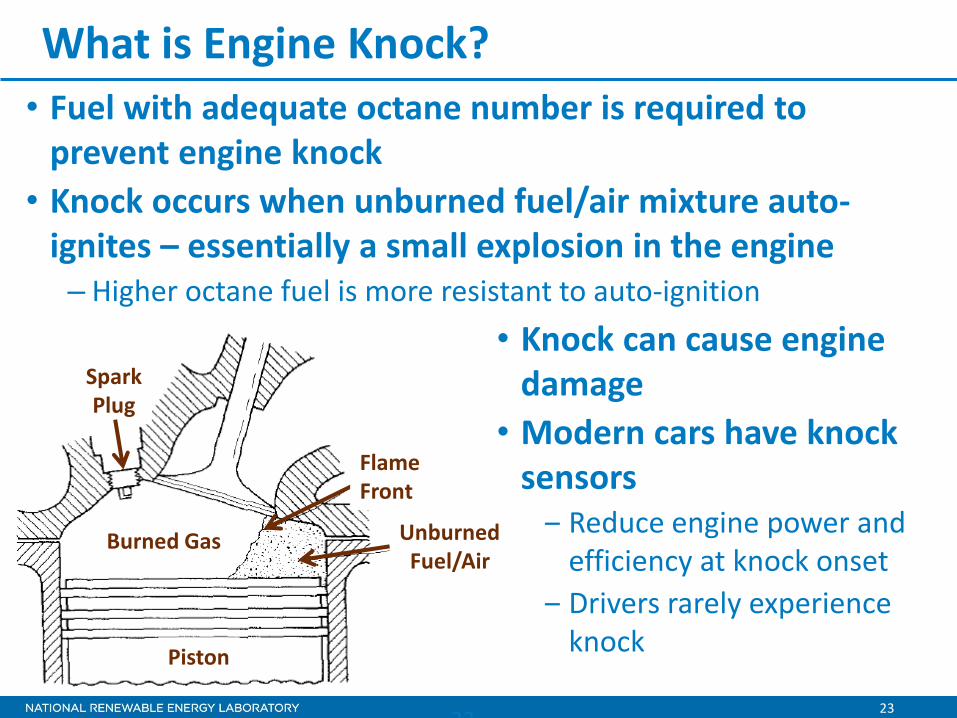
What is Engine Knock?
23
• Fuel with adequate octane number is required to prevent engine knock
• Knock occurs when unburned fuel/air mixture auto-ignites – essentially a small explosion in the engine – Higher octane fuel is more resistant to auto-ignition
Unburned Fuel/Air
Flame Front
Piston
Burned Gas
Spark Plug
• Knock can cause engine damage
• Modern cars have knock sensors ‒ Reduce engine power and
efficiency at knock onset
‒ Drivers rarely experience knock

24
Octane Number
• Pump octane is the average of research octane (RON) and motor octane (MON) – also known as (R + M)/2
– Two tests to cover the full range of engine operating conditions 80 years ago when this was introduced
• For modern technology engines, RON is the better measure of performance (knock prevention)
• There is no nationwide (ASTM) standard for minimum octane number in the United States
95 MINIMUM OCTANE RATING
(R+M)/2 METHOD
HIGH OCTANE FUEL PREMIUM PLUS REGULAR
RON 91 RON 93 RON 95 RON 100
MINIMUM OCTANE RATING (R+M)/2 METHOD
MINIMUM OCTANE RATING (R+M)/2 METHOD
MINIMUM OCTANE RATING (R+M)/2 METHOD
25
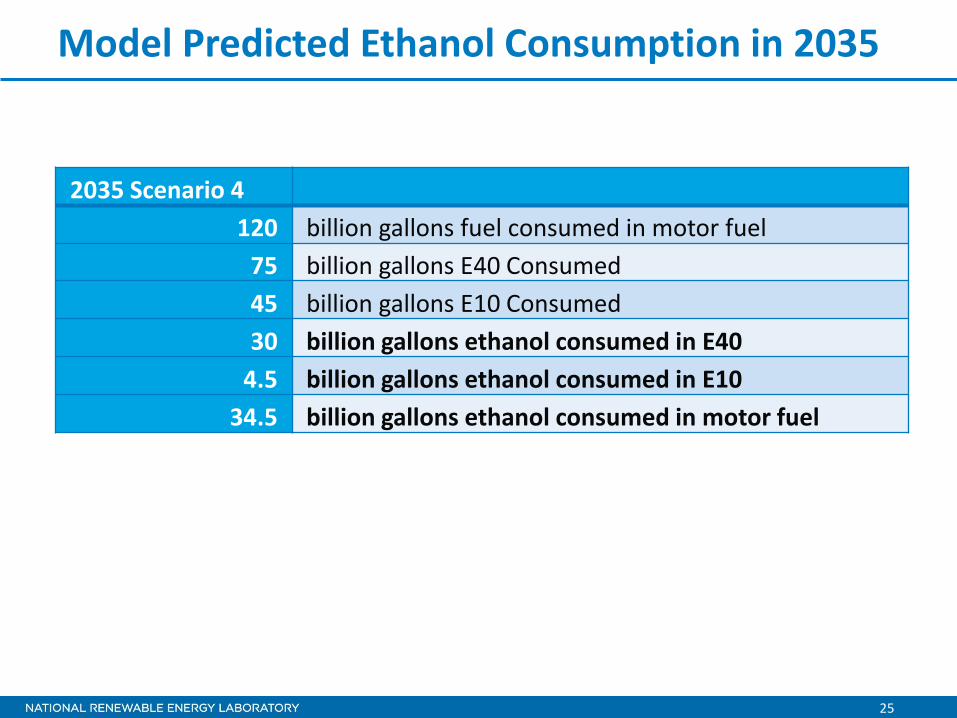
Model Predicted Ethanol Consumption in 2035
2035 Scenario 4
120 billion gallons fuel consumed in motor fuel
75 billion gallons E40 Consumed
45 billion gallons E10 Consumed
30 billion gallons ethanol consumed in E40
4.5 billion gallons ethanol consumed in E10
34.5 billion gallons ethanol consumed in motor fuel

26
Vehicle Adoption Modeling
• Grouped complementary curtailment strategies into 8 scenarios for simulation in consumer preference and biofuel production logistics models
• All scenarios achieved a substantial percentage (43%−79%) of the light-duty vehicle stock by 2035 (high octane fuel vehicles or HOFVs)
• More HOFVs are adopted if HOF is E40 (vs. E25) if they offer greater fuel cost savings and GHG benefit
Total Vehicles
Economy Cars E40
2018 Mandated Production E40
2018 Mandated Production E25
Economy Cars E25
Performance Vehs, E25 replaces midgrade
Consumer determined E25 + $2,500 incentive
Consumer determined E40
Expensive Vehs (E40 only)
Consumer determined E25