roadway human factors and behavioral safety in …barry kantowitz university of michigan report...
TRANSCRIPT

N O T I C E
The Federal Highway Administration provides high-quality information to serve Government,industry, and the public in a manner that promotes public understanding. Standards
and policies are used to ensure and maximize the quality, objectivity, utility, and integrityof its information. FHWA periodically reviews quality issues and adjusts its programs
and processes to ensure continuous quality improvement.
1. Report No.
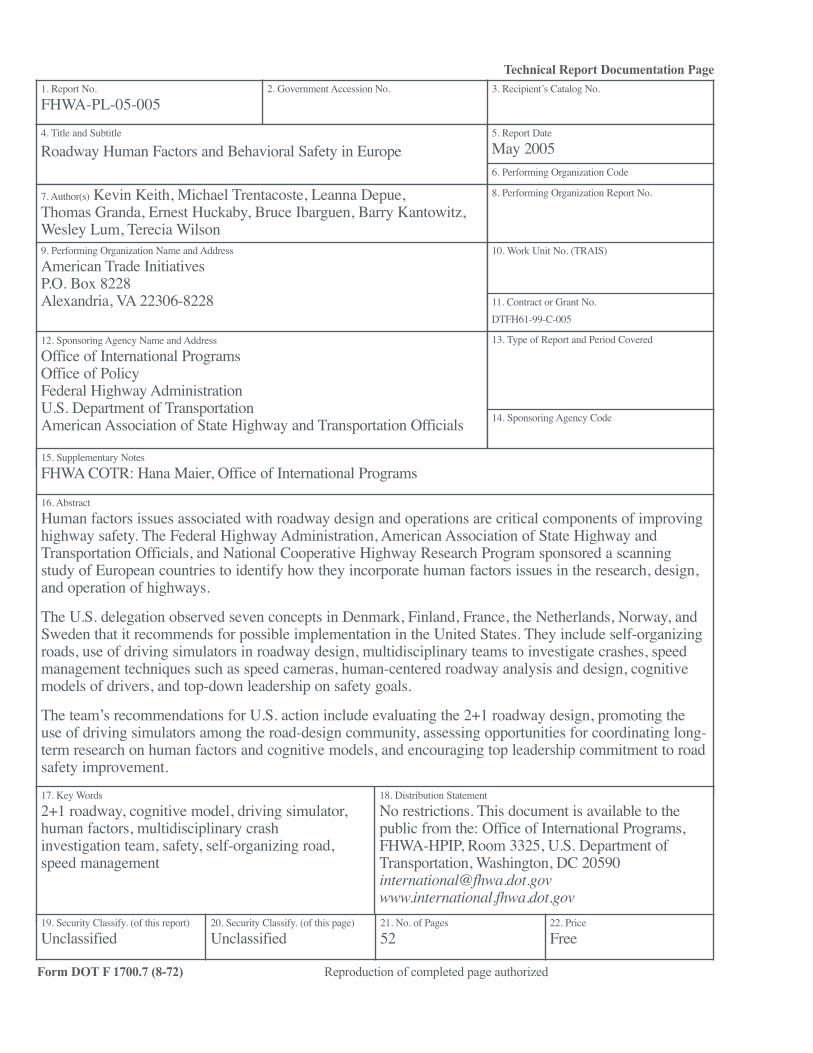
FHWA-PL-05-0052. Government Accession No. 3. Recipient’s Catalog No.
Technical Report Documentation Page
4. Title and Subtitle
Roadway Human Factors and Behavioral Safety in Europe
7. Author(s) Kevin Keith, Michael Trentacoste, Leanna Depue, Thomas Granda, Ernest Huckaby, Bruce Ibarguen, Barry Kantowitz,Wesley Lum, Terecia Wilson9. Performing Organization Name and Address
American Trade InitiativesP.O. Box 8228Alexandria, VA 22306-8228
12. Sponsoring Agency Name and Address
Office of International ProgramsOffice of PolicyFederal Highway AdministrationU.S. Department of TransportationAmerican Association of State Highway and Transportation Officials
5. Report Date
May 20056. Performing Organization Code
8. Performing Organization Report No.
10. Work Unit No. (TRAIS)
11. Contract or Grant No.
DTFH61-99-C-005
13. Type of Report and Period Covered
14. Sponsoring Agency Code
15. Supplementary Notes
FHWA COTR: Hana Maier, Office of International Programs
16. Abstract
Human factors issues associated with roadway design and operations are critical components of improvinghighway safety. The Federal Highway Administration, American Association of State Highway andTransportation Officials, and National Cooperative Highway Research Program sponsored a scanningstudy of European countries to identify how they incorporate human factors issues in the research, design,and operation of highways.
The U.S. delegation observed seven concepts in Denmark, Finland, France, the Netherlands, Norway, andSweden that it recommends for possible implementation in the United States. They include self-organizingroads, use of driving simulators in roadway design, multidisciplinary teams to investigate crashes, speedmanagement techniques such as speed cameras, human-centered roadway analysis and design, cognitivemodels of drivers, and top-down leadership on safety goals.
The team’s recommendations for U.S. action include evaluating the 2+1 roadway design, promoting theuse of driving simulators among the road-design community, assessing opportunities for coordinating long-term research on human factors and cognitive models, and encouraging top leadership commitment to roadsafety improvement.
17. Key Words
2+1 roadway, cognitive model, driving simulator,human factors, multidisciplinary crash investigation team, safety, self-organizing road,speed management
18. Distribution Statement
No restrictions. This document is available to thepublic from the: Office of International Programs,FHWA-HPIP, Room 3325, U.S. Department ofTransportation, Washington, DC [email protected]
19. Security Classify. (of this report)
Unclassified20. Security Classify. (of this page)
Unclassified21. No. of Pages
5222. Price
Free
Form DOT F 1700.7 (8-72) Reproduction of completed page authorized

Roadway HumanFactors and BehavioralSafety in Europe
Prepared by the International Scanning Study Team:
Kevin KeithMissouri DOTCo-chair
Michael TrentacosteFHWACo-chair
Leanna DepueCentral Missouri State University
Thomas GrandaFHWA
Ernest HuckabyFHWA
Bruce IbarguenMaine DOT
Barry KantowitzUniversity of MichiganReport Facilitator
Wesley LumCalifornia DOT
Terecia WilsonSouth Carolina DOT
andAmerican Trade Initiatives, Inc.
LGB & Associates, Inc.
forFederal Highway Administration, U.S. Department of Transportation
American Association of State Highway and Transportation Officials
National Cooperative Highway Research Program (Panel 20-36) of the Transportation Research Board
May 2005
The Federal Highway Administration’s (FHWA)Technology Exchange Program assesses and evaluates innovative foreign technologies and practices that could significantly benefit U.S. highway transportation systems. This
approach allows for advanced technology to be adapted and put into practice much more efficiently without spending scarce research funds to recreate advances already developed by other countries.
The main channel for accessing foreign innovations is theInternational Technology Scanning Program. The program isundertaken jointly with the American Association of StateHighway and Transportation Officials (AASHTO) and its Special Committee on International Activity Coordination in cooperation with the Transportation Research Board’sNational Cooperative Highway Research Program Project 20-36 on “Highway Research and Technology—InternationalInformation Sharing,” the private sector, and academia.
FHWA and AASHTO jointly determine priority topics for teamsof U.S. experts to study. Teams in the specific areas being investigated are formed and sent to countries where significantadvances and innovations have been made in technology, management practices, organizational structure, program delivery, and financing. Scanning teams usually include repre-sentatives from FHWA, State departments of transportation,local governments, transportation trade and research groups,the private sector, and academia.
iv H U M A N F A C T O R S A N D B E H A V I O R A L S A F E T Y I N E U R O P E
After a scan is completed, team members evaluate findings anddevelop comprehensive reports, including recommendations forfurther research and pilot projects to verify the value of adaptinginnovations for U.S. use. Scan reports, as well as the results ofpilot programs and research, are circulated throughout thecountry to State and local transportation officials and the privatesector. Since 1990, FHWA has organized more than 60 interna-tional scans and disseminated findings nationwide on topicssuch as pavements, bridge construction and maintenance, contracting, intermodal transport, organizational management,winter road maintenance, safety, intelligent transportation systems, planning, and policy.
The International Technology Scanning Program has resulted insignificant improvements and savings in road program technolo-gies and practices throughout the United States. In some cases,scan studies have facilitated joint research and technology-sharingprojects with international counterparts, further conservingresources and advancing the state of the art. Scan studies havealso exposed transportation professionals to remarkable advance-ments and inspired implementation of hundreds of innovations.The result: large savings of research dollars and time, as well assignificant improvements in the Nation’s transportation system.
For a complete list of International Technology Scanning Program topics and to order free copies of the reports, please see the list contained in this publication and at www. international.fhwa.dot.gov, or e-mail [email protected]. �
FHWA InternationalTechnology ExchangeProgram
v
FHWA InternationalTechnologyExchange ReportsInternational Technology Scanning Program:Bringing Global Innovations to U.S. Highways
SafetyRoadway Human Factors and Behavioral Safety in Europe(2005)
Traffic Safety Information Systems in Europe and Australia(2004)
Signalized Intersection Safety in Europe (2003)
Managing and Organizing Comprehensive Highway Safety inEurope (2003)
European Road Lighting Technologies (2001)
Commercial Vehicle Safety, Technology, and Practice in Europe (2000)
Methods and Procedures to Reduce Motorist Delays in European Work Zones (2000)
Innovative Traffic Control Technology and Practice in Europe (1999)
Road Safety Audits—Final Report and Case Studies (1997)
Speed Management and Enforcement Technology: Europe andAustralia (1996)
Safety Management Practices in Japan, Australia, and New Zealand (1995)
Pedestrian and Bicycle Safety in England, Germany, and the Netherlands (1994)
Planning and EnvironmentTransportation Performance Measures in Australia, Canada,Japan, and New Zealand (2004)
European Right-of-Way and Utilities Best Practices (2002)
Geometric Design Practices for European Roads (2002)
Wildlife Habitat Connectivity Across European Highways (2002)
Sustainable Transportation Practices in Europe (2001)
Recycled Materials In European Highway Environments (1999)
European Intermodal Programs: Planning, Policy, and Technology (1999)
National Travel Surveys (1994)
Policy and InformationEuropean Practices in Transportation Workforce Development(2003)
Intelligent Transportation Systems and Winter Operations inJapan (2003)
Emerging Models for Delivering Transportation Programs andServices (1999)
National Travel Surveys (1994)
All publications are available on the Internet at www.international.fhwa.dot.gov.
Acquiring Highway Transportation Information from Abroad(1994)
International Guide to Highway Transportation Information(1994)
International Contract Administration Techniques for Quality Enhancement (1994)
European Intermodal Programs: Planning, Policy, and Technology (1994)
OperationsSuperior Materials, Advanced Test Methods, and Specificationsin Europe (2004)
Freight Transportation: The Latin American Market (2003)
Meeting 21st Century Challenges of System PerformanceThrough Better Operations (2003)
Traveler Information Systems in Europe (2003)
Freight Transportation: The European Market (2002)
European Road Lighting Technologies (2001)
Methods and Procedures to Reduce Motorist Delays in European Work Zones (2000)
Innovative Traffic Control Technology and Practice in Europe (1999)
European Winter Service Technology (1998)
Traffic Management and Traveler Information Systems (1997)
European Traffic Monitoring (1997)
Highway/Commercial Vehicle Interaction (1996)
Winter Maintenance Technology and Practices—Learning from Abroad (1995)
Advanced Transportation Technology (1994)
Snowbreak Forest Book—Highway Snowstorm CountermeasureManual (1990)
Infrastructure—GeneralEuropean Practices in Transportation Workforce Development(2003)
Contract Administration: Technology and Practice in Europe (2002)
European Road Lighting Technologies (2001)
Geometric Design Practices for European Roads (2001)
Geotechnical Engineering Practices in Canada and Europe(1999)
Geotechnology—Soil Nailing (1993)
Infrastructure—PavementsPavement Preservation Technology in France, South Africa, and Australia (2003)
Recycled Materials In European Highway Environments (1999)
South African Pavement and Other Highway Technologies andPractices (1997)
Highway/Commercial Vehicle Interaction (1996)
European Concrete Highways (1992)
European Asphalt Technology (1990)
Infrastructure—BridgesPrefabricated Bridge Elements and Systems in Japan and Europe(2005)
Bridge Preservation and Maintenance in Europe and SouthAfrica (2005)
Performance of Concrete Segmental and Cable-Stayed Bridges in Europe (2001)
Steel Bridge Fabrication Technologies in Europe and Japan(2001)
European Practices for Bridge Scour and Stream InstabilityCountermeasures (1999)
Advanced Composites in Bridges in Europe and Japan (1997)
Asian Bridge Structures (1997)
Bridge Maintenance Coatings (1997)
Northumberland Strait Crossing Project (1996)
European Bridge Structures (1995)
vi H U M A N F A C T O R S A N D B E H A V I O R A L S A F E T Y I N E U R O P E
vii
Abbreviations andAcronymsAASHTO American Association of State Highway and Transportation Officials
COSMODRIVE Cognitive Simulation Model of the Driver
DOT Department of Transportation
DTF Danish Transport Research Institute
EC European Community
EU European Union
FHWA Federal Highway Administration
GPS Global positioning system
HF Human factors
HUMANIST HUMAN-centered design for Information Society Technologies
IHSDM Interactive Highway Safety Design Model
ITS Intelligent transportation system
NCHRP National Cooperative Highway Research Program
INRETS French National Institute for Transport and Safety
SINTEF Foundation of Scientific and Industrial Research at the Norwegian Institute of Technology
SWOV Netherlands Institute of Road Safety Research
TNO Netherlands Organization for Applied Scientific Research
VALT Finnish Motor Insurers’ Centre
VTI Swedish National Road and Transport Research Institute
VTT Technical Research Centre of Finland
viii H U M A N F A C T O R S A N D B E H A V I O R A L S A F E T Y I N E U R O P E
2
4
7
EXECUTIVE SUMMARY . . . . . . . . . . . . . . . . . . . . . . . . . . . . . . . . . . . . .xi
Panel Composition . . . . . . . . . . . . . . . . . . . . . . . . . . . . . . . . . . . . . . . . . . . . . . . . . . .xi
Sites Visited . . . . . . . . . . . . . . . . . . . . . . . . . . . . . . . . . . . . . . . . . . . . . . . . . . . . . . . . .xi
Key Findings . . . . . . . . . . . . . . . . . . . . . . . . . . . . . . . . . . . . . . . . . . . . . . . . . . . . . . . .xi
Implementation . . . . . . . . . . . . . . . . . . . . . . . . . . . . . . . . . . . . . . . . . . . . . . . . . . . . .xiv
CHAPTER 1 | INTRODUCTION . . . . . . . . . . . . . . . . . . . . . . . . . . . . . . . . .1
Panel Composition . . . . . . . . . . . . . . . . . . . . . . . . . . . . . . . . . . . . . . . . . . . . . . . . . . . .1
Sites Visited . . . . . . . . . . . . . . . . . . . . . . . . . . . . . . . . . . . . . . . . . . . . . . . . . . . . . . . . .1
Key Findings . . . . . . . . . . . . . . . . . . . . . . . . . . . . . . . . . . . . . . . . . . . . . . . . . . . . . . . . .2
CHAPTER 2 | SELF-ORGANIZING ROADS . . . . . . . . . . . . . . . . . . . . . . .3
2+1 Roadway Design . . . . . . . . . . . . . . . . . . . . . . . . . . . . . . . . . . . . . . . . . . . . . . . . . .4
Urban Design . . . . . . . . . . . . . . . . . . . . . . . . . . . . . . . . . . . . . . . . . . . . . . . . . . . . . . . .5
CHAPTER 3 | DRIVING SIMULATORS:ROADWAY DESIGN AND VISUALIZATION . . . . . . . . . . . . . . . . . . . . . .6
Laerdal Tunnel Project . . . . . . . . . . . . . . . . . . . . . . . . . . . . . . . . . . . . . . . . . . . . . . . . .6
Stockholm Ring Road . . . . . . . . . . . . . . . . . . . . . . . . . . . . . . . . . . . . . . . . . . . . . . . . . .8
Traffic Systems Studies . . . . . . . . . . . . . . . . . . . . . . . . . . . . . . . . . . . . . . . . . . . . . . . . .8
Validity . . . . . . . . . . . . . . . . . . . . . . . . . . . . . . . . . . . . . . . . . . . . . . . . . . . . . . . . . . . . .9
Influence of Fog on Driving Behavior . . . . . . . . . . . . . . . . . . . . . . . . . . . . . . . . . . . .10
Simulator Fidelity . . . . . . . . . . . . . . . . . . . . . . . . . . . . . . . . . . . . . . . . . . . . . . . . . . . .10
CHAPTER 4 | MULTIDISCIPLINARY TEAMS . . . . . . . . . . . . . . . . . . . . .12
VALT 2003 Method . . . . . . . . . . . . . . . . . . . . . . . . . . . . . . . . . . . . . . . . . . . . . . . . . .12
CHAPTER 5 | SPEED MANAGEMENT . . . . . . . . . . . . . . . . . . . . . . . . . .14
Speed Cameras . . . . . . . . . . . . . . . . . . . . . . . . . . . . . . . . . . . . . . . . . . . . . . . . . . . . . .14
Variable Speed Limits . . . . . . . . . . . . . . . . . . . . . . . . . . . . . . . . . . . . . . . . . . . . . . . . .15
Intelligent Speed Adaptation . . . . . . . . . . . . . . . . . . . . . . . . . . . . . . . . . . . . . . . . . . .15
CHAPTER 6 | HUMAN-CENTERED ROADWAY ANALYSISAND DESIGN . . . . . . . . . . . . . . . . . . . . . . . . . . . . . . . . . . . . . . . . . . . .16
Contents
HUMANIST . . . . . . . . . . . . . . . . . . . . . . . . . . . . . . . . . . . . . . . . . . . . . . . . . . . . . . . .16
Children’s Pedestrian Behavior . . . . . . . . . . . . . . . . . . . . . . . . . . . . . . . . . . . . . . . . . .17
CHAPTER 7 | COGNITIVE MODELS . . . . . . . . . . . . . . . . . . . . . . . . . . .18
COSMODRIVE . . . . . . . . . . . . . . . . . . . . . . . . . . . . . . . . . . . . . . . . . . . . . . . . . . . . . .18
Driver Behavior Model . . . . . . . . . . . . . . . . . . . . . . . . . . . . . . . . . . . . . . . . . . . . . . . .19
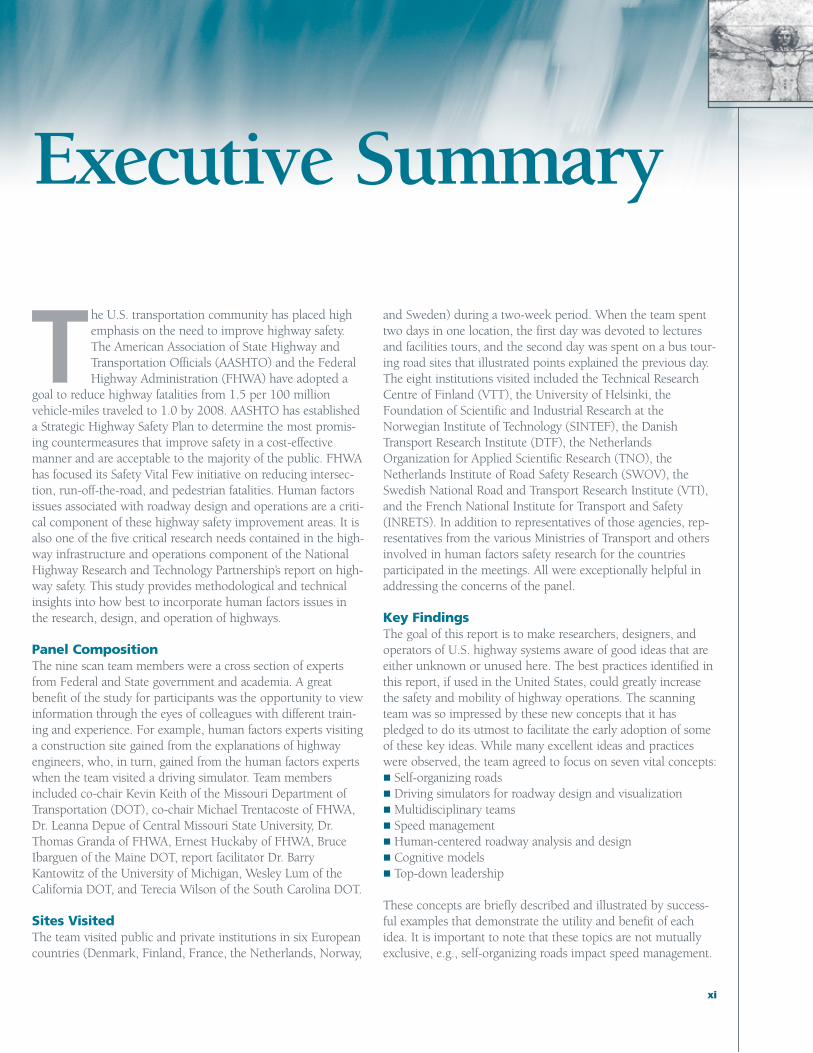
Hierarchical Driver Task-Cube Model . . . . . . . . . . . . . . . . . . . . . . . . . . . . . . . . . . . .20
CHAPTER 8 | TOP-DOWN LEADERSHIP . . . . . . . . . . . . . . . . . . . . . . . .21
Vision Zero . . . . . . . . . . . . . . . . . . . . . . . . . . . . . . . . . . . . . . . . . . . . . . . . . . . . . . . . .21
Sustainable Safety . . . . . . . . . . . . . . . . . . . . . . . . . . . . . . . . . . . . . . . . . . . . . . . . . . . .22
Executive Direction . . . . . . . . . . . . . . . . . . . . . . . . . . . . . . . . . . . . . . . . . . . . . . . . . .22
CHAPTER 9 | IMPLEMENTATION . . . . . . . . . . . . . . . . . . . . . . . . . . . . .23
Self-Organizing Roads and Evaluation of 2+1 Roadway Design . . . . . . . . . . . . . . . .23
Driving Simulators: Roadway Design and Visualization . . . . . . . . . . . . . . . . . . . . . .23
Multidisciplinary Crash Investigation Teams . . . . . . . . . . . . . . . . . . . . . . . . . . . . . . .23
Human-Centered Roadway Analysis and Design . . . . . . . . . . . . . . . . . . . . . . . . . . . .23
Top-Down Leadership Commitment . . . . . . . . . . . . . . . . . . . . . . . . . . . . . . . . . . . . .23
Speed Management . . . . . . . . . . . . . . . . . . . . . . . . . . . . . . . . . . . . . . . . . . . . . . . . . .23
APPENDIX A | SCAN STUDY SITE INFORMATION . . . . . . . . . . . . . . .24
APPENDIX B | SCAN STUDY SITE AGENDAS . . . . . . . . . . . . . . . . . . .29
APPENDIX C | TEAM MEMBERS . . . . . . . . . . . . . . . . . . . . . . . . . . . . .36
APPENDIX D | AMPLIFYING QUESTIONS . . . . . . . . . . . . . . . . . . . . . .37
LIST OF FIGURES AND TABLES
Figures
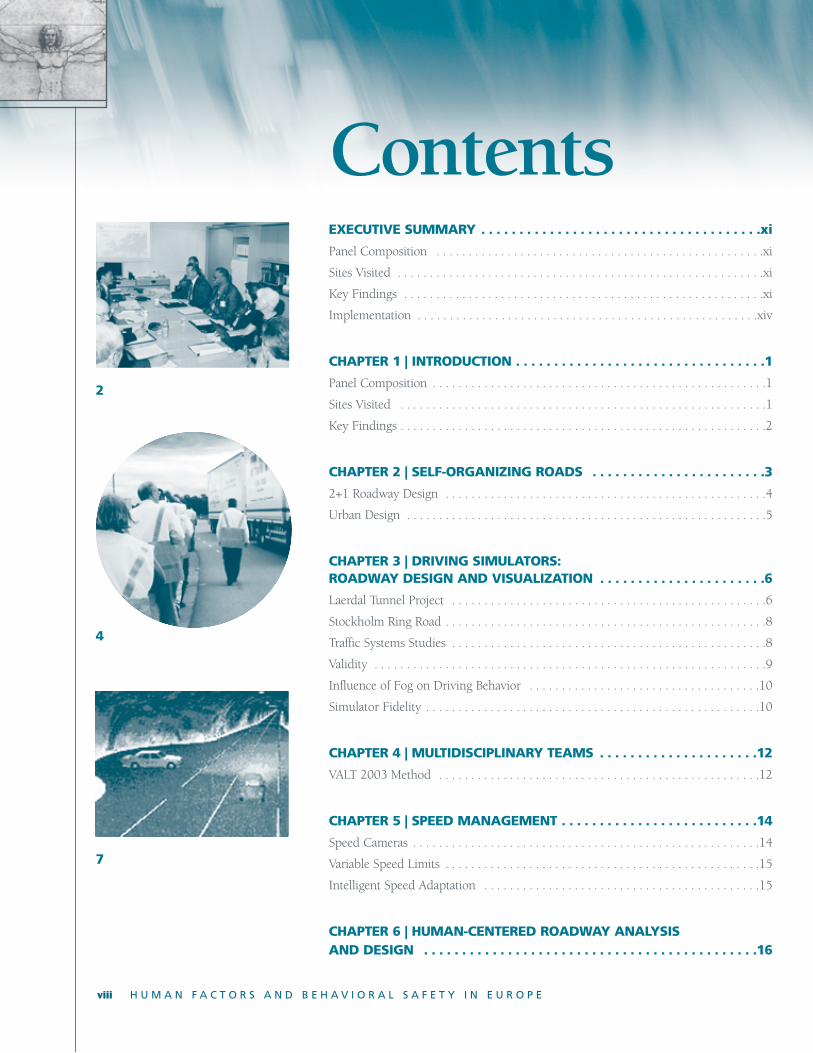
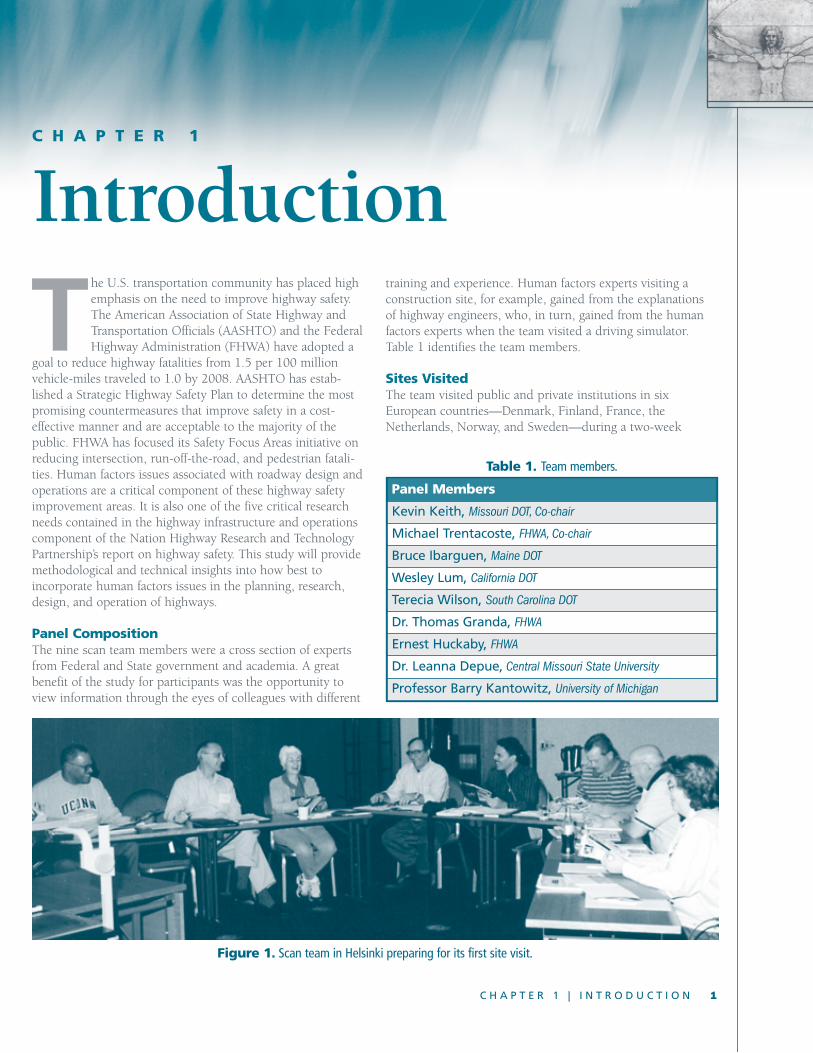
Figure 1. Scan team in Helsinki preparing for first site visit . . . . . . . . . . . . . . . . . . . .1
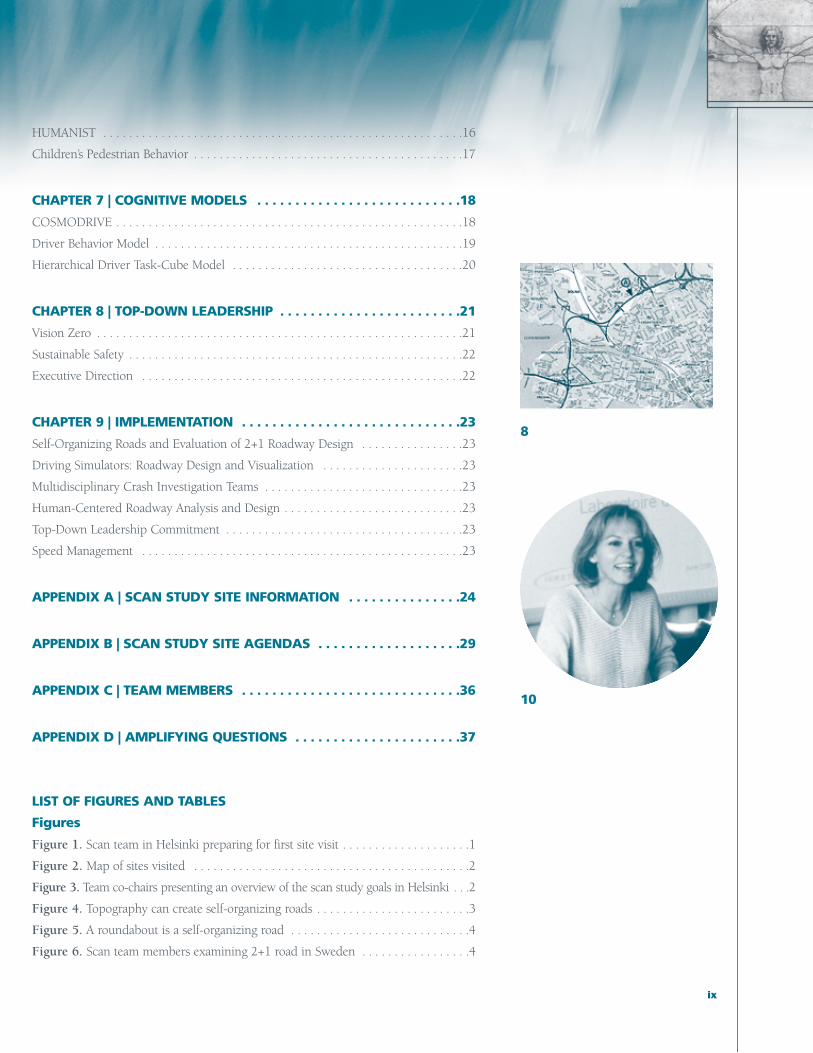
Figure 2. Map of sites visited . . . . . . . . . . . . . . . . . . . . . . . . . . . . . . . . . . . . . . . . . . .2
Figure 3. Team co-chairs presenting an overview of the scan study goals in Helsinki . . .2
Figure 4. Topography can create self-organizing roads . . . . . . . . . . . . . . . . . . . . . . . .3
Figure 5. A roundabout is a self-organizing road . . . . . . . . . . . . . . . . . . . . . . . . . . . .4
Figure 6. Scan team members examining 2+1 road in Sweden . . . . . . . . . . . . . . . . .4
ix
8
10
x H U M A N F A C T O R S A N D B E H A V I O R A L S A F E T Y I N E U R O P E
Figure 7. 2+1 roadway. Note the cable barrier and sign indicating thelength of the passing lane . . . . . . . . . . . . . . . . . . . . . . . . . . . . . . . . . . . . . . . . . . . . . . .4
Figure 8. 2+1 cable barrier. The post is easily removed for maintenance . . . . . . . . . .5
Figure 9. Proposed standard 2+1-cable barrier cross section withinexisting 13-m (14.2-yd) roadway . . . . . . . . . . . . . . . . . . . . . . . . . . . . . . . . . . . . . . . . .5
Figure 10. Example of road narrowing in the Netherlands . . . . . . . . . . . . . . . . . . . .5
Figure 11. The Laerdal Tunnel project . . . . . . . . . . . . . . . . . . . . . . . . . . . . . . . . . . . .6
Figure 12. Alternate lighting models for the Laerdal Tunnel . . . . . . . . . . . . . . . . . . .7
Figure 13. Improved design of rock cavern and roundabout increasedsafety and comfort . . . . . . . . . . . . . . . . . . . . . . . . . . . . . . . . . . . . . . . . . . . . . . . . . . . .7
Figure 14. Rock caverns . . . . . . . . . . . . . . . . . . . . . . . . . . . . . . . . . . . . . . . . . . . . . . .7
Figure 15. Ernest Huckaby, Tore Knudsen, and Barry Kantowitz discussSINTEF’s mission . . . . . . . . . . . . . . . . . . . . . . . . . . . . . . . . . . . . . . . . . . . . . . . . . . . . .7
Figure 16. Gunnar Jenssen explains self-organizing roads . . . . . . . . . . . . . . . . . . . . .7
Figure 17. Scan team members Tom Granda and Leanna Depue ride in the SINTEF driving simulator . . . . . . . . . . . . . . . . . . . . . . . . . . . . . . . . . . . . . . . . .7
Figure 18. The Stockholm Ring Road—25-km (15.5 mi) tunnels with underground junctions . . . . . . . . . . . . . . . . . . . . . . . . . . . . . . . . . . . . . . . . . . . . .8
Figure 19. VTI’s driving simulator hall . . . . . . . . . . . . . . . . . . . . . . . . . . . . . . . . . . . .8
Figure 20. The virtual tunnel defined by combining data from several data sources: drawings, photographs, models, and discussions . . . . . . . . . . . . . . . . . .8
Figure 21. Researcher Selma de Ridder explains driver behavior . . . . . . . . . . . . . . . .9
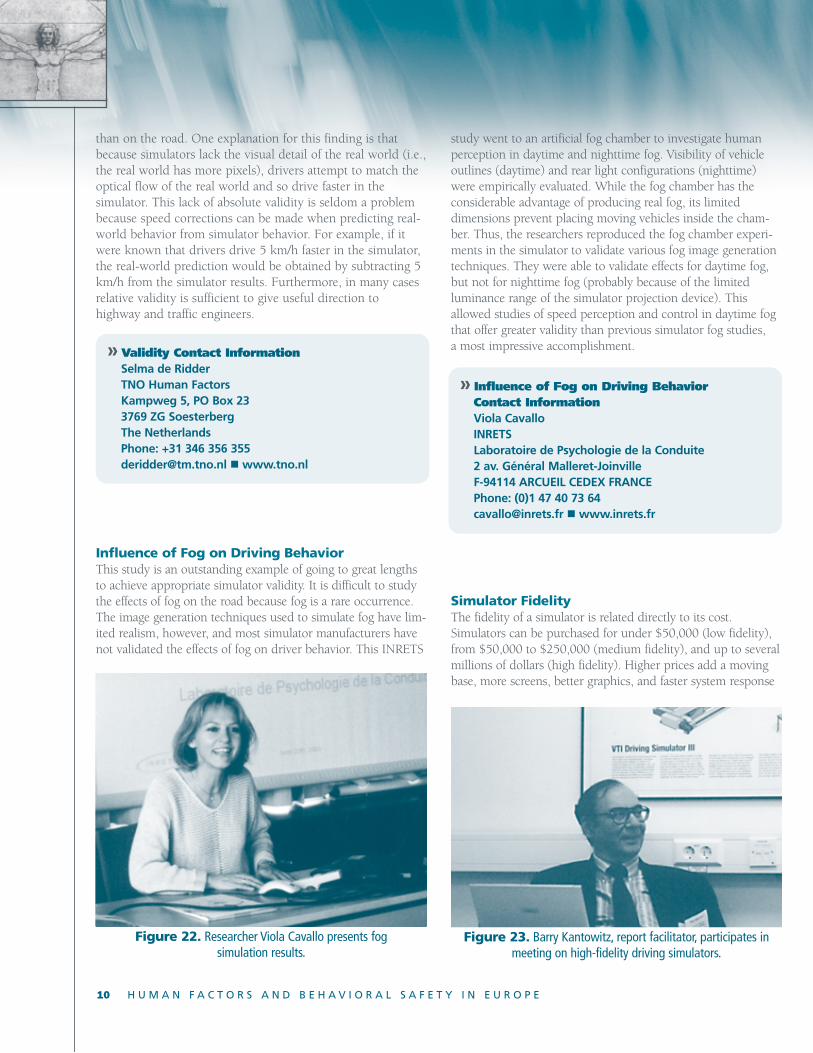
Figure 22. Researcher Viola Cavallo presents fog simulation results . . . . . . . . . . . .10
Figure 23. Barry Kantowitz, report facilitator, participates in meeting on driving simulators . . . . . . . . . . . . . . . . . . . . . . . . . . . . . . . . . . . . . . . . . . . . . . . . .10
Figure 24. VTI Driving Simulator III . . . . . . . . . . . . . . . . . . . . . . . . . . . . . . . . . . . .11
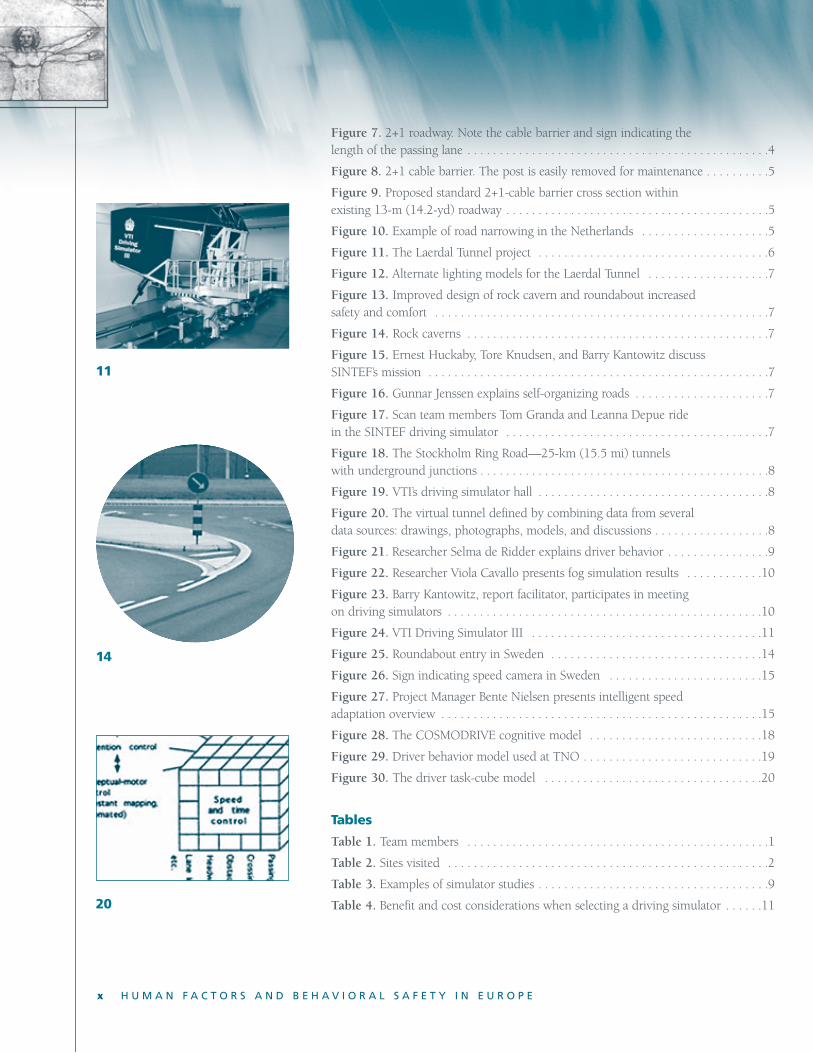
Figure 25. Roundabout entry in Sweden . . . . . . . . . . . . . . . . . . . . . . . . . . . . . . . . .14
Figure 26. Sign indicating speed camera in Sweden . . . . . . . . . . . . . . . . . . . . . . . .15
Figure 27. Project Manager Bente Nielsen presents intelligent speed adaptation overview . . . . . . . . . . . . . . . . . . . . . . . . . . . . . . . . . . . . . . . . . . . . . . . . . .15
Figure 28. The COSMODRIVE cognitive model . . . . . . . . . . . . . . . . . . . . . . . . . . .18
Figure 29. Driver behavior model used at TNO . . . . . . . . . . . . . . . . . . . . . . . . . . . .19
Figure 30. The driver task-cube model . . . . . . . . . . . . . . . . . . . . . . . . . . . . . . . . . .20
Tables
Table 1. Team members . . . . . . . . . . . . . . . . . . . . . . . . . . . . . . . . . . . . . . . . . . . . . . .1
Table 2. Sites visited . . . . . . . . . . . . . . . . . . . . . . . . . . . . . . . . . . . . . . . . . . . . . . . . . .2
Table 3. Examples of simulator studies . . . . . . . . . . . . . . . . . . . . . . . . . . . . . . . . . . . .9
Table 4. Benefit and cost considerations when selecting a driving simulator . . . . . .11
11
14
20
Executive Summary
The U.S. transportation community has placed highemphasis on the need to improve highway safety.The American Association of State Highway andTransportation Officials (AASHTO) and the FederalHighway Administration (FHWA) have adopted a
goal to reduce highway fatalities from 1.5 per 100 million vehicle-miles traveled to 1.0 by 2008. AASHTO has establisheda Strategic Highway Safety Plan to determine the most promis-ing countermeasures that improve safety in a cost-effective manner and are acceptable to the majority of the public. FHWAhas focused its Safety Vital Few initiative on reducing intersec-tion, run-off-the-road, and pedestrian fatalities. Human factorsissues associated with roadway design and operations are a criti-cal component of these highway safety improvement areas. It isalso one of the five critical research needs contained in the high-way infrastructure and operations component of the NationalHighway Research and Technology Partnership’s report on high-way safety. This study provides methodological and technicalinsights into how best to incorporate human factors issues inthe research, design, and operation of highways.
Panel CompositionThe nine scan team members were a cross section of expertsfrom Federal and State government and academia. A great benefit of the study for participants was the opportunity to viewinformation through the eyes of colleagues with different train-ing and experience. For example, human factors experts visitinga construction site gained from the explanations of highwayengineers, who, in turn, gained from the human factors expertswhen the team visited a driving simulator. Team membersincluded co-chair Kevin Keith of the Missouri Department ofTransportation (DOT), co-chair Michael Trentacoste of FHWA,Dr. Leanna Depue of Central Missouri State University, Dr.Thomas Granda of FHWA, Ernest Huckaby of FHWA, BruceIbarguen of the Maine DOT, report facilitator Dr. BarryKantowitz of the University of Michigan, Wesley Lum of theCalifornia DOT, and Terecia Wilson of the South Carolina DOT.
Sites VisitedThe team visited public and private institutions in six Europeancountries (Denmark, Finland, France, the Netherlands, Norway,
xi
and Sweden) during a two-week period. When the team spenttwo days in one location, the first day was devoted to lecturesand facilities tours, and the second day was spent on a bus tour-ing road sites that illustrated points explained the previous day.The eight institutions visited included the Technical ResearchCentre of Finland (VTT), the University of Helsinki, theFoundation of Scientific and Industrial Research at theNorwegian Institute of Technology (SINTEF), the DanishTransport Research Institute (DTF), the NetherlandsOrganization for Applied Scientific Research (TNO), theNetherlands Institute of Road Safety Research (SWOV), theSwedish National Road and Transport Research Institute (VTI),and the French National Institute for Transport and Safety(INRETS). In addition to representatives of those agencies, rep-resentatives from the various Ministries of Transport and othersinvolved in human factors safety research for the countries participated in the meetings. All were exceptionally helpful inaddressing the concerns of the panel.
Key FindingsThe goal of this report is to make researchers, designers, andoperators of U.S. highway systems aware of good ideas that areeither unknown or unused here. The best practices identified inthis report, if used in the United States, could greatly increasethe safety and mobility of highway operations. The scanningteam was so impressed by these new concepts that it haspledged to do its utmost to facilitate the early adoption of someof these key ideas. While many excellent ideas and practiceswere observed, the team agreed to focus on seven vital concepts:� Self-organizing roads� Driving simulators for roadway design and visualization�Multidisciplinary teams� Speed management� Human-centered roadway analysis and design� Cognitive models� Top-down leadership
These concepts are briefly described and illustrated by success-ful examples that demonstrate the utility and benefit of eachidea. It is important to note that these topics are not mutuallyexclusive, e.g., self-organizing roads impact speed management.
xii H U M A N F A C T O R S A N D B E H A V I O R A L S A F E T Y I N E U R O P E
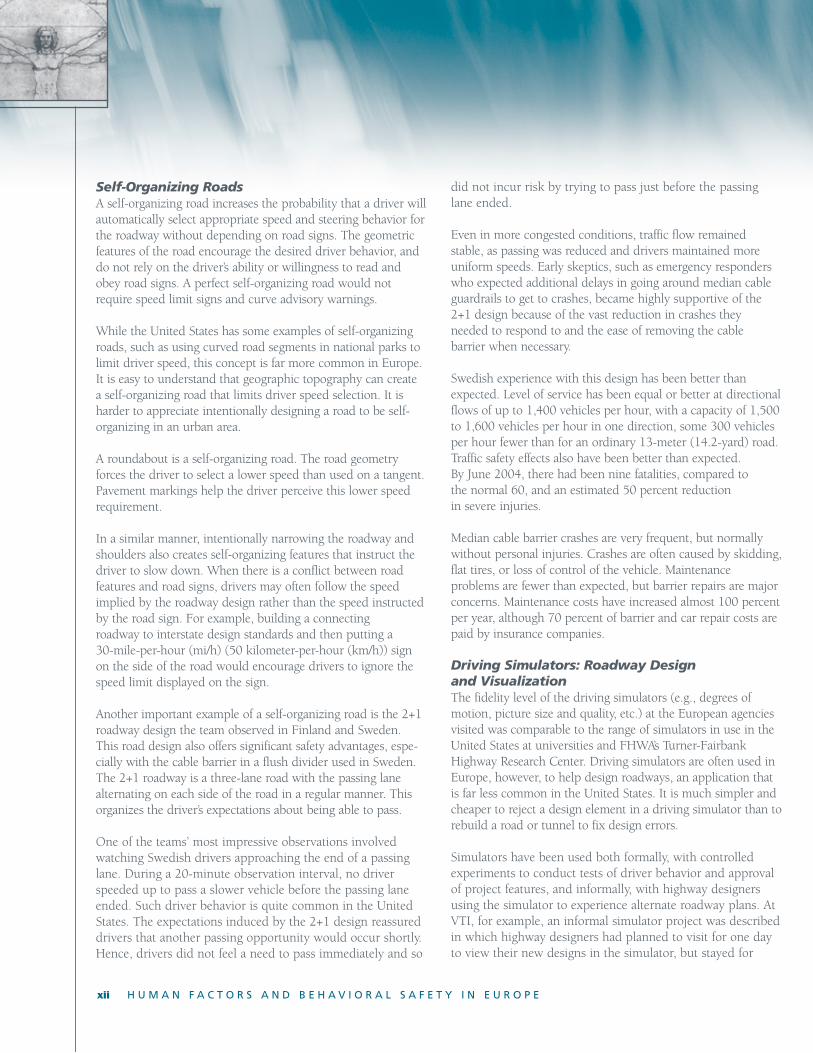
Self-Organizing RoadsA self-organizing road increases the probability that a driver willautomatically select appropriate speed and steering behavior forthe roadway without depending on road signs. The geometricfeatures of the road encourage the desired driver behavior, anddo not rely on the driver’s ability or willingness to read andobey road signs. A perfect self-organizing road would notrequire speed limit signs and curve advisory warnings.
While the United States has some examples of self-organizingroads, such as using curved road segments in national parks tolimit driver speed, this concept is far more common in Europe.It is easy to understand that geographic topography can create a self-organizing road that limits driver speed selection. It isharder to appreciate intentionally designing a road to be self-organizing in an urban area.
A roundabout is a self-organizing road. The road geometryforces the driver to select a lower speed than used on a tangent.Pavement markings help the driver perceive this lower speedrequirement.
In a similar manner, intentionally narrowing the roadway andshoulders also creates self-organizing features that instruct thedriver to slow down. When there is a conflict between road features and road signs, drivers may often follow the speedimplied by the roadway design rather than the speed instructedby the road sign. For example, building a connecting roadway to interstate design standards and then putting a 30-mile-per-hour (mi/h) (50 kilometer-per-hour (km/h)) signon the side of the road would encourage drivers to ignore thespeed limit displayed on the sign.
Another important example of a self-organizing road is the 2+1roadway design the team observed in Finland and Sweden.This road design also offers significant safety advantages, espe-cially with the cable barrier in a flush divider used in Sweden.The 2+1 roadway is a three-lane road with the passing lanealternating on each side of the road in a regular manner. Thisorganizes the driver’s expectations about being able to pass.
One of the teams’ most impressive observations involvedwatching Swedish drivers approaching the end of a passinglane. During a 20-minute observation interval, no driverspeeded up to pass a slower vehicle before the passing laneended. Such driver behavior is quite common in the UnitedStates. The expectations induced by the 2+1 design reassureddrivers that another passing opportunity would occur shortly.Hence, drivers did not feel a need to pass immediately and so
did not incur risk by trying to pass just before the passinglane ended.
Even in more congested conditions, traffic flow remained stable, as passing was reduced and drivers maintained moreuniform speeds. Early skeptics, such as emergency responderswho expected additional delays in going around median cableguardrails to get to crashes, became highly supportive of the2+1 design because of the vast reduction in crashes they needed to respond to and the ease of removing the cable barrier when necessary.
Swedish experience with this design has been better thanexpected. Level of service has been equal or better at directionalflows of up to 1,400 vehicles per hour, with a capacity of 1,500to 1,600 vehicles per hour in one direction, some 300 vehiclesper hour fewer than for an ordinary 13-meter (14.2-yard) road.Traffic safety effects also have been better than expected. By June 2004, there had been nine fatalities, compared to the normal 60, and an estimated 50 percent reduction in severe injuries.
Median cable barrier crashes are very frequent, but normallywithout personal injuries. Crashes are often caused by skidding,flat tires, or loss of control of the vehicle. Maintenance problems are fewer than expected, but barrier repairs are major concerns. Maintenance costs have increased almost 100 percentper year, although 70 percent of barrier and car repair costs arepaid by insurance companies.
Driving Simulators: Roadway Designand VisualizationThe fidelity level of the driving simulators (e.g., degrees ofmotion, picture size and quality, etc.) at the European agenciesvisited was comparable to the range of simulators in use in theUnited States at universities and FHWA’s Turner-FairbankHighway Research Center. Driving simulators are often used inEurope, however, to help design roadways, an application thatis far less common in the United States. It is much simpler andcheaper to reject a design element in a driving simulator than torebuild a road or tunnel to fix design errors.
Simulators have been used both formally, with controlledexperiments to conduct tests of driver behavior and approvalof project features, and informally, with highway designersusing the simulator to experience alternate roadway plans. AtVTI, for example, an informal simulator project was describedin which highway designers had planned to visit for one dayto view their new designs in the simulator, but stayed for
E X E C U T I V E S U M M A R Y xiii
three days and made several design changes based on theirsimulator experience.
An example of a formal evaluation of alternate designs by driv-ers was explained to the team at SINTEF in Norway. SINTEFwas asked to help design the world’s longest tunnel in westernNorway. Results showed that lighting strategies using blue, yel-low, and green lights increased driver safety and comfort in thetunnel. Changes in lighting every 2 km (1.2 mi) reduced driveranxiety. These design strategies have been successful, with highratings of driver comfort in the tunnel and no crashes. In addi-tion, the Laerdal project has won two European lightingawards.
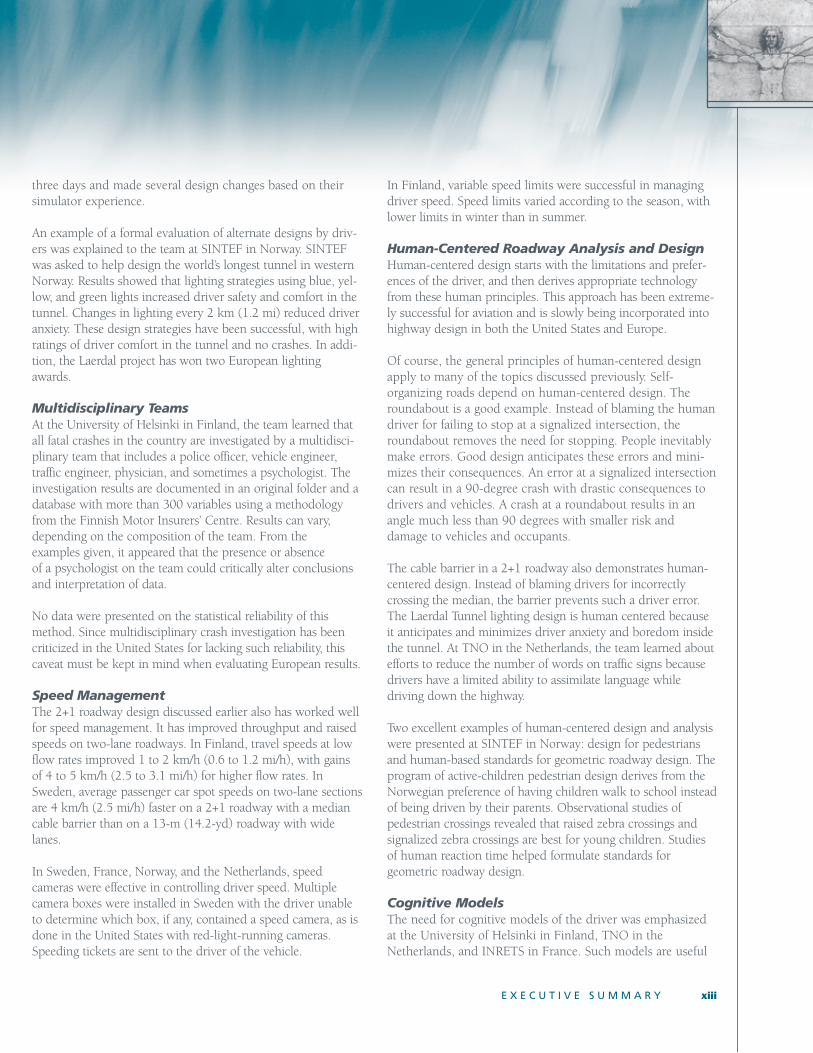
Multidisciplinary TeamsAt the University of Helsinki in Finland, the team learned thatall fatal crashes in the country are investigated by a multidisci-plinary team that includes a police officer, vehicle engineer, traffic engineer, physician, and sometimes a psychologist. Theinvestigation results are documented in an original folder and adatabase with more than 300 variables using a methodologyfrom the Finnish Motor Insurers’ Centre. Results can vary,depending on the composition of the team. From the examples given, it appeared that the presence or absence of a psychologist on the team could critically alter conclusionsand interpretation of data.
No data were presented on the statistical reliability of thismethod. Since multidisciplinary crash investigation has beencriticized in the United States for lacking such reliability, thiscaveat must be kept in mind when evaluating European results.
Speed ManagementThe 2+1 roadway design discussed earlier also has worked wellfor speed management. It has improved throughput and raisedspeeds on two-lane roadways. In Finland, travel speeds at lowflow rates improved 1 to 2 km/h (0.6 to 1.2 mi/h), with gainsof 4 to 5 km/h (2.5 to 3.1 mi/h) for higher flow rates. InSweden, average passenger car spot speeds on two-lane sectionsare 4 km/h (2.5 mi/h) faster on a 2+1 roadway with a mediancable barrier than on a 13-m (14.2-yd) roadway with widelanes.
In Sweden, France, Norway, and the Netherlands, speed cameras were effective in controlling driver speed. Multiplecamera boxes were installed in Sweden with the driver unableto determine which box, if any, contained a speed camera, as isdone in the United States with red-light-running cameras.Speeding tickets are sent to the driver of the vehicle.
In Finland, variable speed limits were successful in managingdriver speed. Speed limits varied according to the season, withlower limits in winter than in summer.
Human-Centered Roadway Analysis and DesignHuman-centered design starts with the limitations and prefer-ences of the driver, and then derives appropriate technologyfrom these human principles. This approach has been extreme-ly successful for aviation and is slowly being incorporated intohighway design in both the United States and Europe.
Of course, the general principles of human-centered designapply to many of the topics discussed previously. Self-organizing roads depend on human-centered design. Theroundabout is a good example. Instead of blaming the humandriver for failing to stop at a signalized intersection, theroundabout removes the need for stopping. People inevitablymake errors. Good design anticipates these errors and mini-mizes their consequences. An error at a signalized intersectioncan result in a 90-degree crash with drastic consequences todrivers and vehicles. A crash at a roundabout results in anangle much less than 90 degrees with smaller risk and damage to vehicles and occupants.
The cable barrier in a 2+1 roadway also demonstrates human-centered design. Instead of blaming drivers for incorrectlycrossing the median, the barrier prevents such a driver error.The Laerdal Tunnel lighting design is human centered becauseit anticipates and minimizes driver anxiety and boredom insidethe tunnel. At TNO in the Netherlands, the team learned aboutefforts to reduce the number of words on traffic signs becausedrivers have a limited ability to assimilate language while driving down the highway.
Two excellent examples of human-centered design and analysiswere presented at SINTEF in Norway: design for pedestriansand human-based standards for geometric roadway design. Theprogram of active-children pedestrian design derives from theNorwegian preference of having children walk to school insteadof being driven by their parents. Observational studies ofpedestrian crossings revealed that raised zebra crossings andsignalized zebra crossings are best for young children. Studiesof human reaction time helped formulate standards for geometric roadway design.
Cognitive ModelsThe need for cognitive models of the driver was emphasizedat the University of Helsinki in Finland, TNO in theNetherlands, and INRETS in France. Such models are useful
xiv H U M A N F A C T O R S A N D B E H A V I O R A L S A F E T Y I N E U R O P E
in several ways. They are part of microscopic traffic modelsthat can be validated by observing traffic flow. Indeed, thedriver models used for this purpose at INRETS are so detailedthat they are referred to as “nanoscopic” driver models.Cognitive models are also useful when implementing human-centered design and analysis. Instead of having to perform anew experiment to answer each new question, the modelitself can generate answers.
This model is written in Smalltalk, a computer language wellsuited for artificial intelligence applications. INRETS has a considerable financial investment in this model, which wasdeveloped over 10 years with a three-year break because ofother internal priorities. Only now are validation studies beingconducted for the model. This delay in validation illustrateshow important continuous funding is for high-risk, high-reward basic research. The team congratulates INRETS for seeking and funding such a long-term goal.
Top-Down LeadershipThe team was impressed with the coordination betweenresearch goals and the highest levels of government inEurope. The best example of this is Sweden’s Vision Zero. TheSwedish Parliament passed an act specifying that the country’slong-term traffic safety goal is zero fatalities. This provides
extremely clear direction to researchers and agencies responsi-ble for highway design and operations. Unlike the road safetyguiding philosophy in the United State that tolerates a certainnumber of fatalities and injuries on highways and mandatesonly a desired percentage decrease in death and destruction,Sweden has stated that no one should die on a Swedish road.SWOV in the Netherlands expressed similar goals. In France,road safety was a campaign issue in the national elections, andPresident Jacques Chirac has put major emphasis on roadsafety as a national priority. In general, Europe appears to beahead of the United States in directing drastic improvementsin roadway safety.
ImplementationWhile the team obtained many useful ideas, six specific topicswere selected as potential high-reward areas of opportunity:� Self-organizing roads� Driving simulators�Multidisciplinary crash investigation� Human-centered roadway analysis and design� Top-down leadership commitment� Speed management
More details can be found in the scan tourimplementation plan.
C H A P T E R 1 | I N T R O D U C T I O N 1
C H A P T E R 1
Introduction
Table 1. Team members.
Figure 1. Scan team in Helsinki preparing for its first site visit.
Panel Members
Kevin Keith, Missouri DOT, Co-chair
Michael Trentacoste, FHWA, Co-chair
Bruce Ibarguen, Maine DOT
Wesley Lum, California DOT
Terecia Wilson, South Carolina DOT
Dr. Thomas Granda, FHWA
Ernest Huckaby, FHWA
Dr. Leanna Depue, Central Missouri State University
Professor Barry Kantowitz, University of Michigan
training and experience. Human factors experts visiting a construction site, for example, gained from the explanations of highway engineers, who, in turn, gained from the human factors experts when the team visited a driving simulator.Table 1 identifies the team members.
Sites VisitedThe team visited public and private institutions in sixEuropean countries—Denmark, Finland, France, theNetherlands, Norway, and Sweden—during a two-week
The U.S. transportation community has placed highemphasis on the need to improve highway safety.The American Association of State Highway andTransportation Officials (AASHTO) and the FederalHighway Administration (FHWA) have adopted a
goal to reduce highway fatalities from 1.5 per 100 millionvehicle-miles traveled to 1.0 by 2008. AASHTO has estab-lished a Strategic Highway Safety Plan to determine the mostpromising countermeasures that improve safety in a cost-effective manner and are acceptable to the majority of thepublic. FHWA has focused its Safety Focus Areas initiative onreducing intersection, run-off-the-road, and pedestrian fatali-ties. Human factors issues associated with roadway design andoperations are a critical component of these highway safetyimprovement areas. It is also one of the five critical researchneeds contained in the highway infrastructure and operationscomponent of the Nation Highway Research and TechnologyPartnership’s report on highway safety. This study will providemethodological and technical insights into how best to incorporate human factors issues in the planning, research,design, and operation of highways.
Panel CompositionThe nine scan team members were a cross section of expertsfrom Federal and State government and academia. A greatbenefit of the study for participants was the opportunity toview information through the eyes of colleagues with different
2 H U M A N F A C T O R S A N D B E H A V I O R A L S A F E T Y I N E U R O P E
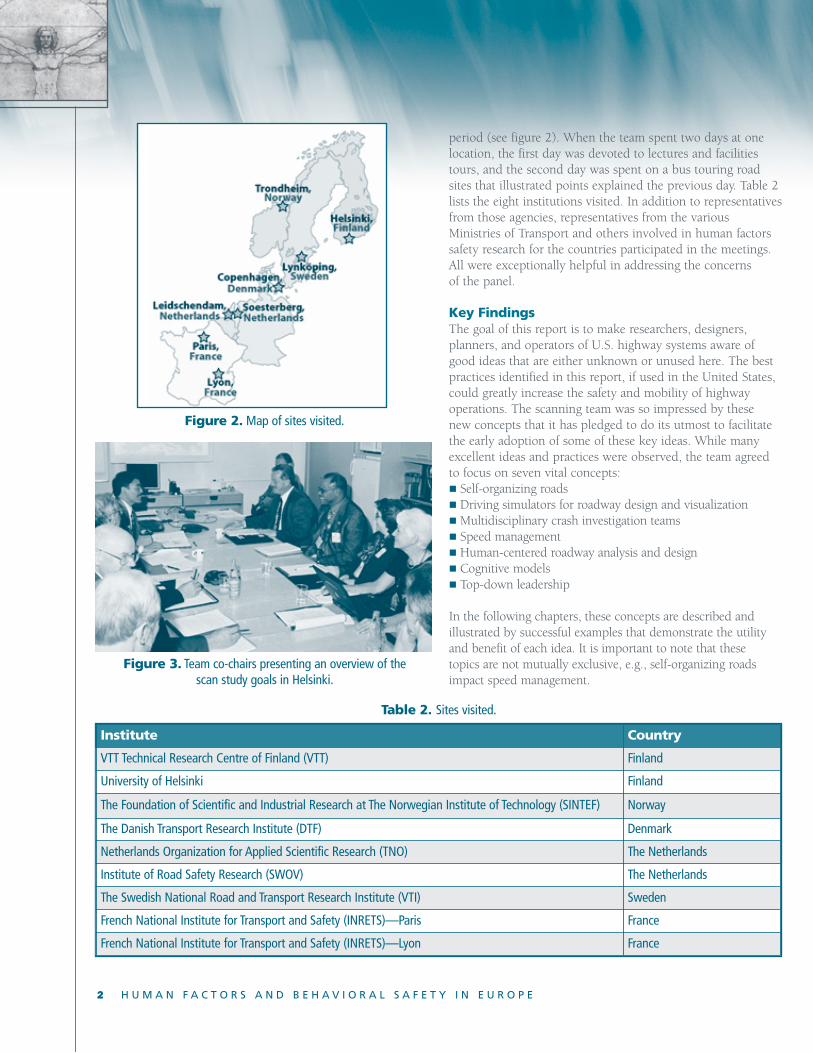
period (see figure 2). When the team spent two days at onelocation, the first day was devoted to lectures and facilitiestours, and the second day was spent on a bus touring roadsites that illustrated points explained the previous day. Table 2lists the eight institutions visited. In addition to representativesfrom those agencies, representatives from the variousMinistries of Transport and others involved in human factorssafety research for the countries participated in the meetings.All were exceptionally helpful in addressing the concerns of the panel.
Key FindingsThe goal of this report is to make researchers, designers, planners, and operators of U.S. highway systems aware ofgood ideas that are either unknown or unused here. The bestpractices identified in this report, if used in the United States,could greatly increase the safety and mobility of highwayoperations. The scanning team was so impressed by these new concepts that it has pledged to do its utmost to facilitatethe early adoption of some of these key ideas. While many excellent ideas and practices were observed, the team agreedto focus on seven vital concepts:� Self-organizing roads� Driving simulators for roadway design and visualization�Multidisciplinary crash investigation teams� Speed management� Human-centered roadway analysis and design� Cognitive models� Top-down leadership
In the following chapters, these concepts are described andillustrated by successful examples that demonstrate the utilityand benefit of each idea. It is important to note that these topics are not mutually exclusive, e.g., self-organizing roadsimpact speed management.
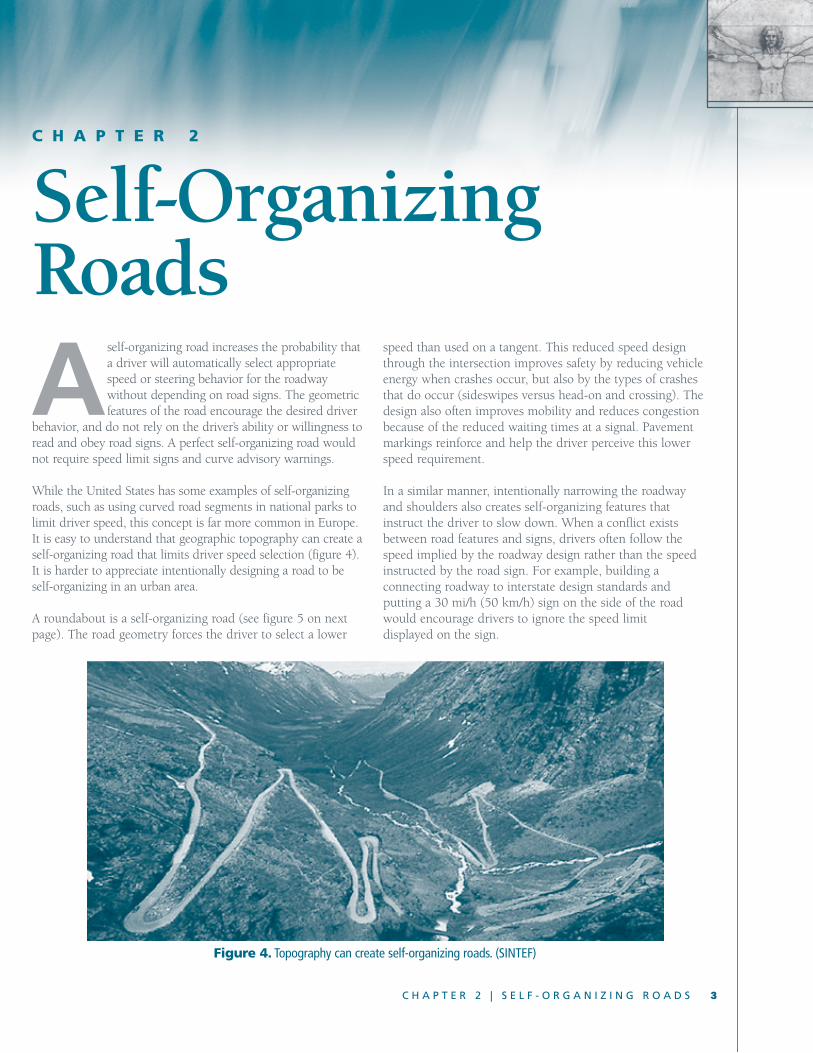
Figure 3. Team co-chairs presenting an overview of thescan study goals in Helsinki.
Figure 2. Map of sites visited.
Table 2. Sites visited.
Institute Country
VTT Technical Research Centre of Finland (VTT) Finland
University of Helsinki Finland
The Foundation of Scientific and Industrial Research at The Norwegian Institute of Technology (SINTEF) Norway
The Danish Transport Research Institute (DTF) Denmark
Netherlands Organization for Applied Scientific Research (TNO) The Netherlands
Institute of Road Safety Research (SWOV) The Netherlands
The Swedish National Road and Transport Research Institute (VTI) Sweden
French National Institute for Transport and Safety (INRETS)—Paris France
French National Institute for Transport and Safety (INRETS)—Lyon France
Aself-organizing road increases the probability thata driver will automatically select appropriatespeed or steering behavior for the roadway without depending on road signs. The geometricfeatures of the road encourage the desired driver
behavior, and do not rely on the driver’s ability or willingness toread and obey road signs. A perfect self-organizing road wouldnot require speed limit signs and curve advisory warnings.
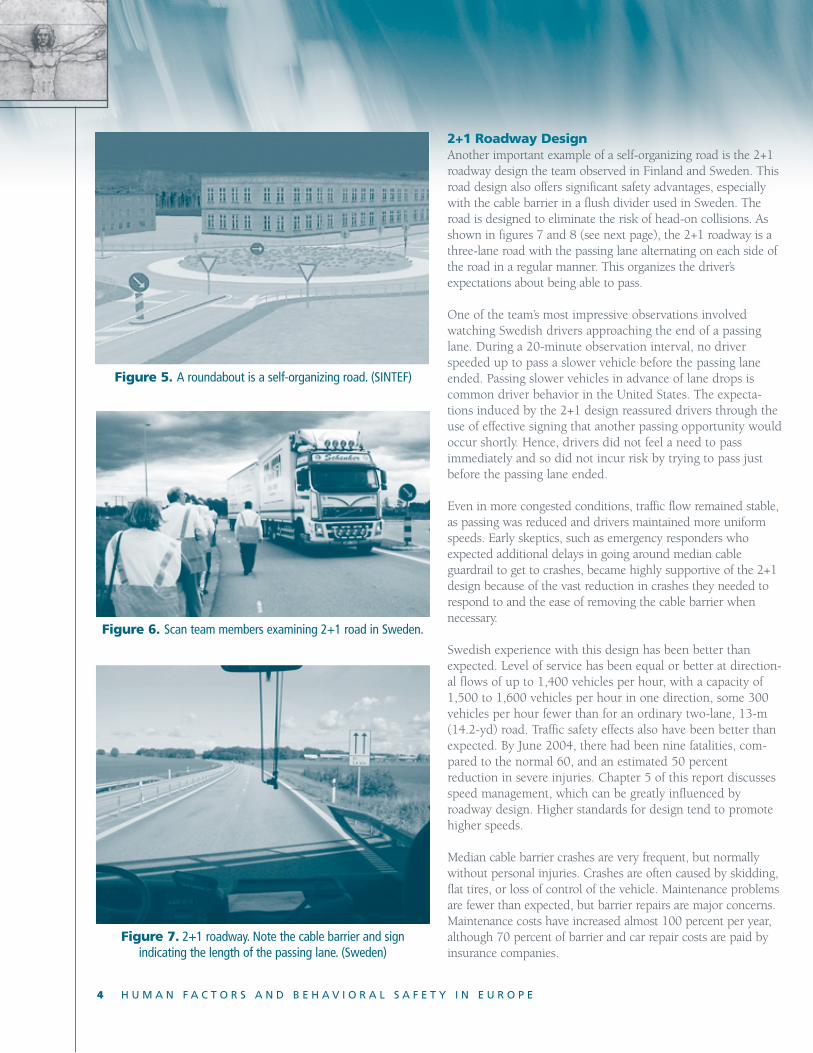
While the United States has some examples of self-organizingroads, such as using curved road segments in national parks tolimit driver speed, this concept is far more common in Europe.It is easy to understand that geographic topography can create aself-organizing road that limits driver speed selection (figure 4).It is harder to appreciate intentionally designing a road to beself-organizing in an urban area.
A roundabout is a self-organizing road (see figure 5 on nextpage). The road geometry forces the driver to select a lower
C H A P T E R 2 | S E L F - O R G A N I Z I N G R O A D S 3
C H A P T E R 2
Self-OrganizingRoads
speed than used on a tangent. This reduced speed designthrough the intersection improves safety by reducing vehicleenergy when crashes occur, but also by the types of crashesthat do occur (sideswipes versus head-on and crossing). Thedesign also often improves mobility and reduces congestionbecause of the reduced waiting times at a signal. Pavementmarkings reinforce and help the driver perceive this lowerspeed requirement.
In a similar manner, intentionally narrowing the roadway and shoulders also creates self-organizing features that instruct the driver to slow down. When a conflict existsbetween road features and signs, drivers often follow the speed implied by the roadway design rather than the speed instructed by the road sign. For example, building a connecting roadway to interstate design standards and putting a 30 mi/h (50 km/h) sign on the side of the roadwould encourage drivers to ignore the speed limit displayed on the sign.
Figure 4. Topography can create self-organizing roads. (SINTEF)
4 H U M A N F A C T O R S A N D B E H A V I O R A L S A F E T Y I N E U R O P E
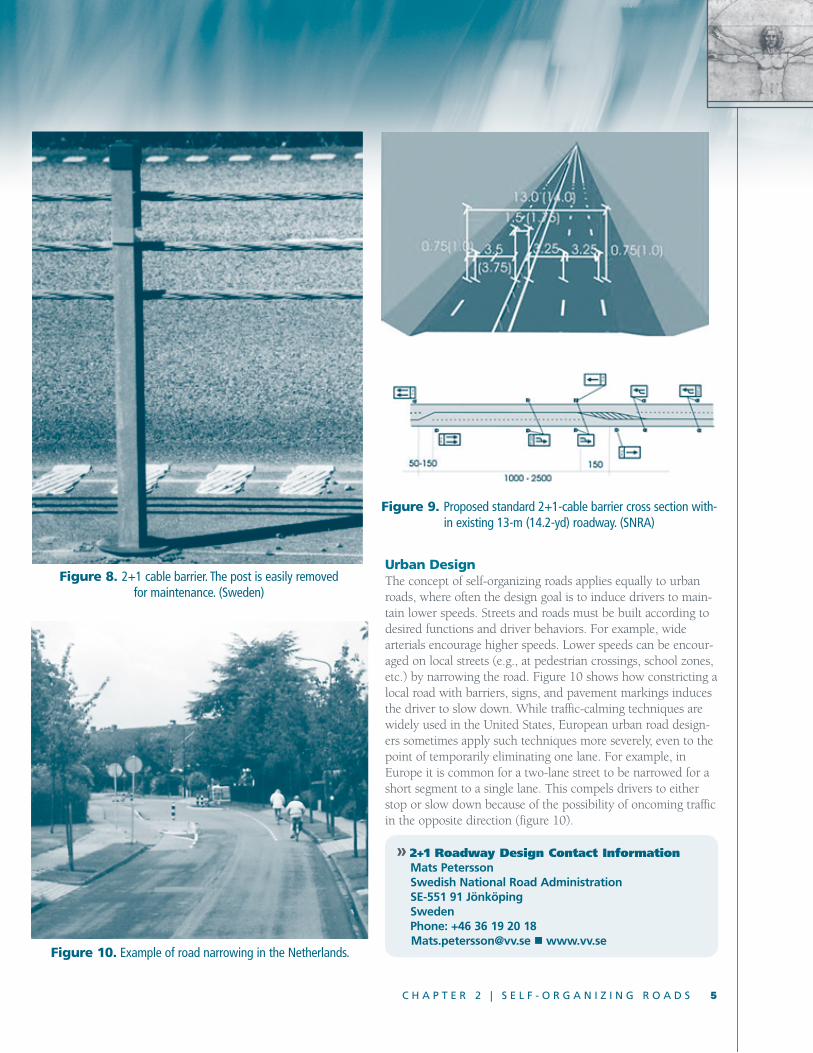
2+1 Roadway DesignAnother important example of a self-organizing road is the 2+1roadway design the team observed in Finland and Sweden. Thisroad design also offers significant safety advantages, especiallywith the cable barrier in a flush divider used in Sweden. Theroad is designed to eliminate the risk of head-on collisions. Asshown in figures 7 and 8 (see next page), the 2+1 roadway is athree-lane road with the passing lane alternating on each side ofthe road in a regular manner. This organizes the driver’s expectations about being able to pass.
One of the team’s most impressive observations involvedwatching Swedish drivers approaching the end of a passinglane. During a 20-minute observation interval, no driverspeeded up to pass a slower vehicle before the passing laneended. Passing slower vehicles in advance of lane drops iscommon driver behavior in the United States. The expecta-tions induced by the 2+1 design reassured drivers through theuse of effective signing that another passing opportunity wouldoccur shortly. Hence, drivers did not feel a need to pass immediately and so did not incur risk by trying to pass justbefore the passing lane ended.
Even in more congested conditions, traffic flow remained stable,as passing was reduced and drivers maintained more uniformspeeds. Early skeptics, such as emergency responders whoexpected additional delays in going around median cableguardrail to get to crashes, became highly supportive of the 2+1design because of the vast reduction in crashes they needed torespond to and the ease of removing the cable barrier when necessary.
Swedish experience with this design has been better thanexpected. Level of service has been equal or better at direction-al flows of up to 1,400 vehicles per hour, with a capacity of1,500 to 1,600 vehicles per hour in one direction, some 300vehicles per hour fewer than for an ordinary two-lane, 13-m(14.2-yd) road. Traffic safety effects also have been better thanexpected. By June 2004, there had been nine fatalities, com-pared to the normal 60, and an estimated 50 percent reduction in severe injuries. Chapter 5 of this report discussesspeed management, which can be greatly influenced by roadway design. Higher standards for design tend to promotehigher speeds.
Median cable barrier crashes are very frequent, but normallywithout personal injuries. Crashes are often caused by skidding,flat tires, or loss of control of the vehicle. Maintenance problemsare fewer than expected, but barrier repairs are major concerns.Maintenance costs have increased almost 100 percent per year,although 70 percent of barrier and car repair costs are paid byinsurance companies.
Figure 5. A roundabout is a self-organizing road. (SINTEF)
Figure 6. Scan team members examining 2+1 road in Sweden.
Figure 7. 2+1 roadway. Note the cable barrier and signindicating the length of the passing lane. (Sweden)
C H A P T E R 2 | S E L F - O R G A N I Z I N G R O A D S 5
Figure 9. Proposed standard 2+1-cable barrier cross section with-in existing 13-m (14.2-yd) roadway. (SNRA)
Figure 10. Example of road narrowing in the Netherlands.
Urban DesignThe concept of self-organizing roads applies equally to urbanroads, where often the design goal is to induce drivers to main-tain lower speeds. Streets and roads must be built according todesired functions and driver behaviors. For example, wide arterials encourage higher speeds. Lower speeds can be encour-aged on local streets (e.g., at pedestrian crossings, school zones,etc.) by narrowing the road. Figure 10 shows how constricting alocal road with barriers, signs, and pavement markings inducesthe driver to slow down. While traffic-calming techniques arewidely used in the United States, European urban road design-ers sometimes apply such techniques more severely, even to thepoint of temporarily eliminating one lane. For example, inEurope it is common for a two-lane street to be narrowed for ashort segment to a single lane. This compels drivers to eitherstop or slow down because of the possibility of oncoming trafficin the opposite direction (figure 10).
» 2+1 Roadway Design Contact InformationMats PeterssonSwedish National Road AdministrationSE-551 91 JönköpingSwedenPhone: +46 36 19 20 [email protected] �www.vv.se
Figure 8. 2+1 cable barrier. The post is easily removedfor maintenance. (Sweden)
6 H U M A N F A C T O R S A N D B E H A V I O R A L S A F E T Y I N E U R O P E
Driving simulators are often used in Europe to assistin the design of roadways, an application that is farless common in the United States. It is much simpler and cheaper to reject a design element in adriving simulator than to rebuild a road or tunnel
to fix design errors. The level of fidelity of the simulators (e.g.,degrees of motion, picture size and quality, etc.) at the agenciesvisited was comparable to the range of simulators in use in theUnited States at universities and FHWA’s Turner-FairbankHighway Research Center.
Simulators have been used both formally, with controlledexperiments to conduct tests of driver behavior and approvalof project features, and informally, with highway designersusing the simulator to experience alternate roadway plans. Forexample, at VTI Sweden an informal simulator project wasdescribed in which highway designers had planned to visit forone day to view their new designs in the simulator, but stayedfor three days and made several design changes based on theirsimulator experience.
C H A P T E R 3
Driving Simulators:Roadway Designand Visualization
Figure 11. The Laerdal Tunnel project. (SINTEF)
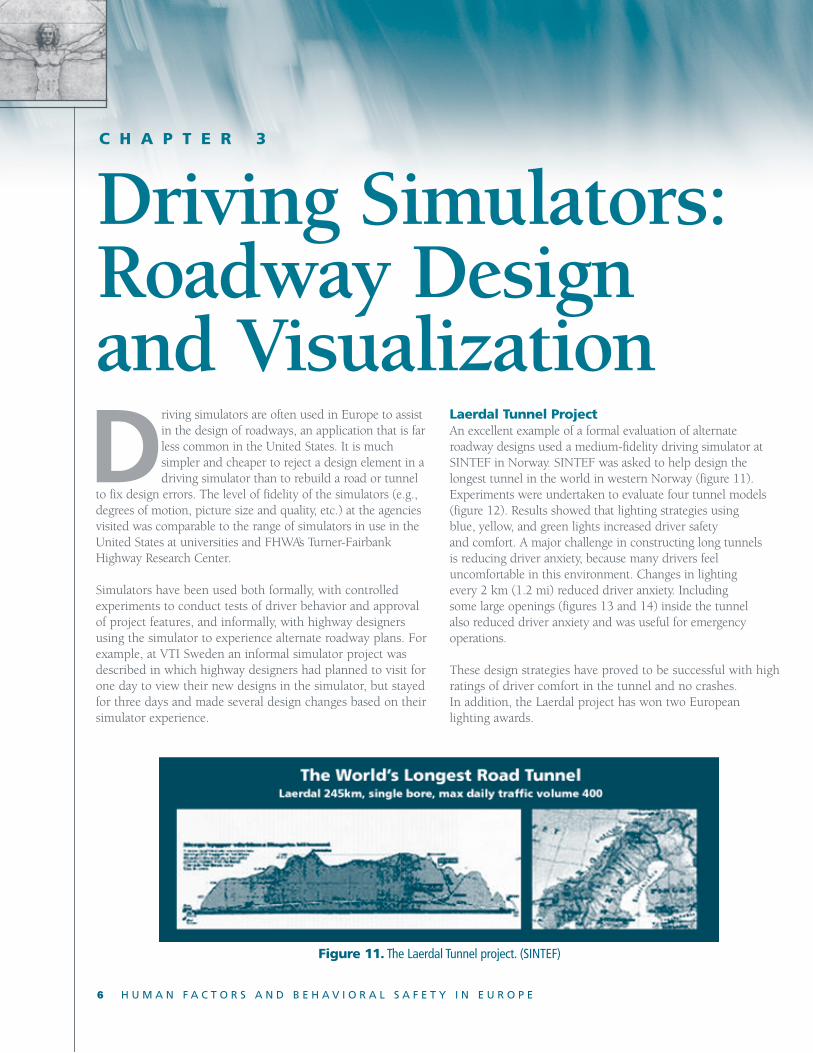
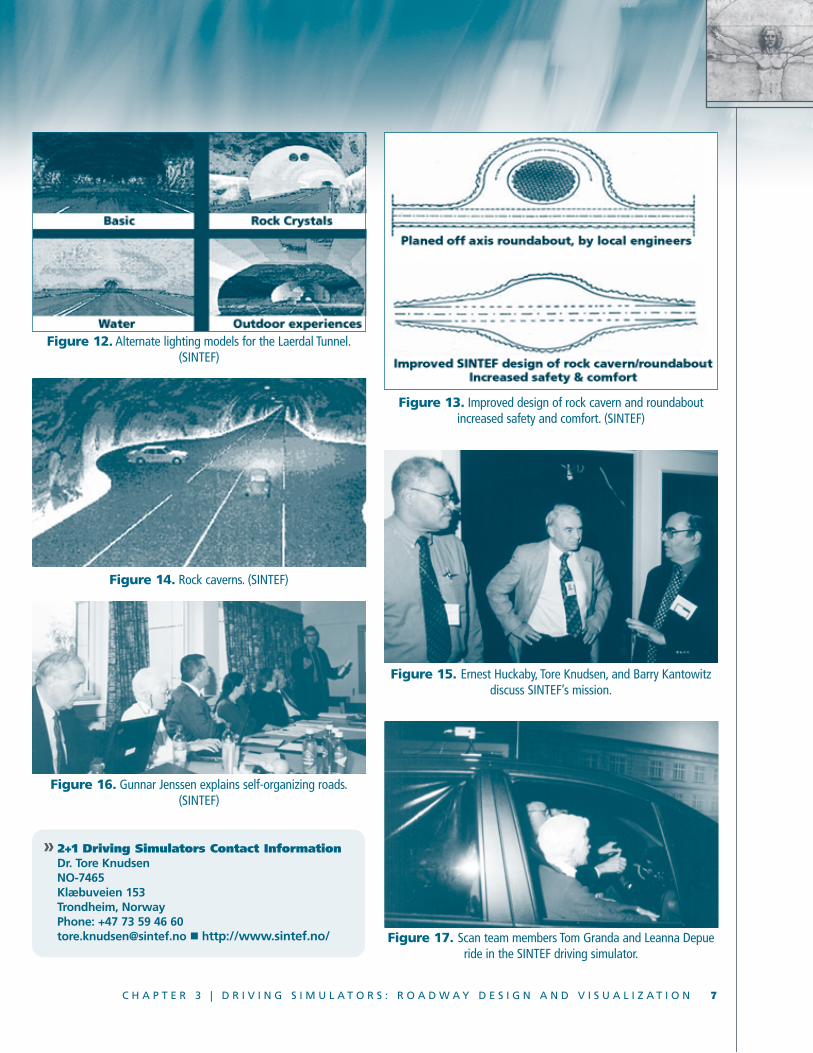
Laerdal Tunnel ProjectAn excellent example of a formal evaluation of alternate roadway designs used a medium-fidelity driving simulator atSINTEF in Norway. SINTEF was asked to help design thelongest tunnel in the world in western Norway (figure 11).Experiments were undertaken to evaluate four tunnel models(figure 12). Results showed that lighting strategies using blue, yellow, and green lights increased driver safety and comfort. A major challenge in constructing long tunnels is reducing driver anxiety, because many drivers feel uncomfortable in this environment. Changes in lighting every 2 km (1.2 mi) reduced driver anxiety. Including some large openings (figures 13 and 14) inside the tunnel also reduced driver anxiety and was useful for emergency operations.
These design strategies have proved to be successful with highratings of driver comfort in the tunnel and no crashes. In addition, the Laerdal project has won two European lighting awards.
C H A P T E R 3 | D R I V I N G S I M U L A T O R S : R O A D W A Y D E S I G N A N D V I S U A L I Z A T I O N 7
Figure 12. Alternate lighting models for the Laerdal Tunnel.(SINTEF)
Figure 13. Improved design of rock cavern and roundaboutincreased safety and comfort. (SINTEF)
Figure 14. Rock caverns. (SINTEF)
Figure 15. Ernest Huckaby, Tore Knudsen, and Barry Kantowitzdiscuss SINTEF’s mission.
Figure 16. Gunnar Jenssen explains self-organizing roads.(SINTEF)
Figure 17. Scan team members Tom Granda and Leanna Depueride in the SINTEF driving simulator.
» 2+1 Driving Simulators Contact InformationDr. Tore KnudsenNO-7465Klæbuveien 153Trondheim, NorwayPhone: +47 73 59 46 [email protected] � http://www.sintef.no/
8 H U M A N F A C T O R S A N D B E H A V I O R A L S A F E T Y I N E U R O P E
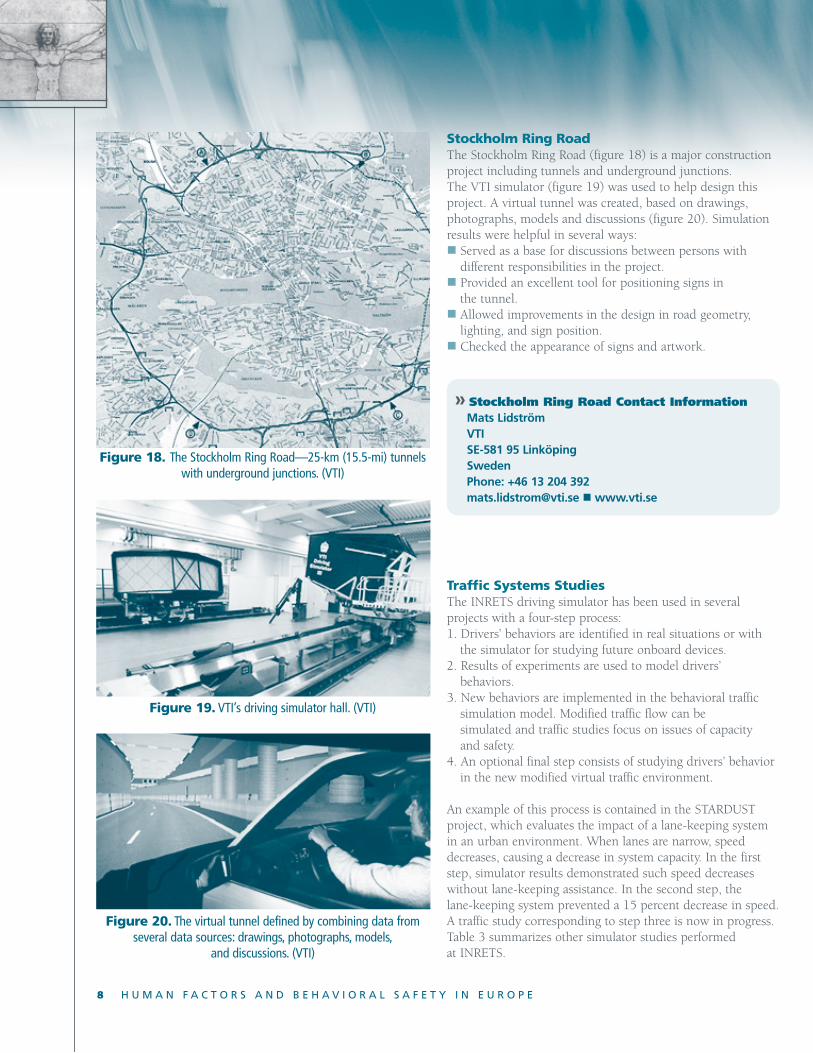
Stockholm Ring RoadThe Stockholm Ring Road (figure 18) is a major constructionproject including tunnels and underground junctions. The VTI simulator (figure 19) was used to help design thisproject. A virtual tunnel was created, based on drawings, photographs, models and discussions (figure 20). Simulationresults were helpful in several ways:� Served as a base for discussions between persons with
different responsibilities in the project.� Provided an excellent tool for positioning signs in
the tunnel.� Allowed improvements in the design in road geometry,
lighting, and sign position.� Checked the appearance of signs and artwork.
Traffic Systems StudiesThe INRETS driving simulator has been used in several projects with a four-step process:1. Drivers’ behaviors are identified in real situations or with
the simulator for studying future onboard devices.2. Results of experiments are used to model drivers’
behaviors.3. New behaviors are implemented in the behavioral traffic
simulation model. Modified traffic flow can be simulated and traffic studies focus on issues of capacity and safety.
4. An optional final step consists of studying drivers’ behaviorin the new modified virtual traffic environment.
An example of this process is contained in the STARDUSTproject, which evaluates the impact of a lane-keeping systemin an urban environment. When lanes are narrow, speeddecreases, causing a decrease in system capacity. In the firststep, simulator results demonstrated such speed decreaseswithout lane-keeping assistance. In the second step, the lane-keeping system prevented a 15 percent decrease in speed. A traffic study corresponding to step three is now in progress.Table 3 summarizes other simulator studies performed at INRETS.
Figure 18. The Stockholm Ring Road—25-km (15.5-mi) tunnelswith underground junctions. (VTI)
Figure 19. VTI’s driving simulator hall. (VTI)
Figure 20. The virtual tunnel defined by combining data fromseveral data sources: drawings, photographs, models,
and discussions. (VTI)
» Stockholm Ring Road Contact InformationMats LidströmVTISE-581 95 LinköpingSwedenPhone: +46 13 204 [email protected] �www.vti.se
ValidityPeople drive real cars on real roads; driving simulators create anartificial driving environment. Before results from driving simu-lators can be safely applied to road design and traffic systems,these results must be validated. Validity is accomplished bycomparing simulator data to on-road data. Simulators must bevalidated anew for each research question. At TNO, an organi-zation with almost 30 years of experience using driver simulators, the following points were made about validation:� Validity should be defined in relation to a specific research
question.� This depends on the information used to perform the task.
� One does not always need a high-fidelity driving simulator.� Absolute validity means same effect size in simulator and
road data.� Relative validity means same ranking of effect sizes.
Simulator research provides relative validity more often thanabsolute validity. What is more important is the ability to predict road behavior from simulator behavior. For example, a common finding is that people drive faster in simulators
» Traffic Systems Studies Contact InformationStéphane EspiéINRETS—ARCUEIL2, Avenue du Général Malleret Joinville94114 Arcueil CedexFrancePhone: +33 (0)1 47 40 70 [email protected] �www.inrets.fr
C H A P T E R 3 | D R I V I N G S I M U L A T O R S : R O A D W A Y D E S I G N A N D V I S U A L I Z A T I O N 9
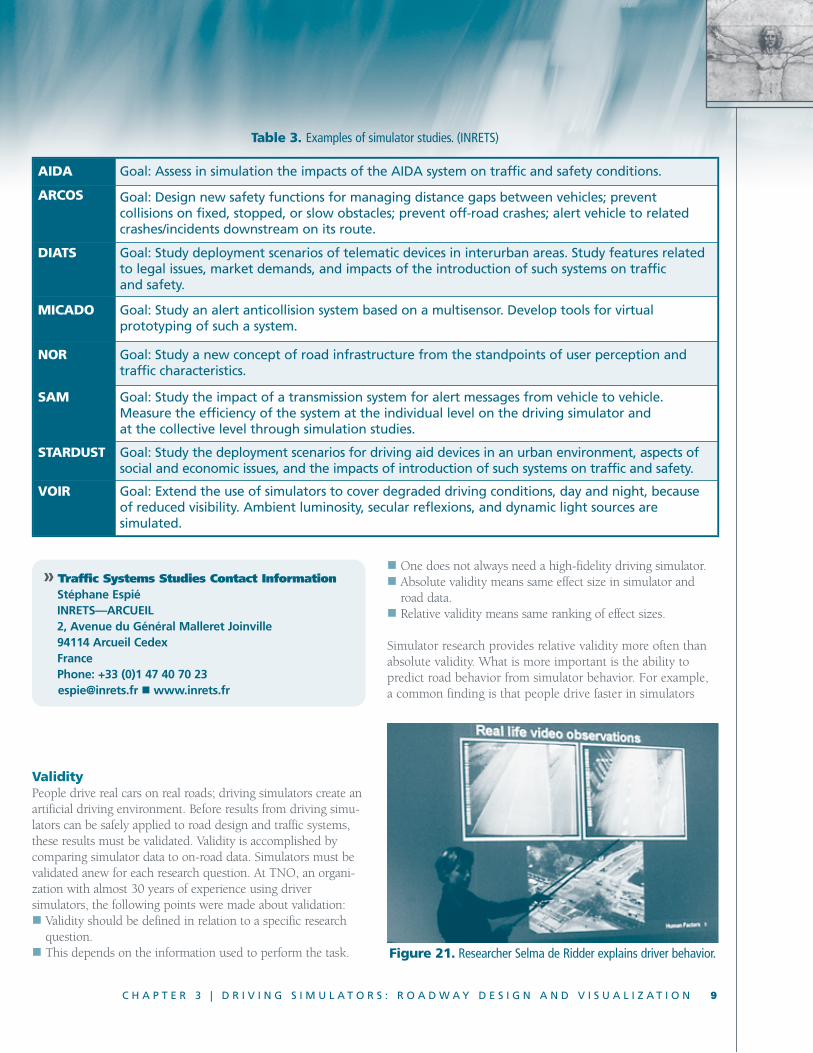
Table 3. Examples of simulator studies. (INRETS)
AIDA Goal: Assess in simulation the impacts of the AIDA system on traffic and safety conditions.
ARCOS Goal: Design new safety functions for managing distance gaps between vehicles; prevent collisions on fixed, stopped, or slow obstacles; prevent off-road crashes; alert vehicle to relatedcrashes/incidents downstream on its route.
DIATS Goal: Study deployment scenarios of telematic devices in interurban areas. Study features relatedto legal issues, market demands, and impacts of the introduction of such systems on traffic and safety.
MICADO Goal: Study an alert anticollision system based on a multisensor. Develop tools for virtual prototyping of such a system.
NOR Goal: Study a new concept of road infrastructure from the standpoints of user perception andtraffic characteristics.
SAM Goal: Study the impact of a transmission system for alert messages from vehicle to vehicle.Measure the efficiency of the system at the individual level on the driving simulator and at the collective level through simulation studies.
STARDUST Goal: Study the deployment scenarios for driving aid devices in an urban environment, aspects ofsocial and economic issues, and the impacts of introduction of such systems on traffic and safety.
VOIR Goal: Extend the use of simulators to cover degraded driving conditions, day and night, becauseof reduced visibility. Ambient luminosity, secular reflexions, and dynamic light sources are simulated.
Figure 21. Researcher Selma de Ridder explains driver behavior.
10 H U M A N F A C T O R S A N D B E H A V I O R A L S A F E T Y I N E U R O P E
than on the road. One explanation for this finding is thatbecause simulators lack the visual detail of the real world (i.e.,the real world has more pixels), drivers attempt to match theoptical flow of the real world and so drive faster in the simulator. This lack of absolute validity is seldom a problembecause speed corrections can be made when predicting real-world behavior from simulator behavior. For example, if itwere known that drivers drive 5 km/h faster in the simulator,the real-world prediction would be obtained by subtracting 5km/h from the simulator results. Furthermore, in many casesrelative validity is sufficient to give useful direction to highway and traffic engineers.
Influence of Fog on Driving BehaviorThis study is an outstanding example of going to great lengthsto achieve appropriate simulator validity. It is difficult to studythe effects of fog on the road because fog is a rare occurrence.The image generation techniques used to simulate fog have lim-ited realism, however, and most simulator manufacturers havenot validated the effects of fog on driver behavior. This INRETS
study went to an artificial fog chamber to investigate humanperception in daytime and nighttime fog. Visibility of vehicleoutlines (daytime) and rear light configurations (nighttime)were empirically evaluated. While the fog chamber has the considerable advantage of producing real fog, its limited dimensions prevent placing moving vehicles inside the cham-ber. Thus, the researchers reproduced the fog chamber experi-ments in the simulator to validate various fog image generationtechniques. They were able to validate effects for daytime fog,but not for nighttime fog (probably because of the limited luminance range of the simulator projection device). Thisallowed studies of speed perception and control in daytime fogthat offer greater validity than previous simulator fog studies, a most impressive accomplishment.
Simulator FidelityThe fidelity of a simulator is related directly to its cost.Simulators can be purchased for under $50,000 (low fidelity),from $50,000 to $250,000 (medium fidelity), and up to severalmillions of dollars (high fidelity). Higher prices add a movingbase, more screens, better graphics, and faster system response
» Influence of Fog on Driving BehaviorContact InformationViola CavalloINRETSLaboratoire de Psychologie de la Conduite2 av. Général Malleret-JoinvilleF-94114 ARCUEIL CEDEX FRANCEPhone: (0)1 47 40 73 [email protected] �www.inrets.fr
Figure 22. Researcher Viola Cavallo presents fogsimulation results.
Figure 23. Barry Kantowitz, report facilitator, participates inmeeting on high-fidelity driving simulators.
» Validity Contact InformationSelma de RidderTNO Human FactorsKampweg 5, PO Box 233769 ZG SoesterbergThe NetherlandsPhone: +31 346 356 [email protected] �www.tno.nl
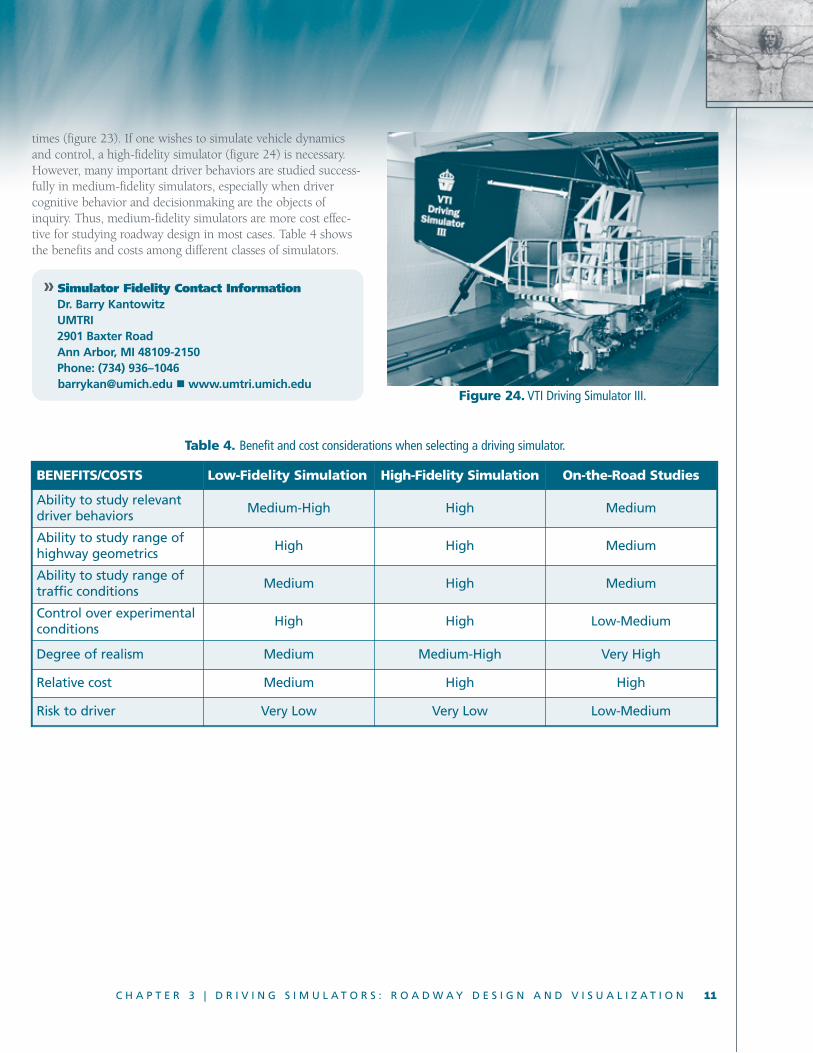
times (figure 23). If one wishes to simulate vehicle dynamicsand control, a high-fidelity simulator (figure 24) is necessary.However, many important driver behaviors are studied success-fully in medium-fidelity simulators, especially when driver cognitive behavior and decisionmaking are the objects ofinquiry. Thus, medium-fidelity simulators are more cost effec-tive for studying roadway design in most cases. Table 4 showsthe benefits and costs among different classes of simulators.
C H A P T E R 3 | D R I V I N G S I M U L A T O R S : R O A D W A Y D E S I G N A N D V I S U A L I Z A T I O N 11
» Simulator Fidelity Contact InformationDr. Barry KantowitzUMTRI2901 Baxter RoadAnn Arbor, MI 48109-2150Phone: (734) 936–[email protected] �www.umtri.umich.edu
Figure 24. VTI Driving Simulator III.
Table 4. Benefit and cost considerations when selecting a driving simulator.
BENEFITS/COSTS Low-Fidelity Simulation High-Fidelity Simulation On-the-Road Studies
Ability to study relevantdriver behaviors
Medium-High High Medium
Ability to study range ofhighway geometrics
High High Medium
Ability to study range oftraffic conditions
Medium High Medium
Control over experimentalconditions
High High Low-Medium
Degree of realism Medium Medium-High Very High
Relative cost Medium High High
Risk to driver Very Low Very Low Low-Medium
12 H U M A N F A C T O R S A N D B E H A V I O R A L S A F E T Y I N E U R O P E
At the University of Helsinki in Finland, the teamlearned that all fatal crashes in the country areinvestigated by a multidisciplinary team thatincludes a police officer, vehicle engineer, trafficengineer, physician, and sometimes a psycholo-
gist. The investigation results are documented in an originalfolder and database with more than 300 variables using amethodology from the Finnish Motor Insurers Centre. Results can vary, depending on the composition of the team.From the examples given, it appeared that the presence orabsence of a psychologist on the team could critically alterconclusions and interpretation of data. Considering all perspectives provided by a multidisciplinary team improvedthe overall research program.
No data were presented on the statistical reliability of thismethod. Since multidisciplinary crash investigation has beencriticized in the United States for lacking such reliability, this caveat must be kept in mind when evaluating European results.
VALT 2003 MethodThe Finnish Motor Insurers’ Centre (VALT) has developed acoherent set of procedures, including detailed forms to becompleted, for traffic accident investigation teams. Two pointscentral to this methodology are (1) the analysis of risk factors,and (2) the composition and responsibilities of the accidentinvestigation team. Two kinds of risk factors are considered.Immediate risk factors are direct, often active, factors thathave had an effect in the situation. They include such items asroad users’ mistakes, faults in the vehicle, and geometric ortraffic control device failures. Background factors, by theirexistence or omission, promote the origin of the event. Theyinclude such items as road-user health and motives, vehiclefeatures and loads, road and environmental conditions, and
C H A P T E R 4
MultidisciplinaryTeams
system factors such as laws, enforcement, and road norms.The team deals with the following questions:�What took place?�Why did it happen?�Why were the consequences serious?� How can the incident be prevented?� How can the consequences be prevented?
As already noted, a multidisciplinary team is formed for acci-dent investigation. Some of the functions of each team mem-ber, as outlined in the VALT 2003 document, are listed below:
All Team Members� Act as experts in their own fields on the investigation team.� Function as contact persons to the authorities and
organizations in their own areas of knowledge.� Clarify the issues raised using the investigation forms in
their fields for the accident being investigated.� Examine other issues in their own areas if the crash
investigation requires it.� Participate in other ways to help the investigation team
achieve its objective.
Police Member� Assembles the investigation team to study the accident.� Calls in the experts required for the accident investigation.� Organizes photographs at the accident scene and makes
sure required sketches are made at the location.� Clarifies, especially for the parties involved, the risk factors
related to the background, and produces correspondingproposals for improvement.
Vehicle Specialist Member� Investigates the technical condition of the vehicles involved
and the damage caused in the accident.
� Examines the use of safety equipment on the vehicles, andexplains, mainly with the physician, the effect of the structure of the vehicle and safety equipment on injuries.
� Makes calculations of the sequence of events and of thepreventive possibilities of the accident.
� Clarifies risk factors related to the vehicles and safetyequipment, and produces corresponding improvement proposals.
Road Specialist Member� Investigates, with other members, marks on the road and
draws conclusions about the sequence of events.� Evaluates the effect of the traffic environment on the origin
of the accident and its consequences.� Prepares a sketch of the scene of the accident.� Explains the association of risk factors—especially the road
in relation to the structure, the guidance of the traffic, thetraffic environment, the weather and conditions—and produces corresponding improvement proposals.
Physician Member� Investigates the vehicle and, with the vehicle specialist,
the possible sources of injury.� Investigates, with the police and psychologist, the physical
and psychological state of the drivers and pedestriansinvolved.
� Examines the risk factors related to driving ability.
Psychologist Member� Investigates, with the road specialist, issues related to the
traffic environment and traffic control, and evaluates theactions of the parties involved.
� Investigates, with the police and physician, the psychologi-cal state of the drivers and pedestrians, obtains historicalinformation about the health of the parties involved, andevaluates the effect of these on the origin of the accident.
� Functions as a consultant in investigation queries withinthe team.
� Examines the risk factors related to driving ability and produces improvement proposals.
Thus, information about the accident is collected systematical-ly. This information is evaluated from the viewpoints of teammembers with different training, experience, and perspectives.
C H A P T E R 4 | M U L T I D I S C I P L I N A R Y T E A M S 13
» VALT 2003 Method Contact InformationProfessor Heikki SummalaUniversity of Helsinki Traffic Research UnitSiltavuorenpenger 20 DFI-00014 University of HelsinkiHelsinki, FinlandPhone: +358 9 19 12 94 [email protected] �www.helsinki.fi
14 H U M A N F A C T O R S A N D B E H A V I O R A L S A F E T Y I N E U R O P E
Everywhere the scan team visited, speed managementwas a key priority for improving highway safety. The“human” element was also a major consideration inmethods to control speed. Countries first designedroadways to achieve the desired speed objective
through the functional use of the roadway (self-organizingroads), but road speed management was also achieved throughaggressive enforcement and public education.
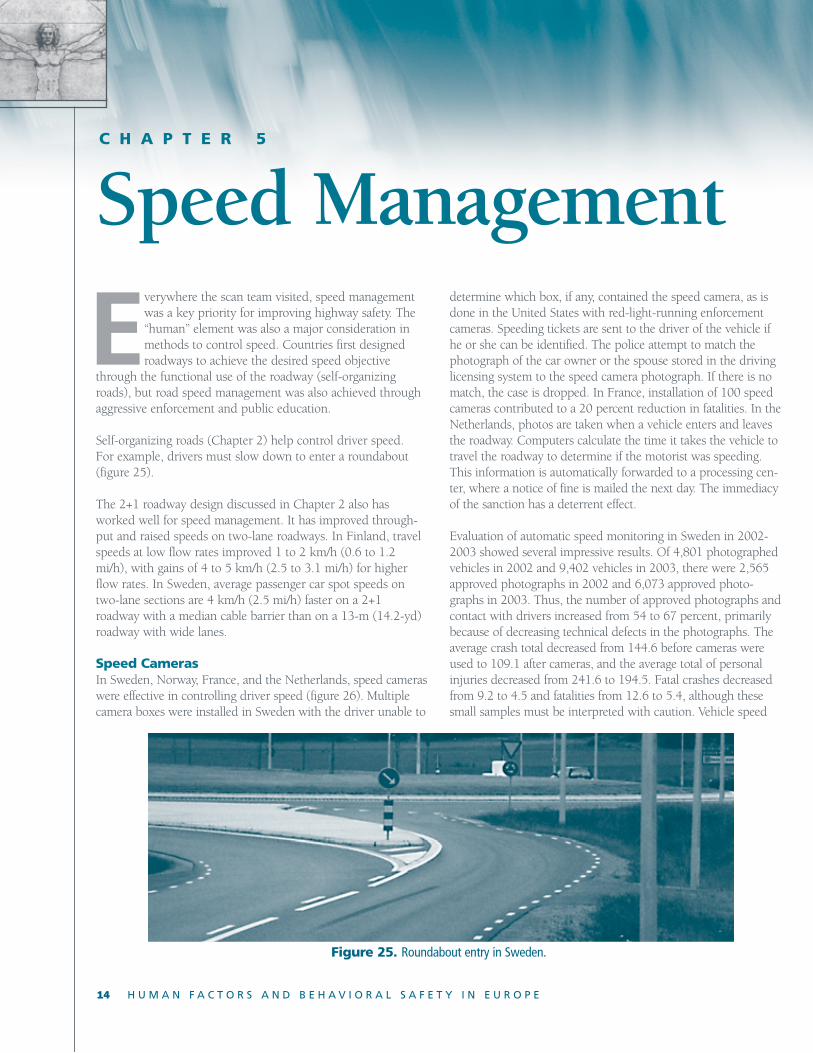
Self-organizing roads (Chapter 2) help control driver speed. For example, drivers must slow down to enter a roundabout(figure 25).
The 2+1 roadway design discussed in Chapter 2 also hasworked well for speed management. It has improved through-put and raised speeds on two-lane roadways. In Finland, travelspeeds at low flow rates improved 1 to 2 km/h (0.6 to 1.2mi/h), with gains of 4 to 5 km/h (2.5 to 3.1 mi/h) for higherflow rates. In Sweden, average passenger car spot speeds ontwo-lane sections are 4 km/h (2.5 mi/h) faster on a 2+1 roadway with a median cable barrier than on a 13-m (14.2-yd)roadway with wide lanes.
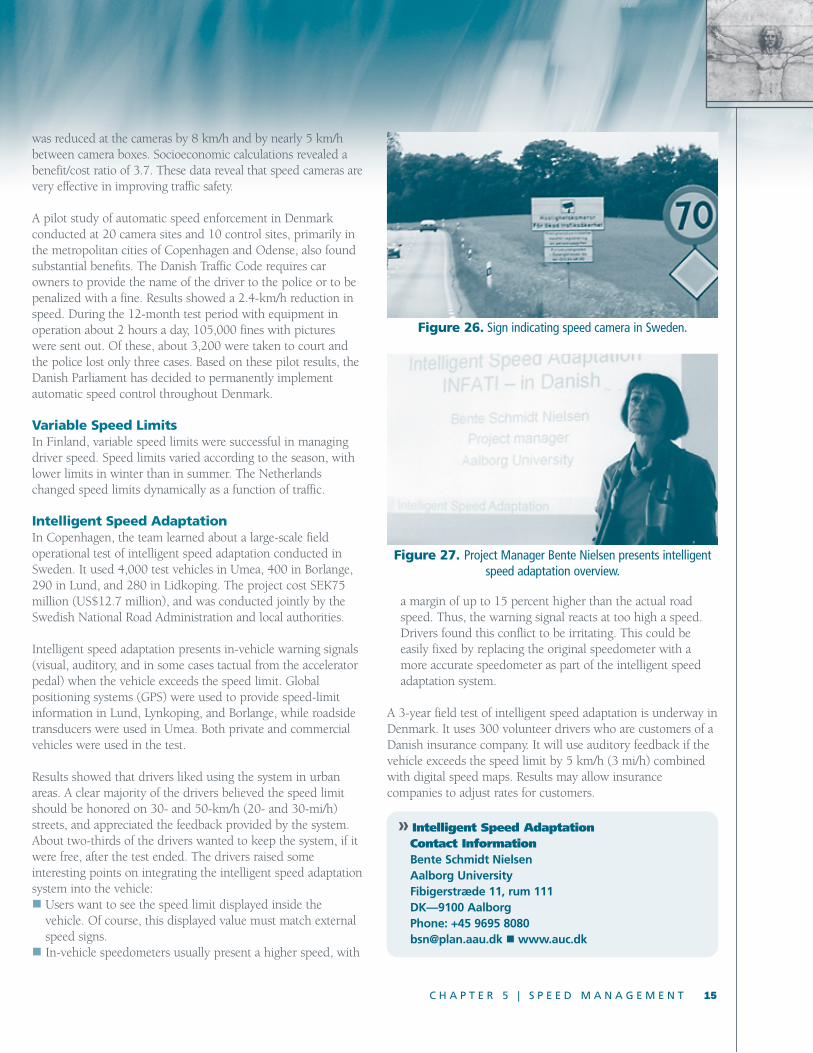
Speed CamerasIn Sweden, Norway, France, and the Netherlands, speed cameraswere effective in controlling driver speed (figure 26). Multiplecamera boxes were installed in Sweden with the driver unable to
C H A P T E R 5
Speed Managementdetermine which box, if any, contained the speed camera, as isdone in the United States with red-light-running enforcementcameras. Speeding tickets are sent to the driver of the vehicle ifhe or she can be identified. The police attempt to match thephotograph of the car owner or the spouse stored in the drivinglicensing system to the speed camera photograph. If there is nomatch, the case is dropped. In France, installation of 100 speedcameras contributed to a 20 percent reduction in fatalities. In theNetherlands, photos are taken when a vehicle enters and leavesthe roadway. Computers calculate the time it takes the vehicle totravel the roadway to determine if the motorist was speeding.This information is automatically forwarded to a processing cen-ter, where a notice of fine is mailed the next day. The immediacyof the sanction has a deterrent effect.
Evaluation of automatic speed monitoring in Sweden in 2002-2003 showed several impressive results. Of 4,801 photographedvehicles in 2002 and 9,402 vehicles in 2003, there were 2,565approved photographs in 2002 and 6,073 approved photo-graphs in 2003. Thus, the number of approved photographs andcontact with drivers increased from 54 to 67 percent, primarilybecause of decreasing technical defects in the photographs. Theaverage crash total decreased from 144.6 before cameras wereused to 109.1 after cameras, and the average total of personalinjuries decreased from 241.6 to 194.5. Fatal crashes decreasedfrom 9.2 to 4.5 and fatalities from 12.6 to 5.4, although thesesmall samples must be interpreted with caution. Vehicle speed
Figure 25. Roundabout entry in Sweden.
was reduced at the cameras by 8 km/h and by nearly 5 km/hbetween camera boxes. Socioeconomic calculations revealed abenefit/cost ratio of 3.7. These data reveal that speed cameras arevery effective in improving traffic safety.
A pilot study of automatic speed enforcement in Denmark conducted at 20 camera sites and 10 control sites, primarily inthe metropolitan cities of Copenhagen and Odense, also foundsubstantial benefits. The Danish Traffic Code requires car owners to provide the name of the driver to the police or to bepenalized with a fine. Results showed a 2.4-km/h reduction inspeed. During the 12-month test period with equipment inoperation about 2 hours a day, 105,000 fines with pictureswere sent out. Of these, about 3,200 were taken to court andthe police lost only three cases. Based on these pilot results, theDanish Parliament has decided to permanently implementautomatic speed control throughout Denmark.
Variable Speed LimitsIn Finland, variable speed limits were successful in managingdriver speed. Speed limits varied according to the season, withlower limits in winter than in summer. The Netherlandschanged speed limits dynamically as a function of traffic.
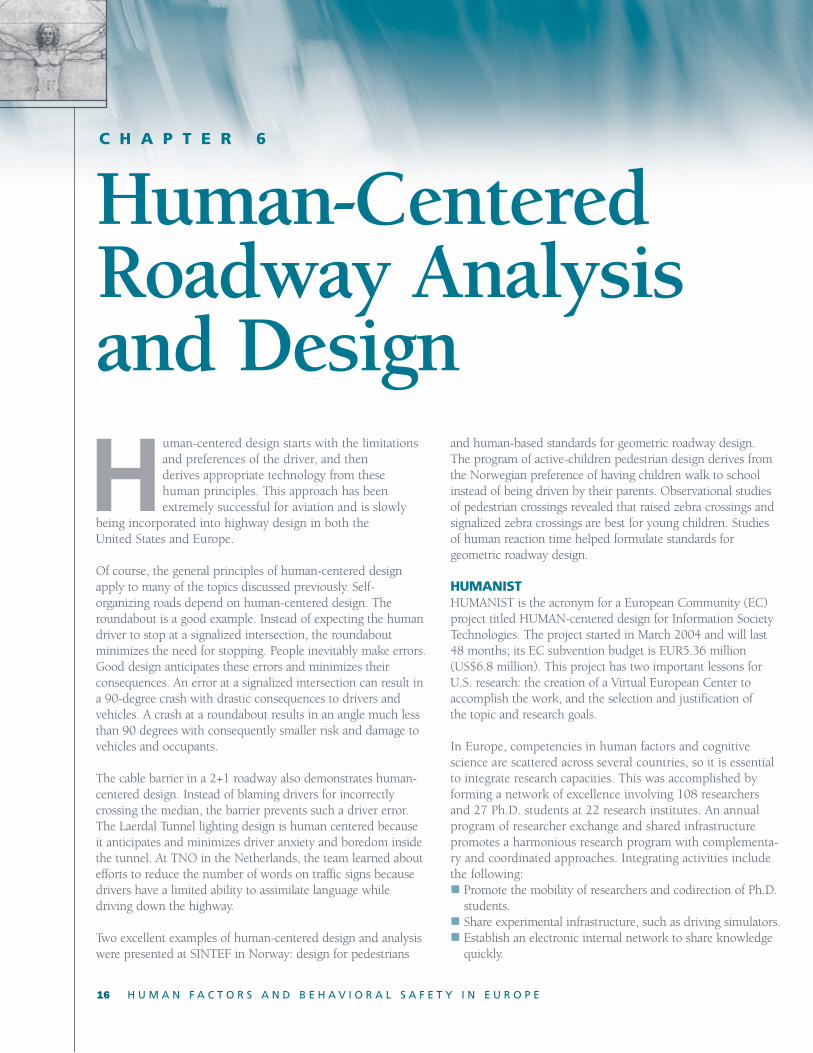
Intelligent Speed AdaptationIn Copenhagen, the team learned about a large-scale field operational test of intelligent speed adaptation conducted inSweden. It used 4,000 test vehicles in Umea, 400 in Borlange,290 in Lund, and 280 in Lidkoping. The project cost SEK75million (US$12.7 million), and was conducted jointly by theSwedish National Road Administration and local authorities.
Intelligent speed adaptation presents in-vehicle warning signals(visual, auditory, and in some cases tactual from the acceleratorpedal) when the vehicle exceeds the speed limit. Global positioning systems (GPS) were used to provide speed-limitinformation in Lund, Lynkoping, and Borlange, while roadsidetransducers were used in Umea. Both private and commercialvehicles were used in the test.
Results showed that drivers liked using the system in urbanareas. A clear majority of the drivers believed the speed limitshould be honored on 30- and 50-km/h (20- and 30-mi/h)streets, and appreciated the feedback provided by the system.About two-thirds of the drivers wanted to keep the system, if itwere free, after the test ended. The drivers raised some interesting points on integrating the intelligent speed adaptationsystem into the vehicle:� Users want to see the speed limit displayed inside the
vehicle. Of course, this displayed value must match externalspeed signs.
� In-vehicle speedometers usually present a higher speed, with
a margin of up to 15 percent higher than the actual roadspeed. Thus, the warning signal reacts at too high a speed.Drivers found this conflict to be irritating. This could be easily fixed by replacing the original speedometer with amore accurate speedometer as part of the intelligent speedadaptation system.
A 3-year field test of intelligent speed adaptation is underway inDenmark. It uses 300 volunteer drivers who are customers of aDanish insurance company. It will use auditory feedback if thevehicle exceeds the speed limit by 5 km/h (3 mi/h) combinedwith digital speed maps. Results may allow insurance companies to adjust rates for customers.
C H A P T E R 5 | S P E E D M A N A G E M E N T 15
Figure 26. Sign indicating speed camera in Sweden.
Figure 27. Project Manager Bente Nielsen presents intelligentspeed adaptation overview.
» Intelligent Speed Adaptation Contact InformationBente Schmidt NielsenAalborg UniversityFibigerstræde 11, rum 111DK—9100 AalborgPhone: +45 9695 [email protected] �www.auc.dk
16 H U M A N F A C T O R S A N D B E H A V I O R A L S A F E T Y I N E U R O P E
Human-centered design starts with the limitationsand preferences of the driver, and then derives appropriate technology from these human principles. This approach has beenextremely successful for aviation and is slowly
being incorporated into highway design in both the United States and Europe.
Of course, the general principles of human-centered designapply to many of the topics discussed previously. Self-organizing roads depend on human-centered design. Theroundabout is a good example. Instead of expecting the humandriver to stop at a signalized intersection, the roundabout minimizes the need for stopping. People inevitably make errors.Good design anticipates these errors and minimizes their consequences. An error at a signalized intersection can result ina 90-degree crash with drastic consequences to drivers andvehicles. A crash at a roundabout results in an angle much lessthan 90 degrees with consequently smaller risk and damage tovehicles and occupants.
The cable barrier in a 2+1 roadway also demonstrates human-centered design. Instead of blaming drivers for incorrectlycrossing the median, the barrier prevents such a driver error.The Laerdal Tunnel lighting design is human centered becauseit anticipates and minimizes driver anxiety and boredom insidethe tunnel. At TNO in the Netherlands, the team learned aboutefforts to reduce the number of words on traffic signs becausedrivers have a limited ability to assimilate language while driving down the highway.
Two excellent examples of human-centered design and analysiswere presented at SINTEF in Norway: design for pedestrians
C H A P T E R 6
Human-CenteredRoadway Analysisand Design
and human-based standards for geometric roadway design. The program of active-children pedestrian design derives fromthe Norwegian preference of having children walk to schoolinstead of being driven by their parents. Observational studiesof pedestrian crossings revealed that raised zebra crossings andsignalized zebra crossings are best for young children. Studiesof human reaction time helped formulate standards for geometric roadway design.
HUMANISTHUMANIST is the acronym for a European Community (EC)project titled HUMAN-centered design for Information SocietyTechnologies. The project started in March 2004 and will last48 months; its EC subvention budget is EUR5.36 million(US$6.8 million). This project has two important lessons forU.S. research: the creation of a Virtual European Center toaccomplish the work, and the selection and justification of the topic and research goals.
In Europe, competencies in human factors and cognitive science are scattered across several countries, so it is essentialto integrate research capacities. This was accomplished byforming a network of excellence involving 108 researchersand 27 Ph.D. students at 22 research institutes. An annualprogram of researcher exchange and shared infrastructure promotes a harmonious research program with complementa-ry and coordinated approaches. Integrating activities includethe following:� Promote the mobility of researchers and codirection of Ph.D.
students.� Share experimental infrastructure, such as driving simulators.� Establish an electronic internal network to share knowledge
quickly.
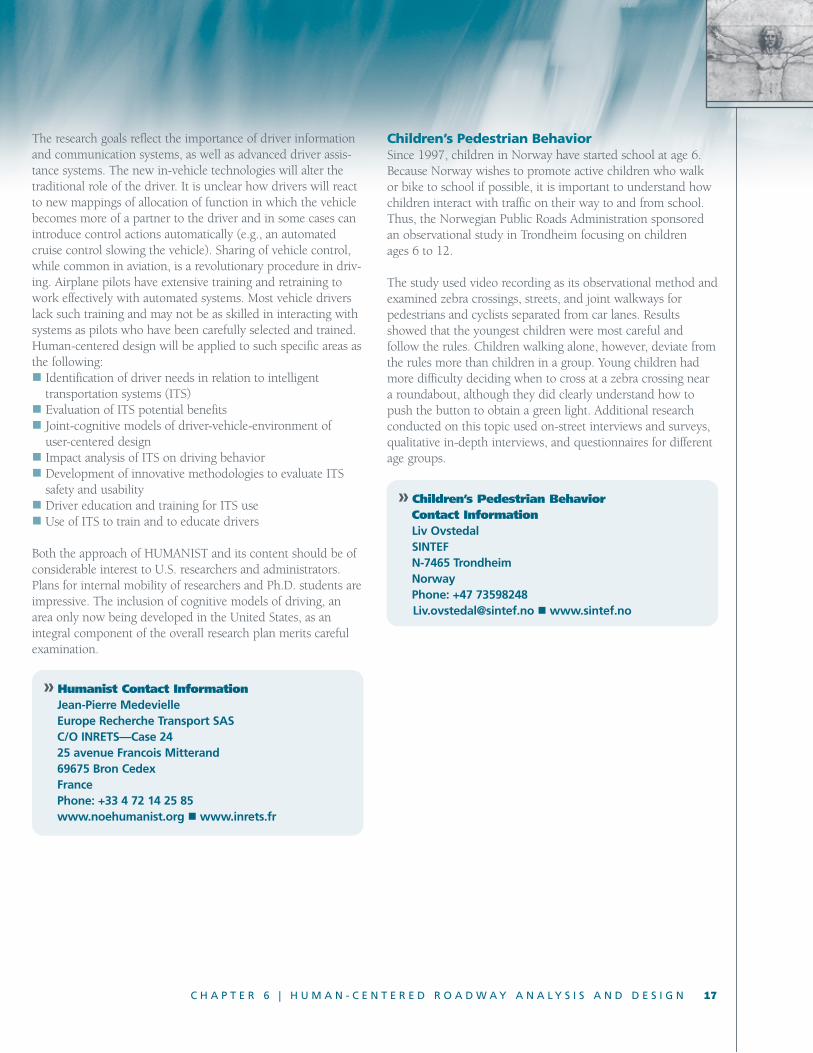
The research goals reflect the importance of driver informationand communication systems, as well as advanced driver assis-tance systems. The new in-vehicle technologies will alter thetraditional role of the driver. It is unclear how drivers will reactto new mappings of allocation of function in which the vehiclebecomes more of a partner to the driver and in some cases canintroduce control actions automatically (e.g., an automatedcruise control slowing the vehicle). Sharing of vehicle control,while common in aviation, is a revolutionary procedure in driv-ing. Airplane pilots have extensive training and retraining towork effectively with automated systems. Most vehicle driverslack such training and may not be as skilled in interacting withsystems as pilots who have been carefully selected and trained.Human-centered design will be applied to such specific areas asthe following:� Identification of driver needs in relation to intelligent
transportation systems (ITS)� Evaluation of ITS potential benefits� Joint-cognitive models of driver-vehicle-environment of
user-centered design� Impact analysis of ITS on driving behavior� Development of innovative methodologies to evaluate ITS
safety and usability� Driver education and training for ITS use� Use of ITS to train and to educate drivers
Both the approach of HUMANIST and its content should be ofconsiderable interest to U.S. researchers and administrators.Plans for internal mobility of researchers and Ph.D. students areimpressive. The inclusion of cognitive models of driving, anarea only now being developed in the United States, as an integral component of the overall research plan merits carefulexamination.
Children’s Pedestrian BehaviorSince 1997, children in Norway have started school at age 6.Because Norway wishes to promote active children who walkor bike to school if possible, it is important to understand howchildren interact with traffic on their way to and from school.Thus, the Norwegian Public Roads Administration sponsoredan observational study in Trondheim focusing on children ages 6 to 12.
The study used video recording as its observational method andexamined zebra crossings, streets, and joint walkways forpedestrians and cyclists separated from car lanes. Resultsshowed that the youngest children were most careful and follow the rules. Children walking alone, however, deviate fromthe rules more than children in a group. Young children hadmore difficulty deciding when to cross at a zebra crossing neara roundabout, although they did clearly understand how topush the button to obtain a green light. Additional researchconducted on this topic used on-street interviews and surveys,qualitative in-depth interviews, and questionnaires for differentage groups.
C H A P T E R 6 | H U M A N - C E N T E R E D R O A D W A Y A N A L Y S I S A N D D E S I G N 17
» Children’s Pedestrian Behavior Contact InformationLiv OvstedalSINTEFN-7465 TrondheimNorwayPhone: +47 [email protected] �www.sintef.no
» Humanist Contact InformationJean-Pierre MedevielleEurope Recherche Transport SASC/O INRETS—Case 2425 avenue Francois Mitterand69675 Bron CedexFrancePhone: +33 4 72 14 25 85www.noehumanist.org �www.inrets.fr
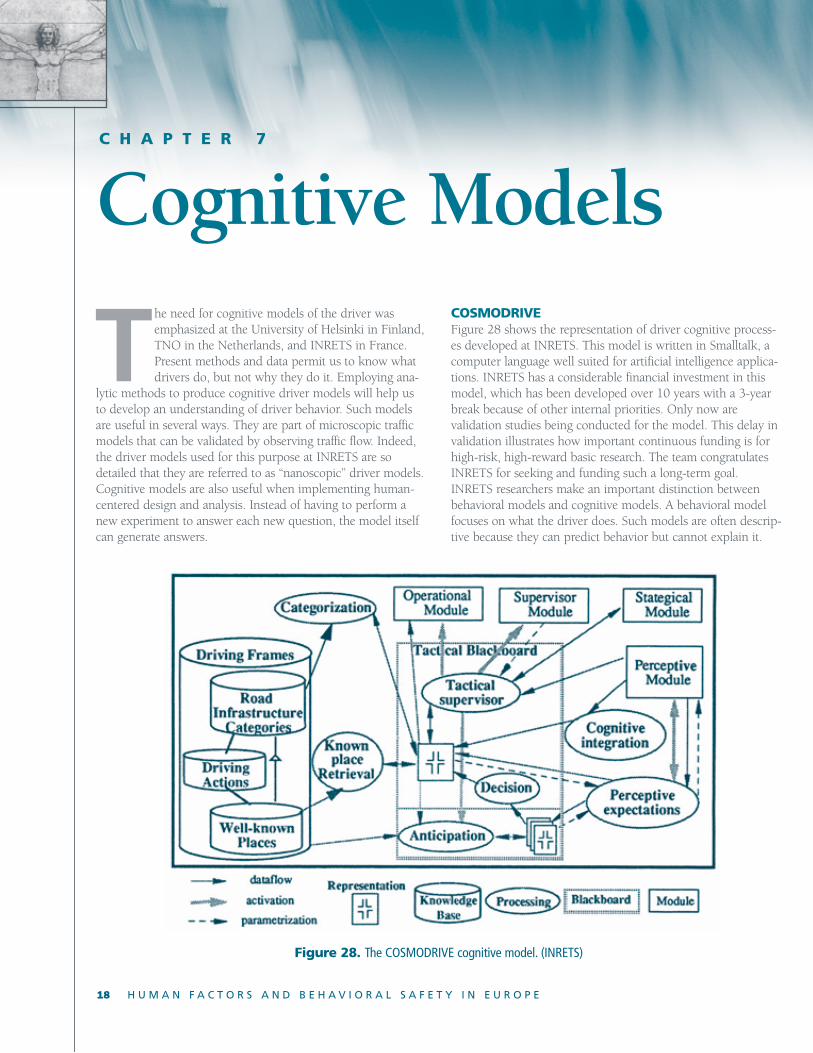
18 H U M A N F A C T O R S A N D B E H A V I O R A L S A F E T Y I N E U R O P E
C H A P T E R 7
Cognitive ModelsCOSMODRIVEFigure 28 shows the representation of driver cognitive process-es developed at INRETS. This model is written in Smalltalk, acomputer language well suited for artificial intelligence applica-tions. INRETS has a considerable financial investment in thismodel, which has been developed over 10 years with a 3-yearbreak because of other internal priorities. Only now are validation studies being conducted for the model. This delay invalidation illustrates how important continuous funding is forhigh-risk, high-reward basic research. The team congratulatesINRETS for seeking and funding such a long-term goal. INRETS researchers make an important distinction betweenbehavioral models and cognitive models. A behavioral modelfocuses on what the driver does. Such models are often descrip-tive because they can predict behavior but cannot explain it.
Figure 28. The COSMODRIVE cognitive model. (INRETS)
The need for cognitive models of the driver wasemphasized at the University of Helsinki in Finland,TNO in the Netherlands, and INRETS in France.Present methods and data permit us to know whatdrivers do, but not why they do it. Employing ana-
lytic methods to produce cognitive driver models will help usto develop an understanding of driver behavior. Such modelsare useful in several ways. They are part of microscopic trafficmodels that can be validated by observing traffic flow. Indeed,the driver models used for this purpose at INRETS are sodetailed that they are referred to as “nanoscopic” driver models.Cognitive models are also useful when implementing human-centered design and analysis. Instead of having to perform anew experiment to answer each new question, the model itselfcan generate answers.
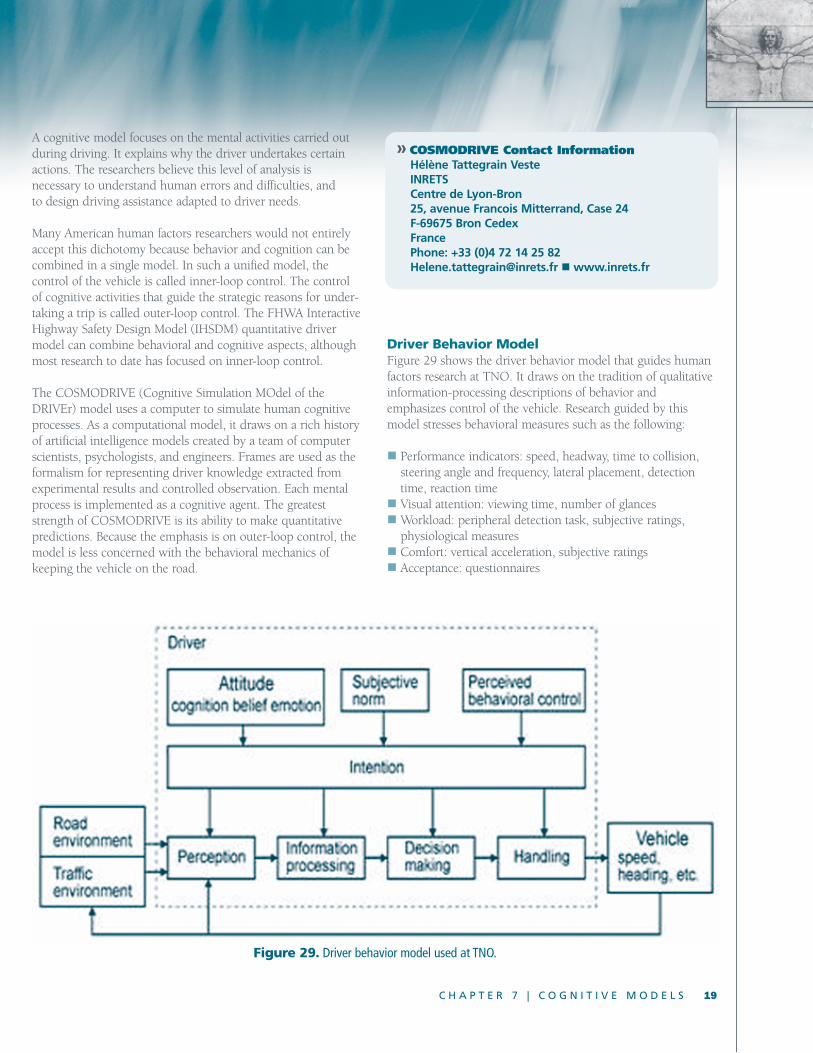
A cognitive model focuses on the mental activities carried outduring driving. It explains why the driver undertakes certainactions. The researchers believe this level of analysis is necessary to understand human errors and difficulties, and to design driving assistance adapted to driver needs.
Many American human factors researchers would not entirelyaccept this dichotomy because behavior and cognition can becombined in a single model. In such a unified model, the control of the vehicle is called inner-loop control. The controlof cognitive activities that guide the strategic reasons for under-taking a trip is called outer-loop control. The FHWA InteractiveHighway Safety Design Model (IHSDM) quantitative drivermodel can combine behavioral and cognitive aspects, althoughmost research to date has focused on inner-loop control.
The COSMODRIVE (Cognitive Simulation MOdel of theDRIVEr) model uses a computer to simulate human cognitiveprocesses. As a computational model, it draws on a rich historyof artificial intelligence models created by a team of computerscientists, psychologists, and engineers. Frames are used as theformalism for representing driver knowledge extracted fromexperimental results and controlled observation. Each mentalprocess is implemented as a cognitive agent. The greateststrength of COSMODRIVE is its ability to make quantitativepredictions. Because the emphasis is on outer-loop control, themodel is less concerned with the behavioral mechanics of keeping the vehicle on the road.
Driver Behavior ModelFigure 29 shows the driver behavior model that guides humanfactors research at TNO. It draws on the tradition of qualitativeinformation-processing descriptions of behavior and emphasizes control of the vehicle. Research guided by thismodel stresses behavioral measures such as the following:
� Performance indicators: speed, headway, time to collision,steering angle and frequency, lateral placement, detectiontime, reaction time
� Visual attention: viewing time, number of glances�Workload: peripheral detection task, subjective ratings,
physiological measures� Comfort: vertical acceleration, subjective ratings� Acceptance: questionnaires
C H A P T E R 7 | C O G N I T I V E M O D E L S 19
Figure 29. Driver behavior model used at TNO.
» COSMODRIVE Contact InformationHélène Tattegrain VesteINRETSCentre de Lyon-Bron25, avenue Francois Mitterrand, Case 24F-69675 Bron CedexFrancePhone: +33 (0)4 72 14 25 [email protected] �www.inrets.fr
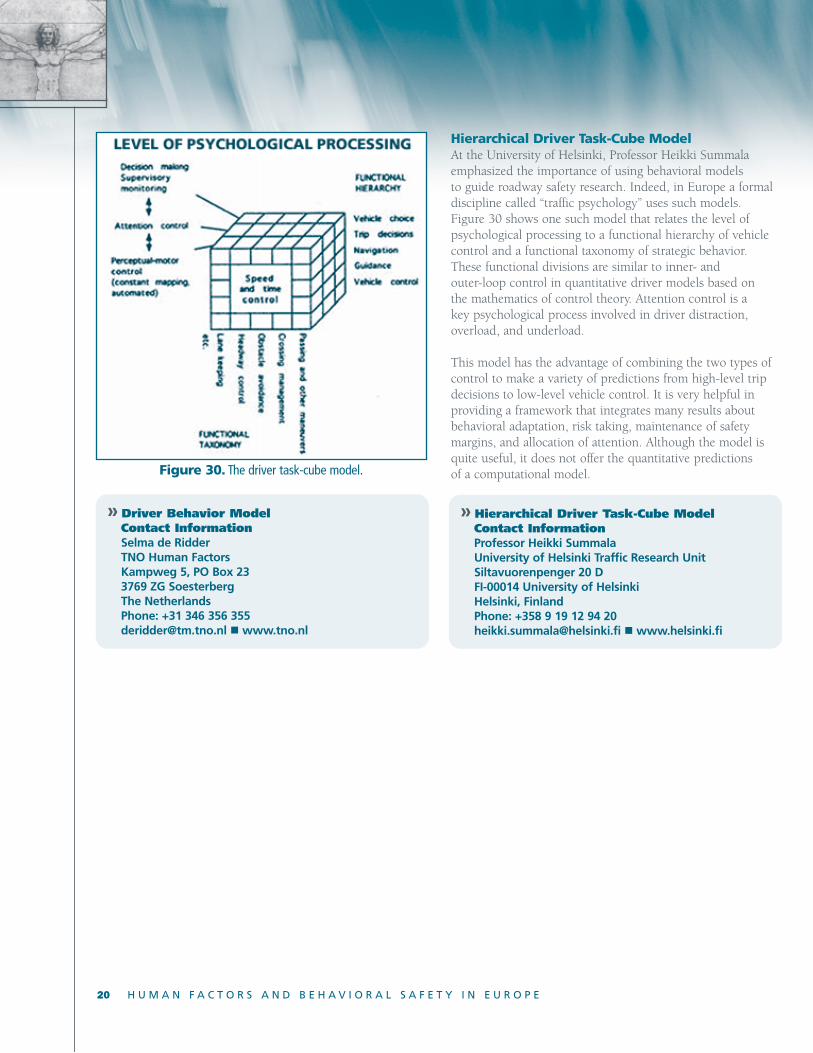
20 H U M A N F A C T O R S A N D B E H A V I O R A L S A F E T Y I N E U R O P E
Hierarchical Driver Task-Cube Model At the University of Helsinki, Professor Heikki Summalaemphasized the importance of using behavioral modelsto guide roadway safety research. Indeed, in Europe a formaldiscipline called “traffic psychology” uses such models.Figure 30 shows one such model that relates the level ofpsychological processing to a functional hierarchy of vehiclecontrol and a functional taxonomy of strategic behavior.These functional divisions are similar to inner- and outer-loop control in quantitative driver models based onthe mathematics of control theory. Attention control is akey psychological process involved in driver distraction, overload, and underload.
This model has the advantage of combining the two types ofcontrol to make a variety of predictions from high-level tripdecisions to low-level vehicle control. It is very helpful in providing a framework that integrates many results aboutbehavioral adaptation, risk taking, maintenance of safety margins, and allocation of attention. Although the model isquite useful, it does not offer the quantitative predictions of a computational model.Figure 30. The driver task-cube model.
» Hierarchical Driver Task-Cube Model Contact InformationProfessor Heikki SummalaUniversity of Helsinki Traffic Research UnitSiltavuorenpenger 20 DFI-00014 University of HelsinkiHelsinki, FinlandPhone: +358 9 19 12 94 [email protected] �www.helsinki.fi
» Driver Behavior Model Contact InformationSelma de RidderTNO Human FactorsKampweg 5, PO Box 233769 ZG SoesterbergThe NetherlandsPhone: +31 346 356 [email protected] �www.tno.nl
The team was impressed with the coordinationbetween research goals and the highest levels ofgovernment in Europe. The best example of this isSweden’s Vision Zero. The Swedish Parliamentpassed an act specifying that the country’s official
long-term traffic safety goal is zero fatalities. This providesextremely clear direction to researchers and agencies responsi-ble for highway design and operation. Unlike the road safetyguiding philosophy in the United States that tolerates a certainnumber of fatalities and injuries and mandates only a desiredpercentage decrease in death and destruction, Sweden hasstated that no one should die on a Swedish road. SWOV inthe Netherlands expressed similar goals. In France, road safetywas a campaign issue in the national elections, and PresidentJacques Chirac has put major emphasis on road safety as anational priority. In general, Europe appears to be ahead ofthe United States in directing drastic improvements in road-way safety.
Vision ZeroIn October 1997, the Swedish Parliament passed a road trafficsafety bill mandating a long-term goal that no one should bekilled or seriously injured on a Swedish roadway. The designand operation of the Swedish road system, therefore, must beadapted to meet this new requirement. This is a drastic depar-ture from the traditional cost-benefit analysis that controls roadsafety in the United States. It is based on the ethical principlethat everything possible must be done to preserve human life sothat safety dominates cost. For example, Vision Zero means thatthe best technical solution to improve safety should be implemented rather than the least expensive solution or eventhe most cost-effective solution.
In the United States, primary responsibility for safe driving restswith the driver. The Federal government provides standardsand regulation for the design and construction of both vehiclesand roadways, but it is up to the driver to avoid errors such asrunning off the road, entering an intersection when the signal is
C H A P T E R 8 | T O P - D O W N L E A D E R S H I P 21
C H A P T E R 8
Top-DownLeadership
red, and crossing lanes into opposing traffic. The infrastructureis seldom fault tolerant, so a driver who makes a serious error islikely to suffer a serious consequence and also may inflict highcosts on other nearby roadway users.
The Swedish National Road Administration is taking severalsteps to achieve Vision Zero. Speed limits have been reduced inbuilt-up areas where pedestrians and bicyclists are in proximity,and principles of self-organizing roadways are used to encour-age drivers to follow the lower speed limits. Roundabouts areused to calm traffic and minimize collision risk. Vehicle safetystandards are promulgated with collision tests. Cable guardrailsare being installed to replace conventional guardrails. Speedlimits on national roads are under review because lower speedsare safer and safety dominates all other factors, including mobility. Seatbelt reminders are under consideration. Speed surveillance cameras are being installed. Companies are encouraged to include safety in their travel policies.
Vision Zero assumes that drivers will make errors and shiftsresponsibility to the roadway designers and operators, who arerequired to anticipate human error. For example, the centercable barrier in a 2+1 road protects the driver by absorbing theenergy of a collision with the barrier without deflecting thevehicle back into traffic. It also protects other drivers by preventing incursions into oncoming traffic.
Vision Zero is an attractive concept that might have usefulapplication in the United States. In August 2003, the IntelligentTransportation Society of America (ITS America) embraced anAmerican version of Vision Zero that also includes a concept ofzero delay. One potential challenge for applying Vision Zerohere is related to cost. Vision Zero eschews cost-benefit tradeoffanalysis that might imply a need for unlimited funds or unlimit-ed time to achieve the goal. This can be illustrated by anextreme hypothetical example. Suppose the entire U.S.Department of Transportation budget was allocated to imple-menting Vision Zero. No funds would be available to support
22 H U M A N F A C T O R S A N D B E H A V I O R A L S A F E T Y I N E U R O P E
air traffic control and inspection of aviation maintenance, soaviation fatalities would increase. Indeed, it is logically possiblethat the benefit of lives saved on the highway could be less thanlives lost in the air, so this purist realization of Vision Zerocould cause a net increase in total lives lost. Perhaps a U.S. version of Vision Zero could avoid this paradox by aiming forequality of fatalities and injuries across transportation modalities so driving would be as safe as flying. While not asconceptually attractive as no highway fatalities, this modifiedgoal would still represent a huge improvement in traffic safety.
Sustainable SafetyThe vision for sustainable safety originated in the Netherlandsin the early 1990s. The vision states that the next generationwill not have a road system that tolerates thousands of peoplekilled and tens of thousands injured in the Netherlands eachyear. It is based on three design principles: functionality, homogeneity, and predictability.
Functional use means that roads should not be used for unintended purposes, e.g., urban streets should not support the higher speeds used on arterials. This implies a need to categorize roads so that appropriate design standards can beapplied to each part of the road network.
Homogeneity means that design characteristics should remainconstant along a roadway. Road design should foster appropriate driver behavior, which is related to the concept ofself-organizing roads discussed earlier in this report.
Predictability refers to both the road and the behavior of roadusers. For example, the unexpected appearance of a bicyclist orpedestrian on a road would be a violation of predictability.
Implementation of sustainable safety will require substantialhuman factors research relating the driver to the roadway.Explicit marketing efforts will be needed to gain public acceptance of the concept.
Executive DirectionIn 2002, President Chirac of France decided to make road safety one of three major initiatives to be undertaken during hisfive-year term. The result was a spectacular decrease in trafficfatalities. Compared to 2002 when 5,731 people were killed,2003 spared 1,511 lives on French roadways. The main reduction in fatalities involved rural areas (-21.6 percent), interstate roads (-27.0 percent), pedestrians (-27.7 percent),drivers (-23.8 percent), and people between 25 and 44 yearsold (-23.7 percent). These are outstanding results, especiallywhen compared to the United States, where fatalities increasedover the past five years.
Several factors contributed to the success in France. Safetymeasures such as enforcing strict fines for not wearing seatbeltsor helmets, using cell phones while driving, and driving underthe influence of alcohol were increased, with strong media coverage of these changes. Speeding violations increased by 19 percent, including 8 percent from installation of automatedcamera ticketing. Almost 4.5 million driver points wereassessed, an increase of 43.8 percent. Revocation of driverlicenses increased 54.2 percent.
It seems clear that making traffic safety a national priority iseffective. It is problematic to assess how this might work in theUnited States.
» Vision Zero Contact InformationSwedish National Road AdministrationHead OfficeSE-781 87 Borlange [email protected]
» Executive Direction Contact InformationMathieu GoetzkeMinistére de l’Équipement des Transports duLogement du Tourisme et de la MerTour Pascal B92055 La Défense cedexFrancePhone: +33 (0) 1 40 81 63 [email protected]
» Sustainable Safety Contact InformationIR. F.C.M WegmanSWOV Institute for Road Safety ResearchPO Box 10902260 BB LeidschendamThe NetherlandsDuindoorn [email protected]
While the scan team obtained many usefulideas during its European study, six specifictopics were selected as potentialhigh-reward areas of opportunityin the United States:
� Self-organizing roads� Use of driving simulators� Multidisciplinary crash investigation� Human-centered roadway analysis and design� Top-down leadership commitment� Speed management
Since the team’s observations in each of these six areas havebeen summarized in previous chapters of this report,this section only briefly sketches some implementationgoals. More details can be found in the scan tourimplementation plan.
Self-Organizing Roads and Evaluation of 2+1Roadway DesignThis is possibly the most important implementation recommen-dation formulated by the team. Widespread adoption of thisnew road design standard has great potential for improvingsafety and mobility on two-lane roads with only modest capitalcosts compared to four-lane roads. Implementation objectivesare to promote awareness of self-organizing roads, assemble agroup of States willing to implement this new road design,facilitate the flow of information from Europe to these States,and establish an evaluation mechanism to compare costsand benefits of the 2+1 design.
Driving Simulators: Roadway Designand VisualizationWhile the state of the art in driving simulators in the UnitedStates is at least equal to that in Europe, Europeans have gainedsubstantial benefits by using their driving simulatorsto assist in the design and visualization of roadways. It is fareasier and cheaper to identify design flaws in simulators than torebuild roads and tunnels. Implementation objectives areto promote awareness of this use of driving simulators amongthe road-design community, establish a mechanism to aid road
C H A P T E R 9 | I M P L E M E N T A T I O N 23
C H A P T E R 9
Implementationdesigners in using driving simulators, and demonstrate anddocument the benefits of this new application ofdriving simulators.
Multidisciplinary Crash Investigation TeamsThe VALT standardized investigation protocol used in Finlandis based on teams representing several disciplines. Theimplementation objective is to determine how and if suchmultidisciplinary teams could be used in the United States.
Human-Centered Roadway Analysis and DesignThe United States has recognized the need to better understandthe factors contributing to crashes, and to develop tools suchas cognitive models that can predict driver behavior whenroadway and vehicle configurations are altered. The Europeanresearch community has organized to coordinate research effortsand create virtual networks, such as HUMANIST, that facilitatefundamental long-term research efforts. The implementationobjectives are to assess benefits and opportunities forcoordinating long-term research and development in the UnitedStates, and to explore whether human factors and cognitivemodel research and development can be a focus for aninnovative mechanism for long-term coordinated research. A further objective is to increase awareness of one particularhuman-centered roadway project: the pedestrian research findings from SINTEF in Norway.
Top-Down Leadership CommitmentGreat strides in road safety improvement have been accom-plished in Europe because of commitments from the highestlevels of government. Implementation objectives are to shareEuropean models of top-down leadership, and provide key gov-ernmental leaders with critical facts and information that willmotivate a similar leadership commitment in the United States.
Speed ManagementThe team observed several effective tools in Europe thatmanaged speed successfully. Implementation objectives are toincrease awareness of these tools and strategies, and to promotethe involvement of the insurance and motor vehicle manufac-turing industries in intelligent speed adaptation systems.
24 H U M A N F A C T O R S A N D B E H A V I O R A L S A F E T Y I N E U R O P E
VTT Technical Research Centre of Finland is a private contractresearch organization that has been around for more than 60years. With its 3,000 employees, VTT provides a wide range oftechnology and applied research services for its clients, privatecompanies, institutions, and the public sector. Economicturnover in 2003 was EUR213 million (US$256.7 million), 70percent of which was external income and 30 percent basicgovernmental financing.
VTT carries out three types of activities: commercial activities,joint projects, and self-financed projects. Commercial activitiesare performed according to direct demand from customers.Joint projects are initiated on the basis of need and typically arefunded jointly by VTT, companies, research financers, andother research parties. Self-financed research consists of tech-nology-based strategic research projects aimed at developing
competitiveness, and acquiring knowledge and expertise tomeet the future needs of customers.
The organization’s wide expertise in behavioral studies allowsit to study interactions of the driver/operator, vehicle, andenvironment. It typically analyzes human machine interfacesthat must be designed so users can operate the system easilyand without increased risk to traffic safety. Studies involveevaluations of driver behavior, development of advanced driver assistance systems, and investigation of road and railway crashes, to name a few.
Projects underway include the following:� A review of the speed-crash relationship for European roads� Efficient improvement of road safety� Developing transport policy assessment methods� Performance of composition technology in road or other
traffic area structures� Human-centered design for information society technologies
(HUMANIST)� Development of transport system impact assessment methods� Development of road marking and road user behavior
research methods
A P P E N D I X A
Scan Study SiteInformationLämpömiehenkuja 2, Espoo PO Box 1800FIN–02044 VTT, Finland Telephone: + 358 9 4561 Fax: + 358 9 456 7031Web: http://www.vtt.fi/rte/
Contact: Dr. Juha Luoma Chief Research ScientistPhone: +358 9 456 4533 Fax: +358 9 456 850E-mail: [email protected]
Academic research and higher learning that rests on it are thetwo basic functions of the University of Helsinki. Researchconducted in facilities and separate institutions covers allfields represented at the university.
About 50 percent of the research is financed by the university'soperating expenditure, and the rest is financed by externalfunds. Most external funds still come from public sources, suchas the Academy of Finland, National Technology Agency ofFinland, Ministries, and European Union (EU). In the past fewyears, the commercialization of research results has reached animportant position, and new forms of cooperation with businessand industry have been developed.
The activities and interests of the Traffic Research Unit cover
VTT Technical Research Centre of Finland—VTT Building and Transport
Siltavuorenpenger 20 DFI-00014 University of HelsinkiHelsinki, FinlandWeb: http://www.helsinki.fi
Contact: Professor Heikki SummalaPhone: 011+358 9 19 12 94 20Fax: 011+358 9 19 12 94 22E-mail: [email protected]
University of Helsinki—Traffic Research Unit
practically all areas of traffic psychology and road safety,although since the early 1970s it has specialized in driverbehavior theory, drivers' task analysis, and experimental real-life, on-road research.
Projects underway include the following:� Driver behavior on major two-lane roads of different design,
with specific emphasis on causes of head-on crashes.� Effects of the use of a hand-held versus hands-free mobile
phone on safety and understandability of the message while
driving in the city.� The role of exposure and visibility in deer-vehicle crashes.� Driving behavior in two countries that largely differ in traffic
and safety culture (Finland and Russia), looking at drivers who cross the border.
� Driving ability of different patient groups, as well as theoretical analysis of driver behavior.
The Traffic Research Unit also contributed to the Finnish governmental traffic safety plan for 2001-2005.
A P P E N D I X A | S C A N S T U D Y S I T E I N F O R M A T I O N 25
The acronym SINTEF stands for the Foundation for Scientific andIndustrial Research at the Norwegian Institute of Technology (now the Norwegian University of Science and Technology).
SINTEF is the largest independent private research organizationin Scandinavia. Fields of research are technology, natural sci-ence, medicine, and social science. The organization’s turnoverin 2003 was NOK1.7 billion (US$261 million). Contracts forindustry and the public sector generated more than 90 percentof income, while almost 8 percent came as basic grants from theResearch Council of Norway.
SINTEF works with all modes of transport, and research dealswith the local, national, and international levels. Examples ofresearch areas are development and design of infrastructure forall transport modes, maintenance of such infrastructure, transport planning, traffic management, safety, logistics, and ITS systems of the future.
Projects underway include the following:� Transport planning—Activities include data collection,
development of models, and analysis of demand for personand freight transport on national, regional, and local levels, as well as cost/benefit analysis and estimation of effects ofchanges in transport infrastructure. SINTEF also developstools for route planning and fleet management for businesscustomers.
� Traffic management—Traffic management is both generaland detailed regulation of the transport infrastructure to cre-ate an efficient, safe, and environmentally friendly traffic flow.
� Road planning—Road planning includes the spectrumfrom analysis and evaluation to find the right alternativeson a preliminary stage to detailed plans and solutions,including specification and design of road elements andthe landscape. The goal for road planning is to improvetransportation effectiveness, safety, and environmentalconditions by generating solutions giving positive totalresults for the community.
� Traffic safety—Safety in the transport field includes road,railway, ship, and air transport. The national transport planhas a goal of reducing the number of people killed in trafficto 200 per year, compared to the present level of about300 people.
NO-7465Klæbuveien 153Trondheim, NorwayWeb: http://www.sintef.no/
Contact: Dr. Tore KnudsenPhone: 47 73 59 46 60Mobile Phone: 47 92 61 94 13Fax: 47 73 59 46 56E-mail: [email protected]
SINTEF—Roads and Transport
The Danish Transport Research Institute (DTF) is a researchinstitute under the Danish Ministry of Transport. The purpose ofthe institute, established in August 2000, is to strengthen trans-port research with special focus on such fields as transport safety
and risk, as well as transport economics and modeling. The institute has a broad research basis, and activities areplanned with special focus on the interdisciplinary aspects oftransport problems. In these research fields, DTF carries out academic research, applied research besides working with innovation, consultancy services, and communication of know-how with a view to making the results of research and development available for practical exploitation.Projects underway include the following:� Distractions in the traffic environment—Study of
Knuth-Winterfeldts AlléBuilding 116DK-2800 Kgs. LyngbyPhone: +45 4525 6500Fax: +45 4593 6533Web: http://www.dtf.dk
Contact: Kurt PetersenResearch DirectorPhone: 011+45 45 25 65 22Fax: 011+45 33 38 14 41E-mail: [email protected]
Danish Transport Research Institute—(Danmarks TransportForskning)
VTI, the Swedish National Road and Transport ResearchInstitute, is a public national research institute organized underthe Ministry of Industry, Employment, and Communications.Since 1975, VTI has been located on the university campus inLinköping, some 200 km south of Stockholm. In 1998, VTIopened a branch office in Borlänge, where the headquarters forthe Swedish National Road Administration and Banverket(the National Rail Administration) are located. Thisestablishment demonstrates the institute's desire to deepencontacts with its largest clients.
VTI performs advanced applied research and developmentaimed at contributing to the national transport policyobjective for sustainable development. The Swedish NationalRoad Administration is the principal client. Extensiveresearch and development are also conducted for the SwedishAgency for Innovation Systems (Vinnova), and to anincreasing extent for the EU. Other clients include theNational Institute for Communications Analysis (SIKA),
Banverket, Civil Aviation Administration, SwedishEnvironmental Protection Agency, road contractors, and theautomotive industry.
Projects underway include the following:� TREE—An EC project with the aim to stimulate cooperation
and more efficient use of laboratory resources for road andtransport research in Europe.
� HARMONOISE—An EC project to develop methods topredict community noise levels from road and railway traffic.VTI takes part in the project.
� AGILE—An EC project with two general aims: to help theelderly to continue to drive safely for as long as possible, andto develop knowledge to establish rational EU policies fordelivering certification of fitness to drive.
� Driver licensing in Ghana—Development of a nationalprogram for driver examination and licensing in Ghana.
� TRAINER—An EC project aimed at improving youngdrivers' skills and training.
� ADVISORS—An EC project on advanced driver assistanceand vehicle control systems.
� REFLEX—An EC project to develop a new methodology ofroad construction and rehabilitation using steel reinforce-ment fabrics, with a goal of making road structures morecost effective by extending their lifetimes.
26 H U M A N F A C T O R S A N D B E H A V I O R A L S A F E T Y I N E U R O P E
whether distractions along roads and inside cars may have aninfluence on traffic safety, with special focus on advertisingsigns.
� Arterial Streets Towards Sustainability (ARTISTS) project—Holistic analysis of problems and methods forimproving traffic safety, environment, mobility, etc., on major arterial streets in European towns.
� Accident Investigation Board (HVU)—Participation in theNational Accident Investigation Board.
� Social characteristics of road users involved incrashes—Study based on combining information from somecrash databases and databases on income, education, andother relevant social parameters.
� Use of IT systems—Study on the use of IT systems,
especially mobile phones, in heavy vehicles and the effect ontraffic safety.
� Intelligent speed adjustment as a traffic safety technology—Ph.D. project on the effect on traffic safety ofvarious crash prevention technologies in cars.
� Road users in urban areas—Ph.D. project on traffic incities of the future, particularly elderly drivers.
� Transport system of the future—Study of road users’ needand requirement for traffic safety, mobility, and accessibilityin future traffic, with special focus on elderly road users andsurvey of ongoing developments.
� Methods for influencing car drivers’ choice of speed—Test of variable signposting and interviews with car driverson the investigation and speeding in general.
SE-581 95 Linköping, SwedenWeb: http://www.vti.se
Contact: Dr. Urban KarlströmDirector GeneralPhone: +46 13 20 42 10Fax: +46 13 20 40 82E-mail: [email protected]
Swedish National Road and Transport Research Institute (VTI)
Kampweg 53769 DE SoesterbergThe NetherlandsPhone: +31 346 356 211Fax: +31 346 353 977Web: http://www.tm.tno.nl/
Contact: Dr. Ir. A. Richard A. van derHorstPhone: +31 346 356 451E-mail: [email protected]
TNO Human Factors
TNO is the abbreviation for the Dutch NederlandseOrganisatie voor toegepast-natuurwetenschappelijk onder-zoek. The English name is the Netherlands Organization forApplied Scientific Research. In 1930, the Dutch Parliamentpassed the TNO Act, which regulates applied scientificresearch in the Netherlands. TNO was established by law in
A P P E N D I X A | S C A N S T U D Y S I T E I N F O R M A T I O N 27
1932. A revised and updated TNO Act became operative inMay 1986.
TNO Human Factors develops knowledge focused on humanbehavior and performance in demanding environments. Theorganization applies this knowledge to the innovation ofprocesses, products, and services for the Netherlands’ armedforces, private enterprise, and government. In 2004, TNOHuman Factors had a turnover of EUR16.5 million (US$20.8million). Fifty percent of this turnover related to projects for theNetherlands Ministry of Defense, including explorative researchand concrete projects.
A primary focus area is that the safety and efficiency of today’sroad traffic is highly dependent on human behavior. Trafficfatalities and road congestion make it clear that the presentsystem does not function optimally. It is possible to influencedriver behavior by structural changes in traffic control strate-gies, road design, and vehicle characteristics. Knowledge ofdriver perception of road environments can be applied to radi-cally change roadway categories and improve safety. Humanreaction and adaptation to modern road traffic control systemsis quantified by experimentation in instrumented cars and
driving simulators. Specifications for intelligent driver supportsystems such as navigation and collision avoidance systems aredeveloped on the basis of knowledge about traffic participants’reactions to these systems.
Projects underway include the following:� Visual perception and road design—Basic perceptual
processes in road traffic, legibility and comprehensibility ofroadside information, relation between design characteristicsand road user behavior, and principles of self-explaining roaddesign.
� Traffic control systems—User requirements for dynamictraffic information and control systems, and modeling ofbehavioral and safety effects of these systems.
� Driver support systems—Cognitive ergonomics of in-vehicle supports, assessment of visual and mental load, modeling expected behavioral and safety consequences ofsupports, and normalization and standardization of supports.
� Driver skills—Interaction between individual characteristicsand the design of roads, traffic information and controlsystems, support systems, and the effects of stressorsand other impeding factors on driver performanceand safety.
SWOV is an independent scientific institute with an objective tocontribute to road safety by means of scientific research and dissemination of the results.
Anticipatory research has always played an important role inanalyzing basic road safety problems and arriving at possiblesolutions. This research also contributes to improving road safe-ty. During the next few years, SWOV will carry out anticipatoryresearch on the following 10 subjects:� Road safety explorer � Infrastructure and road crashes � Analysis of the relationship among speed, speed variation,
and crashes � Measures for speed management � Choice of route in a road network
� Recognizable layout and predictable behavior � Novice drivers and driver training � Effects of education and information campaigns � Optimal investments � Use of information in decisionmaking on road safety
Projects underway include the following:� EU SafetyNet project—The project aims to collect data on
crashes and casualties in all 25 EU member states. The datawill be made available through the Internet, allowing comparison on an international level.
� SUNflower continuation—The goal of the original studywas to discover what had made the road safety policies ofthree countries (Sweden, the United Kingdom, and theNetherlands) so successful. The method and results of thefirst study will be used to analyze the road safety problems ina number of other countries. The goal is to determine themost effective measures. Meanwhile, the continuation studyhas started under the name of SUNflower+6. In addition tothe original three SUNflower countries, six more countrieswill take part in this study: Catalonia (Spain), CzechRepublic, Greece, Hungary, Portugal, and Slovenia.
P.O. Box 10902260 BB LeidschendamDuindoorn 32The NetherlandsPhone: +31 - 70 - 3173 333 Web: http://www.swov.nl
Contact: Fred WegmanDirectorPhone: +31 70 3173 332E-mail:[email protected]
SWOV—Institute for Road Safety Research
28 H U M A N F A C T O R S A N D B E H A V I O R A L S A F E T Y I N E U R O P E
The French National Institute for Transport and Safety Researchwas created by interministerial decree on September 18, 1985.INRETS is a state-financed scientific and technological bodyunder the dual administrative supervision of the Ministry ofResearch and the Ministry of Transport. The institute's activitiesinvolve such diverse fields as economics, sociology, psychology,physiology, ergonomics, biomechanics, acoustics, mechanics,mathematics, computer science, and electronics.
Projects underway include the following:� Road safety—crash analysis, prevention, road users’
protection, and rescue– Analysis of the road system and its components
(man, vehicle, infrastructure) – Factors and consequences of road crashes – Biomechanics and road user protection – Road safety policies, education, regulation, incentive
strategies, and penalties � Driving aids—information, assistance, and automation
– Intelligent systems, driving aids, and automated highways – Modeling and simulation for driving case studies – Urban and interurban guided transport systems – A technological approach to safety, security, and quality – Telecommunications and the new information technologies
in transport � Transport networks and services
– Modeling and traffic management in transport networks – Intermodality and multimodality in passenger transport – Freight intermodality – Socioeconomic analysis and assessment of infrastructures
and networks – Transport professionals – Sustainability and environment
� Transport and the environment – Sustainable mobility in large conurbations – Electric and hybrid vehicles and power components – The dynamics of guided systems and their maintenance
INRETS—Paris2 av Général Malleret-joinville 94114 ARCUEIL FRANCE – Phone: +33 (0)1 47 40 70 00 Fax: +33 (0)1 45 47 56 06Web: http://www.inrets.fr
Contact: Stéphane EspiéPhone: +33 (0)1 47 40 70 23E-mail: [email protected]
INRETS—Lyon25, Avenue FrançoisMitterrand F-69675 BRON CEDEX Phone: +33 4 72 14 23 00 Fax: +33 4 72 37 68 37
Contact: Jean-PierreMedeviellePhone: +33 4 72 14 25 85Claire Plantié NiclausePhone: +3 4 72 14 23 70E-mail: [email protected]
INRETS (Institut National De Recherche Sur Les Transports Et Leur Securite)
Finland Itinerary
Monday, June 14a.m. Finnish Program (Helsinki)p.m. Working Lunch (Helsinki)p.m. Finnish Program/
Site Visit (Helsinki)
Tuesday, June 15a.m. Finnish Program (Helsinki)p.m. Working Lunch (Helsinki)p.m. Finnish Program (Helsinki)
A P P E N D I X B | S C A N S T U D Y S I T E A G E N D A S 29
A P P E N D I X B
Scan Study SiteAgendas
Juha Luoma June 11, 2004 1 (1) Roadway Human Factors International Scanning Tour to Finland PROGRAM (Monday June 14, 2004)VTT Building and Transport (Lämpömiehenkuja 2 C, Espoo)
8:30 a.m. Welcome to VTT (Research Manager Heikki Kanner)8:45 a.m. Human Factors research at VTT Building and Transport
(Chief Research Scientist Juha Luoma) 9:00 a.m. Road markings (Senior Research Scientist Veli-Pekka Kallberg)9:25 a.m. Winter maintenance (Research Scientist Mikko Malmivuo) 9:50 a.m. Grade crossings (Senior Research Scientist Veli-Pekka Kallberg)10:15 a.m. Coffee break 10:45 a.m. Variable message signing (Senior Research Scientist Pirkko Rämä) 11:10 a.m. Road weather information service (Research Scientist Anna Schirokoff)11:40 a.m. Intelligent speed adaptation (Senior Research Scientist Harri Peltola)12:05 p.m. Traveler information service (Research Scientist Merja Penttinen) 12:30 p.m. Lunch 1:30 p.m. Shuttle bus leaves to Pasila, Helsinki 2:00 p.m. Visit to Finnra’s Traffic Information Centre 4:00 p.m. Shuttle bus leaves to the hotel
VTT Building and TransportVTT Technical Research Centre of FinlandLämpömiehenkuja 2, Espoo P.O. Box 1800, FIN–02044 VTT, Finland Phone: + 358 9 4561Fax + 358 9 456 [email protected] www.vtt.fi Business ID 0244679-4
30 H U M A N F A C T O R S A N D B E H A V I O R A L S A F E T Y I N E U R O P E
Program June 6 at SINTEF
8:45 a.m. Opening of the meeting and a short presentation of the participants from SINTEF and the U.S. Panel
9:00 a.m. Research Director Tore Knudsen: Presentation of our department, our HF staff, visions, goals and cooperation with other professionals (topic 5)
9:20 a.m. Senior Behavioral Scientist Gunnar Jenssen: Presentation of research projects concerning the interaction of in-vehicle and roadway technologiesand the utility of self-organizing roads (topic 1)
9:50 a.m. Behavioral Scientist Trine M. Stene: Presentation of a project where cognitive models of the driver and results of HF research projects will be incorporated into manuals and guidelines for road design and traffic regulations (topic 2)
10:15 a.m. Research Engineers Liv Ovstedal/Eirin Ryeng: Presentation of a project concerning children’s behavior in traffic and the importance for roadway design and traffic regulations (topic 6)
10:45 a.m. Break—walk to the driving simulator
11:00 a.m. Senior Behavioral Scientists Gunnar Jenssen and Terje Moen, Research Engineers Terje Giaever and Hans Skjelbred: Presentation of the driving simulator and projects concerning driving behavior and roadway design (topic 3)• Testing of different designs of roundabouts• Measures of driver’s reaction times related to new roadway design
(Soknedal)• Simulator road design of E-39, Orkdalsvegen
12:00-1:00 p.m. Luncheon—SINTEF
1:00-3:00 p.m. Guided tour to two road construction projects.Chief Engineer Svein T. Pedersen• E39-Orkdalsvegen, Ann J. Tinnmannsvik• E6-Melhus, Gunnar Knagg
3:00-3:30 p.m. End of the meeting—time to say goodbye
Norway Itinerary
Wednesday, June 16a.m. Norwegian Program/
Site Visit (Trondheim)p.m. Norwegian Program/
Site Visit (Trondheim)
A P P E N D I X B | S C A N S T U D Y S I T E A G E N D A S 31
Study visit by the Roadway Human Factors & Behavioral Safety International Scanning Tour, USA
June 17-18, 2004
Guests: Michael Trentacoste, FHWA Co-Chair, FHWA Turner-Fairbank HighwayResearch Center; Kevin Keith, AASHTO Co-Chair, Missouri Department ofTransportation; Dr. Barry Kantowitz, Report Facilitator, Transportation ResearchInstitute, University of Michigan; Dr. Leanna Depue, Missouri Safety Center,Central Missouri State University, Dr. Thomas Granda, FHWA Turner-FairbankHighway Research Center; Ernest Huckaby, Office of Transportation Operations,FHWA; Bruce Ibarguen, State Traffic Engineer, Maine Department ofTransportation; Wesley Lum, Division of Research and Innovation, CaliforniaDepartment of Transportation; Terecia Wilson, Director, Safety Office, SouthCarolina Department of Transportation; Jake Almborg, ATI, Inc. DelegationCoordinator; Mats Petersson, SNRA
Hosts: Dr. Urban Karlström, Director General, and Dr. Hans Erik Pettersson,Research and Marketing Director, Region Goteborg
Meeting room: Vättern
Thursday, June 179:00 a.m. Welcome and introduction to VTI
Dr. Urban Karlström, Director General
9:15 a.m. Introduction of U.S. DelegationMr. Michael F. Trentacoste and Mr. Kevin Keith
9:30 a.m. Overview of VTI human factors research within road design and vehicle systemsDr. Hans Erik Pettersson and Dr. Lena Nilsson
10:00 a.m. Road safety and safety trends on the national rural road networkDr. Göran Nilsson
10:20 a.m. Coffee
10:30 a.m. Presentations of research in road design measures for safety• Road equipment
Dr. Sven-Olof Lundkvist• Experiences of development of roundabouts in urban and
rural areasMr. Jörgen Larsson
• New road design: 2+1 roadsMr. Arne Carlsson
12 Noon Lunch at the Lilla Skafferiet
Sweden Itinerary
Thursday, June 17a.m. Swedish Program (Linkoping)p.m. Working Lunch (Linkoping)p.m. Swedish Program (Linkoping)
Friday, June 18a.m. Swedish Program/
Site Visits (Linkoping)p.m. Working Lunch/
Site Visits (Linkoping)
32 H U M A N F A C T O R S A N D B E H A V I O R A L S A F E T Y I N E U R O P E
1:00 p.m. Presentation of the VTI driving simulatorDr. Staffan Nordmark
The VTI driving simulator as a tool for road designMr. Mats Lidström
1:30 p.m. Demonstration of the VTI driving simulator and presentations of other resources for human factors research as the VTI instrumented car, etc. Dr. Staffan Nordmark, Mr. Mats Lidström, Dr. Lena Nilsson, Ms. Ulla Kaisa Knutsson
2:30 p.m. Research and experiences of milled rumble stripsMs. Anna Anund
VTI recommendations for road design based on studies of old drivers’ needsMr. Per Henriksson
3:10 p.m. Coffee Break
3:20 p.m. Examples of other studies; roadwork furnituring, transition curvesDr. Lena Nilsson and Mr. Sven Dahlstedt
3:40 p.m. Discussion and summing up of the dayDr. Urban Karlström, Dr. Hans Erik Pettersson, Dr. Lena Nilsson, Mr. Sven Dahlstedt, Dr. Staffan Nordmark, Mr. Mats Lidstrom, Mr. Jörgen Larsson and Mr. Arne Carlsson
6:30 p.m. Dinner hosted by the U.S. Panel at Stangs pm & Co.
Friday, June 189:00 a.m.-3:00 p.m. The Swedish National Road Administration, SNRA, Region
Southeast, will be host to site visits to rural and urban sections with new design features in the Southeast RegionMr. Mats Petersson, SNRA and Mr. Arne Carlsson, Mr. Jörgen Larsson and Ms. Ulla Kaisa Knutsson, VTI
Denmark Itinerary
Monday, June 21a.m. Danish Program
(Copenhagen)p.m. Danish Program
(Copenhagen)
A P P E N D I X B | S C A N S T U D Y S I T E A G E N D A S 33
Roadway Human Factors & Behavioral Safety International Scanning Tour Programme
9:00-9:15 a.m. Welcome and programmeKurt Petersen, DTF
9:15-9:45 a.m. Presentation of the Scanning Tour
9:45-10:00 a.m. Introduction to Danish Transport Research Institute (DTF)Kurt Petersen
10:00-10:30 a.m. Coffee break
10:30-11:30 a.m. Intelligent Speed AdaptationINFATI/Bente Schmidt Nielsen, University of AalborgISA/Christer Hydèn, Technical University of Lund
11:30 a.m.-12 noon Other speed management optionsVariable speed signsLotte Larsen, DTF
12 noon-1:30 p.m. Lunch break
1:30 p.m.-3:00 p.m. Mini-workshops: • Collision avoidance—A safety tool for the driver?• Analysis of conflicts in a complex traffic environment—
Analysis method
34 H U M A N F A C T O R S A N D B E H A V I O R A L S A F E T Y I N E U R O P E
INRETS Provisional ProgrammeINRETS, Lyon Bron, 25 Avenue Francois Mitterrand—case 24, 69675 Bron cedexContact person: Mrs. Corinne Brusque, Phone +33 (0)4 72 14 24 36
M. Jean Pierre Medeville, INRETS Deputy Managing Director and INRETS Directorfor International Affairs; Mrs. Claire Plantie Niclause, INRETS Deputy-Director forInternational Affairs; and M. Jean Luc Ygnace, Research Engineer in ITS socio economic assessment, will attend part of the meeting.
9:00 a.m. Welcome and presentation of the INRETS Lyon-Bron siteM. Dominque Cesari, Director of the INRETS, Lyon Bron site
9:15 a.m. Laboratory Ergonomics & Cognitive Sciences in Transport Presentation of the LaboratoryMrs. Corinne Brusque, Head of LESCOT
9:45 a.m. In-depth analysis of driving activity for the assessment of elderly drivers’ competency: a first step for the standardization of road tests.• Comparison between elderly drivers involved or not involved
in accidents during the last three years.• Comparison between elderly and younger driver’s behaviour
during turn across traffic intersections.Mme Claude Marin-Lamellet, Mme Catherine Gabaude, Mme Laurence Paire-Ficout
11:00 a.m. Road infrastructure and mental load evaluation from Heart Rate Variability measurementM. Andre Chapon
11:30 a.m. Mental model of the driving situation: dual task effect on event versus road characteristics detectionMme Beatrice Baillly
12 noon Cognitive models of the driversMrs. Helene Tattegrain-Veste, M. Thierry Bellet
12:30 p.m. An example of integration of European research capacities on Human Factors: the “Humanist” network of excellenceMrs. Corinne Brusque
1:00 p.m. Lunch
2:30 p.m. Presentation of the laboratory for biomechanics and crash test and visit of its installations on the INRETS—Lyon Bron siteM. Dominique Cesari
4 p.m. End of meeting
The Netherlands Itinerary
Tuesday, June 22a.m. Dutch Program (Soesterberg)a.m. Working Lunch (Soesterberg)p.m. Dutch Program (Soesterberg)
Wednesday, June 23a.m. Dutch Program/Site Visits
(Leidsche Rijn)p.m. Working Lunch/Site Visit
(Leidschendam)p.m. Dutch Program/Site Visits
(Leidschendam-Rotterdam)
France Itinerary
Thursday, June 24a.m. French Program (Lyon-Bron)p.m. Working Lunch (Lyon-Bron)p.m. French Program (Lyon-Bron)
A P P E N D I X B | S C A N S T U D Y S I T E A G E N D A S 35
INRETS—Paris-Arcueil2 avenue du General Malleret Joinville94114 Arcueil cedex (RER station Laplace–line B)Contact person: Mrs. Claire Plantie Niclause + 33 (0)6 81 48 67 64
9:00 a.m. Pick up at the Laplace RER station (INRETS vehicles)
9:15 a.m. Welcome and presentation of the INRETS Arcueil siteMrs. Marlene Choukroun, Head of communication
9:25 a.m. Presentation of INRETS scientific programmesMrs. Helene Fontaine, Director of the INRETS–Arcueil site
9:45 a.m. Urban transport policies impact on healthM. Sylvain Lassarre
10:30 a.m. Driving simulator usages in INRETSM. Pierre Gauriat
11:15 a.m. Visit of installations: driving simulatorM. Pierre Gauriat
12:15 p.m. Lunch, Restaurant Le Pavillon Montsouris, 20 rue Gazan, 75014 Paris, +33 (0)1 43 13 29 00 with: M. Jean Panhaleux, French Ministry of Transport-Deputy Director for Traffic and Road Safety; M. Guy Bourgeois, INRETS Managing Director; M. Mathieu Goetzke, French Ministry of Transport, Directorate for Scientific and Technical Affairs-Head of international relations
2:30 p.m. User behaviour and visual perception in fog—fog simulationMrs. Viola Cavallo
3:15 p.m. Simulator use and road crossing by aged pedestriansM. Regis Lobjois
4:00 p.m. In-depth analysis of road situations and driver activities. The cases of intersections crossing and motorway drivingMme Farida Saad
4:45 p.m. Discussion
5 p.m. End of visit
Friday, June 25
a.m. French Program (Paris/Arcueil)
p.m. Working Lunch (Paris/Arcueil)
p.m. French Program (Paris/Arcueil)
36 H U M A N F A C T O R S A N D B E H A V I O R A L S A F E T Y I N E U R O P E
Kevin Keith (AASHTO Co-chair)Chief EngineerMissouri Department of TransportationPO Box 270Jefferson City, MO 65102Telephone: (573) 751–3692/2803Fax: (573) 526–5419E-mail: [email protected]
Michael F. Trentacoste (FHWA Co-chair)Director, Office of Safety Research
& DevelopmentFederal Highway AdministrationTurner-Fairbank Highway
Research Center6300 Georgetown PikeMcLean, VA 22101Telephone: (202) 493–3260Fax: (202) 493–3170E-mail: [email protected]
Dr. Leanna DepueDirectorMissouri Safety Center, Central Missouri
State UniversityHumphreys 201Warrensburg, MO 64093Telephone: (660) 543–4830Fax: (660) 543–4482E-mail: [email protected]
Dr. Thomas M. GrandaHuman-Centered Systems Team LeaderFederal Highway Administration Turner-Fairbank Highway
Research CenterOffice of Safety Research
& Development, HRDS-076300 Georgetown PikeMcLean, VA 22101Telephone: (202) 493–3365Fax: (202) 493–3374E-mail: [email protected]
Ernest (Ernie) D. L. HuckabyManual on Uniform Traffic Control
Devices (MUTCD) Team LeaderFederal Highway AdministrationOffice of Transportation Operations400 Seventh Street, SW.Washington, DC 20590Telephone: (202) 366–9064Fax: (202) 366–3225E-mail: [email protected]
Bruce A. IbarguenState Traffic EngineerMaine Department of Transportation16 State House StationAugusta, ME 04333Telephone: (207) 624–3620Fax: (207) 624–3621E-mail: [email protected] [email protected]
Dr. Barry H. Kantowitz (Report Facilitator)DirectorUniversity of Michigan Transportation
Research Institute2901 Baxter RoadAnn Arbor, MI 48109-2150Telephone: (734) 936–1046Fax: (734) 936–1081E-mail: [email protected]
Wesley (Wes) S. C. LumChief, National LiaisonDivision of Research and InnovationCalifornia Department of Transportation1227 O Street, 5th FloorSacramento, CA 95814Telephone: (916) 654–8892Cell Phone: (916) 205–1349Fax: (916) 657–4721E-mail: [email protected] [email protected]
Terecia W. WilsonDirector, Safety OfficeSouth Carolina Department of
TransportationP.O. Box 191Columbia, SC 29202Telephone: (803) 737–0403/1161Fax: (803) 737–9938E-mail: [email protected] or [email protected]
A P P E N D I X C
Team Members
The scan team wishes to learn how countries plan,develop, and conduct human factors studies andresearch pertaining to roadway design and opera-tions, and how the results are put in practice bydesign and traffic engineers and others responsible
for roadway infrastructure and operations. The team wishes tomeet highway researchers, research psychologists, and othersinvolved with human factors research of highway design andoperations, as well as transport managers responsible for considering and incorporating human factors results in theactual practice of roadway design and operations.
The team wishes to spend about equal times in discussions withthese two groups. The team further desires to spend equal timewithin these two groups in discussions, as well as viewing actualpractices. Accordingly, time would be spent with researchers inviewing simulators and other research methods. For roadwayengineers and practitioners, the team would benefit from view-ing how human factors research is incorporated into their workproducts, such as roadway design and traffic control devicesplans, or from visiting actual roadways where human factorsstudies resulted in a redesign or special treatment to the roadway.
The following are the amplifying questions for the scan study:
Topic 1: To assemble information on how human factors(HF) issues are considered in the practice of design andoperations of roadways.A. How is HF research used to evaluate existing or new road-
way design and operation countermeasures to improve safetyand mobility?
B. What specific HF research projects have yielded the highestpayoff for roadway design and operations?
C. How do in-vehicle and roadway technologies interact?D. Have any HF research projects demonstrated the utility of
the concept of self-organizing roads?
A P P E N D I X D | A M P L I F Y I N G Q U E S T I O N S 37
A P P E N D I X D
AmplifyingQuestions
Topic 2: To find out how human factors issues are commu-nicated to roadway design and operations engineers andpractitioners and how users communicate their needs.A. How are HF research needs defined and prioritized?B. How are results of HF research incorporated into national
roadway design and operations standards, guidelines, andrecommended practices?
C. What specific HF research projects, if any, have had consideration given to implementation/deployment strategies as part of the research process?
Topic 3: Driving simulators as a human factors research tool.A. What specific projects have used simulators to study
roadway design and operations?B. How have simulators been used to evaluate traffic control
devices or warning devices?C. How have simulator studies been validated?D. What levels of simulator fidelity are necessary for this
research?E. How do “good results” on simulator studies get used
in real-world situations?F. How have simulators been used to train novice or
older drivers?
Topic 4: Other human factors research methods useful instudying roadway design and operations.A. What are the relative costs and benefits of focus group, test
track, on-road, and simulator HF research?B. What specific projects, if any, have used cognitive models of
the driver?C. What human factors research methods are used?
Topic 5: To learn how the human factors research processis sustained and improved.A. How are HF research projects monitored for quality?B. Is there a methodology to predict anticipated benefits
38 H U M A N F A C T O R S A N D B E H A V I O R A L S A F E T Y I N E U R O P E
resulting from HF research?C. How is the proficiency of the HF staff maintained and
improved?D. How does HF staff interact with other roadway design and
operations professionals?E. What are the vision and goals of the HF group?F. What is the role, if any, of multidisciplinary teams in the
development of research topics and plans?
Topic 6: To discover human factors success stories thatcan be used to quickly improve roadway design and operations.A. What specific HF projects have yielded the highest payoff?B. What roadway design and operation improvements have
been implemented based on HF research?C.Are there any specific human factors research results that can
be applied to the following:– Users (pedestrians, bicyclists, persons with disabilities,
older and younger drivers, etc.)– Traffic control devices (signs, markings, etc.)– Operations (intersections, speed management, etc.)