road trac estimates: great britain 2020 - gov.uk
TRANSCRIPT

Statistical Release 28 April 2021
Road Traffic Estimates: Great Britain 2020
Road traffic trends during 2020 have been affected by the coronavirus (COVID-19) pandemic in the UK.
280.5 billion vehicle miles were driven on Great Britain’s roads in 2020, a decrease of 21.3% compared to the previous year.
Vehicle miles travelled by selected vehicle types in Great Britain, 2010-2020
80
90
100
110
120
130
140
2010 2012 2014 2016 2018 2020
Index of vehicle miles, 2010 = 100
Change 2019 - 2020Vans
(Light Commercial Vehicles)
-9.1%
Lorries(Heavy Goods Vehicles)
-5.7%
All motor vehicles
-21.3%
Cars & Taxis -24.7%
In 2020:• Car traffic decreased by 24.7% from 2019 levels. The figure of 209.6
billion vehicle miles (bvm) is the lowest annual estimate of car traffic inthe last 29 years (page 9).
• Van traffic decreased by 9.1% from 2019 to 50.5 bvm. The lowestlevel for 5 years (page 10).
•
•
Lorry traffic decreased by 5.7% compared to 2019. At 16.4 bvm, this was the lowest level since 2014 (page 11).Pedal cycle traffic (cyclists on public highways, and the paths next to them) was 5.0 bvm, 45.7% above 2019 levels. This is the highest level of cycling on the public highway since the 1960s (page 14).
•
•
Motorways carried 52.7 bvm of traffic, decreasing by 25.3%compared to 2019. (page 16).The Strategic Road Network carried 72.6 bvm of traffic; a decrease of 25.1% on 2019 levels. The Strategic Road Network carried 30% of all motorised traffic in England (page 19).
• ‘A’ roads saw a 23.2% decrease in traffic from 2019 (page 17).
• Minor road traffic decreased by 17.2% since 2019 (page 18).
About this releaseThis release presents the 2020 annual estimates of traffic on Great Britain’s roads, including the period following the government’s announcement of measures to limit the impact and transmission of the coronavirus (COVID-19) pandemic. For more on this, see page 2.
The release focusses on recent trends in traffic broken down by vehicle type, road category and geographic area.
Traffic statistics are mostly presented in units of vehicle miles, which combines the number of vehicles on the road and how far they drive.
Annual traffic statistics are compiled using data from around 8,000 roadside 12-hour manual counts,continuous data fromautomatic traffic counters,and data on road lengths.
ContentsAbout this Release 2
Impact of Coronavirus 3Traffic statistics by:- Vehicle Type 8- Road Classification 15 - Strategic Road
Network 19
- Geography 22- Urban and Rural
areas 24
Background Information 26
RESPONSIBLE STATISTICIAN: Anna Heyworth AUTHOR: Behnom Havaei-Ahary Email: [email protected] INFORMATION: Media: 020 7944 3066 Public: 020 7944 3095

Statistical Release – Annual Road Traffic Estimates – Page 2 of 28
About this ReleaseChanges to the 2020 Road Traffic publication following the impact of coronavirus (COVID-19) on traffic estimates
The traffic estimates presented in this release cover the calendar year of 2020 and include the period following the government’s announcements of measures to limit the impact and transmission of the coronavirus (COVID-19) pandemic. Coronavirus has had a wide impact on UK society and economic activity since March 2020.
This release focusses mainly on short term trends, comparing traffic estimates for 2020 with the previous calendar year. Whilst historically significant, the long term trends for this year can be misleading in most cases due to the extraordinary circumstances observed as a result of the coronavirus pandemic.
As shown in the chart, vehicle miles travelled in Great Britain have had year-on-year growth in each year between 2010 and 2019.
However, the sharp decrease in 2020 has resulted in traffic estimates that are lower than the 2010 levels. Therefore, to say traffic has fallen over the last decade would misconstrue as the overall decrease is entirely due to the decline in traffic levels observed in the 2020 estimates.
Long term trends are presented on page 7 of this release. The full historic series of road traffic estimates are available in the tables that are published alongside this release (link).
For more in-depth long term analysis of historic trends in road traffic, please see our previous release: Road Traffic Estimates - Great Britain 2019.
Vehicle miles travelled in Great Britain, 2010-2020
0.8% 0.3% 0.9% 3.3% 2.3% 2.6% 2.1% 1.3% 2.0%
-21.3%
0
50
100
150
200
250
300
350
400
2010 2011 2012 2013 2014 2015 2016 2017 2018 2019 2020
year on year % change
Key definitions:Traffic Traffic refers to the total distance travelled by all vehicles over the year, measured in vehicle miles. This combines the number of vehicles on the road, and how far they drive.
Flow Flow refers to the average number of vehicles travelling along a given stretch of the road network per day (24 hours).
BillionIn this release 1 billion = 1000 million (109).
Index NumberUsed in this release to compare changes over time (from a selected base year) across multiple indicators where they cannot be directly compared.

Statistical Release – Annual Road Traffic Estimates – Page 3 of 28
Impact of coronavirus (COVID-19) The coronavirus (COVID-19) pandemic has had a marked impact on everyday life, including on traffic on the road network. In early March 2020 the UK government set out four phases in its response to coronavirus, with the first national lock down commencing on 23rd March. This, and subsequent restrictions, limited the movement of people to varying degrees.
2% 2%
-23%
-63%
-49%
-31%
-19%-14% -11%
-17%
-27%-21%
Jan Feb Mar Apr May Jun Jul Aug Sep Oct Nov Dec
Motor vehicle traffic in Great Britain, 2020Percentage change since equivalent month in 2019
During the “Stay Home” period in late March and April 2020, only essential workers were allowed to go to their place of work, and travel outside of the home was severely limited. April 2020 was the month which saw the largest fall in traffic, 63% lower than traffic levels in April 2019.
As the restrictions started to ease, the monthly traffic levels increased gradually to September 2020, when traffic levels were 11% lower than September 2019. Subsequent lockdowns and restrictions led to lower traffic levels in October-December when compared to the equivalent months in 2019.
An analysis of the road traffic data by time of day shows that the reductions in road traffic were not uniform across all hours of the day.
The February 2020 figures show a standard hourly profile of traffic with peaks between 7am-9am and 4pm-5pm.
The April 2020 levels show that traffic fell across all hours of the day, and remained fairly level, with no morning or afternoon peaks.
As the restrictions eased, in May and June 2020, traffic levels increased more in the afternoon. The morning peaks in traffic returned during September 2020.
0
50
100
150
200
0 1 2 3 4 5 6 7 8 9 10 11 12 13 14 15 16 17 18 19 20 21 22 23
Motor vehicle traffic by hour of day, selected months, 2020Index: 100 = same traffic as an average hour in the equivalent month in 2019
Feb
Sep
Nov
Apr
May

Statistical Release – Annual Road Traffic Estimates – Page 4 of 28
Impact of coronavirus (COVID-19) Vehicle TypesChange in miles travelled by vehicle type in Great Britain, 2019-2020
-24.7%
-9.1% -5.7%
-17.5%
-32.0%
45.7%
1
Cars & Taxis
Vans (Light Commercial Vehicles)
Lorries (Heavy Goods Vehicles) Motorcycles
& scootersBuses & coaches
Pedal Cycles
0
20
40
60
80
100
120
Jan Feb Mar Apr May Jun Jul Aug Sep Oct Nov Dec
All motor vehicle types saw a decrease in traffic levels during 2020. Car and bus traffic were most heavily impacted, decreasing by 24.7% and 32.0% respectively. Although van and lorry traffic experienced a smaller fall in vehicle miles, they still saw decreases of 9.1% and 5.7%, respectively. Conversely, pedal cycle traffic increased by 45.7%.
Monthly vehicle traffic trends by selected vehicle types, 2020
Index: 100 = same traffic as equivalent month in 2019
Cars & Taxis
Vans (Light Commercial Vehicles)
Lorries (Heavy Goods Vehicles)
Cars, vans and lorries all saw their lowest levels during April 2020, following lockdown measures legally coming into force on 23rd March 2020.
Car and van traffic throughout April 2020 dropped by more than 50% compared to flows in April 2019.Lorry traffic saw less of a drop but was still around a third lower than flows in April 2019.
As restrictions were eased throughout the summer months, van and lorry vehicle traffic returned to similar levels seen in 2019. In September, van and lorry traffic was at 91% and 99% of the September 2019 levels, respectively.
Car traffic also recovered during this time, but remained below 2019 levels. Car traffic was also more impacted by the England lockdown (which came into force on 5th November 2020). Car traffic was 69% of the November 2019 levels.

Statistical Release – Annual Road Traffic Estimates – Page 5 of 28
Impact of coronavirus (COVID-19) Road TypesChange in miles travelled by road type in Great Britain, 2019-2020
-25.3%-23.2%
-17.2%
1
Motorways ‘A’ Roads
Minor Roads
All road types saw a decrease in traffic levels during 2020. Motorway and ‘A’ road traffic were most heavily impacted, decreasing by 25.3% and 23.2%, respectively. Although minor roads experienced a smaller fall in vehicle miles, they still saw a decrease of 17.2%.
Monthly vehicle traffic trends by road type, 2020
0
20
40
60
80
100
120
Jan Feb Mar Apr May Jun Jul Aug Sep Oct Nov Dec
Motorways, ‘A’ roads and minor roads all saw their lowest levels of vehicle flow during April 2020, following lockdown measures legally coming into force on 23rd March 2020.
Motorway and ‘A’ road flows in April 2020 dropped by more than 65%, compared to flows in April 2019. Minor roads were 43% of their equivalent April 2019 flows.
As restrictions were eased throughout the summer months, traffic increased on all road types. In September 2020 traffic on motorways, ‘A’ roads and minor roads were 84%, 88% and 93% of their equivalent September 2019 flows, respectively.
Traffic flows on all road types were also impacted by the England lockdown (coming into force on 5th November 2020). Motorways saw the largest fall with traffic flows in November 2020 at 64% of the equivalent November 2019 levels.
Index: 100 = same traffic as equivalent month in 2019
Motorways‘A’ Roads
Minor Roads

Statistical Release – Annual Road Traffic Estimates – Page 6 of 28
Impacts of Coronavirus (COVID-19)Whilst traffic levels can act as a barometer of trends in the economy and society, traffic itself also has a variety of impacts on human life and the environment.
The final 2020 statistics are not yet available for these areas. The information below provides the latest provisional figures for 2020. As these figures are provisional, they are subject to change and so should be used with caution.
Road AccidentsProvisional figures for the year to end June 2020 estimated that there were 1,580 road deaths. This was a decrease of 14% compared to the previous year. This is the same as the decrease in road traffic over the same period. Previously published quarterly figures estimated that road traffic fell 14% in the year to end June 2020.
Decreases in traffic tend to lead to smaller numbers of interactions between road users. Therefore, all else being equal, a fall in traffic is expected to decrease the total number of accidents. However, there are a range of reasons for differing changes in road traffic and road accidents. These include: improvements in education and training; improvements in vehicle technology and highway engineering; improvements to trauma care; the introduction of road safety policies, such as speed limits; enforcement of legislation; and behavioural change.
Journey times and reliability It might be expected that a decrease in traffic would result in lighter congestion. However, the relationship is not that simple. The effect of an decrease in traffic on congestion will depend on where and when the reduction in vehicle miles occur. For example, where congestion is most severe during the morning and evening rush-hour on weekdays, a decrease in traffic at these peak times could have a large effect on congestion levels, but at other times of day may have little effect.
On the Strategic Road Network (SRN) for 2020, the average delay decreased by 29.5% compared to 2019. This is a larger decrease than that in traffic levels (-25.1%), reflecting the complex relationship between traffic and congestion.
However, similar decreases were seen on the local ‘A’ road network in England. The average delay decreased by 22.8% on 2019, compared with a decrease of 22.3% in traffic levels over the same period.
Greenhouse gas emissions and air qualityCarbon dioxide (CO2) emissions in the UK are provisionally estimated to have fallen by 10.7% in 2020 from 2019, to 326.1 million tonnes (Mt). CO2 emissions from transport fell 19.6% in 2020, accounting for over half of the overall fall from 2019.
Statistics for the 2020 road transport element of the CO2 emissions from transport were not available at the time of publication. In 2019, road transport accounted for 25% of the UK’s CO2 emissions.

Statistical Release – Annual Road Traffic Estimates – Page 7 of 28
Long-term traffic trends
Percentage change from previous year
The coronavirus pandemic has had the biggest single-year impact on road traffic since records begin in 1949.
-25%
-20%
-15%
-10%
-5%
0%
5%
10%
15%
20%
1950 1955 1960 1965 1970 1975 1980 1985 1990 1995 2000 2005 2010 2015
Year-on-year growth in motor vehicle traffic in Great Britain, since 1950
High growth in car ownership
Suez crisis OPEC oil embargo
1980s strong economic
growthEarly 1990s recession
Fuel protests
Fuel price spike and economic downturn
Coronavirus
2020
Between 1949 and 2019 motor vehicle traffic had increased almost ten-fold from 28.9 to 356.5 billion vehicle miles, largely driven by steady growth in car traffic. Car traffic in 2019 was over 20 times higher, whereas lorry traffic was only around twice as high and bus traffic was similar to the 1949 level. This has altered the share of traffic by vehicle type over time, with the car traffic share rising from 44% in 1949 to 78% in 2019, and the lorry traffic share falling from 27% to 5%.
0
50
100
150
200
250
300
350
400
1949 1960 1970 1980 1990 2000 2010 2020
Motor vehicle traffic in Great Britain, since 1949
2000s: 6% growth
1990s: 14% growth
1980s: 50% growth
Billion vehicle miles
Cars & Taxis
Vans (Light Commercial Vehicles)
Lorries (Heavy Goods Vehicles)
Motorcycles & scooters
Buses & coaches
+2106%
+1254%
+123%
+57%
Changes: 1949 - 2019 2019-2020
+1134%All motor vehicles
2010s: 17% growth -3%
-24.7%
-9.1%
-5.7%
-17.5%
-21.3%
-32.0%
In contrast to motor vehicle traffic, pedal cycle traffic (on public highways, and the cycle paths and footpaths adjacent to them) fell rapidly during the 1950s and 1960s, followed by a period of relative stability. Between 2000 and 2019, there were steady rises in cycle miles. In 2020, there was a 45.7% increase on the 2019 levels to 5.0 billion cycle miles. This is the highest level of cycling on the public highway since the 1960s.
Statistical Release – Annual Road Traffic Estimates – Page 8 of 28
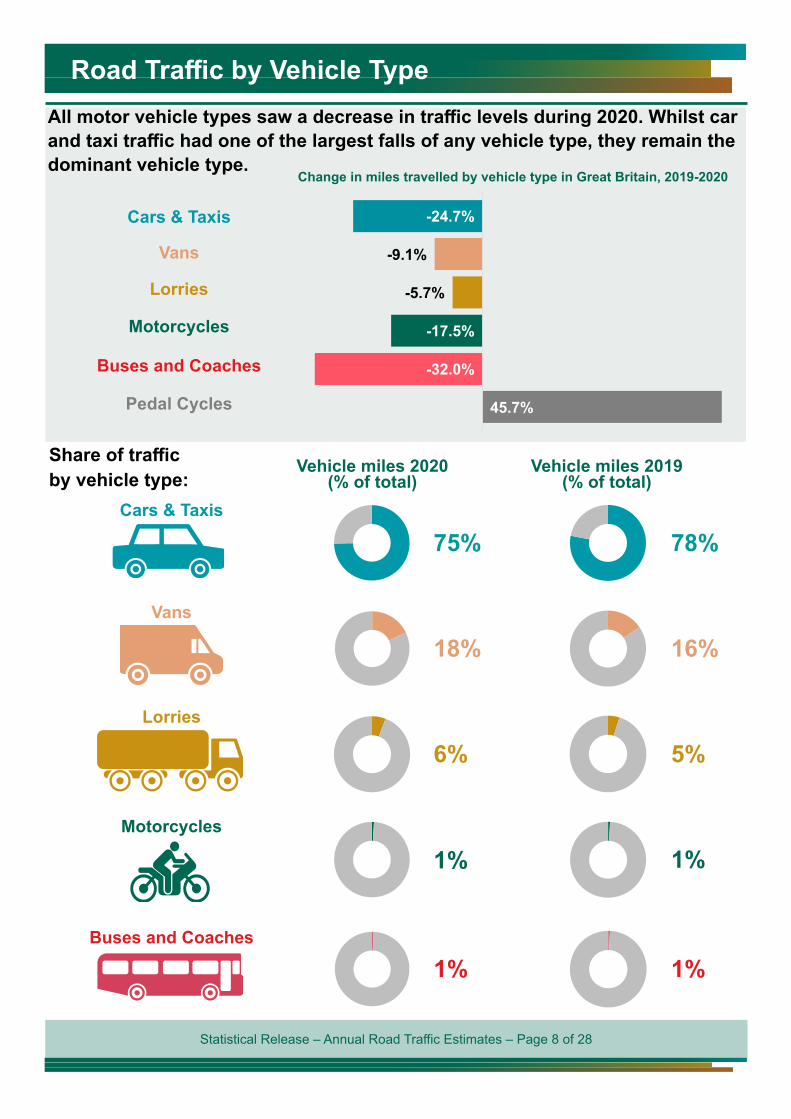
Road Traffic by Vehicle TypeAll motor vehicle types saw a decrease in traffic levels during 2020. Whilst car and taxi traffic had one of the largest falls of any vehicle type, they remain the dominant vehicle type.
Change in miles travelled by vehicle type in Great Britain, 2019-2020
45.7%
-32.0%
-17.5%
-5.7%
-9.1%
-24.7%Cars & Taxis
Vans
Lorries
Motorcycles
Buses and Coaches
Pedal Cycles
Share of traffic by vehicle type:
Vehicle miles 2020 (% of total)
Vehicle miles 2019(% of total)
Cars & Taxis
75% 78%
Vans
18% 16%
Lorries
6% 5%
Motorcycles
1% 1%
Buses and Coaches
1% 1%

Statistical Release – Annual Road Traffic Estimates – Page 9 of 28
Cars & taxisCompared with 2019, car and taxi traffic in Great Britain decreased by 24.7% to 209.6 billion vehicle miles in 2020.
209.6billion car & taxi miles in
2020
Motorways
34.7 17%
‘A’ roads
Minor roads
87.2 42%
87.7 42%
75% of motor vehicle traffic0
20
40
60
80
100
120
Jan Feb Mar Apr May Jun Jul Aug Sep Oct Nov Dec
Monthly trend in car & taxi traffic, 2020Index: 100 = same traffic as equivalent month in 2019
In 2020, car traffic decreased to its lowest level in over 25 years.
Car and taxi traffic saw its lowest monthly levels in 2020 during April, following lockdown measures legally coming into force on 23rd March 2020. Car traffic for April 2020 was a third of the levels in April 2019. As restrictions were eased during the summer months, car traffic increased but remained below 2019 levels. Car traffic was also more impacted by the England lockdown (which came into force on 5th November 2020). Car traffic in November 2020 was 31% lower than levels in November 2019.
Car traffic decreased on all road types between 2019 and 2020:► Motorways traffic saw the biggest decrease, 32.1% less than in 2019.► ‘A’ roads traffic decreased by 26.1%.► Minor roads traffic saw the lowest decrease, falling by 19.7%.
Car miles travelled by road type in Great BritainBillion vehicle miles Change
2019 - 2020
Motorways -32.1%
‘A’ roads -26.1%
Minor roads -19.7%87.7
87.2
34.7
109.2
118.0
51.1
20202019

Statistical Release – Annual Road Traffic Estimates – Page 10 of 28
Vans (Light Commercial Vehicles)Compared with 2019, Van traffic in Great Britain decreased by 9.1% to 50.5 billion vehicle miles in 2020.
50.5 billion van
miles in 2020
Motorways10.1 20%
‘A’ roads
Minor roads
19.5 39%
20.9 41%
18% of motor vehicle traffic0
20
40
60
80
100
120
Jan Feb Mar Apr May Jun Jul Aug Sep Oct Nov Dec
Monthly trend in van traffic, 2020Index: 100 = same traffic as equivalent month in 2019
Van traffic decreased by 9.1% between 2019 and 2020. This was the smallest fall in traffic of all motor vehicle types, except for lorries.
Van traffic saw its lowest monthly levels in 2020 during April, following lockdown measures legally coming into force on 23rd March 2020. Van traffic for April 2020 was 46% of the levels in April 2019. As restrictions were eased during the summer months, van traffic increased to the same levels as September 2019. Van traffic was less impacted by the England lockdown (which came into force on 5th November 2020) than cars. Van traffic in November 2020 was 13% lower than levels seen in November 2019.
Van traffic decreased on all road types between 2019 and 2020:► Traffic on ‘A’ roads saw the biggest decrease of 11.9%.► Motorway traffic decreased by 7.6%.► Minor roads saw the lowest decrease in van traffic, falling by 7.1%.
Van miles travelled by road type in Great Britain Change 2019 - 2020Billion vehicle miles
Motorways
‘A’ roads
Minor roads20.9
19.5
10.1
22.5
22.1
10.9
20202019
-7.6%
-11.9%
-7.1%

Statistical Release – Annual Road Traffic Estimates – Page 11 of 28
Lorries (Heavy Goods Vehicles)In 2020 lorries travelled 16.4 billion vehicle miles, decreasing by 5.7% compared with 2019. This was the lowest decrease by any vehicle type.
16.4 billion lorry
miles in 2020
Motorways7.7
47%
‘A’ roads
Minor roads
7.1 43%
1.6 10%
6% of motor vehicle traffic0
20
40
60
80
100
120
Jan Feb Mar Apr May Jun Jul Aug Sep Oct Nov Dec
Monthly trend in lorry traffic, 2020Index: 100 = same traffic as equivalent month in 2019
Lorry traffic decreased by 5.7% between 2019 and 2020, which was the smallest fall in traffic of all motor vehicle types.
Lorry traffic saw its lowest monthly levels in 2020 during April, following lockdown measures legally coming into force on 23rd March 2020. Lorry traffic for April 2020 was 59% of the levels in April 2019. As restrictions were eased during the summer months, lorry traffic increased to levels close to 2019 levels, reaching 99% of 2019 levels in September 2020. Monthly lorry traffic remained above 90% of the levels in the equivalent 2019 months for the remaining months of 2020.
Lorry traffic decreased on all road types between 2019 and 2020 except minor roads:
► Traffic on ‘A’ roads saw the biggest decrease, falling by 9.0%.
► Motorway traffic decreased by 4.2%.
► Traffic rose by 3.5% on minor roads.
Lorry miles travelled by road type in Great BritainBillion vehicle miles
Motorways
‘A’ roads
Minor roads1.6
7.1
7.7
1.5
7.8
8.0
20202019
Change 2019 - 2020
-4.2%
-9.0%
3.5%
Statistical Release – Annual Road Traffic Estimates – Page 12 of 28
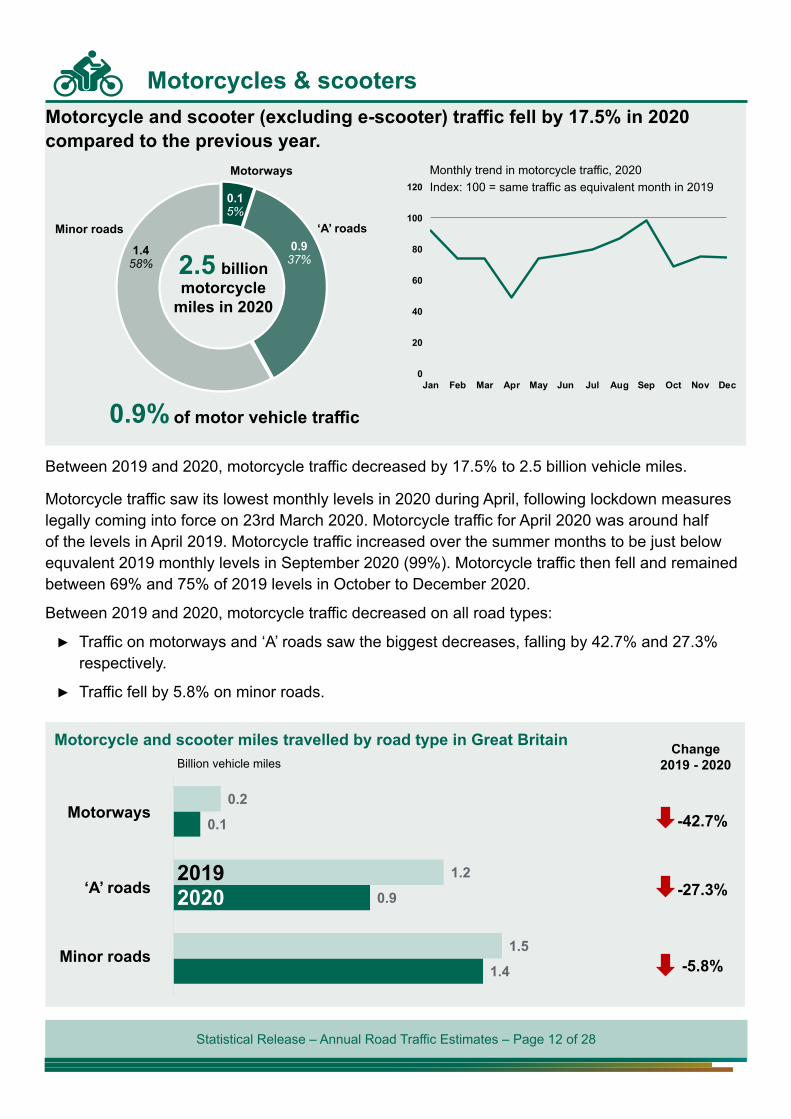
Motorcycles & scootersMotorcycle and scooter (excluding e-scooter) traffic fell by 17.5% in 2020 compared to the previous year.
2.5 billionmotorcycle
miles in 2020
Motorways
0.1 5%
‘A’ roadsMinor roads0.9
37%1.4
58%
0.9% of motor vehicle traffic
0
20
40
60
80
100
120
Jan Feb Mar Apr May Jun Jul Aug Sep Oct Nov Dec
Monthly trend in motorcycle traffic, 2020Index: 100 = same traffic as equivalent month in 2019
Between 2019 and 2020, motorcycle traffic decreased by 17.5% to 2.5 billion vehicle miles.
Motorcycle traffic saw its lowest monthly levels in 2020 during April, following lockdown measures legally coming into force on 23rd March 2020. Motorcycle traffic for April 2020 was around half of the levels in April 2019. Motorcycle traffic increased over the summer months to be just below equvalent 2019 monthly levels in September 2020 (99%). Motorcycle traffic then fell and remained between 69% and 75% of 2019 levels in October to December 2020.
Between 2019 and 2020, motorcycle traffic decreased on all road types:
► Traffic on motorways and ‘A’ roads saw the biggest decreases, falling by 42.7% and 27.3%respectively.
► Traffic fell by 5.8% on minor roads.
Motorcycle and scooter miles travelled by road type in Great BritainBillion vehicle miles
Motorways
‘A’ roads
Minor roads1.4
0.9
0.1
1.5
1.2
0.2
20202019
Change 2019 - 2020
-42.7%
-27.3%
-5.8%

Statistical Release – Annual Road Traffic Estimates – Page 13 of 28
Buses & coachesBus and coach traffic fell by 32.0% between 2019 and 2020.
1.6billion bus
miles in 2020
Motorways0.1 5%
‘A’ roadsMinor roads
0.7 44%
0.8 51%
0.6% of motor vehicle traffic 0
20
40
60
80
100
120
Jan Feb Mar Apr May Jun Jul Aug Sep Oct Nov Dec
Monthly trend in buses traffic, 2020Index: 100 = same traffic as equivalent month in 2019
Bus traffic decreased by 32% between 2019 and 2020 to 1.6 billion vehicle miles. This was the largest fall of all motor vehicle types.
Bus and coach traffic saw its lowest monthly levels in 2020 during April and May, following lockdown measures legally coming into force on 23rd March 2020. Bus traffic for April and May 2020 were at 43% and 41%, respectively, of their levels in the equivalent months in 2019. As restrictions were eased during the summer months, bus traffic increased but never returned to 2019 levels. During September to December 2020 bus traffic remained at just over 70% of their 2019 monthly levels.
Bus traffic decreased on all road types between 2019 and 2020:
► Traffic on motorways saw the biggest decrease, falling by 60.6%.
► Traffic on ‘A’ roads fell by 32.8%.
► Traffic fell by 25.8% on minor roads.
Bus and coach miles travelled by road type in Great BritainBillion vehicle miles
Motorways
‘A’ roads
Minor roads0.8
0.7
0.1
1.1
1.1
0.2
20202019
Change 2019 - 2020
-60.6%
-32.8%
-25.8%

Statistical Release – Annual Road Traffic Estimates – Page 14 of 28
Pedal cyclesPedal cycles travelled 5.0 billion miles on roads* in 2020, 45.7% further than in the previous year. Pedal cycles were the only vehicle type to see an increase in 2020.
5.0 billionmiles on roads in
2020
‘A’ roads
Minor roads
0.8 15%
4.3 85%
0
20
40
60
80
100
120
140
160
180
200
Jan Feb Mar Apr May Jun Jul Aug Sep Oct Nov Dec
Monthly trend in pedal cycle traffic, 2020Index: 100 = same traffic as equivalent month in 2019
In 2020, there was a 45.7% increase on the 2019 levels to 5.0 billion cycle miles. This is the highest level of cycling on the public highway since the 1960s.
Pedal cycle traffic saw its highest monthly levels in 2020 during April and May, following lockdown measures legally coming into force on 23rd March 2020. Pedal cycle traffic for April and May 2020 were 73% and 75% higher than their levels in the equivalent months in 2019, respectively. 2020 monthly cycling levels remained above the equivalent 2019 figures until October. Note that cycling levels are likely to be influenced by the weather in both the 2020 months and 2019 comparators.
Pedal cycle traffic increased on all road types between 2019 and 2020: ► Traffic on minor roads saw the biggest increase, rising by 51.8%.► Traffic on ‘A’ roads increased by 18.8%.
‘A’ roads
Minor roads4.3
0.8
2.8
0.6
20202019
Pedal cycle miles travelled by road type in Great BritainBillion vehicle miles
Change 2019 - 2020
18.8%
51.8%
*Cycling on roadsDfT road traffic statistics report activity of cyclists on public highways, and on cycle paths and footpaths adjacent to them. Cycle activity elsewhere (for example on canal towpaths, byways or bridleways) is not included in road traffic statistics. DfT Statistics on walking and cycling provide further analyses from other sources, such as the National Travel Survey (NTS).

Statistical Release – Annual Road Traffic Estimates – Page 15 of 28
Traffic by Road ClassificationThis section breaks down the traffic statistics by road type. Figures are presented split by the classification of the road (Motorway, ‘A’ roads, and Minor roads - ‘B’, ‘C’ and unclassified roads).
All road types saw a decrease in traffic levels during 2020.
-17.2%
-23.2%
-25.3%
Change in miles travelled by road type in Great Britain, 2019-2020
Motorways
‘A’ Roads
Minor RoadsShare of traffic by road type:Vehicle activity is unevenly distributed across Great Britain’s road network.
In 2020, 60% of the motor vehicle miles travelled were on motorways and ‘A’ roads, despite comprising only 13% of the road network by length.
On an average day in 2020, 44 times more vehicles travelled along a typical stretch of motorway than a typical stretch of a minor road (‘B’ roads, ‘C’ roads, and unclassified roads).
Road length (% of total)
Motorways1%
Average daily vehicle flowNumber of vehicles passing per 24 hours on a typical stretch of road
87% 1,400
10,700
62,000
Minor Roads
‘A’ Roads
12%
40%
41%
19%
Vehicle miles (% of total)
DefinitionsMinor and Major: Major roads include motorways and ‘A’ roads. Minor roads comprise ‘B’ roads, ‘C’ roads, and
unclassified roads.
Statistical Release – Annual Road Traffic Estimates – Page 16 of 28
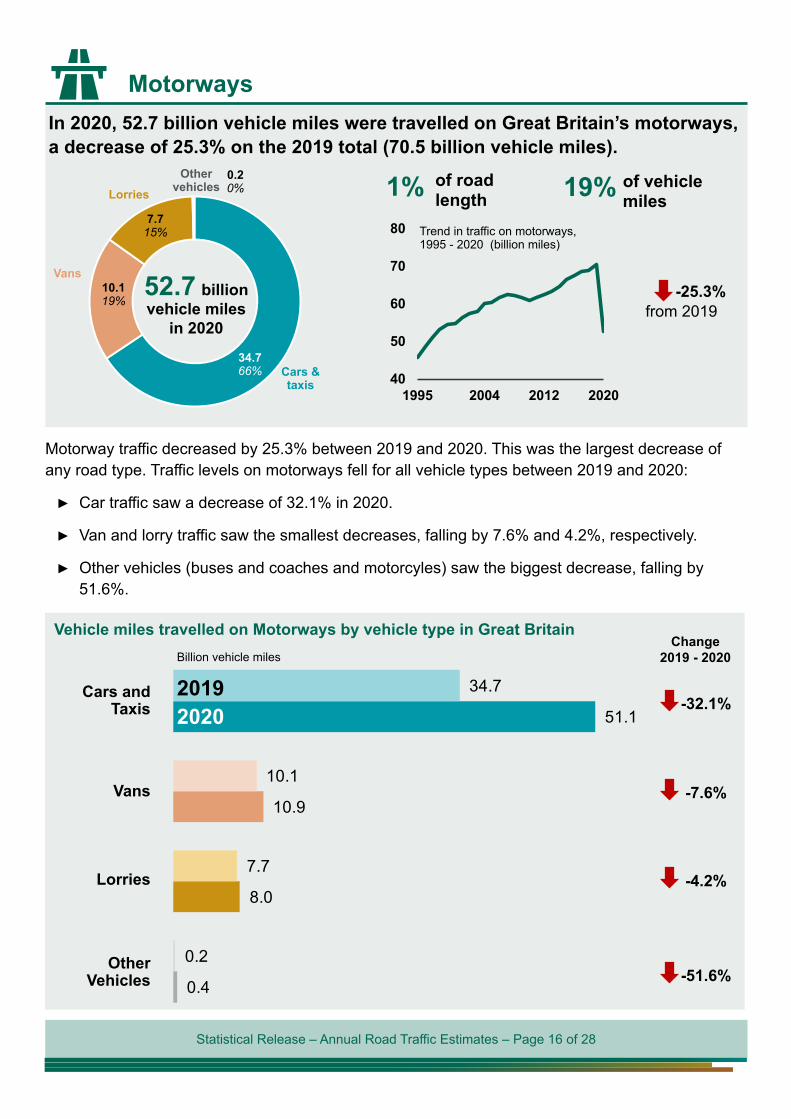
MotorwaysIn 2020, 52.7 billion vehicle miles were travelled on Great Britain’s motorways, a decrease of 25.3% on the 2019 total (70.5 billion vehicle miles).
52.7 billionvehicle miles
in 2020
1% of roadlength 19% of vehicle
miles
40
50
60
70
80
1995 2004 2012 2020
0.2 0%
Cars & taxis
Vans
LorriesOther
vehicles
Trend in traffic on motorways, 1995 - 2020 (billion miles)
7.7 15%
10.1 19%
34.7 66%
from 2019-25.3%
Motorway traffic decreased by 25.3% between 2019 and 2020. This was the largest decrease of any road type. Traffic levels on motorways fell for all vehicle types between 2019 and 2020:
► Car traffic saw a decrease of 32.1% in 2020.
► Van and lorry traffic saw the smallest decreases, falling by 7.6% and 4.2%, respectively.
► Other vehicles (buses and coaches and motorcyles) saw the biggest decrease, falling by51.6%.
0.4
8.0
10.9
51.1
0.2
7.7
10.1
34.7
Vehicle miles travelled on Motorways by vehicle type in Great BritainBillion vehicle miles
Change 2019 - 2020
Cars and Taxis
Vans
Lorries
Other Vehicles
20202019
-32.1%
-7.6%
-4.2%
-51.6%
Statistical Release – Annual Road Traffic Estimates – Page 17 of 28
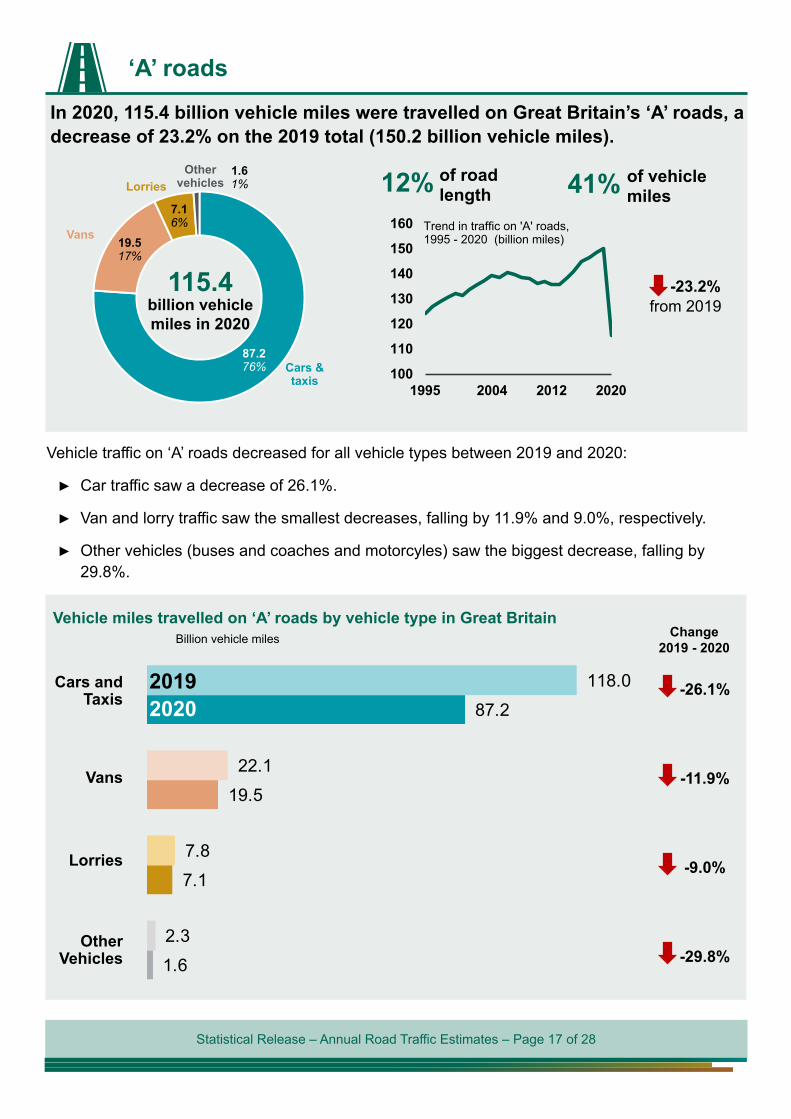
‘A’ roads In 2020, 115.4 billion vehicle miles were travelled on Great Britain’s ‘A’ roads, a decrease of 23.2% on the 2019 total (150.2 billion vehicle miles).
115.4billion vehicle miles in 2020
12% of roadlength 41% of vehicle
miles
100
110
120
130
140
150
160
1995 2004 2012 2020
1.6 1%
Cars & taxis
Vans
LorriesOther
vehicles
Trend in traffic on 'A' roads, 1995 - 2020 (billion miles)
7.1 6%
19.5 17%
87.2 76%
from 2019-23.2%
Vehicle traffic on ‘A’ roads decreased for all vehicle types between 2019 and 2020:
► Car traffic saw a decrease of 26.1%.
► Van and lorry traffic saw the smallest decreases, falling by 11.9% and 9.0%, respectively.
► Other vehicles (buses and coaches and motorcyles) saw the biggest decrease, falling by29.8%.
1.6
7.1
19.5
87.2
2.3
7.8
22.1
118.0
Vehicle miles travelled on ‘A’ roads by vehicle type in Great BritainBillion vehicle miles Change
2019 - 2020
Cars and Taxis
Vans
Lorries
Other Vehicles
20202019 -26.1%
-11.9%
-9.0%
-29.8%
Statistical Release – Annual Road Traffic Estimates – Page 18 of 28
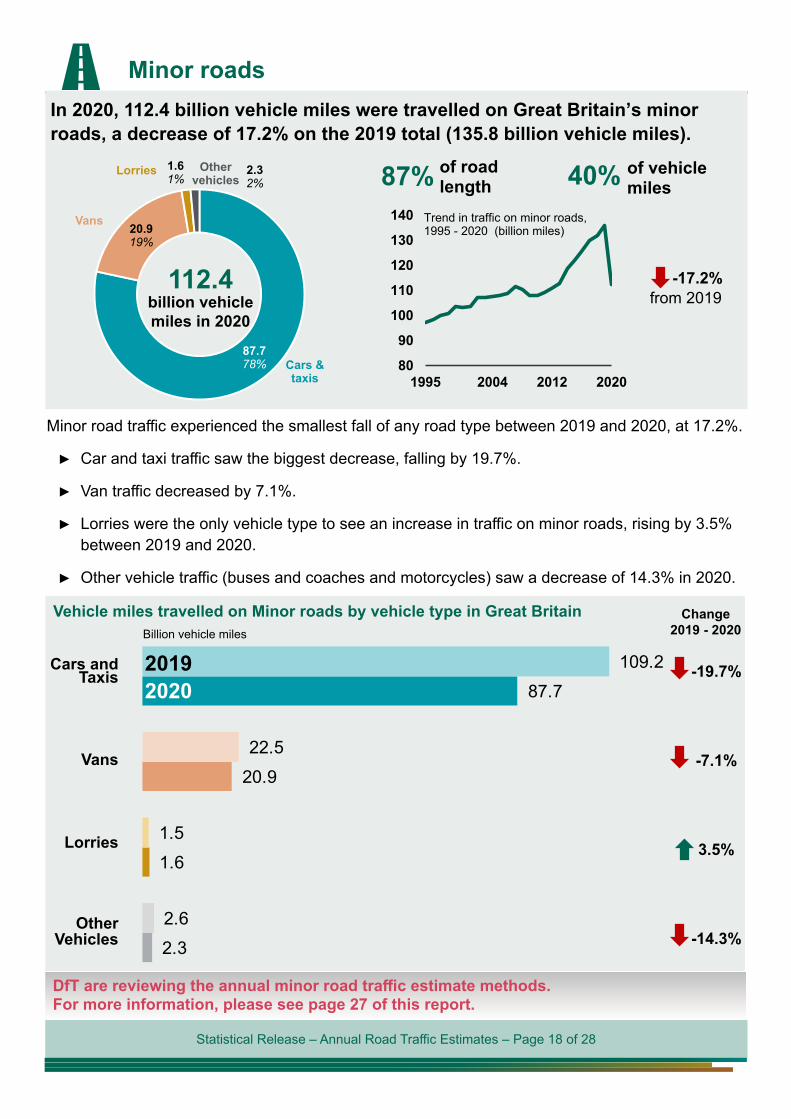
Minor roadsIn 2020, 112.4 billion vehicle miles were travelled on Great Britain’s minor roads, a decrease of 17.2% on the 2019 total (135.8 billion vehicle miles).
112.4billion vehicle miles in 2020
87% of roadlength 40% of vehicle
miles
80
90
100
110
120
130
140
1995 2004 2012 2020
2.3 2%
Cars & taxis
Vans
Lorries Other vehicles
Trend in traffic on minor roads, 1995 - 2020 (billion miles)
1.6 1%
20.9 19%
87.7 78%
from 2019-17.2%
Minor road traffic experienced the smallest fall of any road type between 2019 and 2020, at 17.2%.
► Car and taxi traffic saw the biggest decrease, falling by 19.7%.
► Van traffic decreased by 7.1%.
► Lorries were the only vehicle type to see an increase in traffic on minor roads, rising by 3.5%between 2019 and 2020.
► Other vehicle traffic (buses and coaches and motorcycles) saw a decrease of 14.3% in 2020.
2.3
1.6
20.9
87.7
2.6
1.5
22.5
109.2
Vehicle miles travelled on Minor roads by vehicle type in Great BritainBillion vehicle miles
Change 2019 - 2020
Cars and Taxis
Vans
Lorries
Other Vehicles
20202019 -19.7%
-7.1%
3.5%
-14.3%
DfT are reviewing the annual minor road traffic estimate methods. For more information, please see page 27 of this report.
Statistical Release – Annual Road Traffic Estimates – Page 19 of 28
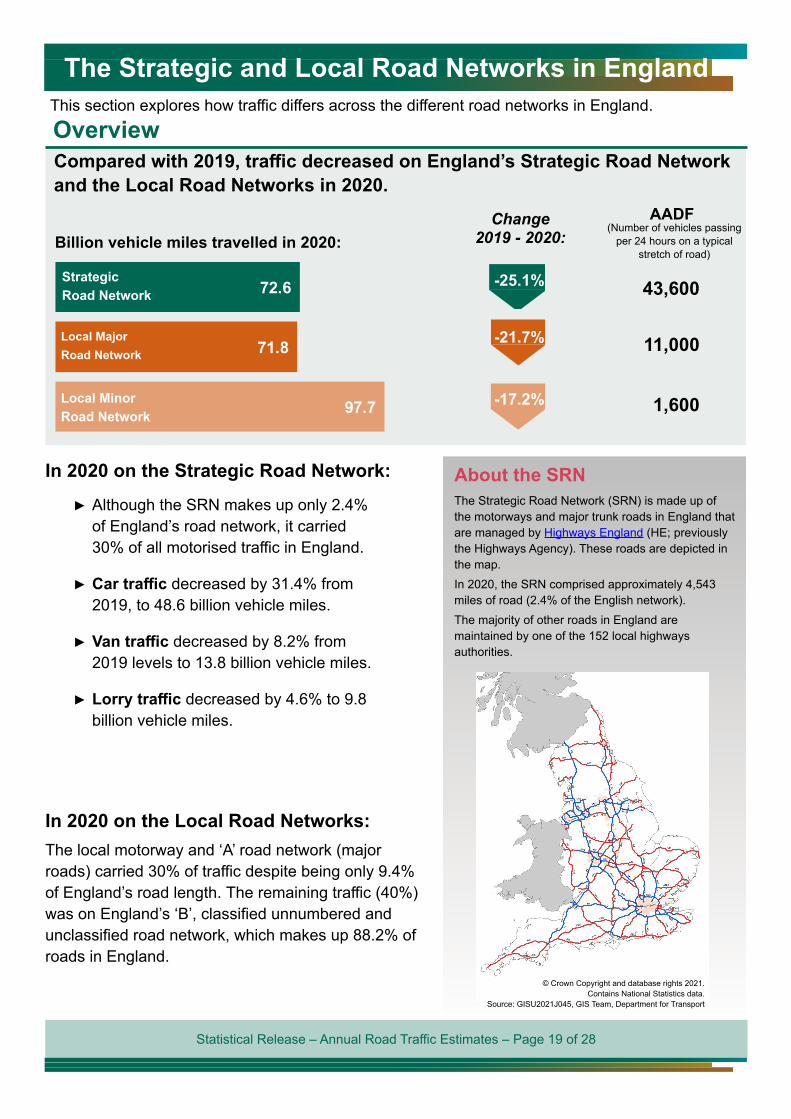
The Strategic and Local Road Networks in EnglandThis section explores how traffic differs across the different road networks in England. OverviewCompared with 2019, traffic decreased on England’s Strategic Road Network and the Local Road Networks in 2020.
97.7
71.8
72.6Strategic Road Network
Local Major Road Network
Local Minor Road Network
Billion vehicle miles travelled in 2020:Change
2019 - 2020:
-17.2%
-25.1%
-21.7%
(Number of vehicles passing per 24 hours on a typical
stretch of road)
AADF
43,600
11,000
1,600
In 2020 on the Strategic Road Network:► Although the SRN makes up only 2.4%
of England’s road network, it carried30% of all motorised traffic in England.
► Car traffic decreased by 31.4% from2019, to 48.6 billion vehicle miles.
► Van traffic decreased by 8.2% from2019 levels to 13.8 billion vehicle miles.
► Lorry traffic decreased by 4.6% to 9.8billion vehicle miles.
In 2020 on the Local Road Networks:The local motorway and ‘A’ road network (major roads) carried 30% of traffic despite being only 9.4% of England’s road length. The remaining traffic (40%) was on England’s ‘B’, classified unnumbered and unclassified road network, which makes up 88.2% of roads in England.
About the SRNThe Strategic Road Network (SRN) is made up of the motorways and major trunk roads in England that are managed by Highways England (HE; previously the Highways Agency). These roads are depicted in the map. In 2020, the SRN comprised approximately 4,543 miles of road (2.4% of the English network).The majority of other roads in England are maintained by one of the 152 local highways authorities.
© Crown Copyright and database rights 2021. Contains National Statistics data.
Source: GISU2021J045, GIS Team, Department for Transport

Statistical Release – Annual Road Traffic Estimates – Page 20 of 28
Strategic Road Network(Motorways and ‘A’ roads managed by Highways England)
72.6 billion vehiclemiles in 2020
of which...Cars & taxis
48.6 67%
13.8 19%
Vans LorriesOther
vehicles
9.8 13%
0.3 0%
2% of roadlength 30% of vehicle
miles
60
70
80
90
100
2000 2005 2010 2015 2020
Trend in traffic on the strategic road network, 2000 - 2020 (billion miles)
from 2019-25.1%
Local Major Road Network(Motorways and ‘A’ roads managed by local authorities)
71.8 billion vehiclemiles in 2020
of which...Cars & taxis Vans Lorries
Other vehicles
3.2 4%
1.2 2%
11.5 16%
56.0 78%
9% of roadlength 30% of vehicle
miles
60
70
80
90
100
2000 2005 2010 2015 2020
Trend in traffic on the local major road network, 2000 - 2020 (billion miles)
from 2019-21.7%
Local Minor Road Network(‘B’ and ‘C’ classified and unclassified roads managed by local authorities)
97.7 billion vehiclemiles in 2020
of which...Cars & taxis Vans Lorries
Other vehicles
1.4 1%
1.9 2%
17.8 18%
76.6 78%
88% of roadlength 40% of vehicle
miles
70
80
90
100
110
120
2000 2005 2010 2015 2020
Trend in traffic on the local minor road network, 2000 - 2020 (billion miles)
from 2019-17.2%
“Detrunking” and traffic trends over time on the SRN and local roadsBetween 1999 and 2012, the length of the SRN reduced by 12.6%.This was a result of the detrunking programme, where the management of parts of the SRN transferred from Highways England (then Highways Agency) to the relevant local authorities. DfT produces two kinds of time-series broken down by management to facilitate interpretation of trends over time: - Figures in tables TRA41 figures refer to the management status of a road on 1st April in each of the historic years;- Figures in tables TRA42 figures refer to the management status of a road as of 1st April 2018 (“static management”), toremove the effect of changing road length on vehicle miles.All of the trends over time presented in this section use “static management” figures, as published in tables TRA42.

Statistical Release – Annual Road Traffic Estimates – Page 21 of 28
Traffic on the Strategic Road Network decreased by 25.1% between 2019 and 2020. This was the largest fall of the different road networks in England, and reflects that the largest decreases in traffic were seen on motorways.
Conversely, the minor road network saw the lowest fall in traffic in England between 2019 and 2020, of 17.2%.
Road length and vehicle miles in England, 2020
0% 20% 40% 60% 80% 100%
Road length
All motor vehicle miles
HGV (lorry) miles
88%2.4%
SRN LA major roads LA minor roads
9%
30%
68%
30% 40%
22% 10%
Despite making up only 2.4% of the road network by length in England, almost one third of all vehicle miles were driven on the SRN in 2020.
The SRN is particularly important for freight, with almost one third of van miles and over two-thirds of lorry miles in England being driven on the SRN in 2020.
Over 43 thousand vehicles travel along a typical stretch of the strategic road network each day. This is almost four times greater than the number for a typical stretch of locally managed major roads, at 11,000.
The difference in average vehicle flow between the SRN and local roads was widened by the “detrunking” program, which ran up to 2012 and transferred a subset of trunk roads (in general, those with lower flow) to local authority management. 0 20,000 40,000 60,000 80,000
All SRN
HE 'A' roads
HE Motorways
All LA roads
LA Minor roads
LA Major roads Number of vehicles passing per 24 hours on a typical stretch of road
Average daily vehicle flow by road type and management, England 2020
11,000
1,600
2,500
66,600
27,000
43,600
Useful LinksStrategic Road Network Statistics - www.gov.uk/government/statistics/strategic-road-network-statisticsDfT report ‘Use of the Strategic Road Network’ - www.gov.uk/government/statistics/use-of-the-strategic-road-networkHighways England homepage - www.gov.uk/government/organisations/highways-englandForecasts from DfT’s National Transport Model - www.gov.uk/government/publications/road-traffic-forecasts-2018

Statistical Release – Annual Road Traffic Estimates – Page 22 of 28
Geographical Variation in TrafficThis section explores how levels and trends in traffic differ between different roads and areas of Great Britain.
242
billion vehicle miles
23
15billion vehicle
miles
billion vehicle miles
In 2020, the busiest areas in Great Britain were:
South East region with traffic levels of 45 billion vehicle miles
Essex authority with traffic levels of 8 billion vehicle miles
M25Western links
(J14-15)
motorway section with an average daily flow of
177 thousandvehicles per day
Road traffic trends by regions of Great BritainThe South East region had the highest traffic levels in 2020, with 45 billion vehicle miles driven on its roads. This was 16% of all traffic in 2020. The South East has 12% of road length in Great Britain.
Of the five local authorities with the highest levels of traffic, three are in the South East region (Hampshire, Kent, Surrey) and the other two are in East of England region (Essex, Hertfordshire). These are all authorities with relatively large road networks, and they all contain some of the major motorways of Great Britain.
In 2020, all regions saw their traffic levels decrease between 18% and 23% compared to their 2019 figures. The lowest decrease was seen in London (18.1%) and the highest decrease was seen in Wales (23.4%)
-23%
-20%
-23%
-23% -22%
-21%-23% -20%
-20%-21%
-18%
Percentage change
in motor vehicle traffic
2019-2020

Statistical Release – Annual Road Traffic Estimates – Page 23 of 28
Road-level traffic data for Great BritainThe DfT statistics produce an estimate of traffic flow (see definition on page 2), for an average day in a given year, for each junction-to-junction link on the motorway and ‘A’ road network in Great Britain. The 2020 average flows for these roads are represented on the map.
Average daily flows on motorway and ‘A’ road links in 2020 ranged from less than 5,000 vehicles to over 170,000.
Major roads with the lowest flow levels (shown in blue on the map) tended to be rural ‘A’ roads.
The busiest roads (shown in red on the map) were in general the motorways and ‘A’ roads that make up the Strategic Road Network in England, or equivalent trunk road networks in the devolved administrations.
The road links with the highest average daily traffic flows in 2020 were sections of the M25 and M60.
Average daily flows on motorways and ‘A’ roads in Great Britain, 2020
Vehicles per day
Five busiest road sections
Vehicles per day in 2020*
1. M25 J14-15 177,000
2. M60 J16-17 171,000
3. M25 J13-14 168,000
4. M25 J15-16 164,000
5. M25 J12-13 163,000
*rounded figures
Road-level dataThe street level traffic estimates for all junction-to-junction links of motorways and ‘A’ roads in Great Britain are available to view and download at the traffic counts website -
roadtraffic.dft.gov.uk

Statistical Release – Annual Road Traffic Estimates – Page 24 of 28
Traffic in urban and rural areasThis section explores how levels and trends in traffic on all roads differ between urban and rural areas of Great Britain.
Traffic on on all roads in urban and rural areas decreased between 2019 and 2020.
Urban Roads
115.1 billion vehiclemiles in 2020
Rural Roads
165.3 billion vehiclemiles in 2020
(Number of vehicles passing per 24 hours on a typical stretch of road)
AADF
3,400
2,900
Change2019 - 2020:
-22.7%
-19.2%
Roads in urban areas
38% of roadlength 41% of vehicle
miles
Cars & taxis
90.6 79%
19.2 17%
Vans LorriesOther
vehicles
2.4 2%
3.0 3%
Roads in rural areas
Cars & taxis
118.9 72%
31.3 19%
Vans LorriesOther
vehicles
1.7 1%
62% of roadlength 59% of vehicle
miles
13.4 8%
About urban and rural areasThe urban and rural classification of areas is defined by the Office for National Statistics, using information from the latest Census. Urban’ roads are those within a settlement of 10,000 people or more, following the 2011 Census definition of urban settlements. All other roads are defined as ‘rural’. See here.‘Urban’ areas are shown in orange on the map below.
© Crown Copyright and database rights 2021. Contains National Statistics data.Source: Department for Transpo

Statistical Release – Annual Road Traffic Estimates – Page 25 of 28
Rural areasTraffic on roads in rural areas decreased by 22.7% between 2019 and 2020.Car traffic saw the biggest decrease, falling by 26.9%; van and lorry traffic saw the smallest decreases, falling by 9.7% and 6.1%, respectively; other vehicle traffic saw a decrease of 25.6%.
1.7
13.4
31.3
118.9
2.3
14.3
34.7
162.7
Vehicle miles travelled on Rural roads by vehicle type in Great BritainBillion vehicle miles
Change 2019 - 2020
Cars and Taxis
Vans
Lorries
Other Vehicles
20202019 -26.9%
-9.7%
-6.1%
-25.6%
Urban areasTraffic on roads in urban areas decreased by 19.2% between 2019 and 2020. Car traffic saw a decrease of 21.5%; van and lorry traffic saw the smallest decreases, falling by 8.1% and 4.0%, respectively; other vehicle traffic saw the biggest decrease, falling by 22.8%.
2.4
3.0
19.2
90.6
3.1
3.1
20.9
115.5
Vehicle miles travelled on Urban roads by vehicle type in Great BritainBillion vehicle miles
Change 2019 - 2020
20202019 -21.5%
-8.1%
-4.0%
-22.8%

Statistical Release – Annual Road Traffic Estimates – Page 26 of 28
Further InformationOnline traffic dataThe complete series of data tables associated with this release, including tables mentioned in the text, can be found on the following pages:
► TRA01: Traffic volume (miles) -www.gov.uk/government/statistical-data-sets/road-traffic-statistics-tra#traffic-volume-in-miles-tra01
► TRA02: Traffic volume (kilometres) -www.gov.uk/government/statistical-data-sets/road-traffic-statistics-tra#traffic-volume-in-kilometres-tra02
► TRA03: Average annual daily flow and temporal traffic distributions -www.gov.uk/government/statistical-data-sets/road-traffic-statistics-tra#annual-daily-traffic-flow-and-distribution-tra03
► TRA04: Pedal cycle traffic -www.gov.uk/government/statistical-data-sets/road-traffic-statistics-tra#pedal-cycle-traffic-tra04
► TRA31: Heavy goods vehicle traffic -www.gov.uk/government/statistical-data-sets/road-traffic-statistics-tra#heavy-goods-vehicle-traffic-tra31
► TRA32: Foreign registered vehicles in GB traffic - www.gov.uk/government/statistical-data-sets/road-traffic-statistics-tra#foreign-registered-vehicles-in-great-britain-traffic-tra32
► TRA41: Strategic Road Network traffic -www.gov.uk/government/statistical-data-sets/road-traffic-statistics-tra#strategic-road-network-traffic-tra41
► TRA42: Strategic Road Network traffic based on a static road management status - www.gov.uk/government/statistical-data-sets/road-traffic-statistics-tra#traffic-based-on-a-static-road-management-status-tra42
► TRA89: Road traffic by region and local authority -www.gov.uk/government/statistical-data-sets/road-traffic-statistics-tra#traffic-by-local-authority-tra89
Quarterly traffic data► TRA25: All quarterly traffic estimates - www.gov.uk/government/statistical-data-sets/tra25-quarterly-estimates
Daily traffic index► To monitor the use of the transport system during the coronavirus (COVID-19) pandemic, a daily index of roadtraffic levels compared to Februrary 2020 are being published on a weekly basis -www.gov.uk/government/statistics/transport-use-during-the-coronavirus-covid-19-pandemic
Traffic counts website ► This website provides street-level traffic data for every junction-to-junction link on the ‘A’ road and motorwaynetwork in Great Britain, and all minor road counts, free for the general public - roadtraffic.dft.gov.uk
Related data► DfT Road traffic forecasts - www.gov.uk/government/publications/road-traffic-forecasts-2018
► DfT Road congestion and reliability statistics -www.gov.uk/government/collections/road-congestion-and-reliability-statistics
► DfT National Travel Survey Statistics - www.gov.uk/government/collections/national-travel-survey-statistics
► DfT Road accidents and safety statistics - www.gov.uk/government/collections/road-accidents-and-safety-statistics
► DfT Vehicles statistics - www.gov.uk/government/collections/vehicles-statistics
► Transport Statistics Great Britain 2020 - www.gov.uk/government/collections/transport-statistics-great-britain

Statistical Release – Annual Road Traffic Estimates – Page 27 of 28
Background informationThese statistics were designated as National Statistics in February 2013.
National StatisticsNational Statistics are produced to high professional standards set out in the National Statistics Code of Practice. They undergo regular quality assurance reviews to ensure they meet customer needs.
Details of Ministers and officials who receive pre-release access to these statistics up to 24 hours before release can be found here: www.gov.uk/government/publications/pre-release-access-lists-for-road-traffic-speeds-and-congestion-series
Traffic statistics methodology: strengths and weaknessesAnnual estimates make use of data from around 8,000 manual traffic counts in addition to continuous data from a national network of automatic traffic counters. These data sources produce accurate estimates on traffic levels in Great Britain by vehicle type and by road type.
A detailed explanation of the methodology used to produce DfT road traffic statistics can be found online in Annual road traffic estimates: methodology note at www.gov.uk/government/publications/road-traffic-statistics-guidance.
Whilst road traffic data is accurate at a high level of aggregation, it should be noted that:
► Although we produce traffic breakdowns by local authorities, traffic at this level is not robust, due to the sample size of the minor road data and must be treated with caution.
► Estimates for pedal cycle traffic only include cycling on roads, or paths directly adjacent to the road, and do not include estimates of cycling on other routes such as canal paths. Therefore, they may not give a complete representation of cycling.
► During June, every second year, a roadside survey is carried out collecting information about vehicles travelling on the road which identifies vehicles with registration marks originating outside United Kingdom. This information has been used to produce estimates of the rate of foreign registered vehicles on Britain’s roads, which are presented in tables TRA32. These figures should be treated with caution as the sample size is relatively small (over 7,000 observations of foreign registered vehicles out of 1.1 million total observations). This survey is next due to be carried out in 2021 and therefore the next estimates of foreign vehicle traffic will be published in 2022.
► The Road Traffic statistics series consistently reports higher levels of vehicle mileage for lorries than the Road Freight statistics series. This can mainly be attributed to difference in data collection. A methodology note on this issue has been published on our guidance page.
Minor road traffic estimatesIn 2020 the Department revised its minor road traffic estimates for 2010 to 2019 as a result of the latest minor roads benchmarking exercise, which is conducted every decade. As part of our continuous review of road traffic methodology, the Department for Transport’s Road Traffic Statistics Team are undertaking a deep dive into the current minor road methodology with the aim of identifying areas that would continue to improve the robustness and granularity of annual estimates of traffic on minor roads and the consistency of the historic time series. A document setting out the scope of the review is available at: www.gov.uk/government/collections/road-traffic-statistics

Statistical Release – Annual Road Traffic Estimates – Page 28 of 28
Background informationUsers and uses of road traffic estimatesWe continuously review the content of these statistics to ensure they are meeting users’ needs. We welcome feedback via email and the team can be contacted at [email protected].
A summary of the feedback we have received from users in a previous consultation can be found in ‘Meeting customers’ needs: Users and uses of road traffic statistics and data’. We continue to welcome any feedback on these statistics.
Road traffic data are a key source of management information on the country’s infrastructure. Main uses of road traffic statistics include:
► National Atmospheric Emissions Inventory (NAEI)Road traffic statistics are used to produce the National Atmospheric Emissions Inventory (NAEI), alegal requirement for EU Air Quality Directives, and for the UN Framework Convention on ClimateChange.
► Transport ModellingThe Department for Transport’s National Transport Model uses most traffic and speeds outputs tomake forecasts and to inform policy decisions on a broad range of issues.
► Local transport planningLocal Authorities (including Transport for London) and devolved governments use the data fortransport planning, road engineering and policy monitoring at a regional or local level.
► Road accident and safety statisticsRoad accident and safety statistics use annual and quarterly traffic estimates to produce roadsafety and accident rates, as required for the Strategic Framework on Road Safety.
► Ministry of Housing, Communities and Local GovernmentThis department uses traffic data on major roads to contribute towards the funding settlement forlocal authorities.
► Public UsersThe Department for Transport receives over 200,000 visits to the traffic counts website (roadtraffic.dft.gov.uk) and its underlying datasets, which provide street-level traffic data for every junction-to-junction link on the ‘A’ road and motorway network in Great Britain.
FeedbackWe welcome further feedback on any aspects of the Department’s road traffic statistics including content, timing, and format via email to [email protected]
Next releaseThe next annual traffic statistics release is expected to be published in May 2022, reporting 2021 traffic figures.
Provisional figures for 2021 will be published on a quarterly basis during 2021-22. The next provisional figures, for the year to end March 2021, are due to be released in June 2021.