road sector development programme pavement design ... · pavement design supplement: part ii...
TRANSCRIPT
ROAD SECTOR DEVELOPMENT PROGRAMME PACKAGE 3
PAVEMENT DESIGN SUPPLEMENT: PART II
REHABILITATION AND RECYCLING OF FLEXIBLE PAVEMENTS
PERKERETAAPIAN INDONESIA KE DEPAN NASKAH ANTARA MENUJU NASKAH AKHIR RENCANA INDUK PERKERETAAPIAN NASIONAL
ROAD SECTOR DEVELOPMENT PROGRAMME PACKAGE 3
PAVEMENT DESIGN SUPPLEMENT: PART II
REHABILITATION AND RECYCLING OF FLEXIBLE PAVEMENTS
May 2011
INDONESIA
INFRASTRUCTURE
INITIATIVE
INDONESIA INFRASTRUCTURE INITIATIVE
This document has been published by the Indonesia Infrastructure Initiative (IndII), an Australian Government funded project designed to promote economic growth in Indonesia by enhancing the relevance, quality and quantum of infrastructure investment.
The views expressed in this report do not necessarily reflect the views of the Australia Indonesia Partnership or the Australian Government. Please direct any comments or questions to the IndII Director, tel. +62 (21) 230-6063, fax +62 (21) 3190-2994. Website: www.indii.co.id.
ACKNOWLEDGEMENTS
This report has been prepared by Geoff Jameson and Edward James on behalf of Cardno Emerging Markets in association with the Australian Road Research Board who were engaged under the Indonesia Infrastructure Initiative (IndII), funded by AusAID, as part of the Directorate General of Highways (DGH) Programme Development Activity.
This supplement rests on the work of the Activity 201 group and previous documents delivered under Activity 201, notably Deliverable 2: “National roads pavement design guidelines and practice deficiencies”, Draft Deliverable 3 “ Interim pavement design and cost charts” and Deliverable 4A “Life cycle cost analysis Part A: model, data preparation, and results of new design options for flexible pavements”.
This supplement draws from many sources; particularly the following published guidelines and technical papers:
Pavement Design Guide, AASHTO, 1993
Austroads Pavement Design “A Guide to the Structural Design of Road Pavements” 2008
Overseas Road Note 31, Transport Research Laboratory (TRL), UK, 1993
LR 1132, Transport Research Laboratory, 1986
The debt owed to these documents must be acknowledged.
Ir. Purnomo S, Director Bintek, and Dr. Ir. Hedi Rahadian MSc have provided invaluable guidance on the many pavement related issues facing the Technical Directorate of DGH (Bintek). Valuable dialogues have been held with Ir. Nyoman and the pavements staff of the Indonesian Road Research Institute (Pusjatan). The Department of Communication (Perhubungan) provided access to their weighbridge facility at Demak, Central Java, which allowed the collection of necessary confirmation of articulated vehicle axle weights.
Any errors of fact or interpretation of previous studies under the IndII Road Sector Development Programme are solely those of the author.
Ed Vowles, Team Leader
Jakarta, May 2011
Document Control: IndII RSDP3 – Activity 201 Deliverable 6B Rehabilitation and Recycling
Version Date Author Initials Reviewer Initials
HIS edit corrections
August 2011
Geoff Jameson
Edward James
Tyrone Toole
© IndII 2011
All original intellectual property contained within this document is the property of the Indonesia
Infrastructure Initiative (IndII). It can be used freely without attribution by consultants and IndII partners in
preparing IndII documents, reports designs and plans; it can also be used freely by other agencies or
organisations, provided attribution is given.
Every attempt has been made to ensure that referenced documents within this publication have been
correctly attributed. However, IndII would value being advised of any corrections required, or advice
concerning source documents and/ or updated data.
PREAMBLE
This document is designed to be used in conjunction with current pavement design instructions: Directorate General of Highways (DGH) 2002: Flexible Pavement and DGH 2005: “Overlay Design using Deflections”. The objective of this format is to facilitate immediate introduction of necessary changes.
The Indonesian Road Research Institute (Pusjatan) has commenced a review of pavement design instructions in current use. Once that review is complete, incorporation of this and other planned supplements in a single concise pavement design guideline format will be possible.
Efficient pavement design and maintenance solutions will only become possible when the following issues have been comprehensively addressed:
a) Enforcement of reasonable axle loading limits
b) Enforcement of reasonable construction quality standards
General specification and design specification changes are required to support field use of the extended analysis and design treatments set offered by this document. Changes to the Indonesian Road Management System are needed to support identification of candidate projects for reconstruction or recycling and to introduce deflection-based overlay design to the planning
process. Consultant and contractor training will be required.
i
TABLE OF CONTENTS
ABBREVIATIONS, ACRONYMS AND TRANSLATIONS .................................................. V
CHAPTER 1: INTRODUCTION ..................................................................................... 1
CHAPTER 2: SELECTION OF REHABILITATION TREATMENTS ....................................... 3
2.1 TREATMENT SELECTION PROCESS OUTLINE ............................................ 5
CHAPTER 3: DESIGN TRAFFIC .................................................................................... 7
3.1 PAVEMENT DESIGN LIFE .................................................................... 7
3.2 ESTIMATING VEHICLE DAMAGE ........................................................... 7
3.3 FUTURE AXLE LOAD CONTROL ............................................................. 7
3.4 TRAFFIC GROWTH RATE .................................................................... 8
3.5 LANE DISTRIBUTION FACTOR AND LANE CAPACITY ................................... 8
3.6 VEHICLE TYPE ................................................................................. 8
3.7 VEHICLE DAMAGE FACTORS (VDF) ...................................................... 9
3.8 TRAFFIC MULTIPLIER ........................................................................ 9
CHAPTER 4: SUBGRADE SUPPORT FOR RECONSTRUCTION AND RECYCLING ............. 13
4.1 EXISTING PAVEMENT ANALYSIS ......................................................... 13
4.2 SOFT SOIL TREATMENTS .................................................................. 13
4.3 PEAT .......................................................................................... 14
4.4 EXPANSIVE SOILS ........................................................................... 15
CHAPTER 5: MATERIALS CHARACTERISATION ......................................................... 16
CHAPTER 6: DRAINAGE .......................................................................................... 18
CHAPTER 7: THICKNESS DESIGN OF OVERLAYS ........................................................ 21
7.1 INTRODUCTION ............................................................................. 21
7.2 DESIGN TRAFFIC LESS THAN OR EQUAL TO 107 ESA ............................... 22
7.2.1 Adjustment of measured curvature to account for testing temperature ......................................................................... 23
7.2.2 Standardisation of deflections and curvatures .................... 24 7.2.3 Calculation of characteristic curvatures .............................. 25 7.2.4 Fatigue of an asphalt overlay ............................................... 25
CHAPTER 8: THICKNESS DESIGN OF FOAMED BITUMEN STABILISATION TREATMENTS ........................................................................................................... 27
8.1 INTRODUCTION ............................................................................. 27
8.2 MATERIALS SUITABLE FOR FOAMED BITUMEN STABILISATION................... 28
8.3 MINIMUM SURFACING REQUIREMENTS .............................................. 30
8.4 THICKNESS DESIGN CHARTS .............................................................. 31
8.5 DESIGN PROCESS ........................................................................... 31
ii
CHAPTER 9: DESIGN OF CEMENT STABILISATION TREATMENTS............................. 33
9.1 MATERIALS SUITABLE FOR CEMENT STABILISATION ................................ 33
9.2 MINIMUM SURFACING REQUIREMENTS .............................................. 33
9.3 THICKNESS DESIGN CHARTS .............................................................. 33
9.4 DESIGN PROCESS ........................................................................... 34
CHAPTER 10: CONSTRUCTION ISSUES AND PAVEMENT PERFORMANCE ........... 36
10.1 PREPARATION OF EXISTING PAVEMENTS FOR OVERLAY ........................... 36
10.2 PAVEMENT LAYER THICKNESSES ........................................................ 36
10.3 PAVEMENT EDGE (INCLUDING MEDIAN) SUPPORT ................................. 37
10.4 BOXED CONSTRUCTION ................................................................... 37
10.5 WET SEASON EFFECTS ..................................................................... 38
10.6 CONSTRUCTION UNDER TRAFFIC........................................................ 38
10.7 JOINT LOCATIONS .......................................................................... 38
10.8 CONSTRUCTION SEQUENCE FOR RECYCLING .......................................... 39
ANNEXE 1: COMMERCIAL FLEET VDF CALCULATOR ................................................. 41
ANNEXE 2: DEVELOPMENT OF THE THICKNESS DESIGN METHOD FOR FOAMED BITUMEN STABILISATION .................................................................... 43
ANNEXE 3: FOAMED BITUMEN STABILISATION DESIGN CHARTS, DESIGN TRAFFIC UP TO 108 ESA5........................................................................................ 45
ANNEXE 4: FOAMED BITUMEN STABILISATION DESIGN CHARTS, DESIGN TRAFFIC 108 TO 109 ESA5 ......................................................................................... 49
ANNEXE 5: CEMENT STABILISATION DESIGN CHARTS ............................................. 52
REFERENCES .......................................................................................................... 56
iii
LIST OF TABLES
Table 2.1: Design life, rehabilitation triggers and surfacing type relationships for reconstruction and recycling .......................................................................... 3
Table 2.2: Selection of treatment types ........................................................................... 4 Table 2.3: Roughness triggers for overlay and reconstruction ........................................ 5 Table 2.4: Triggers for overlay, reconstruction or recycling ............................................ 6 Table 3.1: Presumptive traffic growth rates (Bintek concurrence required) ................... 8 Table 3.2: Lane distribution factor ................................................................................... 8 Table 3.3: Classification of vehicles and standard VDF values: Java arterial – 2011 ..... 11 Table 5.1: Characteristic moduli used for development of design charts and for
mechanistic design ....................................................................................... 16 Table 5.2: Characteristic Poisson’s ratio values ............................................................. 17 Table 5.3: Characteristic unbound materials moduli used for development of design
charts ............................................................................................................ 17 Table 8.1: Guide to the selection of method of stabilisation ........................................ 29 Table 8.2: Minimum surfacing requirements over foamed bitumen stabilised materials
.......................................................................................................... 30 Table 8.3: Procedure for foamed bitumen stabilisation design .................................... 31 Table 9.1: Procedure for CTSB design ........................................................................... 34 Table 10.1: Permitted layer thicknesses ........................................................................ 36
iv
LIST OF FIGURES
Figure 1.1: Flexible pavement structure components ..................................................... 2 Figure 6.1: “m” factor adjustments for subgrade drainage condition ............................ 19 Figure 6.2: Examples of subsoil drainage for various site conditions ............................ 20 Figure 7.1: Curvature function ....................................................................................... 22 Figure 7.2: Temperature correction for Benkelman Beam for various asphalt
thicknesses.................................................................................................... 23 Figure 7.3: Temperature correction for FWD for various asphalt thicknesses .............. 24 Figure 7.4: Curvature standardisation factors ............................................................... 25 Figure 7.5: Asphalt overlay fatigue lives MAPTs >35 °C ................................................. 26 Figure 8.1: Foamed bitumen pavement recycling ......................................................... 27 Figure 8.2: Zone A grading envelope ............................................................................. 30 Figure 8.3: Example design chart for thickness design foamed bitumen stabilisation
recycling ........................................................................................................ 31 Figure 9.1: Example design chart for thickness design cement treated sub-bases (CTSB)
.......................................................................................................... 34 Figure 10.1: Pavement edge support and median treatment ....................................... 37 Figure 10.2: (A and B) Construction sequence for recycling with widening ................. 39
v
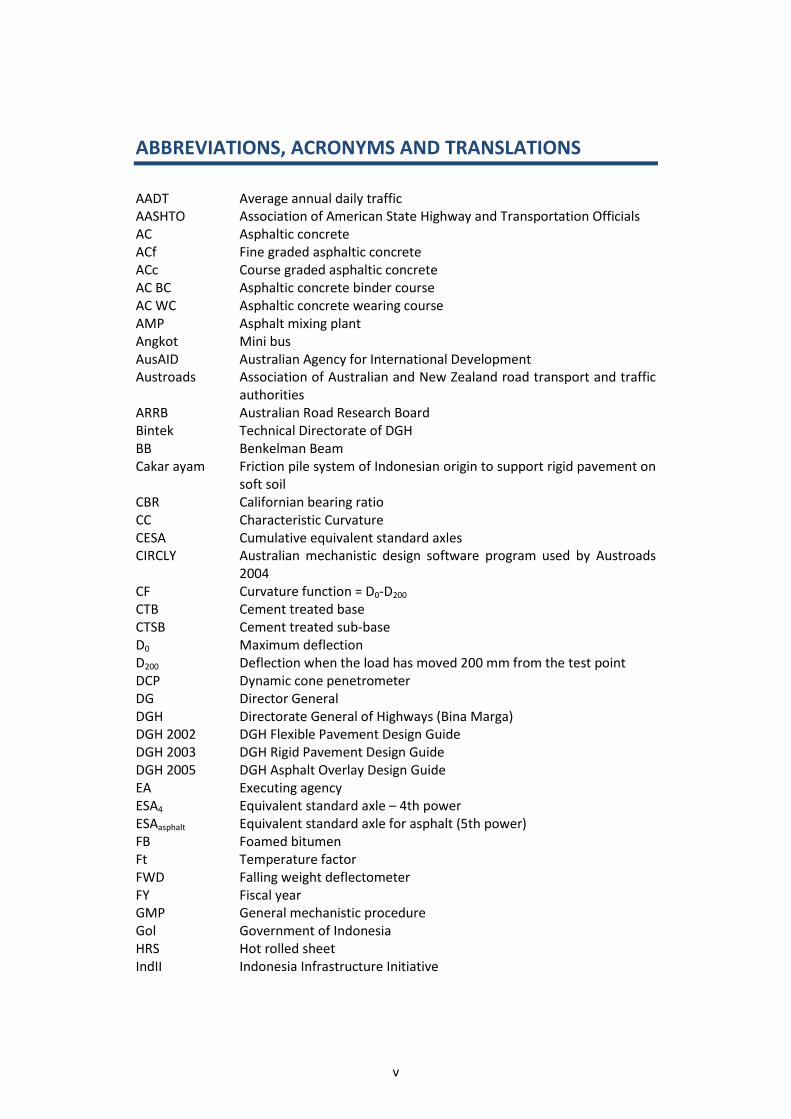
ABBREVIATIONS, ACRONYMS AND TRANSLATIONS
AADT Average annual daily traffic AASHTO Association of American State Highway and Transportation Officials AC Asphaltic concrete ACf Fine graded asphaltic concrete ACc Course graded asphaltic concrete AC BC Asphaltic concrete binder course AC WC Asphaltic concrete wearing course AMP Asphalt mixing plant Angkot Mini bus AusAID Australian Agency for International Development Austroads Association of Australian and New Zealand road transport and traffic
authorities ARRB Australian Road Research Board Bintek Technical Directorate of DGH BB Benkelman Beam Cakar ayam Friction pile system of Indonesian origin to support rigid pavement on
soft soil CBR Californian bearing ratio CC Characteristic Curvature CESA Cumulative equivalent standard axles CIRCLY Australian mechanistic design software program used by Austroads
2004 CF Curvature function = D0-D200 CTB Cement treated base CTSB Cement treated sub-base D0 Maximum deflection D200 Deflection when the load has moved 200 mm from the test point DCP Dynamic cone penetrometer DG Director General DGH Directorate General of Highways (Bina Marga) DGH 2002 DGH Flexible Pavement Design Guide DGH 2003 DGH Rigid Pavement Design Guide DGH 2005 DGH Asphalt Overlay Design Guide EA Executing agency ESA4 Equivalent standard axle – 4th power ESAasphalt Equivalent standard axle for asphalt (5th power) FB Foamed bitumen Ft Temperature factor FWD Falling weight deflectometer FY Fiscal year GMP General mechanistic procedure Gol Government of Indonesia HRS Hot rolled sheet IndII Indonesia Infrastructure Initiative

vi
Ir Engineer IRI International Roughness Index IRMS Indonesian Road Management System K Constant kN Kilo Newtons Lij Load on any axle LMC Lean mix concrete LR TRL report reference m Correction factor for granular layer thickness relating to drainage
conditions MAPT Mean annual pavement temperature MDD Maximum dry density MPa Megapascal OMC Optimum moisture content ORN Overseas Road Note PI Plasticity Index PPK Pejabat Pembuat Komitment (Sub Project Manager) Pusjatan Road Research Institute (Indonesia) RF Reliability factor Sirtu Coarse river gravel SL Standard load SG2 Subgrade with CBR 2 percent Tmeas Temperature measured TMasphalt Traffic multiplier for design of asphalt layers TRL Transport Road Laboratory (UK) VDF Vehicle damage factor Vb Specific volume of bitumen in an asphalt mixture WMAPT Weighted mean average pavement temperature
μɛ Microstrain
ROAD SECTOR DEVELOPMENT PROGRAMME PACKAGE 3 – ACTIVITY NO. 201
1
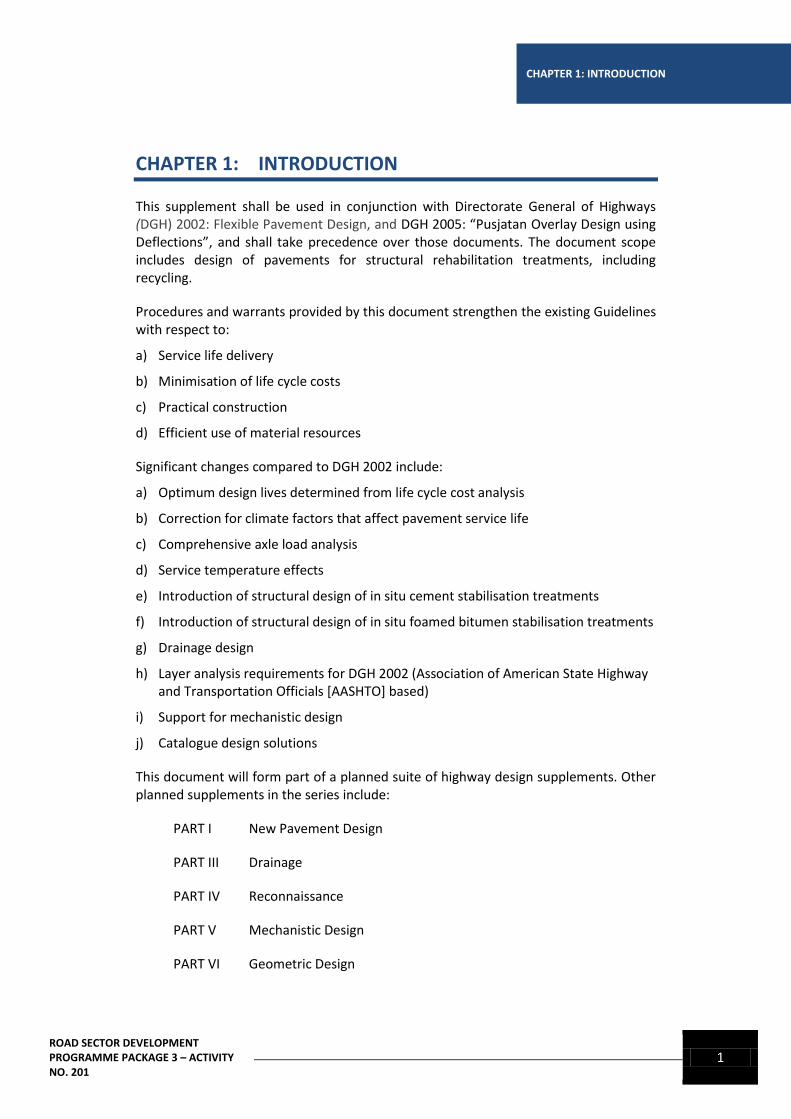
CHAPTER 1: INTRODUCTION
CHAPTER 1: INTRODUCTION
This supplement shall be used in conjunction with Directorate General of Highways (DGH) 2002: Flexible Pavement Design, and DGH 2005: “Pusjatan Overlay Design using Deflections”, and shall take precedence over those documents. The document scope includes design of pavements for structural rehabilitation treatments, including recycling.
Procedures and warrants provided by this document strengthen the existing Guidelines with respect to:
a) Service life delivery
b) Minimisation of life cycle costs
c) Practical construction
d) Efficient use of material resources
Significant changes compared to DGH 2002 include:
a) Optimum design lives determined from life cycle cost analysis
b) Correction for climate factors that affect pavement service life
c) Comprehensive axle load analysis
d) Service temperature effects
e) Introduction of structural design of in situ cement stabilisation treatments
f) Introduction of structural design of in situ foamed bitumen stabilisation treatments
g) Drainage design
h) Layer analysis requirements for DGH 2002 (Association of American State Highway and Transportation Officials [AASHTO] based)
i) Support for mechanistic design
j) Catalogue design solutions
This document will form part of a planned suite of highway design supplements. Other planned supplements in the series include:
PART I New Pavement Design
PART III Drainage
PART IV Reconnaissance
PART V Mechanistic Design
PART VI Geometric Design
2 ROAD SECTOR DEVELOPMENT
PROGRAMME PACKAGE 3 – ACTIVITY NO. 201
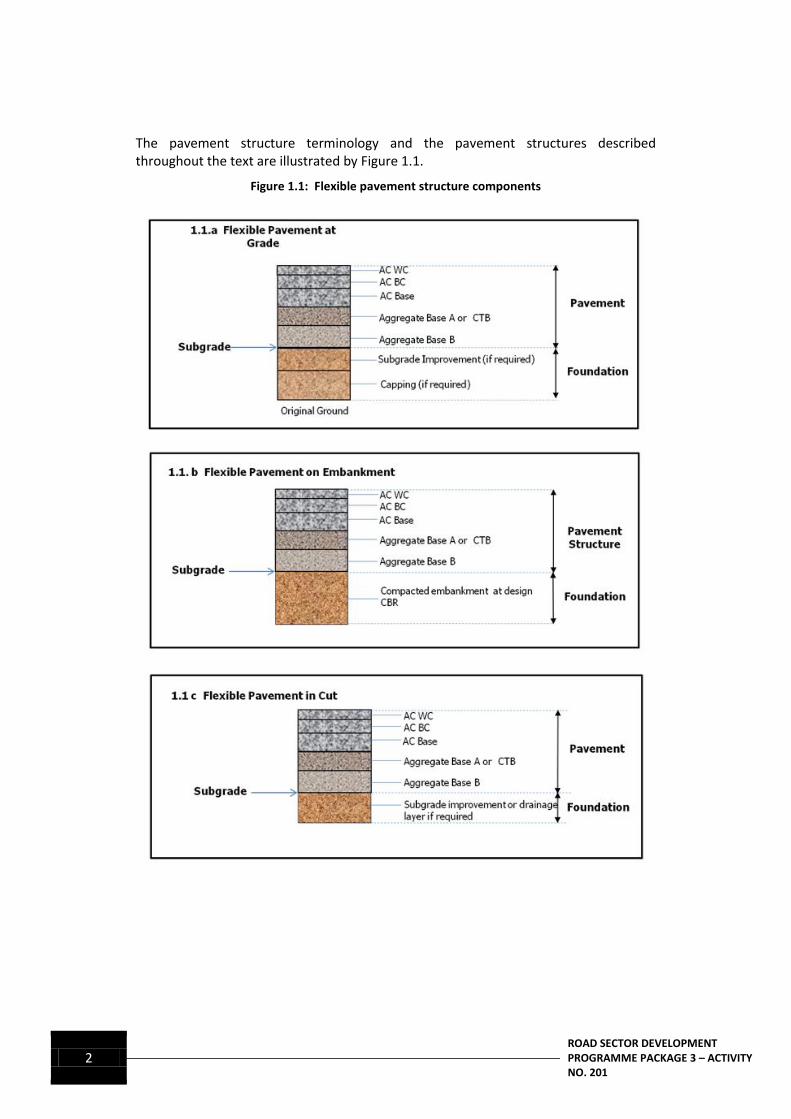
The pavement structure terminology and the pavement structures described throughout the text are illustrated by Figure 1.1.
Figure 1.1: Flexible pavement structure components
ROAD SECTOR DEVELOPMENT PROGRAMME PACKAGE 3 – ACTIVITY NO. 201
3
CHAPTER 2: SELECTION OF REHABILITATION TREATMENTS
CHAPTER 2: SELECTION OF REHABILITATION TREATMENTS
There are two treatment selection stages:
Planning; broad selection of candidate routes and global treatments
Project; close interval testing and detailed treatments for homogeneous sections
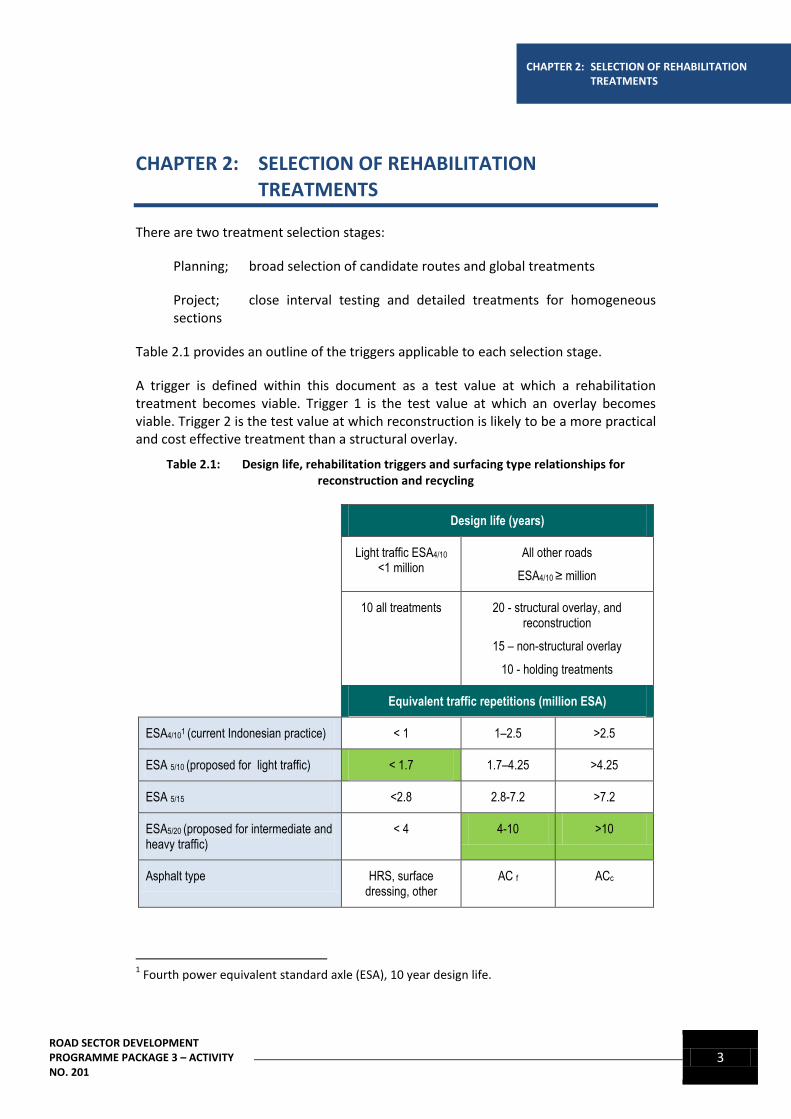
Table 2.1 provides an outline of the triggers applicable to each selection stage.
A trigger is defined within this document as a test value at which a rehabilitation treatment becomes viable. Trigger 1 is the test value at which an overlay becomes viable. Trigger 2 is the test value at which reconstruction is likely to be a more practical and cost effective treatment than a structural overlay.
Table 2.1: Design life, rehabilitation triggers and surfacing type relationships for reconstruction and recycling
Design life (years)
Light traffic ESA4/10
<1 million All other roads
ESA4/10 ≥ million
10 all treatments 20 - structural overlay, and reconstruction
15 – non-structural overlay
10 - holding treatments
Equivalent traffic repetitions (million ESA)
ESA4/101 (current Indonesian practice) < 1 1–2.5 >2.5
ESA 5/10 (proposed for light traffic) < 1.7 1.7–4.25 >4.25
ESA 5/15 <2.8 2.8-7.2 >7.2
ESA5/20 (proposed for intermediate and heavy traffic)
< 4 4-10 >10
Asphalt type HRS, surface dressing, other
AC f ACc
1 Fourth power equivalent standard axle (ESA), 10 year design life.
4 ROAD SECTOR DEVELOPMENT
PROGRAMME PACKAGE 3 – ACTIVITY NO. 201
Treatment triggers
Planning level triggers IRI, visual IRI, deflection at 200m c/c
visual
Project level triggers IRI (primary)
deflection 2 visual
DCP
Curvature and deflection at 50m
c/c
DCP, IRI, visual
Test pits3
DCP, IRI, visual
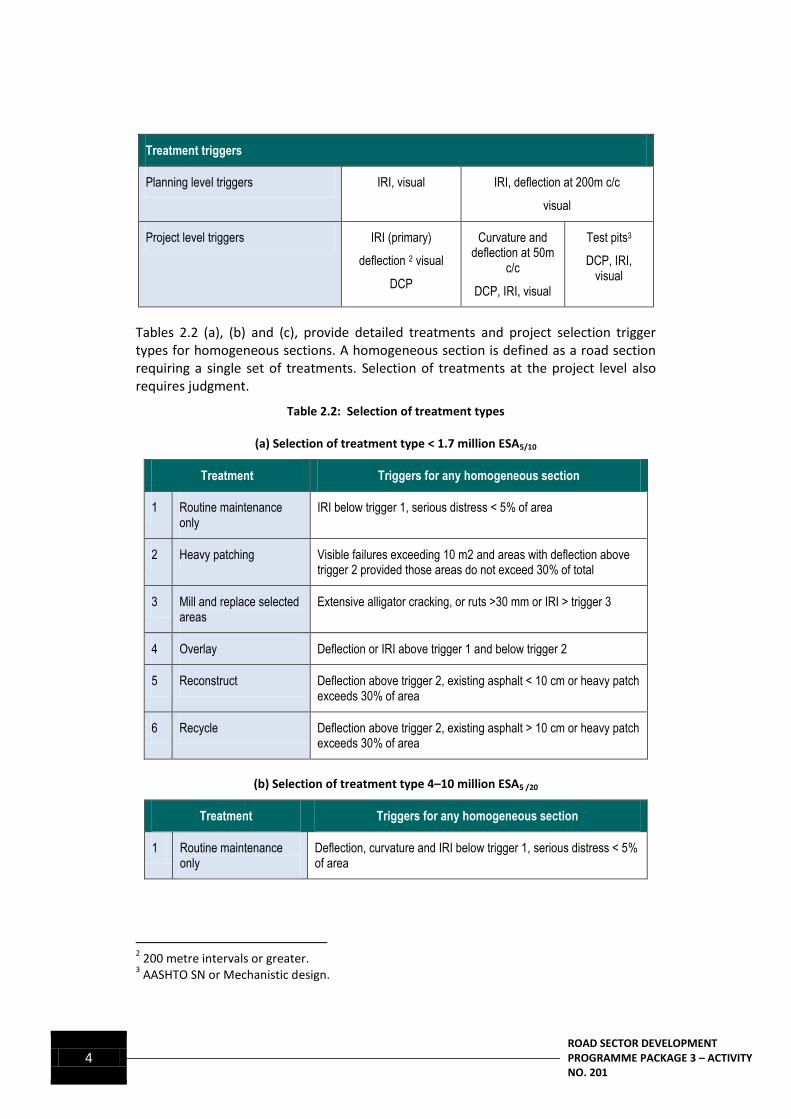
Tables 2.2 (a), (b) and (c), provide detailed treatments and project selection trigger types for homogeneous sections. A homogeneous section is defined as a road section requiring a single set of treatments. Selection of treatments at the project level also requires judgment.
Table 2.2: Selection of treatment types
(a) Selection of treatment type < 1.7 million ESA5/10
Treatment Triggers for any homogeneous section
1 Routine maintenance only
IRI below trigger 1, serious distress < 5% of area
2 Heavy patching Visible failures exceeding 10 m2 and areas with deflection above trigger 2 provided those areas do not exceed 30% of total
3 Mill and replace selected areas
Extensive alligator cracking, or ruts >30 mm or IRI > trigger 3
4 Overlay Deflection or IRI above trigger 1 and below trigger 2
5 Reconstruct Deflection above trigger 2, existing asphalt < 10 cm or heavy patch exceeds 30% of area
6 Recycle Deflection above trigger 2, existing asphalt > 10 cm or heavy patch exceeds 30% of area
(b) Selection of treatment type 4–10 million ESA5 /20
Treatment Triggers for any homogeneous section
1 Routine maintenance only
Deflection, curvature and IRI below trigger 1, serious distress < 5% of area
2 200 metre intervals or greater.
3 AASHTO SN or Mechanistic design.
ROAD SECTOR DEVELOPMENT PROGRAMME PACKAGE 3 – ACTIVITY NO. 201
5
CHAPTER 2: SELECTION OF REHABILITATION TREATMENTS
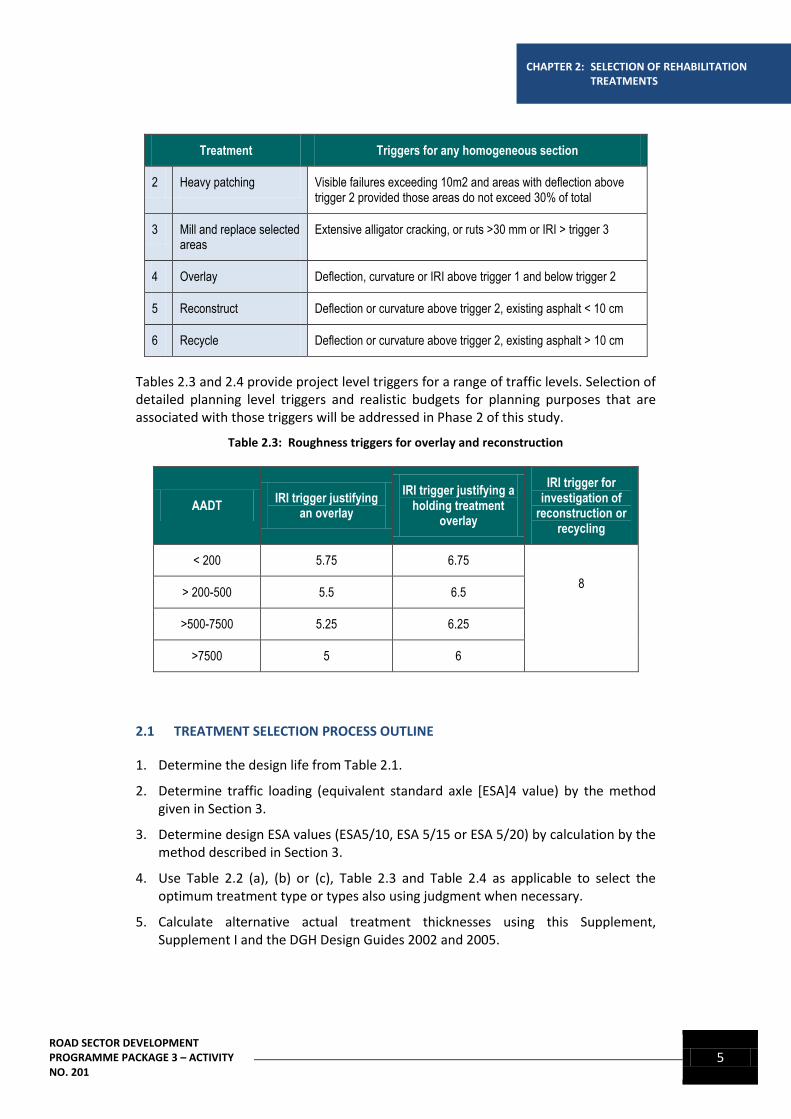
Treatment Triggers for any homogeneous section
2 Heavy patching Visible failures exceeding 10m2 and areas with deflection above trigger 2 provided those areas do not exceed 30% of total
3 Mill and replace selected areas
Extensive alligator cracking, or ruts >30 mm or IRI > trigger 3
4 Overlay Deflection, curvature or IRI above trigger 1 and below trigger 2
5 Reconstruct Deflection or curvature above trigger 2, existing asphalt < 10 cm
6 Recycle Deflection or curvature above trigger 2, existing asphalt > 10 cm
Tables 2.3 and 2.4 provide project level triggers for a range of traffic levels. Selection of detailed planning level triggers and realistic budgets for planning purposes that are associated with those triggers will be addressed in Phase 2 of this study.
Table 2.3: Roughness triggers for overlay and reconstruction
AADT IRI trigger justifying
an overlay
IRI trigger justifying a holding treatment
overlay
IRI trigger for investigation of
reconstruction or recycling
< 200 5.75 6.75
8 > 200-500 5.5 6.5
>500-7500 5.25 6.25
>7500 5 6
2.1 TREATMENT SELECTION PROCESS OUTLINE
1. Determine the design life from Table 2.1.
2. Determine traffic loading (equivalent standard axle [ESA]4 value) by the method given in Section 3.
3. Determine design ESA values (ESA5/10, ESA 5/15 or ESA 5/20) by calculation by the method described in Section 3.
4. Use Table 2.2 (a), (b) or (c), Table 2.3 and Table 2.4 as applicable to select the optimum treatment type or types also using judgment when necessary.
5. Calculate alternative actual treatment thicknesses using this Supplement, Supplement I and the DGH Design Guides 2002 and 2005.
6 ROAD SECTOR DEVELOPMENT
PROGRAMME PACKAGE 3 – ACTIVITY NO. 201
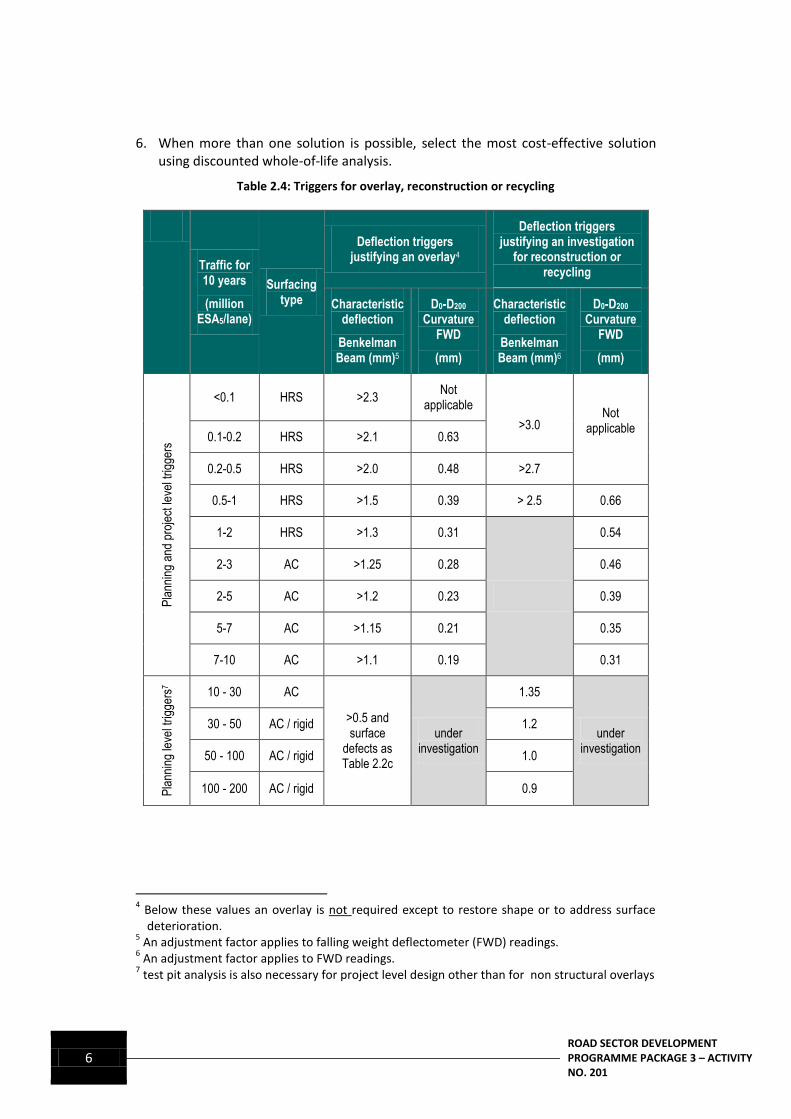
6. When more than one solution is possible, select the most cost-effective solution using discounted whole-of-life analysis.
Table 2.4: Triggers for overlay, reconstruction or recycling
Traffic for 10 years
(million ESA5/lane)
Surfacing type
Deflection triggers justifying an overlay4
Deflection triggers justifying an investigation
for reconstruction or recycling
Characteristic deflection
Benkelman Beam (mm)5
D0-D200 Curvature
FWD
(mm)
Characteristic deflection
Benkelman Beam (mm)6
D0-D200 Curvature
FWD
(mm)
Pla
nnin
g an
d pr
ojec
t lev
el tr
igge
rs
<0.1 HRS >2.3 Not
applicable
>3.0
Not applicable
0.1-0.2 HRS >2.1 0.63
0.2-0.5 HRS >2.0 0.48 >2.7
0.5-1 HRS >1.5 0.39 > 2.5 0.66
1-2 HRS >1.3 0.31
0.54
2-3 AC >1.25 0.28 0.46
2-5 AC >1.2 0.23 0.39
5-7 AC >1.15 0.21 0.35
7-10 AC >1.1 0.19 0.31
Pla
nnin
g le
vel t
rigge
rs7
10 - 30 AC
>0.5 and surface
defects as Table 2.2c
under investigation
1.35
under investigation
30 - 50 AC / rigid 1.2
50 - 100 AC / rigid 1.0
100 - 200 AC / rigid 0.9
4 Below these values an overlay is not required except to restore shape or to address surface
deterioration. 5 An adjustment factor applies to falling weight deflectometer (FWD) readings.
6 An adjustment factor applies to FWD readings.
7 test pit analysis is also necessary for project level design other than for non structural overlays
ROAD SECTOR DEVELOPMENT PROGRAMME PACKAGE 3 – ACTIVITY NO. 201
7
CHAPTER 3: DESIGN TRAFFIC
CHAPTER 3: DESIGN TRAFFIC
3.1 PAVEMENT DESIGN LIFE
Structural treatments, including asphalt overlays, in situ stabilisation with cement or foamed bitumen shall be undertaken using design traffic predicted for a 10- to 20-year design life. The design life shall be in accordance with Table 2.1 unless otherwise instructed or approved by the Technical Directorate of DGH (Bintek).
3.2 ESTIMATING VEHICLE DAMAGE
Accurate traffic counts are essential. The percentage and type of commercial vehicles varies between routes but the level of overloading of specific vehicle types and load categories is believed to be reasonably constant across all provinces.
Therefore a reasonable estimate of ESA value can be obtained from a traffic count for current Indonesian conditions and from the standard damage factors (vehicle damage factor [VDF]) given by Table 3.3. A spreadsheet calculator that only requires input of vehicle type and load category numbers is provided in Annexe 1.
Although 100 kilo Newtons (kN) axle loads are permitted on some routes, the ESA values shall nevertheless always be determined on the basis of a 80 kN standard axle load.
3.3 FUTURE AXLE LOAD CONTROL
There is an extremely high road asset maintenance cost associated with overloading in Indonesia. There is also a serious safety issue. Effective control is essential if pavement replacement and maintenance costs are to be controlled. The only prudent policy for current pavement designs is to assume that current overload levels will continue.
ALTERNATIVE DESIGN WARRANT FOR COMMERCIAL VEHICLE LOADING:
Unless otherwise instructed or approved by Bintek, current levels of overloading shall be assumed until year 2020. An agreed level of loading control shall be assumed after that date.
At the date when legal loading is presumed to become effective (January 2021), the traffic flow rate used for calculation of cumulative equivalent standard axles shall be increased by an amount sufficient to maintain an equal volume of goods transported compared to the overload case.
A DECISION ON THIS MATTER IS FUNDAMENTAL TO THE SUCCESS OF FUTURE PAVEMENT DESIGN AND ROAD ASSET MANAGEMENT. ADDITIONAL LEGISLATION MAY BE REQUIRED
TO SUPPORT RIGOROUS ENFORCEMENT.
8 ROAD SECTOR DEVELOPMENT
PROGRAMME PACKAGE 3 – ACTIVITY NO. 201
3.4 TRAFFIC GROWTH RATE
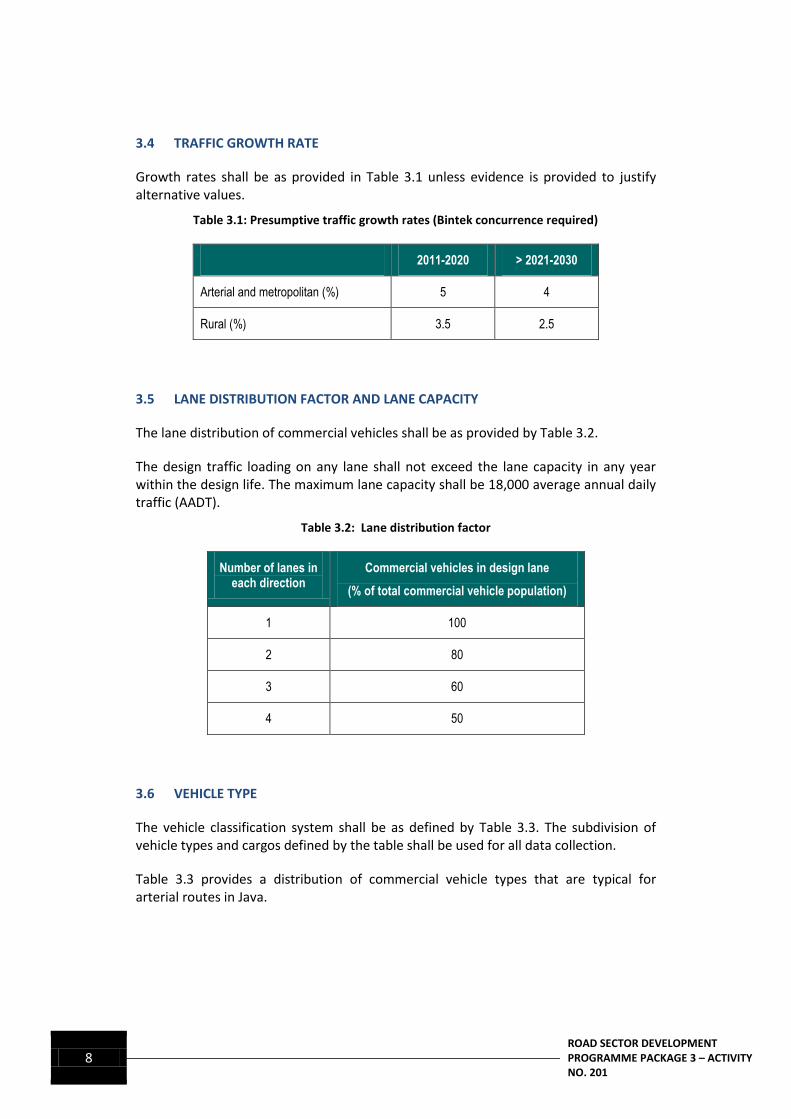
Growth rates shall be as provided in Table 3.1 unless evidence is provided to justify alternative values.
Table 3.1: Presumptive traffic growth rates (Bintek concurrence required)
2011-2020 > 2021-2030
Arterial and metropolitan (%) 5 4
Rural (%) 3.5 2.5
3.5 LANE DISTRIBUTION FACTOR AND LANE CAPACITY
The lane distribution of commercial vehicles shall be as provided by Table 3.2.
The design traffic loading on any lane shall not exceed the lane capacity in any year within the design life. The maximum lane capacity shall be 18,000 average annual daily traffic (AADT).
Table 3.2: Lane distribution factor
Number of lanes in each direction
Commercial vehicles in design lane
(% of total commercial vehicle population)
1 100
2 80
3 60
4 50
3.6 VEHICLE TYPE
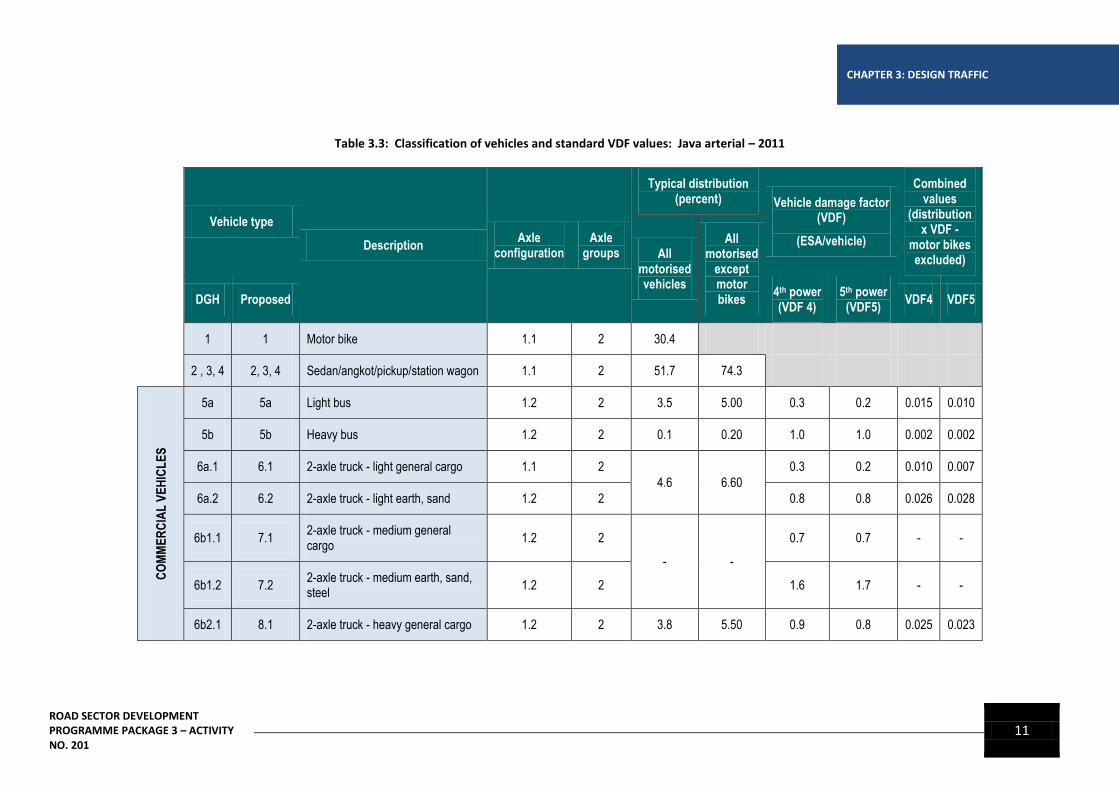
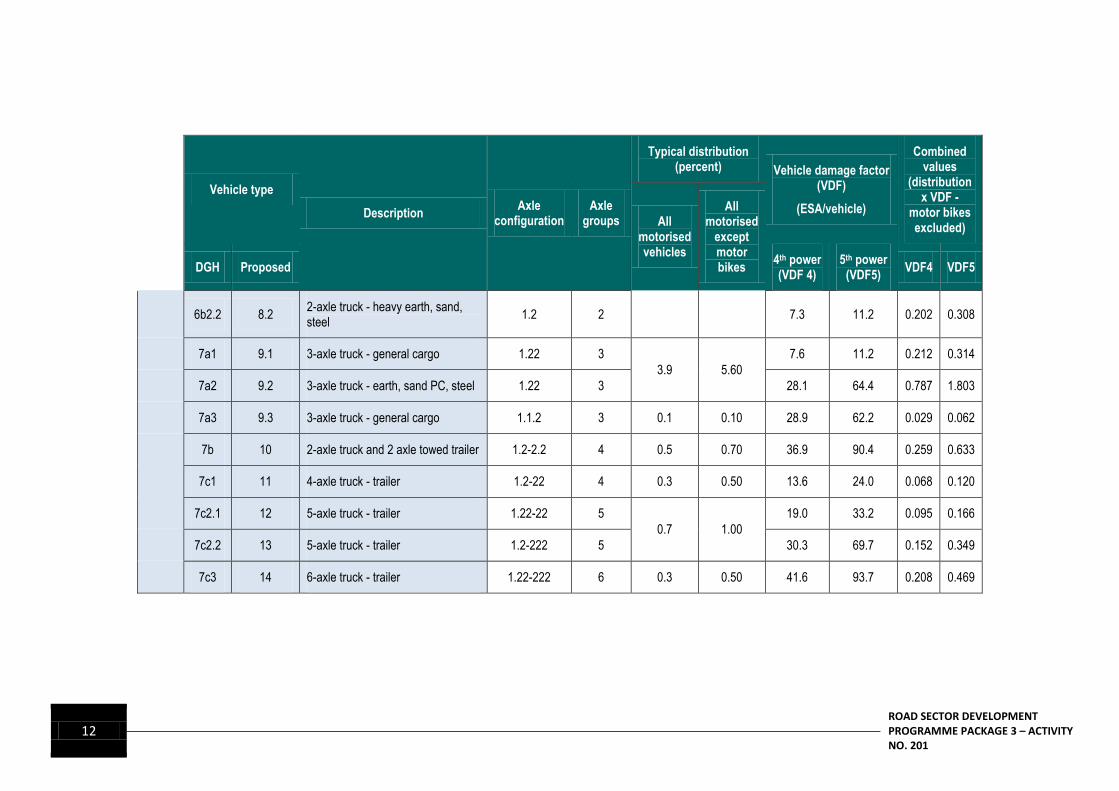
The vehicle classification system shall be as defined by Table 3.3. The subdivision of vehicle types and cargos defined by the table shall be used for all data collection.
Table 3.3 provides a distribution of commercial vehicle types that are typical for arterial routes in Java.
ROAD SECTOR DEVELOPMENT PROGRAMME PACKAGE 3 – ACTIVITY NO. 201
9
CHAPTER 3: DESIGN TRAFFIC
3.7 VEHICLE DAMAGE FACTORS (VDF)
Vehicle damage factors (VDF) shall be determined from axle loads measured from a fixed weigh bridge study or from Table 3.3. If a portable weighbridge system is used it shall have a wheel pair weight capacity of not less than 18 tonne or an axle weight capacity of not less than 35 tonne. Lower capacity systems shall not be used. Weigh-in-motion data shall only be permitted if the equipment used has been comprehensively calibrated against weighbridge data.
Fourth power VDF (VDF4) values shall be determined using the axle group values provided by DGH 20028. Table 3.3 provides vehicle damage factor (VDF4) values that are typical for arterial routes in Java. Table 3.3 also provide fifth power VDF (VDF5) as fatigue of asphalt is related to the 5th power of axle group load (refer to Section 2.8).
Annexe 1 provides a simple procedure for determining characteristic VDF values for any traffic count. The traffic count should include all vehicle types and the goods categories listed in Table 3.3.
3.8 TRAFFIC MULTIPLIER
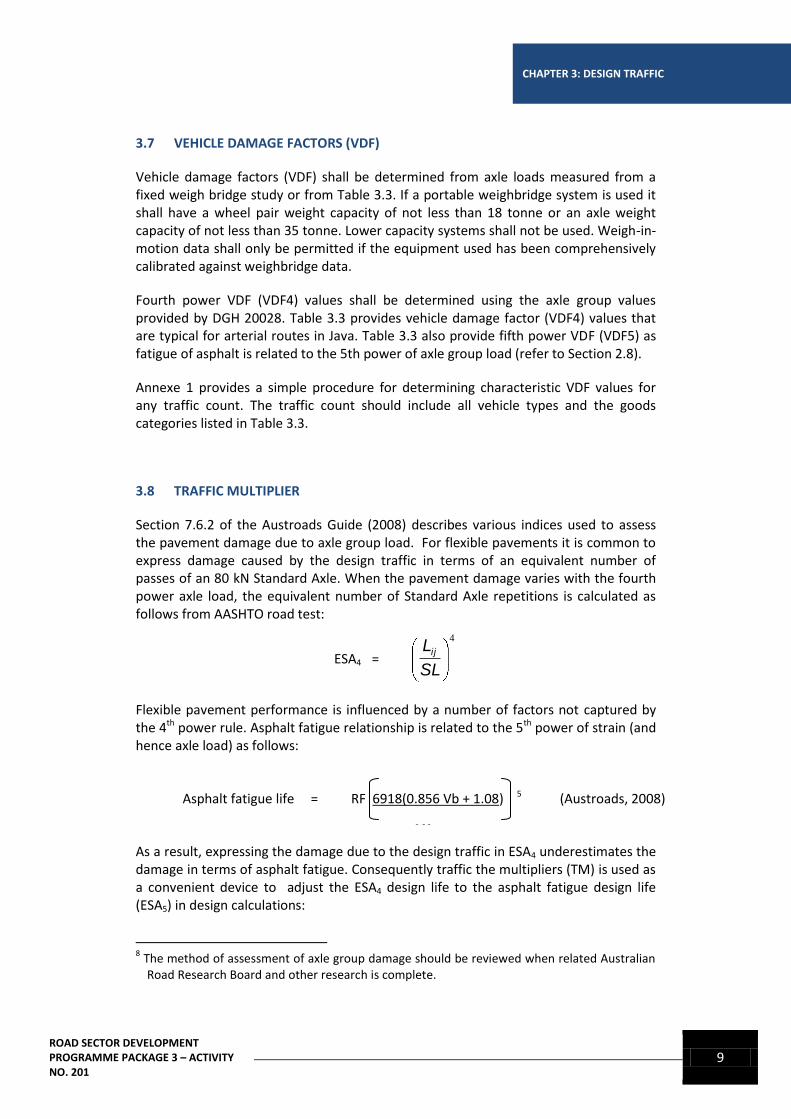
Section 7.6.2 of the Austroads Guide (2008) describes various indices used to assess the pavement damage due to axle group load. For flexible pavements it is common to express damage caused by the design traffic in terms of an equivalent number of passes of an 80 kN Standard Axle. When the pavement damage varies with the fourth power axle load, the equivalent number of Standard Axle repetitions is calculated as follows from AASHTO road test:
ESA4 =
4
SL
Lij
Flexible pavement performance is influenced by a number of factors not captured by the 4th power rule. Asphalt fatigue relationship is related to the 5th power of strain (and hence axle load) as follows:
As a result, expressing the damage due to the design traffic in ESA4 underestimates the damage in terms of asphalt fatigue. Consequently traffic the multipliers (TM) is used as a convenient device to adjust the ESA4 design life to the asphalt fatigue design life (ESA5) in design calculations:
8 The method of assessment of axle group damage should be reviewed when related Australian
Road Research Board and other research is complete.
Asphalt fatigue life = RF 6918(0.856 Vb + 1.08) 5 (Austroads, 2008)
S 0.36 mixμɛ

10 ROAD SECTOR DEVELOPMENT
PROGRAMME PACKAGE 3 – ACTIVITY NO. 201
ESA5 = TMasphalt. ESA4 where ESA5 = the number of standard axle repetitions for use in assessing asphalt fatigue life (5th power rule)
ESA4 = the number of standard axle repetitions calculated using
the 4th power rule
The asphalt fatigue TM value (TMasphalt) for normal Indonesian loading conditions is typically 2.06 but may vary depending on the extent of overloading of commercial vehicles in the truck fleet. Annexe 1 provides a calculator for TMasphalt for any commercial fleet distribution and standard Indonesian vehicle loadings.
ROAD SECTOR DEVELOPMENT PROGRAMME PACKAGE 3 – ACTIVITY NO. 201
11
CHAPTER 3: DESIGN TRAFFIC
Table 3.3: Classification of vehicles and standard VDF values: Java arterial – 2011
Vehicle type
Description Axle
configuration Axle
groups
Typical distribution (percent) Vehicle damage factor
(VDF)
(ESA/vehicle)
Combined values
(distribution x VDF -
motor bikes excluded)
All motorised vehicles
All motorised
except motor bikes
DGH Proposed
4th power (VDF 4)
5th power (VDF5)
VDF4 VDF5
1 1 Motor bike 1.1 2 30.4
2 , 3, 4 2, 3, 4 Sedan/angkot/pickup/station wagon 1.1 2 51.7 74.3
CO
MM
ER
CIA
L V
EH
ICL
ES
5a 5a Light bus 1.2 2 3.5 5.00 0.3 0.2 0.015 0.010
5b 5b Heavy bus 1.2 2 0.1 0.20 1.0 1.0 0.002 0.002
6a.1 6.1 2-axle truck - light general cargo 1.1 2
4.6 6.60
0.3 0.2 0.010 0.007
6a.2 6.2 2-axle truck - light earth, sand 1.2 2 0.8 0.8 0.026 0.028
6b1.1 7.1 2-axle truck - medium general cargo
1.2 2
- -
0.7 0.7 - -
6b1.2 7.2 2-axle truck - medium earth, sand, steel
1.2 2 1.6 1.7 - -
6b2.1 8.1 2-axle truck - heavy general cargo 1.2 2 3.8 5.50 0.9 0.8 0.025 0.023
12 ROAD SECTOR DEVELOPMENT
PROGRAMME PACKAGE 3 – ACTIVITY NO. 201
Vehicle type
Description Axle
configuration Axle
groups
Typical distribution (percent) Vehicle damage factor
(VDF)
(ESA/vehicle)
Combined values
(distribution x VDF -
motor bikes excluded)
All motorised vehicles
All motorised
except motor bikes
DGH Proposed
4th power (VDF 4)
5th power (VDF5)
VDF4 VDF5
6b2.2 8.2 2-axle truck - heavy earth, sand, steel
1.2 2 7.3 11.2 0.202 0.308
7a1 9.1 3-axle truck - general cargo 1.22 3
3.9 5.60
7.6 11.2 0.212 0.314
7a2 9.2 3-axle truck - earth, sand PC, steel 1.22 3 28.1 64.4 0.787 1.803
7a3 9.3 3-axle truck - general cargo 1.1.2 3 0.1 0.10 28.9 62.2 0.029 0.062
7b 10 2-axle truck and 2 axle towed trailer 1.2-2.2 4 0.5 0.70 36.9 90.4 0.259 0.633
7c1 11 4-axle truck - trailer 1.2-22 4 0.3 0.50 13.6 24.0 0.068 0.120
7c2.1 12 5-axle truck - trailer 1.22-22 5
0.7 1.00
19.0 33.2 0.095 0.166
7c2.2 13 5-axle truck - trailer 1.2-222 5 30.3 69.7 0.152 0.349
7c3 14 6-axle truck - trailer 1.22-222 6 0.3 0.50 41.6 93.7 0.208 0.469
ROAD SECTOR DEVELOPMENT PROGRAMME PACKAGE 3 – ACTIVITY NO. 201
13
CHAPTER 4: SUBGRADE SUPPORT FOR RECONSTRUCTION AND RECYCLING
CHAPTER 4: SUBGRADE SUPPORT FOR RECONSTRUCTION AND RECYCLING
4.1 EXISTING PAVEMENT ANALYSIS
The Supplement Part I Section 5 provides procedures for determining subgrade California bearing ratio (CBR) and for standard subgrade treatments including for expansive and soft soil that must also be applied to rehabilitation works. The key difference for rehabilitation works is that the existing pavement layers usually prevent further treatment of the existing subgrade. Areas where heavy patching is required are an exception. Subgrade analysis can be by dynamic cone penetrometer (DCP) (best choice for saturated ground), by Atterburg limits and Part I Design Chart 8.1 or by four-day soaked CBR at the in situ density. The thickness of existing pavement layers remaining after recycling or other treatment can also be determined from the test pit survey.
The characteristic existing subgrade CBR value and the remaining characteristic existing pavement layer thickness are necessary inputs to the design charts provided in this document. These data are also needed for mechanistic or Structural Number based design.
The subgrade and the existing pavement thickness are likely to be highly variable. Homogeneous sections must be determined and characteristic values must then be used for design following the same principles as for new pavement subgrade analysis.
a) Coefficient of variation for a homogeneous section = standard deviation/mean < 0.3
b) Characteristic CBR = mean CBR – 1.3 x standard deviation
c) Characteristic remaining thickness of existing pavement after other treatments = mean remaining thickness – 1.3 x standard deviation
Heavy patching areas shall be designed in the same manner as for new pavement (Supplement Part I). Heavy patching is required in areas where the existing pavement has failed or where the existing pavement layers are insufficient to provide an adequate foundation. Part I Design Chart 8.2 must be satisfied for existing pavement layer thicknesses other than the recycled layer, necessary to provide adequate foundation support for recycling.
4.2 SOFT SOIL TREATMENTS
Soft soil areas are defined as areas having an in situ CBR significantly lower than 2 percent. They are unable to support compaction of subsequent layers without special treatment. In Indonesia, soft soil areas are usually alluvial or marine silty clays that are
14 ROAD SECTOR DEVELOPMENT
PROGRAMME PACKAGE 3 – ACTIVITY NO. 201
permanently or seasonally saturated. Soft soil areas frequently exhibit instability that must be treated either by grade raising, reconstruction or other treatment. Grade raising is often applied in country areas when there is no finished surface level height constraint.
When full construction is required the requirements of Supplement I shall apply. The capping layers should preferably be rock or sirtu (coarse river gravel). A geotextile layer should be used to separate original ground from the capping to limit pumping of the soft soil zone into the capping material.
The extent of soft soil areas should be determined by DCP testing. A 2 metre deep DCP test is recommended (standard DCP with extension rod). Tests should be conducted at 20 metre centres. Special treatment such as micro piling or cakar ayam (friction pile system of Indonesian origin) to support rigid pavement on soft soil) must be considered for areas where the depth from original ground to CBR 2 equivalent bearing capacity exceeds 2.0 metres at any point, especially for rigid pavement construction.
Micro piling, cakar ayam, injection piling or similar treatment is likely to be necessary when restoring block cracked rigid pavement on soft soil.
Grade raising designs should consider:
a) Embankment heights should be between 2 and 2.5 metres.
b) Height of new subgrade should preferably be a) 1 metre above standing water, and b) not less than 300mm above 10-year flood.
c) The foundation design rules provided in Supplement I should be satisfied.
The settlement rates and embankment stability should be considered when widening embankments, especially those exceeding 2 metres in height. Preloading should be used to limit differential movement between the existing embankment and the widening. Micro piling or other treatment may be required at bridge approaches. Geotechnical advice should be sought.
Embankment batter slopes should be not steeper than 1V: 3H. Use of edge walls should be avoided. If used, wall stability shall be checked and piling or other treatment used as necessary.
4.3 PEAT
Specialist geotechnical advice must be obtained. Preloading is always necessary when widening existing pavement. Adequate cross drainage must be maintained at all times. Batter slopes should be not steeper than 1V: 3H. In addition to this, high embankments should be benched. Bridge approaches should be piled. Georgic treatments should be considered. Geotextile should be used at the interface between original ground and widening.

ROAD SECTOR DEVELOPMENT PROGRAMME PACKAGE 3 – ACTIVITY NO. 201
15
CHAPTER 4: SUBGRADE SUPPORT FOR RECONSTRUCTION AND RECYCLING
4.4 EXPANSIVE SOILS
Reference should be made to Supplement I. The most important consideration is to limit moisture variation in the expansive soil layer by:
a) Sealing the road shoulder
b) Providing good surface and subsurface drainage including sealing of all surface drains, and ensuring that any subsurface drain provided has a 0.5 percent invert gradient and a permanent discharge point above flood level and above water levels in the drainage system
Providing the minimum cover thicknesses required by Supplement I.
16 ROAD SECTOR DEVELOPMENT
PROGRAMME PACKAGE 3 – ACTIVITY NO. 201
CHAPTER 5: MATERIALS CHARACTERISATION
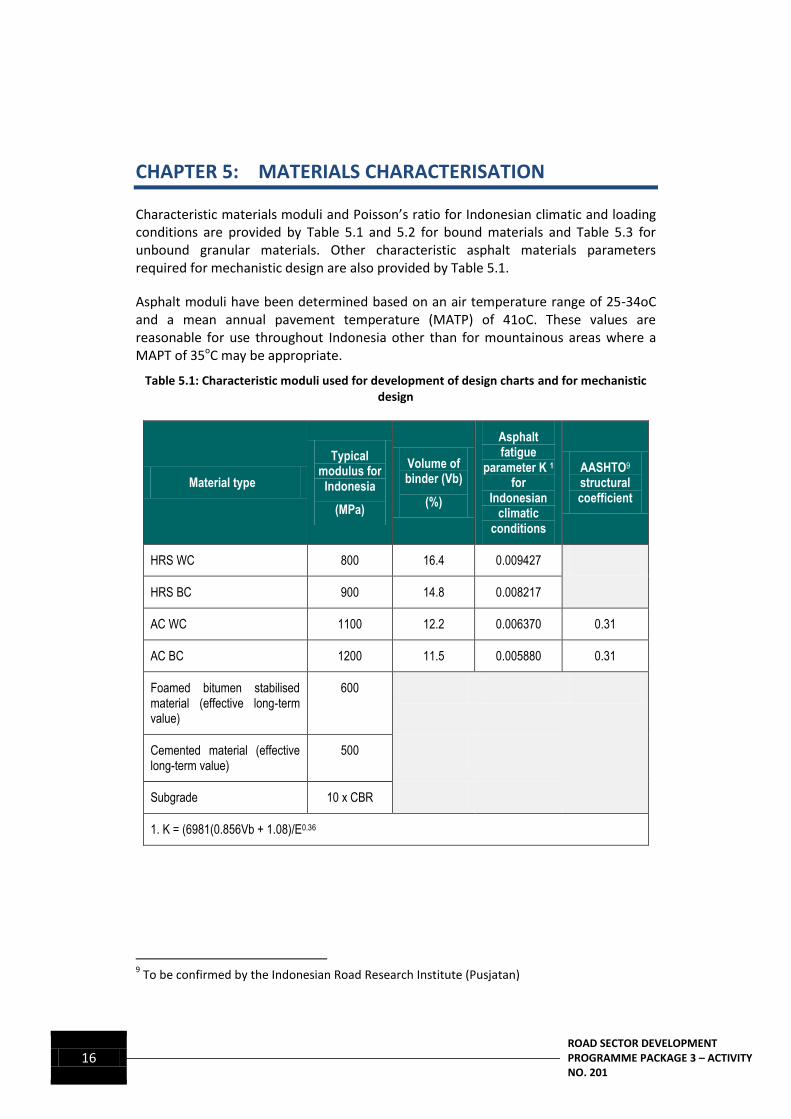
Characteristic materials moduli and Poisson’s ratio for Indonesian climatic and loading conditions are provided by Table 5.1 and 5.2 for bound materials and Table 5.3 for unbound granular materials. Other characteristic asphalt materials parameters required for mechanistic design are also provided by Table 5.1.
Asphalt moduli have been determined based on an air temperature range of 25-34oC and a mean annual pavement temperature (MATP) of 41oC. These values are reasonable for use throughout Indonesia other than for mountainous areas where a MAPT of 35oC may be appropriate.
Table 5.1: Characteristic moduli used for development of design charts and for mechanistic design
Material type
Typical modulus for
Indonesia
(MPa)
Volume of binder (Vb)
(%)
Asphalt fatigue
parameter K 1 for
Indonesian climatic
conditions
AASHTO9 structural coefficient
HRS WC 800 16.4 0.009427
HRS BC 900 14.8 0.008217
AC WC 1100 12.2 0.006370 0.31
AC BC 1200 11.5 0.005880 0.31
Foamed bitumen stabilised material (effective long-term value)
600
Cemented material (effective long-term value)
500
Subgrade 10 x CBR
1. K = (6981(0.856Vb + 1.08)/E0.36
9 To be confirmed by the Indonesian Road Research Institute (Pusjatan)
ROAD SECTOR DEVELOPMENT PROGRAMME PACKAGE 3 – ACTIVITY NO. 201
17
CHAPTER 5: MATERIALS CHARACTERISATION
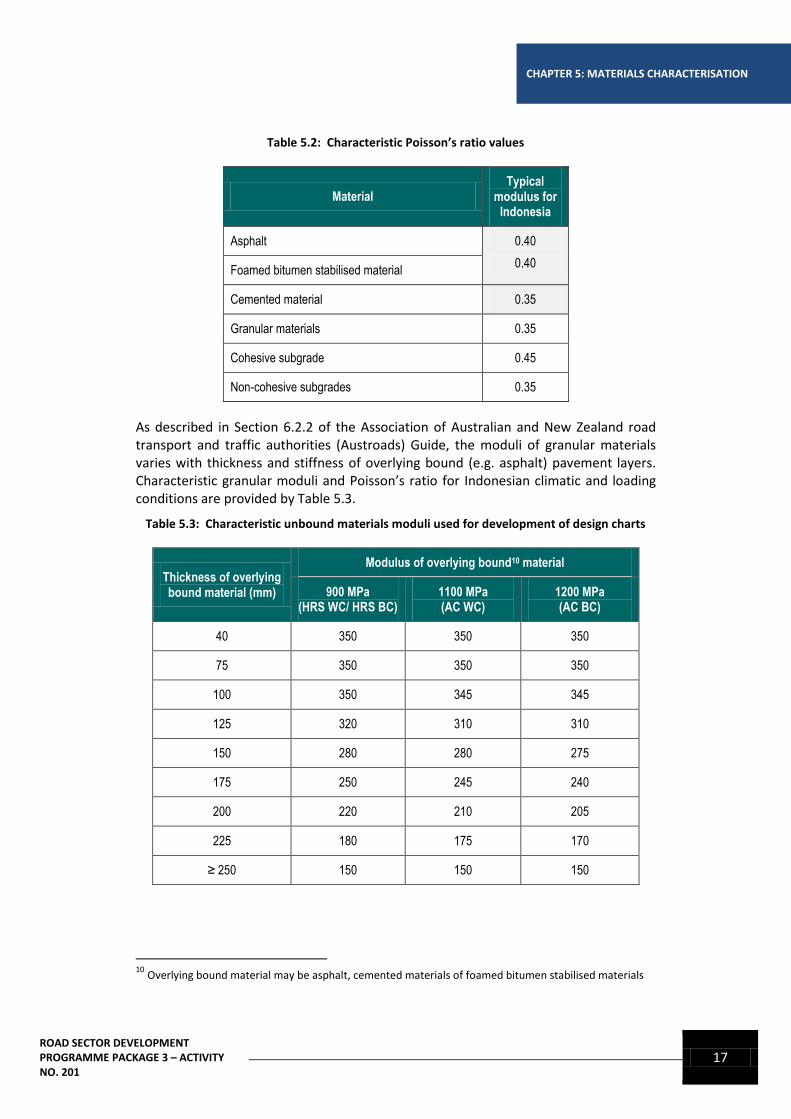
Table 5.2: Characteristic Poisson’s ratio values
Material Typical
modulus for Indonesia
Asphalt 0.40
0.40 Foamed bitumen stabilised material
Cemented material 0.35
Granular materials 0.35
Cohesive subgrade 0.45
Non-cohesive subgrades 0.35
As described in Section 6.2.2 of the Association of Australian and New Zealand road transport and traffic authorities (Austroads) Guide, the moduli of granular materials varies with thickness and stiffness of overlying bound (e.g. asphalt) pavement layers. Characteristic granular moduli and Poisson’s ratio for Indonesian climatic and loading conditions are provided by Table 5.3.
Table 5.3: Characteristic unbound materials moduli used for development of design charts
Thickness of overlying bound material (mm)
Modulus of overlying bound10 material
900 MPa (HRS WC/ HRS BC)
1100 MPa (AC WC)
1200 MPa (AC BC)
40 350 350 350
75 350 350 350
100 350 345 345
125 320 310 310
150 280 280 275
175 250 245 240
200 220 210 205
225 180 175 170
≥ 250 150 150 150
10
Overlying bound material may be asphalt, cemented materials of foamed bitumen stabilised materials
18 ROAD SECTOR DEVELOPMENT
PROGRAMME PACKAGE 3 – ACTIVITY NO. 201
CHAPTER 6: DRAINAGE
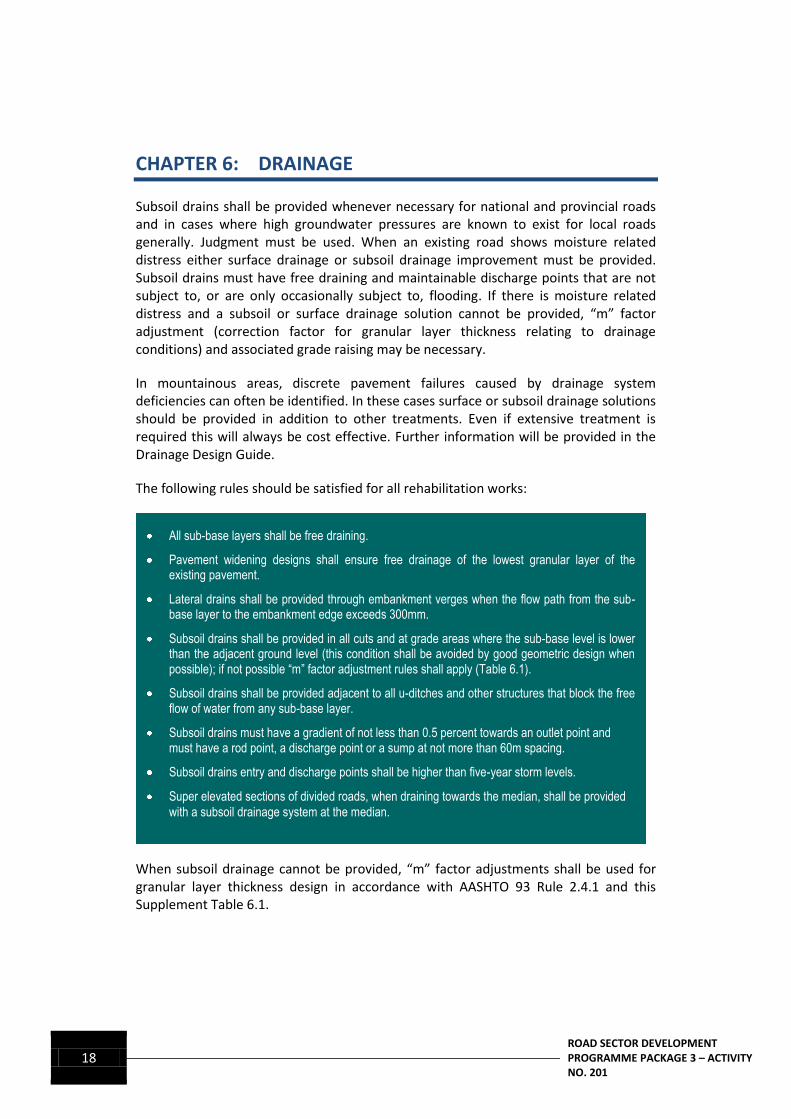
Subsoil drains shall be provided whenever necessary for national and provincial roads and in cases where high groundwater pressures are known to exist for local roads generally. Judgment must be used. When an existing road shows moisture related distress either surface drainage or subsoil drainage improvement must be provided. Subsoil drains must have free draining and maintainable discharge points that are not subject to, or are only occasionally subject to, flooding. If there is moisture related distress and a subsoil or surface drainage solution cannot be provided, “m” factor adjustment (correction factor for granular layer thickness relating to drainage conditions) and associated grade raising may be necessary.
In mountainous areas, discrete pavement failures caused by drainage system deficiencies can often be identified. In these cases surface or subsoil drainage solutions should be provided in addition to other treatments. Even if extensive treatment is required this will always be cost effective. Further information will be provided in the Drainage Design Guide.
The following rules should be satisfied for all rehabilitation works:
When subsoil drainage cannot be provided, “m” factor adjustments shall be used for granular layer thickness design in accordance with AASHTO 93 Rule 2.4.1 and this Supplement Table 6.1.
All sub-base layers shall be free draining.
Pavement widening designs shall ensure free drainage of the lowest granular layer of the existing pavement.
Lateral drains shall be provided through embankment verges when the flow path from the sub-base layer to the embankment edge exceeds 300mm.
Subsoil drains shall be provided in all cuts and at grade areas where the sub-base level is lower than the adjacent ground level (this condition shall be avoided by good geometric design when possible); if not possible “m” factor adjustment rules shall apply (Table 6.1).
Subsoil drains shall be provided adjacent to all u-ditches and other structures that block the free flow of water from any sub-base layer.
Subsoil drains must have a gradient of not less than 0.5 percent towards an outlet point and must have a rod point, a discharge point or a sump at not more than 60m spacing.
Subsoil drains entry and discharge points shall be higher than five-year storm levels.
Super elevated sections of divided roads, when draining towards the median, shall be provided
with a subsoil drainage system at the median.
ROAD SECTOR DEVELOPMENT PROGRAMME PACKAGE 3 – ACTIVITY NO. 201
19
CHAPTER 6: DRAINAGE
Figure 6.1: “m” factor adjustments for subgrade drainage condition
20 ROAD SECTOR DEVELOPMENT
PROGRAMME PACKAGE 3 – ACTIVITY NO. 201
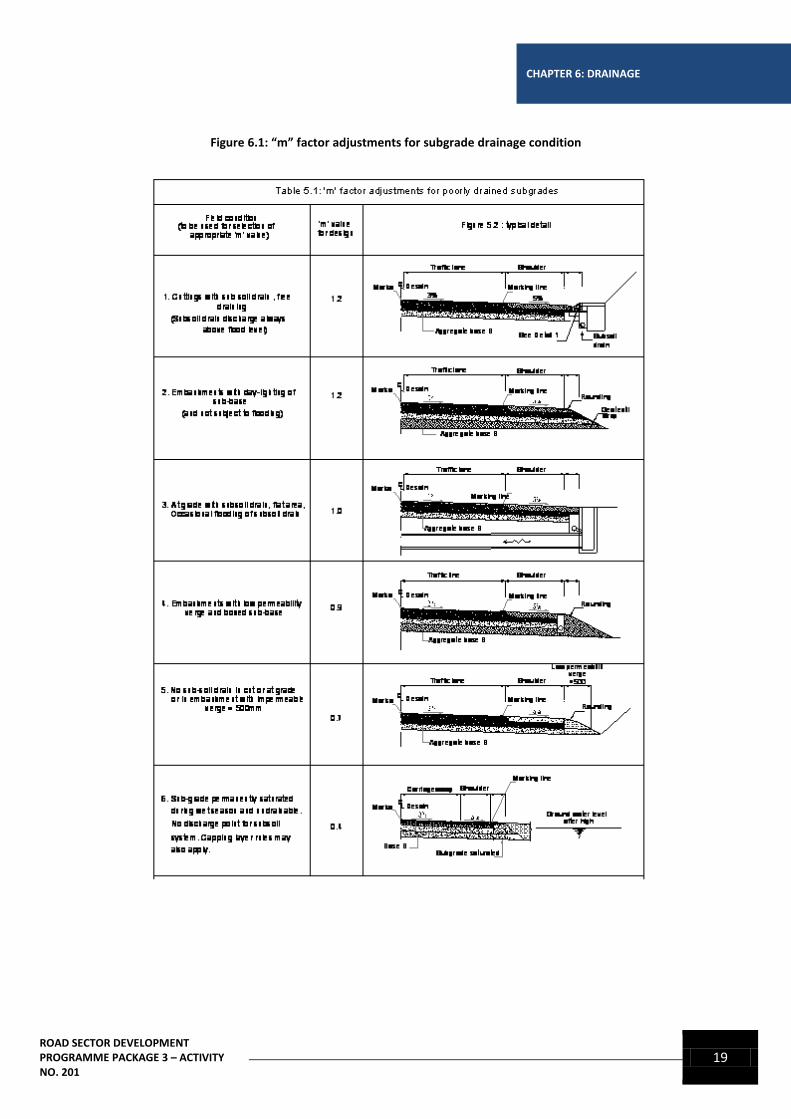
Figure 6.2: Examples of subsoil drainage for various site conditions
Figure 6.2 provides examples of subsoil drainage system positions that are appropriate for various site conditions.
ROAD SECTOR DEVELOPMENT PROGRAMME PACKAGE 3 – ACTIVITY NO. 201
21
CHAPTER 7: THICKNESS DESIGN OF OVERLAYS
CHAPTER 7: THICKNESS DESIGN OF OVERLAYS
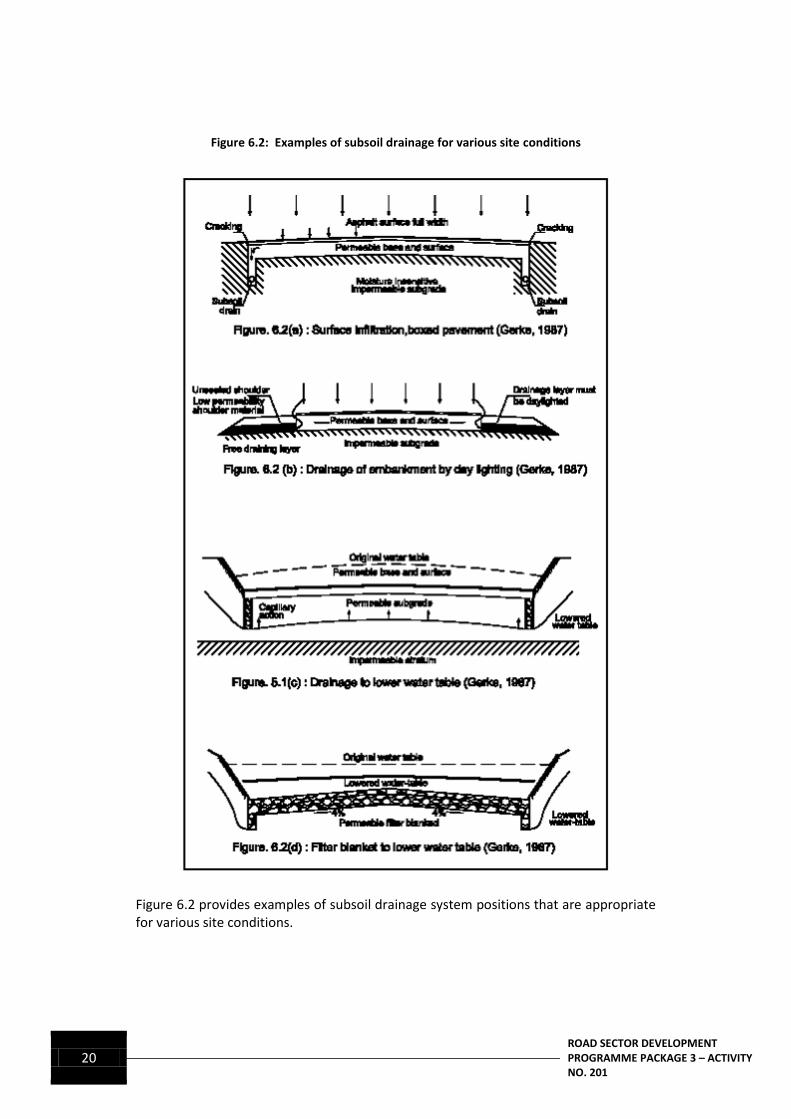
7.1 INTRODUCTION
This section describes procedures for determining the design thickness of overlays placed to rectify the distress and structural deficiencies of an existing pavement.
Such treatments may often be placed on pavements for other reasons that relate to the rectification of the functional characteristics of pavements, such as shape, ride quality and surface competency. The structural adequacy of these treatments also needs to be considered.
Currently, DGH has two guidelines that may be used for the design of asphalt overlays:
A deflection-based approach contained in the Indonesian Road Research Institute (Pusjatan) Guide to Overlay Design Using Deflections.
A Structural Number approach contained in the Pusjatan Guide to the Design of Flexible Pavements (Pt T-01-2002-B).
The Pusjatan deflection-based approach uses maximum deflections (D0) to determine the required overlay thicknesses. The Austroads overlay method utilises these design deflections to determine asphalt overlay thickness to inhibit sub-base and subgrade rutting and shape loss. However, these design deflections (D0) are not suitable for assessing whether asphalt overlays will fatigue crack. Consequently, for road projects with design traffic loading less than or equal to 107 ESA, Austroads have an additional requirement that the deflection bowl curvature (D0 - D200) be checked to ensure the fatigue resistance of the overlay. It is recommended this requirement be added to the Pusjatan deflection-based approach as described in Section 7.2.
For rehabilitation projects with design traffic loading greater than 107 ESA, Austroads recommends the use of general mechanistic procedures (GMP) based on estimating the moduli of the existing pavement. These moduli are then used in the mechanistic method for the design of new pavements to assess the resistance to rutting and fatigue of asphalt overlay thicknesses. The use of the GMP requires the development of an Indonesian mechanistic method for the design of new pavements. Hence the GMP approach is currently unsuitable for routine use by Indonesian designers.
It is recommended that for rehabilitation projects with design traffic loading greater than 107 ESA11, the overlays estimated by the Pusjatan deflection-based approach be checked for structural adequacy using the Structural Number approach contained in the Pusjatan Guide to the Design of Flexible Pavements12 .
11
20 year design life, 5th
power (ESA5/20) 12
If the Austroads mechanistic method (CIRCLY) is used to check or determine the overlay thickness the moduli and mechanistic design parameters provided in Section4 and 5. should
22 ROAD SECTOR DEVELOPMENT
PROGRAMME PACKAGE 3 – ACTIVITY NO. 201
When the subgrade or original ground is CBR 2.5 or weaker, especially when traffic the existing pavement layer thicknesses including any subgrade improvement or capping layer shall be determined from test pits or cores combined with DCP readings when necessary. For this case the subgrade and original ground (beneath any capping) bearing capacities or moduli shall be determined by the methods described in Section 4.1”.
7.2 DESIGN TRAFFIC LESS THAN OR EQUAL TO 107 ESA
As discussed in Section 7.1, it is recommended the Austroads curvature requirement be added to the Pusjatan deflection-based approach for projects with a design traffic loading less than or equal to 10 7 ESA. Due to the high fatigue resistance of hot rolled sheet (HRS) wearing course, there is no need for checking the curvature requirements when the deflections indicate only a thin HRS wearing course is required.
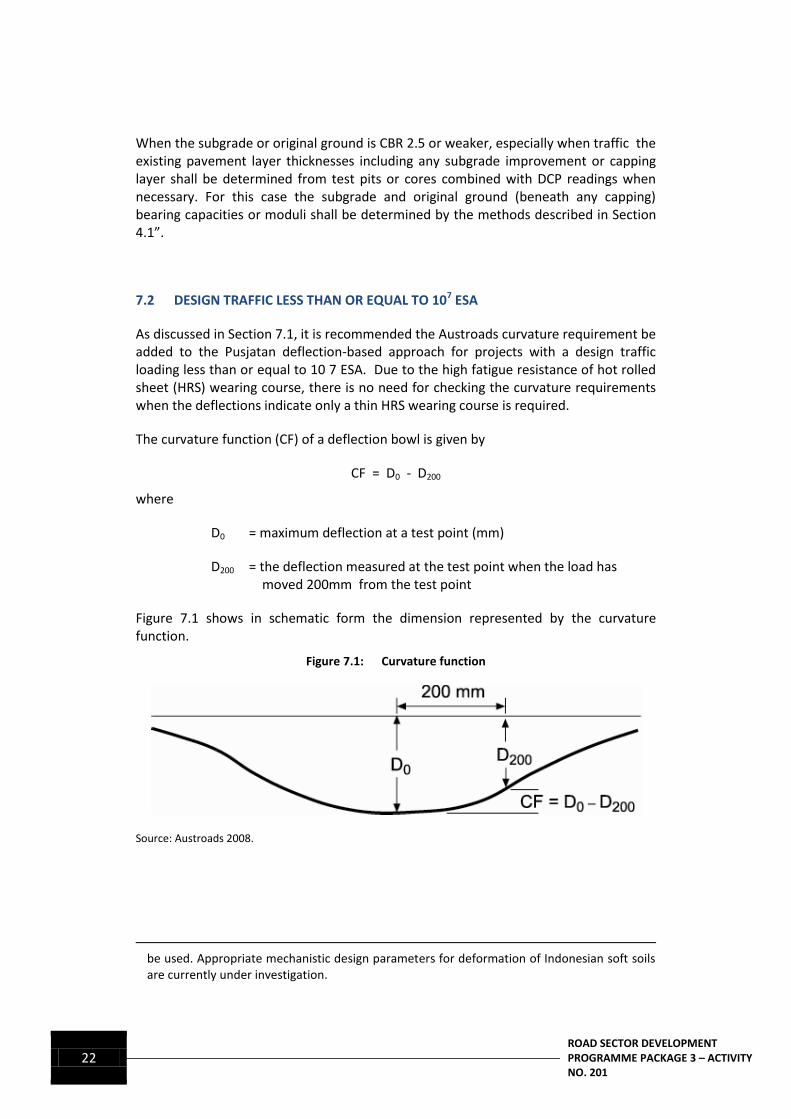
The curvature function (CF) of a deflection bowl is given by
CF = D0 - D200
where
D0 = maximum deflection at a test point (mm)
D200 = the deflection measured at the test point when the load has moved 200mm from the test point
Figure 7.1 shows in schematic form the dimension represented by the curvature function.
Figure 7.1: Curvature function
Source: Austroads 2008.
be used. Appropriate mechanistic design parameters for deformation of Indonesian soft soils are currently under investigation.
ROAD SECTOR DEVELOPMENT PROGRAMME PACKAGE 3 – ACTIVITY NO. 201
23
CHAPTER 7: THICKNESS DESIGN OF OVERLAYS
7.2.1 Adjustment of measured curvature to account for testing temperature
For asphalt overlays on asphalt surfaced granular pavements, the measured curvatures need to be corrected because pavement temperature influences pavement stiffness and response to load. Any significant difference between the pavement temperature at the time of testing and in-service conditions means the curvature measurements would be unrepresentative of the normal pavement response to traffic loadings.
The in-service pavement temperature at a site is characterised by the mean annual pavement temperature (MAPT), which is 41ºC for Indonesia. The temperature correction factor is calculated using the following procedure:
Step 1 Determine the temperature factor fT where (Equation 7.1):
fT =
testingoftimeatetemperaturpavementMeasured
sitetheforMAPT
7.1
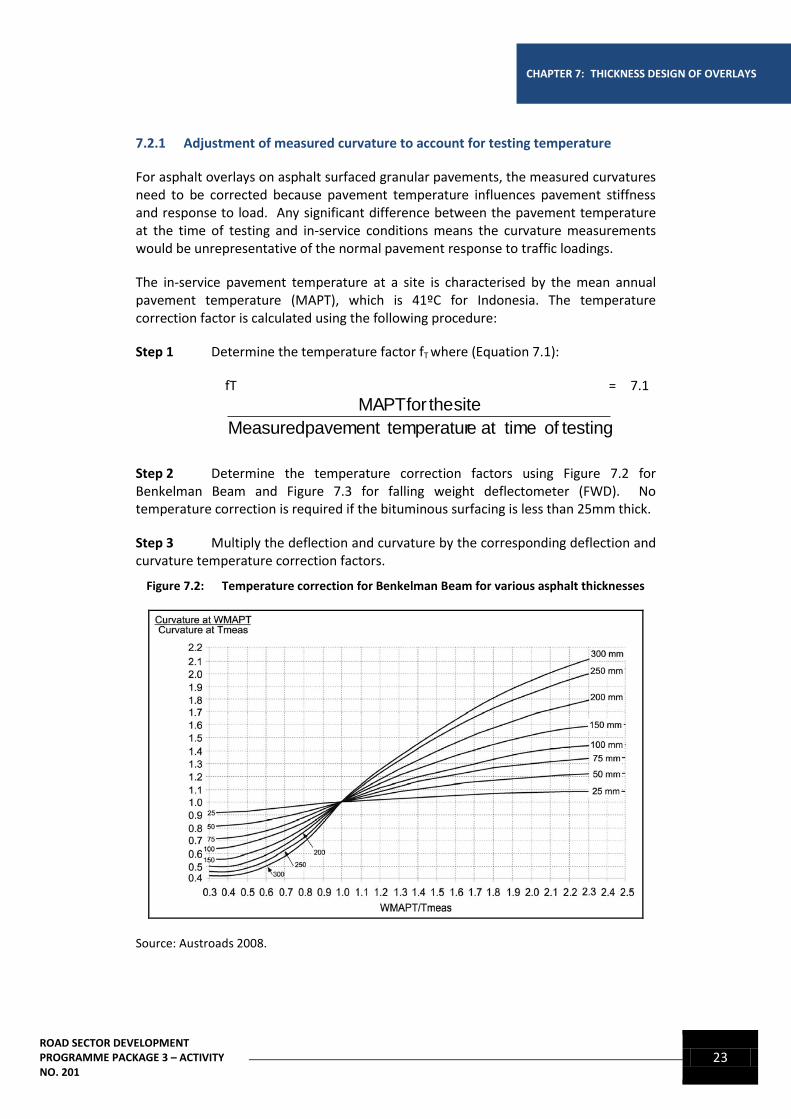
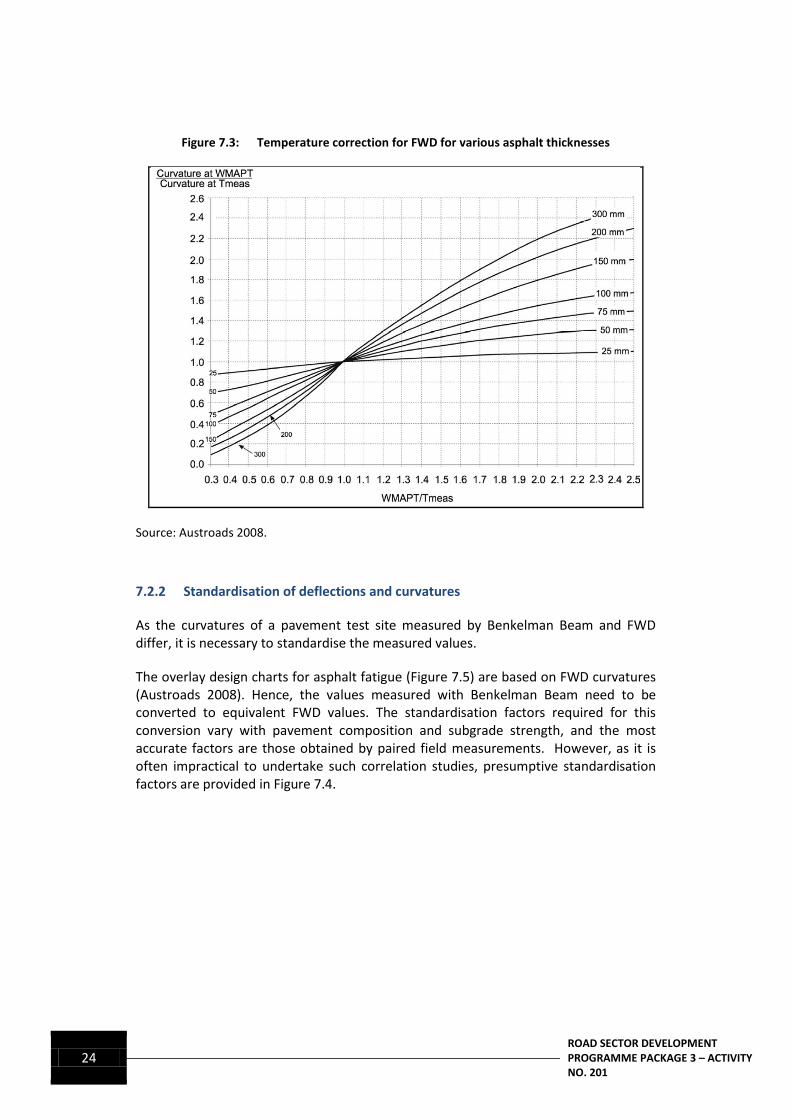
Step 2 Determine the temperature correction factors using Figure 7.2 for Benkelman Beam and Figure 7.3 for falling weight deflectometer (FWD). No temperature correction is required if the bituminous surfacing is less than 25mm thick.
Step 3 Multiply the deflection and curvature by the corresponding deflection and curvature temperature correction factors.
Figure 7.2: Temperature correction for Benkelman Beam for various asphalt thicknesses
Source: Austroads 2008.
24 ROAD SECTOR DEVELOPMENT
PROGRAMME PACKAGE 3 – ACTIVITY NO. 201
Figure 7.3: Temperature correction for FWD for various asphalt thicknesses
Source: Austroads 2008.
7.2.2 Standardisation of deflections and curvatures
As the curvatures of a pavement test site measured by Benkelman Beam and FWD differ, it is necessary to standardise the measured values.
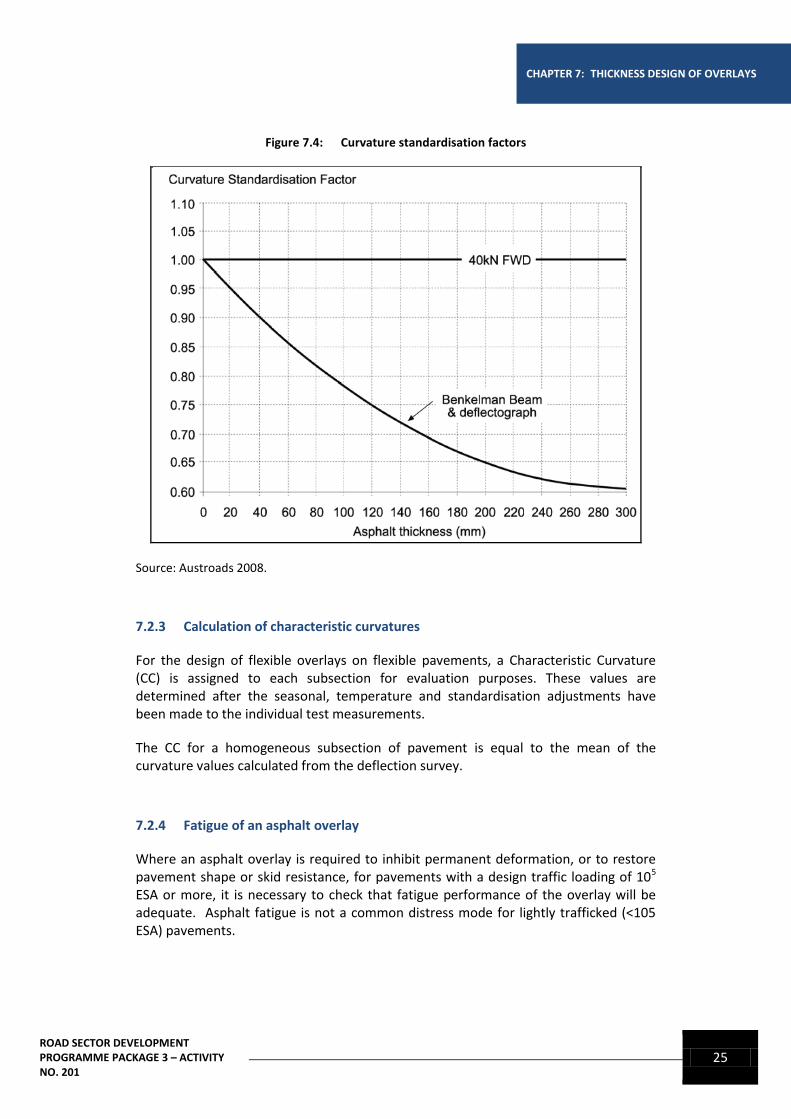
The overlay design charts for asphalt fatigue (Figure 7.5) are based on FWD curvatures (Austroads 2008). Hence, the values measured with Benkelman Beam need to be converted to equivalent FWD values. The standardisation factors required for this conversion vary with pavement composition and subgrade strength, and the most accurate factors are those obtained by paired field measurements. However, as it is often impractical to undertake such correlation studies, presumptive standardisation factors are provided in Figure 7.4.
ROAD SECTOR DEVELOPMENT PROGRAMME PACKAGE 3 – ACTIVITY NO. 201
25
CHAPTER 7: THICKNESS DESIGN OF OVERLAYS
Figure 7.4: Curvature standardisation factors
Source: Austroads 2008.
7.2.3 Calculation of characteristic curvatures
For the design of flexible overlays on flexible pavements, a Characteristic Curvature (CC) is assigned to each subsection for evaluation purposes. These values are determined after the seasonal, temperature and standardisation adjustments have been made to the individual test measurements.
The CC for a homogeneous subsection of pavement is equal to the mean of the curvature values calculated from the deflection survey.
7.2.4 Fatigue of an asphalt overlay
Where an asphalt overlay is required to inhibit permanent deformation, or to restore pavement shape or skid resistance, for pavements with a design traffic loading of 105 ESA or more, it is necessary to check that fatigue performance of the overlay will be adequate. Asphalt fatigue is not a common distress mode for lightly trafficked (<105 ESA) pavements.
26 ROAD SECTOR DEVELOPMENT
PROGRAMME PACKAGE 3 – ACTIVITY NO. 201
The procedure assumes that any existing asphalt layers have little or no remaining fatigue life, and that it will be uneconomical to design the overlay to inhibit fatigue cracking of these layers. Hence, the overlay is not designed to inhibit fatigue of any existing asphalt layers.
Accordingly, the design charts are inappropriate to design asphalt surfaced pavements which are progressively strengthened in stages that have significant remaining asphalt fatigue life. Similarly, they do not apply to overlay requirements of newly constructed asphalt pavements. As asphalt fatigue is not a common distress mode for lightly trafficked roads, it is not necessary to check the fatigue performance of overlays for projects with design traffic loadings less than 105 ESA.
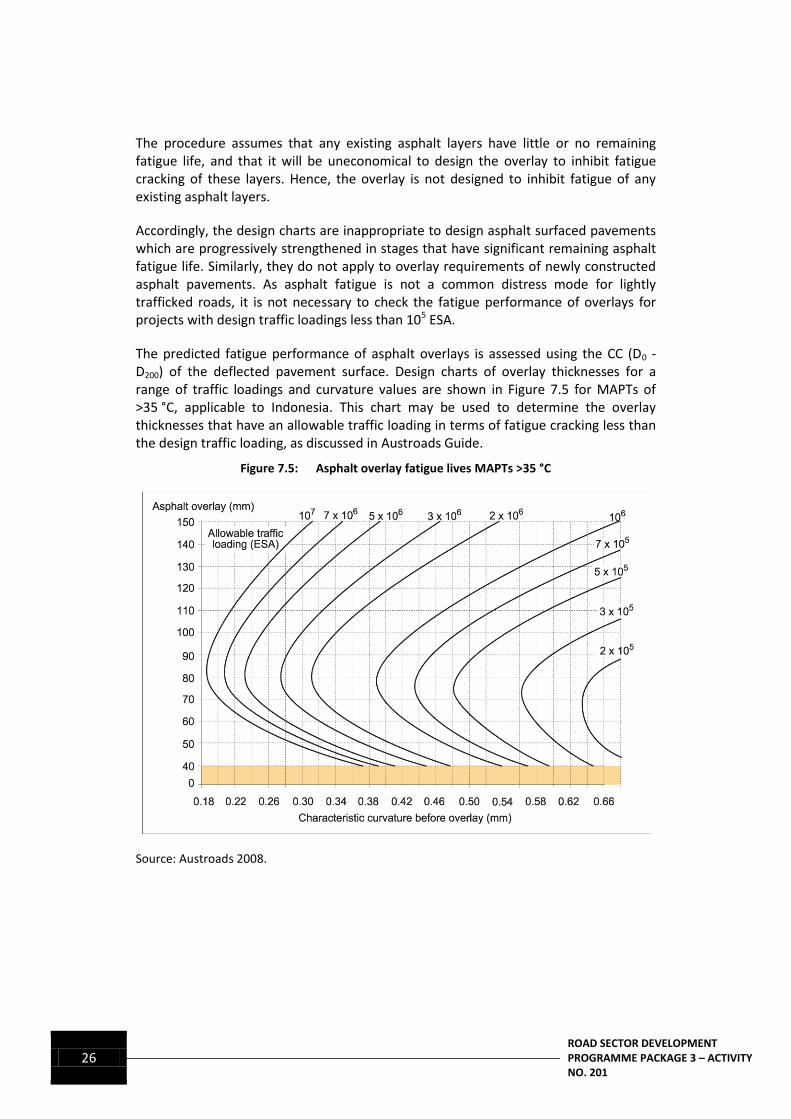
The predicted fatigue performance of asphalt overlays is assessed using the CC (D0 - D200) of the deflected pavement surface. Design charts of overlay thicknesses for a range of traffic loadings and curvature values are shown in Figure 7.5 for MAPTs of >35 °C, applicable to Indonesia. This chart may be used to determine the overlay thicknesses that have an allowable traffic loading in terms of fatigue cracking less than the design traffic loading, as discussed in Austroads Guide.
Figure 7.5: Asphalt overlay fatigue lives MAPTs >35 °C
Source: Austroads 2008.
ROAD SECTOR DEVELOPMENT PROGRAMME PACKAGE 3 – ACTIVITY NO. 201
27
CHAPTER 8: THICKNESS DESIGN OF FOAMED BITUMEN STABILISATION TREATMENTS
CHAPTER 8: THICKNESS DESIGN OF FOAMED BITUMEN STABILISATION TREATMENTS
8.1 INTRODUCTION
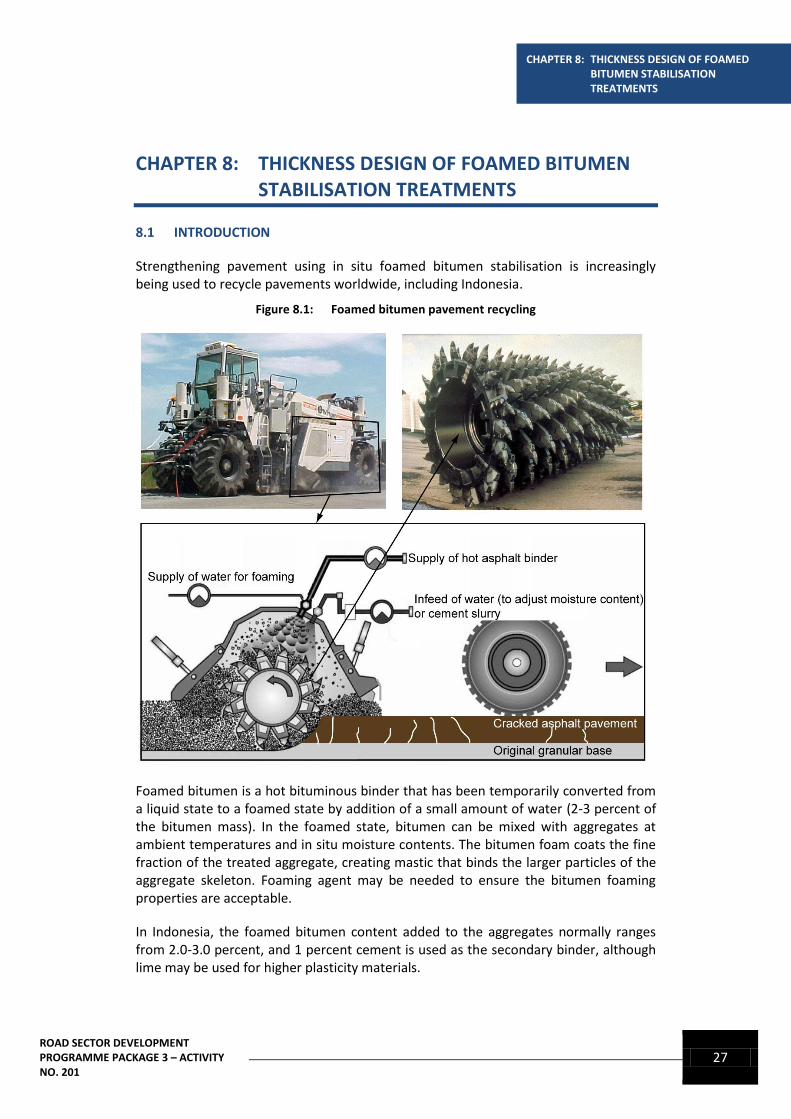
Strengthening pavement using in situ foamed bitumen stabilisation is increasingly being used to recycle pavements worldwide, including Indonesia.
Figure 8.1: Foamed bitumen pavement recycling
Foamed bitumen is a hot bituminous binder that has been temporarily converted from a liquid state to a foamed state by addition of a small amount of water (2-3 percent of the bitumen mass). In the foamed state, bitumen can be mixed with aggregates at ambient temperatures and in situ moisture contents. The bitumen foam coats the fine fraction of the treated aggregate, creating mastic that binds the larger particles of the aggregate skeleton. Foaming agent may be needed to ensure the bitumen foaming properties are acceptable.
In Indonesia, the foamed bitumen content added to the aggregates normally ranges from 2.0-3.0 percent, and 1 percent cement is used as the secondary binder, although lime may be used for higher plasticity materials.
28 ROAD SECTOR DEVELOPMENT
PROGRAMME PACKAGE 3 – ACTIVITY NO. 201
The strength/stiffness of foamed bitumen mixes is derived from:
Friction between the aggregate particles
Viscosity of the bituminous binder under operating conditions
Cohesion within the mass resulting from the binder itself, and the adhesion between the bituminous and hydraulic binders and the aggregate
Similar to other stabilising binders, foamed bitumen stabilisation can be undertaken in situ or in a mixing plant. The foamed bitumen is incorporated into the recycling drum or into the plant where it wets and coats the surface of the fine fraction particles to form a flexible bound pavement material. The mixing of the foamed bitumen and soil is critical to the success of the process because the bitumen is in its foamed state for only a very short period and coating of the particles must be achieved within this period.
Given that the use of foamed bitumen treatments is more recent than many other rehabilitation treatments, mix and thickness design procedures are progressively being refined in various countries. The development interim thickness design method is described in Annexe 2.
It is emphasised that the method is interim and it is recommended that the performance of foamed bitumen stabilised pavements recently constructed in Indonesia be monitored to further develop this interim method.
8.2 MATERIALS SUITABLE FOR FOAMED BITUMEN STABILISATION
In Indonesia, foamed bitumen stabilisation is commonly applied to recycle existing asphalt and granular base materials.
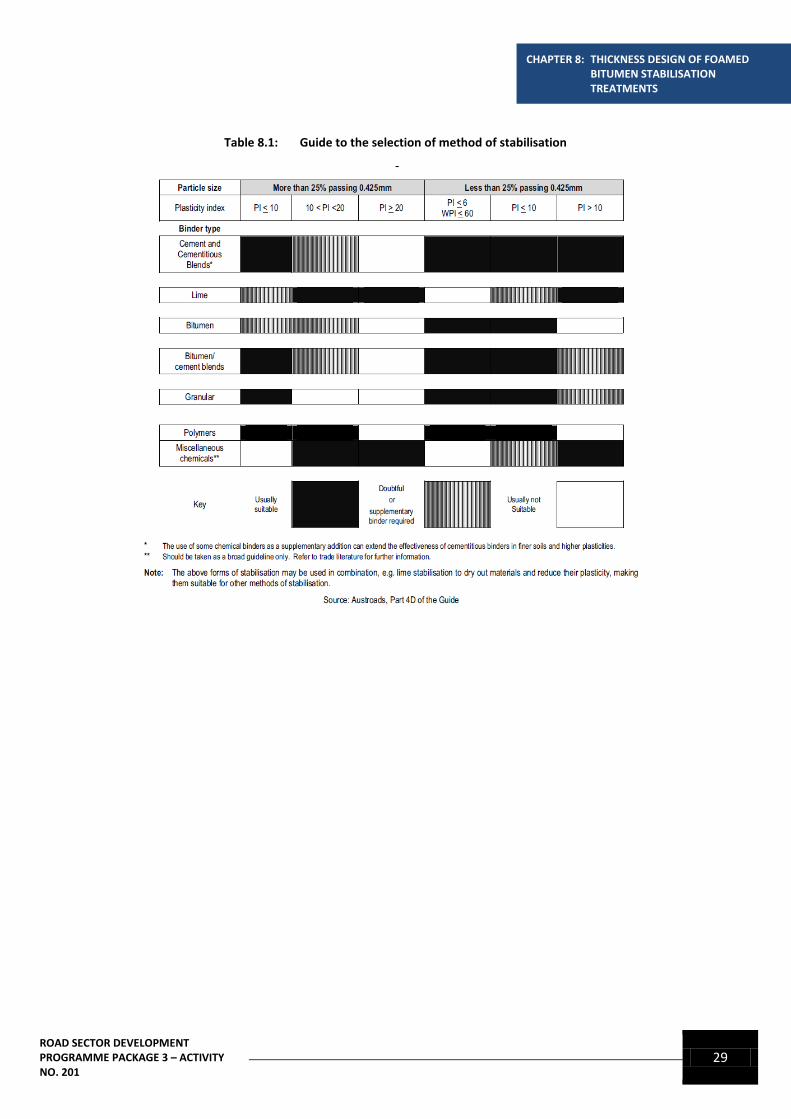
In assessing the suitability of materials for foamed bitumen stabilisation, the plasticity index (PI) should generally not exceed 10 unless treated with lime, subject to an upper PI limit of 20 (refer to Table 8.1).
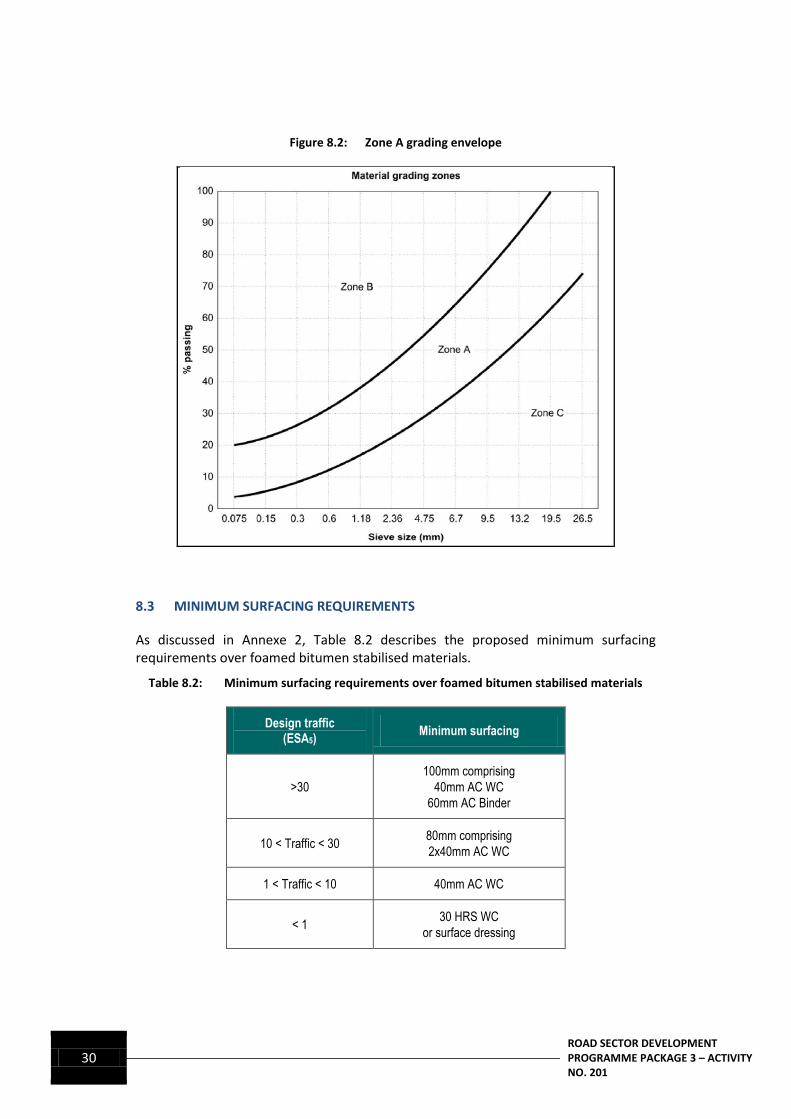
The material should also comply with the Zone A particle size distribution shown in Figure 8.2.
ROAD SECTOR DEVELOPMENT PROGRAMME PACKAGE 3 – ACTIVITY NO. 201
29
CHAPTER 8: THICKNESS DESIGN OF FOAMED BITUMEN STABILISATION TREATMENTS
Table 8.1: Guide to the selection of method of stabilisation
30 ROAD SECTOR DEVELOPMENT
PROGRAMME PACKAGE 3 – ACTIVITY NO. 201
Figure 8.2: Zone A grading envelope
8.3 MINIMUM SURFACING REQUIREMENTS
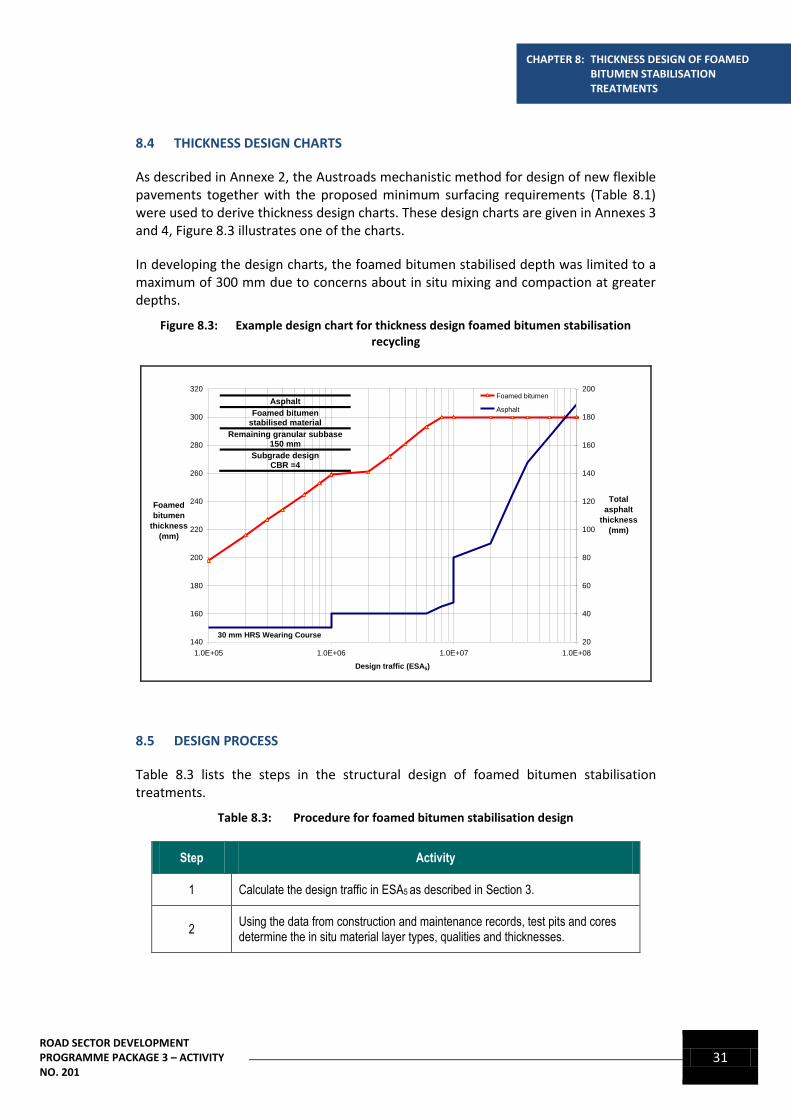
As discussed in Annexe 2, Table 8.2 describes the proposed minimum surfacing requirements over foamed bitumen stabilised materials.
Table 8.2: Minimum surfacing requirements over foamed bitumen stabilised materials
Design traffic (ESA5)
Minimum surfacing
>30
100mm comprising
40mm AC WC
60mm AC Binder
10 < Traffic < 30 80mm comprising
2x40mm AC WC
1 < Traffic < 10 40mm AC WC
< 1 30 HRS WC
or surface dressing
ROAD SECTOR DEVELOPMENT PROGRAMME PACKAGE 3 – ACTIVITY NO. 201
31
CHAPTER 8: THICKNESS DESIGN OF FOAMED BITUMEN STABILISATION TREATMENTS
8.4 THICKNESS DESIGN CHARTS
As described in Annexe 2, the Austroads mechanistic method for design of new flexible pavements together with the proposed minimum surfacing requirements (Table 8.1) were used to derive thickness design charts. These design charts are given in Annexes 3 and 4, Figure 8.3 illustrates one of the charts.
In developing the design charts, the foamed bitumen stabilised depth was limited to a maximum of 300 mm due to concerns about in situ mixing and compaction at greater depths.
Figure 8.3: Example design chart for thickness design foamed bitumen stabilisation recycling
8.5 DESIGN PROCESS
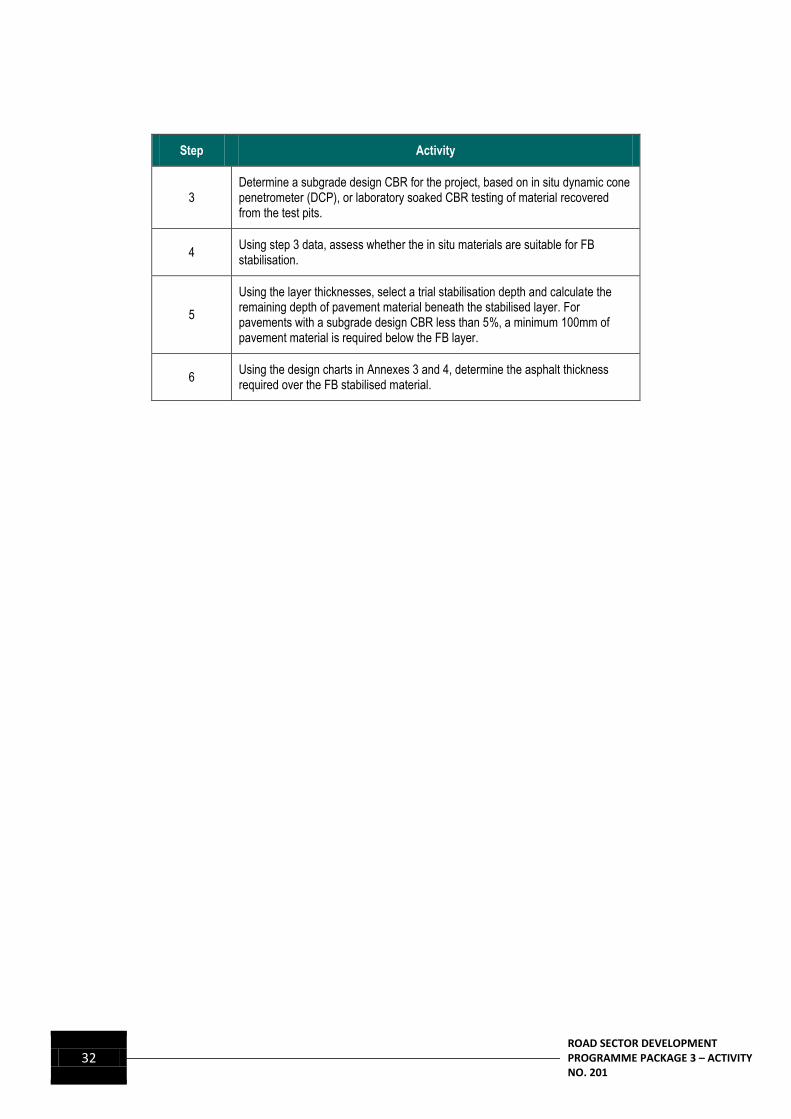
Table 8.3 lists the steps in the structural design of foamed bitumen stabilisation treatments.
Table 8.3: Procedure for foamed bitumen stabilisation design
Step Activity
1 Calculate the design traffic in ESA5 as described in Section 3.
2 Using the data from construction and maintenance records, test pits and cores determine the in situ material layer types, qualities and thicknesses.
140
160
180
200
220
240
260
280
300
320
1.0E+05 1.0E+06 1.0E+07 1.0E+08
Design traffic (ESA5)
Foamed
bitumen
thickness
(mm)
20
40
60
80
100
120
140
160
180
200
Total
asphalt
thickness
(mm)
Foamed bitumen
Asphalt
30 mm HRS Wearing Course
Asphalt
Foamed bitumen stabilised material
Remaining granular subbase 150 mm
Subgrade design CBR =4
32 ROAD SECTOR DEVELOPMENT
PROGRAMME PACKAGE 3 – ACTIVITY NO. 201
Step Activity
3 Determine a subgrade design CBR for the project, based on in situ dynamic cone penetrometer (DCP), or laboratory soaked CBR testing of material recovered from the test pits.
4 Using step 3 data, assess whether the in situ materials are suitable for FB stabilisation.
5
Using the layer thicknesses, select a trial stabilisation depth and calculate the remaining depth of pavement material beneath the stabilised layer. For pavements with a subgrade design CBR less than 5%, a minimum 100mm of pavement material is required below the FB layer.
6 Using the design charts in Annexes 3 and 4, determine the asphalt thickness required over the FB stabilised material.
ROAD SECTOR DEVELOPMENT PROGRAMME PACKAGE 3 – ACTIVITY NO. 201
33
CHAPTER 9: DESIGN OF CEMENT STABILISATION TREATMENTS
CHAPTER 9: DESIGN OF CEMENT STABILISATION TREATMENTS
9.1 MATERIALS SUITABLE FOR CEMENT STABILISATION
In Indonesia, cement stabilisation of pavement materials is commonly applied to recycle existing asphalt and granular base materials.
In assessing the suitability of materials for stabilisation, the PI should generally not exceed 10 unless treated with lime, subject to an upper PI limit of 20 (refer to Table 8.1).
The material should also comply with the Zone A particle size distribution shown in Figure 8.2.
The thickness design charts are suitable for use with stabilised materials with a minimum unconfined compressive strength of 2 Megapascal (MPa) at 28 days. Generally 3 percent by mass of Portland cement is suitable.
9.2 MINIMUM SURFACING REQUIREMENTS
Surface cracking is common when cement treated bases are used with thin bituminous surfacing, unless slow setting cementitious blends (lime, slag, fly-ash) are used.
As quick-setting Portland cement is commonly used in roadworks in Indonesia, the use of cement treated bases is not recommended as early fatigue cracking occurs under the very high axle loads leading to high pavement maintenance costs.
It is recommended that cement stabilisation be limited to the provision of cement treated sub-base (CTSB) with a minimum asphalt surfacing thickness of 175mm (adapted from Austroads Guide, 2008).
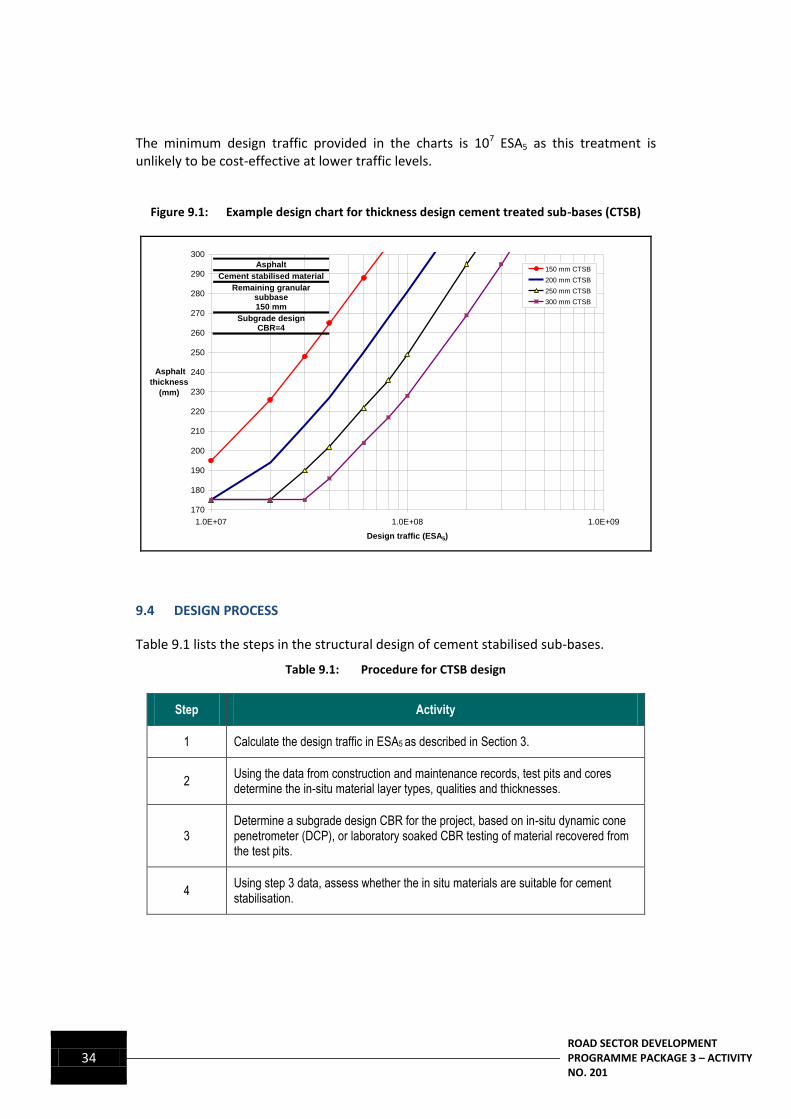
9.3 THICKNESS DESIGN CHARTS
The Austroads mechanistic method for design of new flexible pavements, together with the proposed minimum surfacing of 175mm asphalt, were used to derive thickness design charts. These design charts are given in Annexe 5; Figure 9.1 illustrates one of the charts.
In developing the design charts, the cement stabilised depth was limited to a maximum of 300mm due to concerns about in situ mixing and compaction at greater depths.
34 ROAD SECTOR DEVELOPMENT
PROGRAMME PACKAGE 3 – ACTIVITY NO. 201
The minimum design traffic provided in the charts is 107 ESA5 as this treatment is unlikely to be cost-effective at lower traffic levels.
Figure 9.1: Example design chart for thickness design cement treated sub-bases (CTSB)
9.4 DESIGN PROCESS
Table 9.1 lists the steps in the structural design of cement stabilised sub-bases.
Table 9.1: Procedure for CTSB design
Step Activity
1 Calculate the design traffic in ESA5 as described in Section 3.
2 Using the data from construction and maintenance records, test pits and cores determine the in-situ material layer types, qualities and thicknesses.
3 Determine a subgrade design CBR for the project, based on in-situ dynamic cone penetrometer (DCP), or laboratory soaked CBR testing of material recovered from the test pits.
4 Using step 3 data, assess whether the in situ materials are suitable for cement stabilisation.
170
180
190
200
210
220
230
240
250
260
270
280
290
300
1.0E+07 1.0E+08 1.0E+09
Design traffic (ESA5)
Asphalt
thickness
(mm)
150 mm CTSB
200 mm CTSB
250 mm CTSB
300 mm CTSB
Asphalt
Cement stabilised material
Remaining granular subbase 150 mm
Subgrade design CBR=4

ROAD SECTOR DEVELOPMENT PROGRAMME PACKAGE 3 – ACTIVITY NO. 201
35
CHAPTER 9: DESIGN OF CEMENT STABILISATION TREATMENTS
Step Activity
5
Using the layer thicknesses, select a trial stabilisation depth and calculate the remaining depth of pavement material beneath the stabilised layer. For pavements with a subgrade design CBR less than 5%, a minimum 100mm of pavement material is required below the stabilised layer.
6 Using the design charts in Annexe 5, determine the asphalt thickness required over the FB stabilised material.
36 ROAD SECTOR DEVELOPMENT
PROGRAMME PACKAGE 3 – ACTIVITY NO. 201
CHAPTER 10: CONSTRUCTION ISSUES AND PAVEMENT PERFORMANCE
A major improvement in construction quality standards is needed for all roadworks including rehabilitation works. It is not possible to adequately compensate for poor construction quality by pavement design adjustments.
10.1 PREPARATION OF EXISTING PAVEMENTS FOR OVERLAY
Thorough preparation is essential. Pothole repairs, heavy patching, sealing of wide cracks, milling of ruts and severely cracked areas and repair of edge breaks must all be completed and accepted by the Engineer or Project Manager before the overlay is commenced.
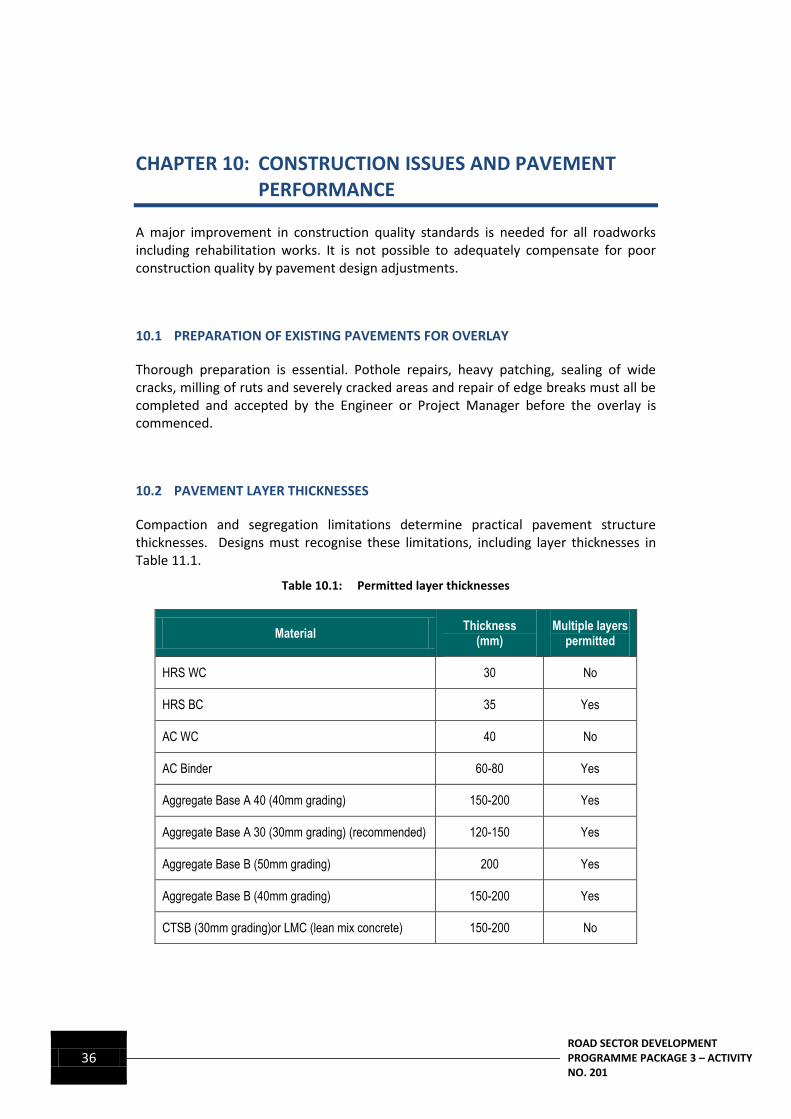
10.2 PAVEMENT LAYER THICKNESSES
Compaction and segregation limitations determine practical pavement structure thicknesses. Designs must recognise these limitations, including layer thicknesses in Table 11.1.
Table 10.1: Permitted layer thicknesses
Material Thickness
(mm) Multiple layers
permitted
HRS WC 30 No
HRS BC 35 Yes
AC WC 40 No
AC Binder 60-80 Yes
Aggregate Base A 40 (40mm grading) 150-200 Yes
Aggregate Base A 30 (30mm grading) (recommended) 120-150 Yes
Aggregate Base B (50mm grading) 200 Yes
Aggregate Base B (40mm grading) 150-200 Yes
CTSB (30mm grading)or LMC (lean mix concrete) 150-200 No
ROAD SECTOR DEVELOPMENT PROGRAMME PACKAGE 3 – ACTIVITY NO. 201
37
CHAPTER 10: CONSTRUCTION ISSUES AND PAVEMENT PERFORMANCE
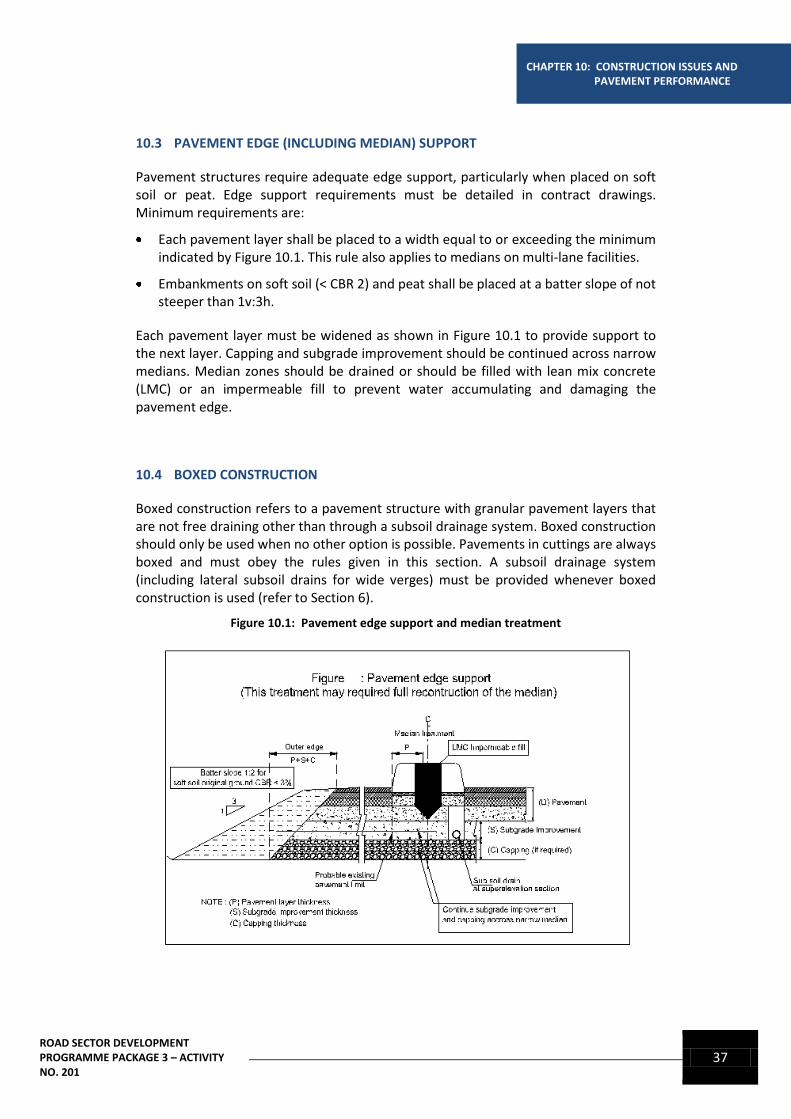
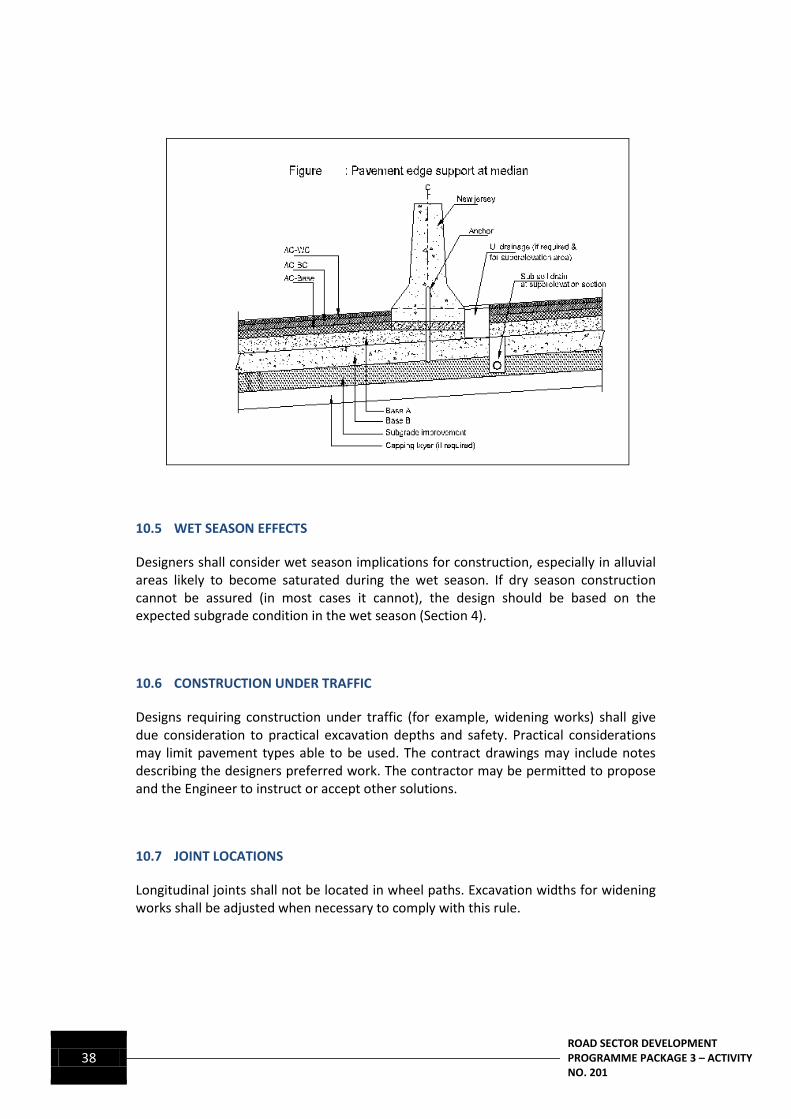
10.3 PAVEMENT EDGE (INCLUDING MEDIAN) SUPPORT
Pavement structures require adequate edge support, particularly when placed on soft soil or peat. Edge support requirements must be detailed in contract drawings. Minimum requirements are:
Each pavement layer shall be placed to a width equal to or exceeding the minimum indicated by Figure 10.1. This rule also applies to medians on multi-lane facilities.
Embankments on soft soil (< CBR 2) and peat shall be placed at a batter slope of not steeper than 1v:3h.
Each pavement layer must be widened as shown in Figure 10.1 to provide support to the next layer. Capping and subgrade improvement should be continued across narrow medians. Median zones should be drained or should be filled with lean mix concrete (LMC) or an impermeable fill to prevent water accumulating and damaging the pavement edge.
10.4 BOXED CONSTRUCTION
Boxed construction refers to a pavement structure with granular pavement layers that are not free draining other than through a subsoil drainage system. Boxed construction should only be used when no other option is possible. Pavements in cuttings are always boxed and must obey the rules given in this section. A subsoil drainage system (including lateral subsoil drains for wide verges) must be provided whenever boxed construction is used (refer to Section 6).
Figure 10.1: Pavement edge support and median treatment
38 ROAD SECTOR DEVELOPMENT
PROGRAMME PACKAGE 3 – ACTIVITY NO. 201
10.5 WET SEASON EFFECTS
Designers shall consider wet season implications for construction, especially in alluvial areas likely to become saturated during the wet season. If dry season construction cannot be assured (in most cases it cannot), the design should be based on the expected subgrade condition in the wet season (Section 4).
10.6 CONSTRUCTION UNDER TRAFFIC
Designs requiring construction under traffic (for example, widening works) shall give due consideration to practical excavation depths and safety. Practical considerations may limit pavement types able to be used. The contract drawings may include notes describing the designers preferred work. The contractor may be permitted to propose and the Engineer to instruct or accept other solutions.
10.7 JOINT LOCATIONS
Longitudinal joints shall not be located in wheel paths. Excavation widths for widening works shall be adjusted when necessary to comply with this rule.
ROAD SECTOR DEVELOPMENT PROGRAMME PACKAGE 3 – ACTIVITY NO. 201
39
CHAPTER 10: CONSTRUCTION ISSUES AND PAVEMENT PERFORMANCE
10.8 CONSTRUCTION SEQUENCE FOR RECYCLING
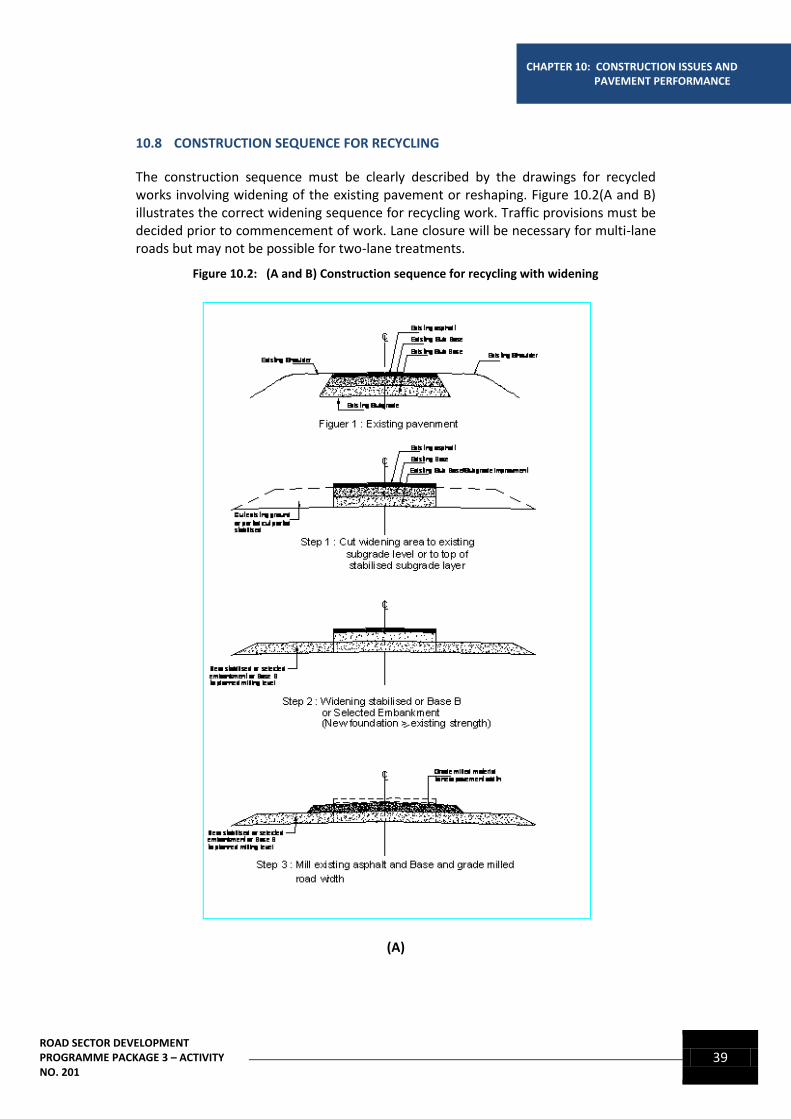
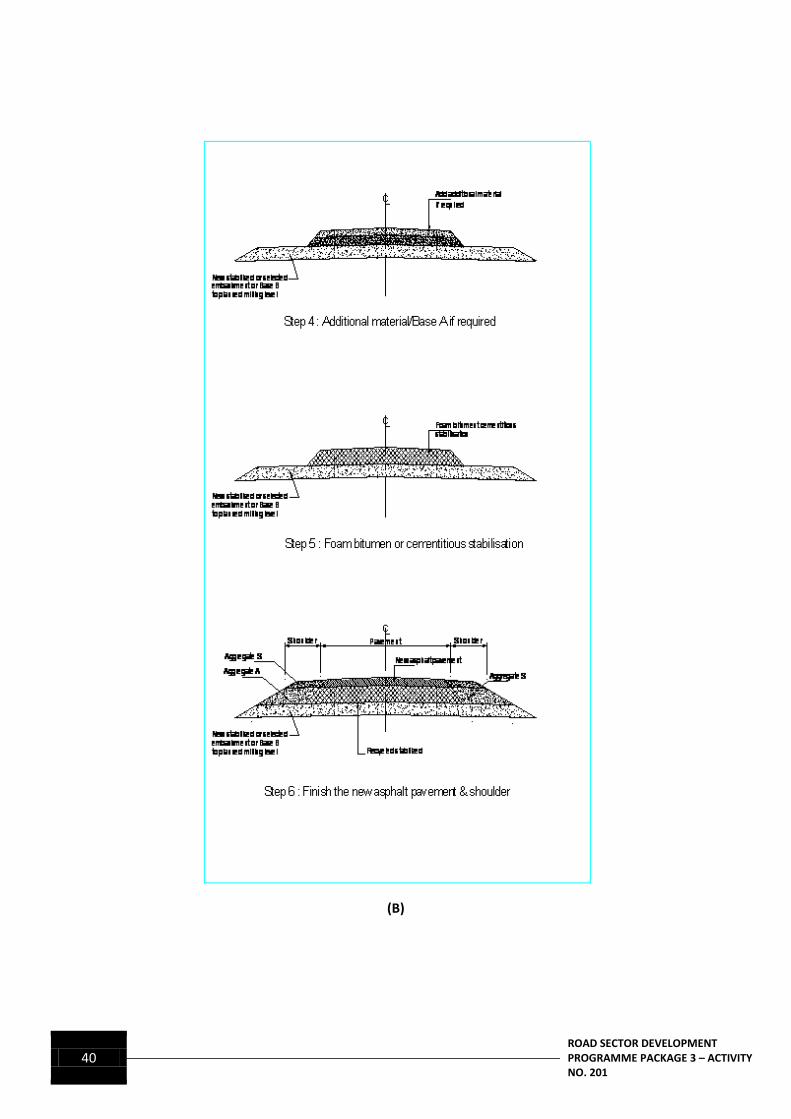
The construction sequence must be clearly described by the drawings for recycled works involving widening of the existing pavement or reshaping. Figure 10.2(A and B) illustrates the correct widening sequence for recycling work. Traffic provisions must be decided prior to commencement of work. Lane closure will be necessary for multi-lane roads but may not be possible for two-lane treatments.
Figure 10.2: (A and B) Construction sequence for recycling with widening
(A)
40 ROAD SECTOR DEVELOPMENT
PROGRAMME PACKAGE 3 – ACTIVITY NO. 201
(B)
ROAD SECTOR DEVELOPMENT PROGRAMME PACKAGE 3 – ACTIVITY NO. 201
41
ANNEXE 1: COMMERCIAL FLEET VDF CALCULATOR
ANNEXE 1: COMMERCIAL FLEET VDF CALCULATOR
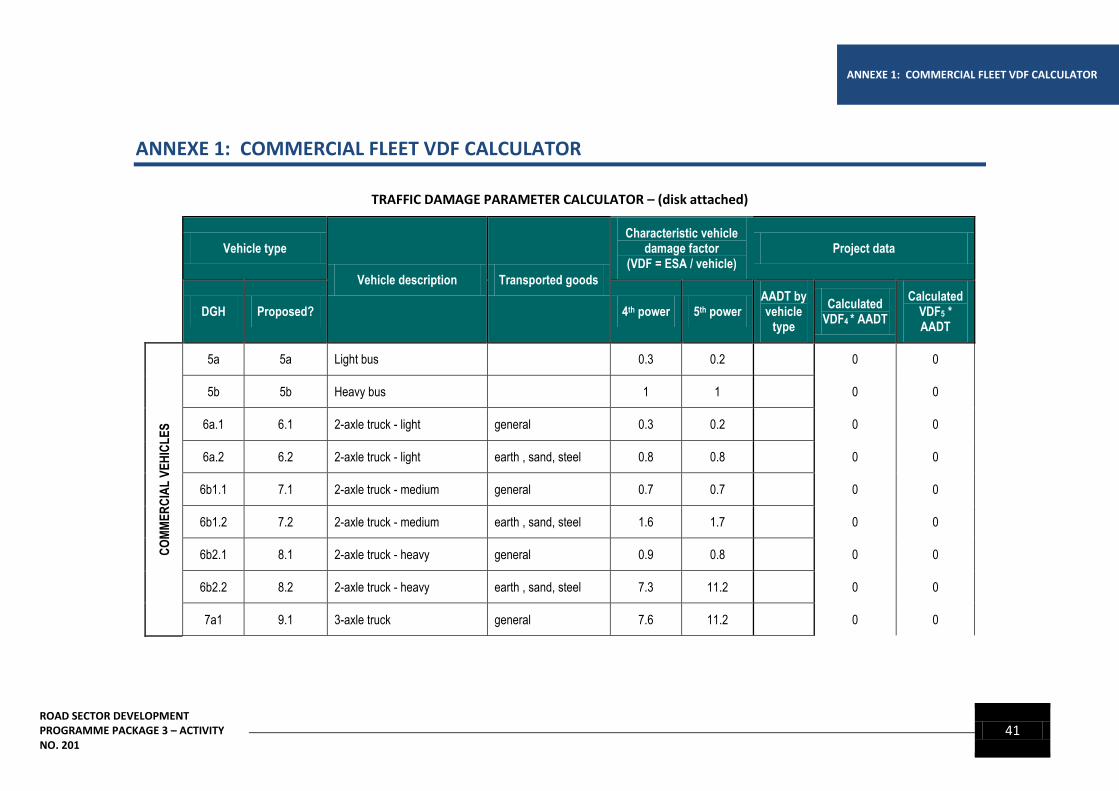
TRAFFIC DAMAGE PARAMETER CALCULATOR – (disk attached)
Vehicle type
Vehicle description Transported goods
Characteristic vehicle damage factor
(VDF = ESA / vehicle) Project data
DGH Proposed? 4th power 5th power
AADT by vehicle
type
Calculated VDF4 * AADT
Calculated VDF5 * AADT
CO
MM
ER
CIA
L V
EH
ICL
ES
5a 5a Light bus 0.3 0.2 0 0
5b 5b Heavy bus 1 1 0 0
6a.1 6.1 2-axle truck - light general 0.3 0.2 0 0
6a.2 6.2 2-axle truck - light earth , sand, steel 0.8 0.8 0 0
6b1.1 7.1 2-axle truck - medium general 0.7 0.7 0 0
6b1.2 7.2 2-axle truck - medium earth , sand, steel 1.6 1.7 0 0
6b2.1 8.1 2-axle truck - heavy general 0.9 0.8 0 0
6b2.2 8.2 2-axle truck - heavy earth , sand, steel 7.3 11.2 0 0
7a1 9.1 3-axle truck general 7.6 11.2 0 0
42 ROAD SECTOR DEVELOPMENT
PROGRAMME PACKAGE 3 – ACTIVITY NO. 201
Vehicle type
Vehicle description Transported goods
Characteristic vehicle damage factor
(VDF = ESA / vehicle) Project data
DGH Proposed? 4th power 5th power
AADT by vehicle
type
Calculated VDF4 * AADT
Calculated VDF5 * AADT
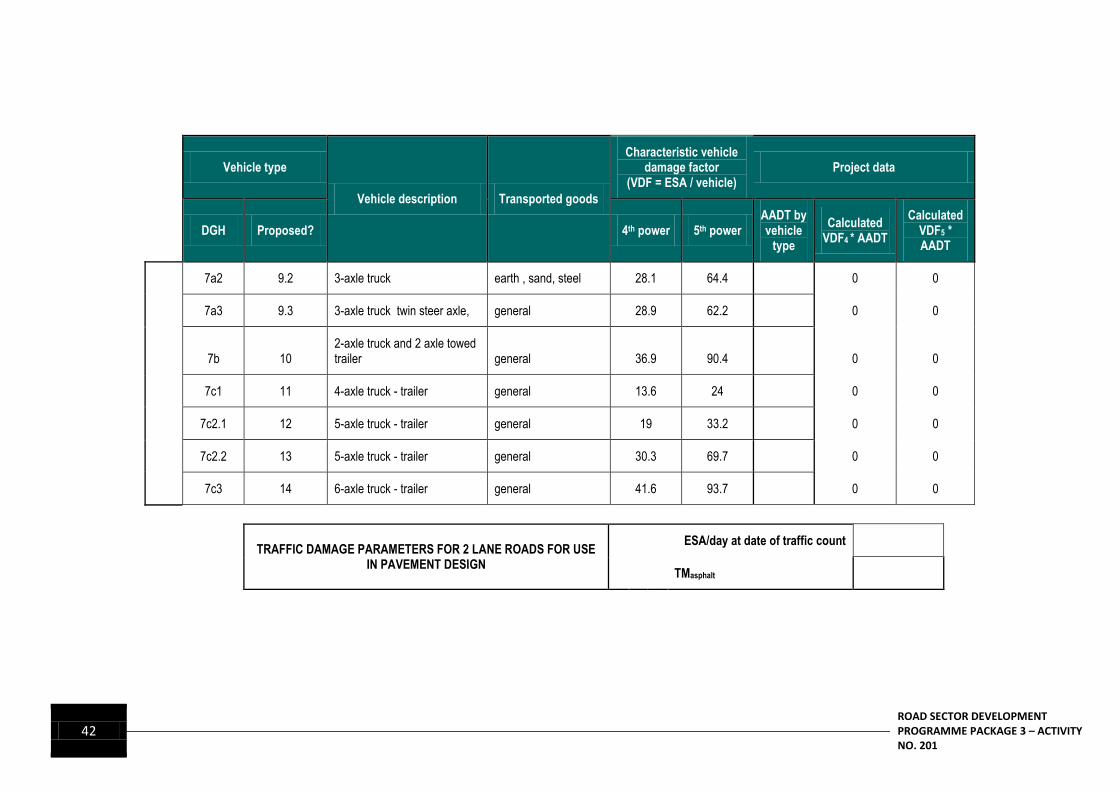
7a2 9.2 3-axle truck earth , sand, steel 28.1 64.4 0 0
7a3 9.3 3-axle truck twin steer axle, general 28.9 62.2 0 0
7b 10 2-axle truck and 2 axle towed trailer general 36.9 90.4 0 0
7c1 11 4-axle truck - trailer general 13.6 24 0 0
7c2.1 12 5-axle truck - trailer general 19 33.2 0 0
7c2.2 13 5-axle truck - trailer general 30.3 69.7 0 0
7c3 14 6-axle truck - trailer general 41.6 93.7 0 0
TRAFFIC DAMAGE PARAMETERS FOR 2 LANE ROADS FOR USE IN PAVEMENT DESIGN
ESA/day at date of traffic count
TMasphalt
ROAD SECTOR DEVELOPMENT PROGRAMME PACKAGE 3 – ACTIVITY NO. 201
43
ANNEXE 2: DEVELOPMENT OF THE THICKNESS DESIGN METHOD FOR FOAMED BITUMEN STABILISATION
ANNEXE 2: DEVELOPMENT OF THE THICKNESS DESIGN METHOD FOR FOAMED BITUMEN STABILISATION
Two load associated distress modes that have been identified for foamed bitumen stabilised treatment are (Jones and Ramanujam 2008):
Pavement rutting and shape loss of pavement layers and subgrade
Fatigue cracking of the foamed bitumen stabilised layer
Fatigue cracking of overlaying asphalt surfacings layers
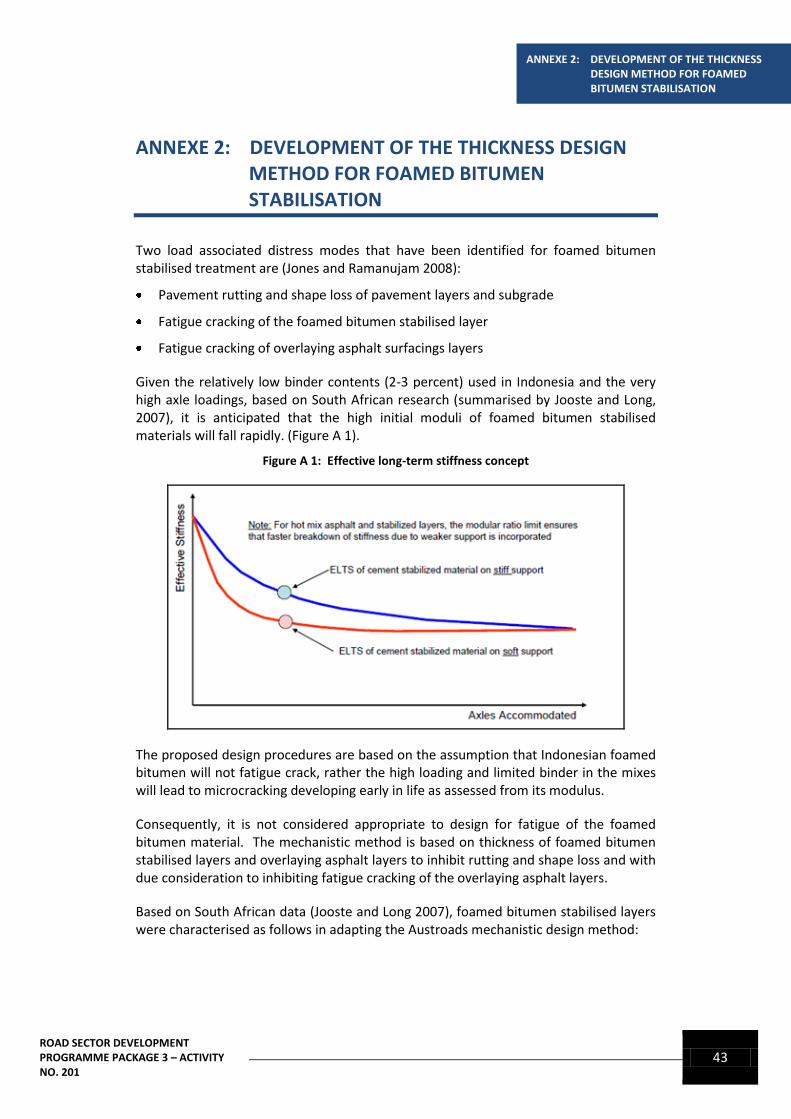
Given the relatively low binder contents (2-3 percent) used in Indonesia and the very high axle loadings, based on South African research (summarised by Jooste and Long, 2007), it is anticipated that the high initial moduli of foamed bitumen stabilised materials will fall rapidly. (Figure A 1).
Figure A 1: Effective long-term stiffness concept
The proposed design procedures are based on the assumption that Indonesian foamed bitumen will not fatigue crack, rather the high loading and limited binder in the mixes will lead to microcracking developing early in life as assessed from its modulus.
Consequently, it is not considered appropriate to design for fatigue of the foamed bitumen material. The mechanistic method is based on thickness of foamed bitumen stabilised layers and overlaying asphalt layers to inhibit rutting and shape loss and with due consideration to inhibiting fatigue cracking of the overlaying asphalt layers.
Based on South African data (Jooste and Long 2007), foamed bitumen stabilised layers were characterised as follows in adapting the Austroads mechanistic design method:
44 ROAD SECTOR DEVELOPMENT
PROGRAMME PACKAGE 3 – ACTIVITY NO. 201
The effective long-term modulus of the foamed stabilised material was 600 MPa, higher than moduli for granular materials and less than asphalt moduli.
The bottom 100mm of the foamed bitumen stabilised material was limited to not more than about twice the modulus of the underlying material (adapted from the modulus ratio concept discussed by Jooste and Long, 2007).
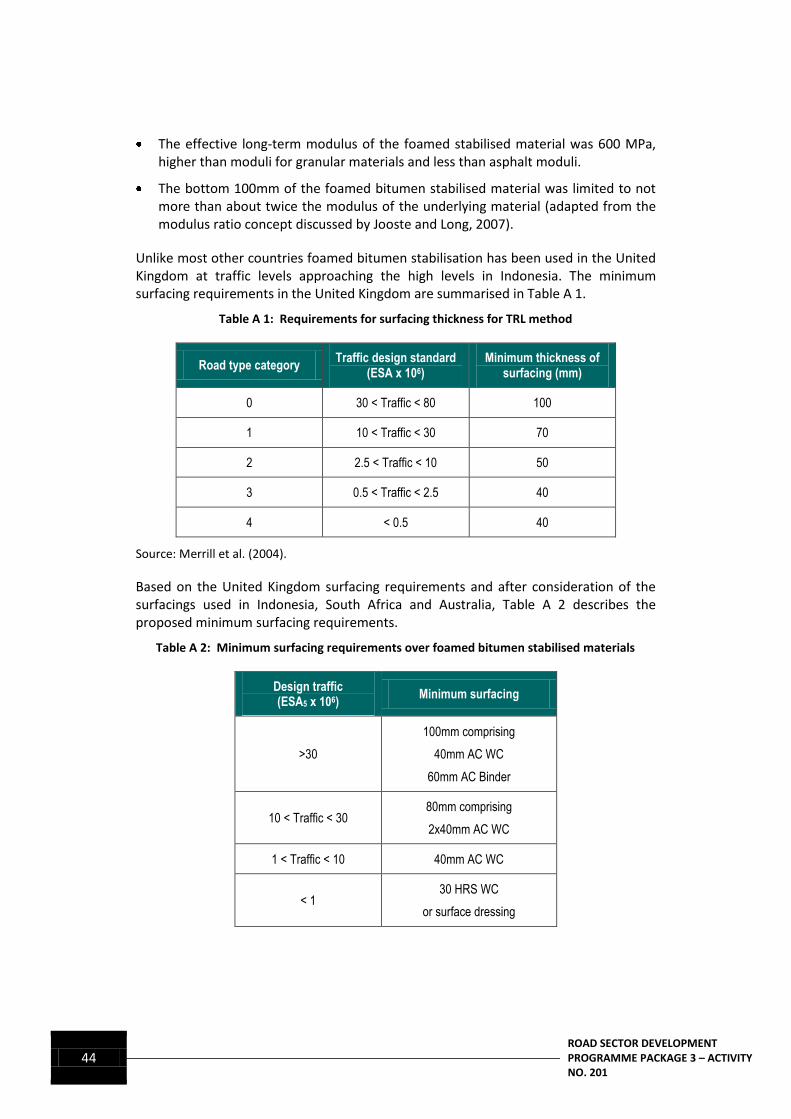
Unlike most other countries foamed bitumen stabilisation has been used in the United Kingdom at traffic levels approaching the high levels in Indonesia. The minimum surfacing requirements in the United Kingdom are summarised in Table A 1.
Table A 1: Requirements for surfacing thickness for TRL method
Road type category Traffic design standard
(ESA x 106) Minimum thickness of
surfacing (mm)
0 30 < Traffic < 80 100
1 10 < Traffic < 30 70
2 2.5 < Traffic < 10 50
3 0.5 < Traffic < 2.5 40
4 < 0.5 40
Source: Merrill et al. (2004).
Based on the United Kingdom surfacing requirements and after consideration of the surfacings used in Indonesia, South Africa and Australia, Table A 2 describes the proposed minimum surfacing requirements.
Table A 2: Minimum surfacing requirements over foamed bitumen stabilised materials
Design traffic (ESA5 x 106)
Minimum surfacing
>30
100mm comprising
40mm AC WC
60mm AC Binder
10 < Traffic < 30 80mm comprising
2x40mm AC WC
1 < Traffic < 10 40mm AC WC
< 1 30 HRS WC
or surface dressing
ROAD SECTOR DEVELOPMENT PROGRAMME PACKAGE 3 – ACTIVITY NO. 201
45
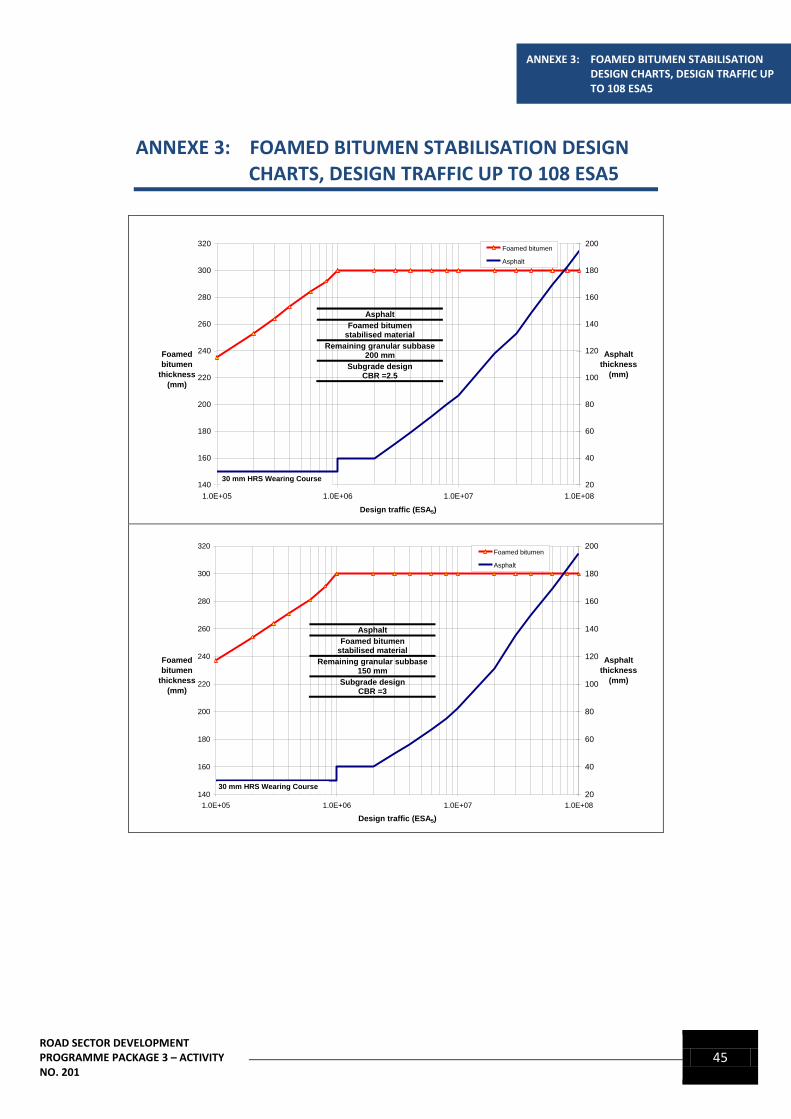
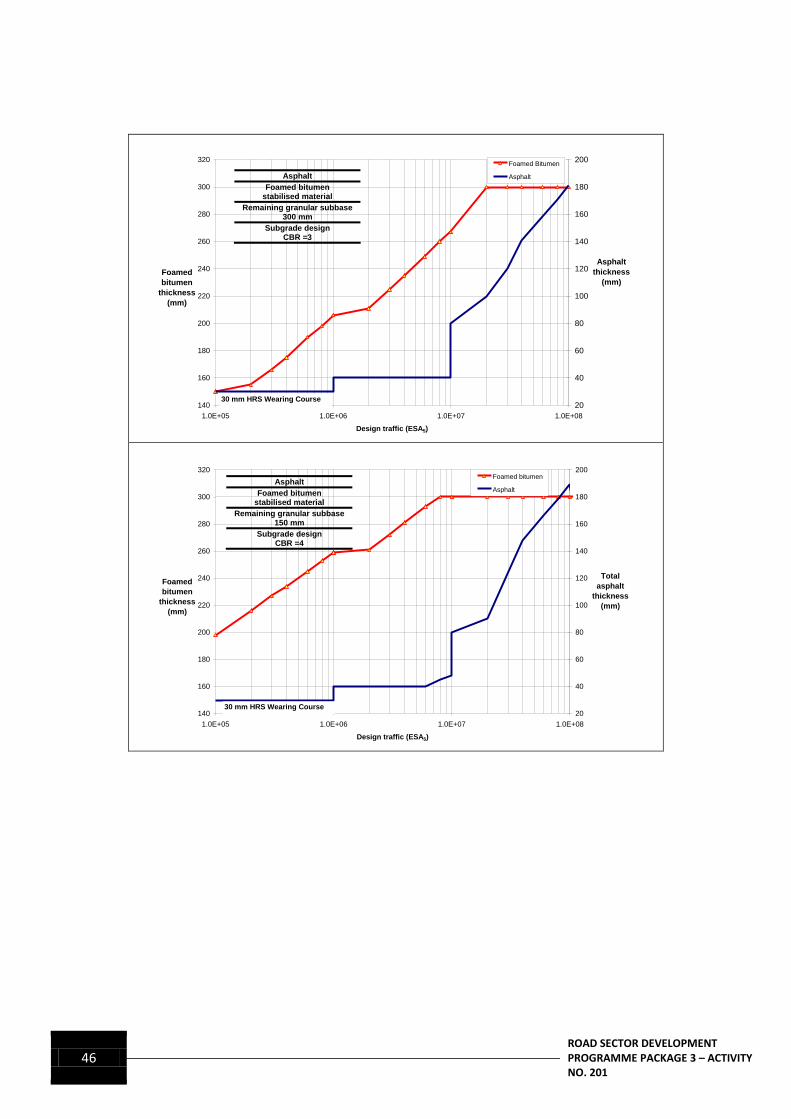
ANNEXE 3: FOAMED BITUMEN STABILISATION DESIGN CHARTS, DESIGN TRAFFIC UP TO 108 ESA5
ANNEXE 3: FOAMED BITUMEN STABILISATION DESIGN CHARTS, DESIGN TRAFFIC UP TO 108 ESA5
140
160
180
200
220
240
260
280
300
320
1.0E+05 1.0E+06 1.0E+07 1.0E+08
Design traffic (ESA5)
Foamed
bitumen
thickness
(mm)
20
40
60
80
100
120
140
160
180
200
Asphalt
thickness
(mm)
Foamed bitumen
Asphalt
Asphalt
Foamed bitumen stabilised material
Remaining granular subbase 200 mm
Subgrade design CBR =2.5
30 mm HRS Wearing Course
140
160
180
200
220
240
260
280
300
320
1.0E+05 1.0E+06 1.0E+07 1.0E+08
Design traffic (ESA5)
Foamed
bitumen
thickness
(mm)
20
40
60
80
100
120
140
160
180
200
Asphalt
thickness
(mm)
Foamed bitumen
Asphalt
Asphalt
Foamed bitumen stabilised material
Remaining granular subbase 150 mm
Subgrade design CBR =3
30 mm HRS Wearing Course
46 ROAD SECTOR DEVELOPMENT
PROGRAMME PACKAGE 3 – ACTIVITY NO. 201
140
160
180
200
220
240
260
280
300
320
1.0E+05 1.0E+06 1.0E+07 1.0E+08
Design traffic (ESA5)
Foamed
bitumen
thickness
(mm)
20
40
60
80
100
120
140
160
180
200
Asphalt
thickness
(mm)
Foamed Bitumen
AsphaltAsphalt
Foamed bitumen stabilised material
Remaining granular subbase 300 mm
Subgrade design CBR =3
30 mm HRS Wearing Course
140
160
180
200
220
240
260
280
300
320
1.0E+05 1.0E+06 1.0E+07 1.0E+08
Design traffic (ESA5)
Foamed
bitumen
thickness
(mm)
20
40
60
80
100
120
140
160
180
200
Total
asphalt
thickness
(mm)
Foamed bitumen
Asphalt
30 mm HRS Wearing Course
Asphalt
Foamed bitumen stabilised material
Remaining granular subbase 150 mm
Subgrade design CBR =4
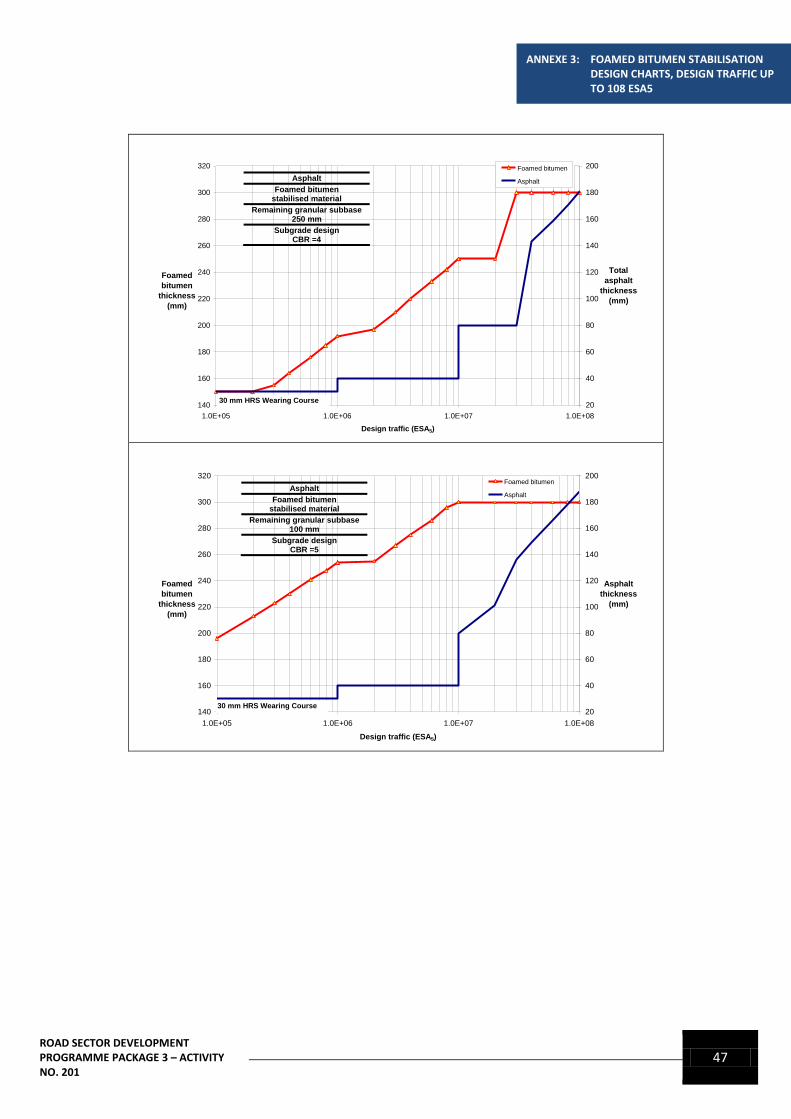
ROAD SECTOR DEVELOPMENT PROGRAMME PACKAGE 3 – ACTIVITY NO. 201
47
ANNEXE 3: FOAMED BITUMEN STABILISATION DESIGN CHARTS, DESIGN TRAFFIC UP TO 108 ESA5
140
160
180
200
220
240
260
280
300
320
1.0E+05 1.0E+06 1.0E+07 1.0E+08
Design traffic (ESA5)
Foamed
bitumen
thickness
(mm)
20
40
60
80
100
120
140
160
180
200
Total
asphalt
thickness
(mm)
Foamed bitumen
Asphalt
30 mm HRS Wearing Course
Asphalt
Foamed bitumen stabilised material
Remaining granular subbase 250 mm
Subgrade design CBR =4
140
160
180
200
220
240
260
280
300
320
1.0E+05 1.0E+06 1.0E+07 1.0E+08
Design traffic (ESA5)
Foamed
bitumen
thickness
(mm)
20
40
60
80
100
120
140
160
180
200
Asphalt
thickness
(mm)
Foamed bitumen
Asphalt
30 mm HRS Wearing Course
Asphalt
Foamed bitumen stabilised material
Remaining granular subbase 100 mm
Subgrade design CBR =5
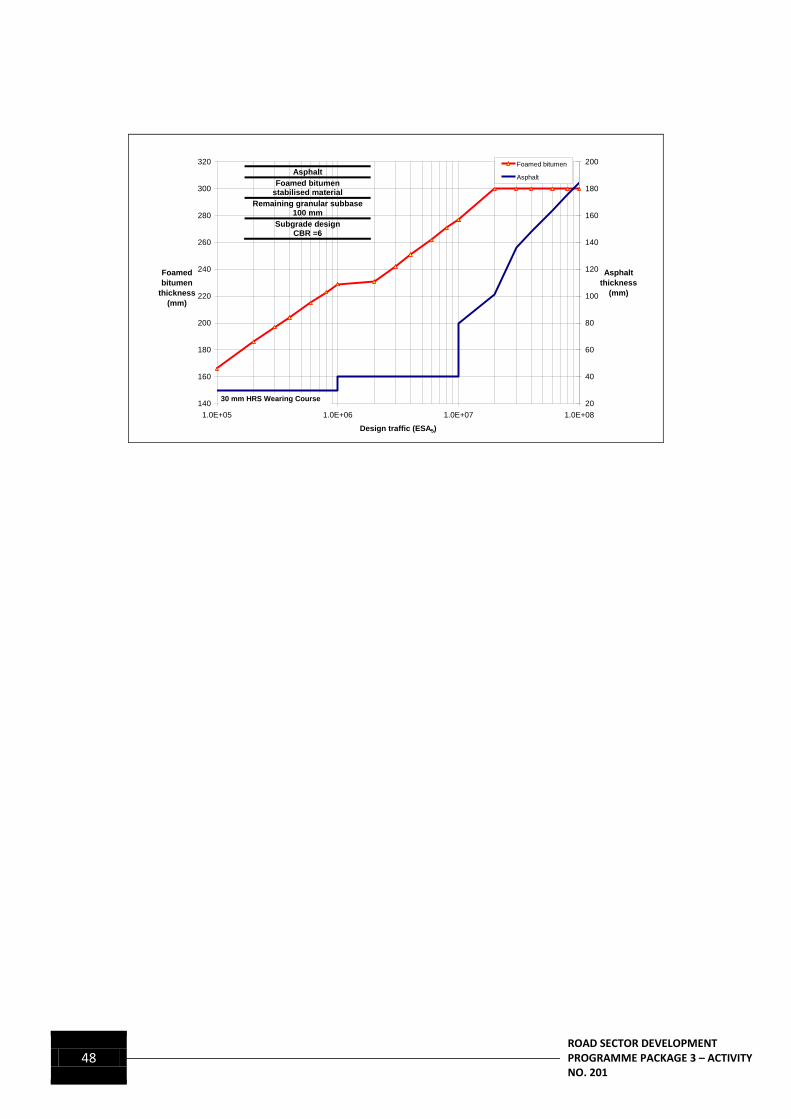
48 ROAD SECTOR DEVELOPMENT
PROGRAMME PACKAGE 3 – ACTIVITY NO. 201
140
160
180
200
220
240
260
280
300
320
1.0E+05 1.0E+06 1.0E+07 1.0E+08
Design traffic (ESA5)
Foamed
bitumen
thickness
(mm)
20
40
60
80
100
120
140
160
180
200
Asphalt
thickness
(mm)
Foamed bitumen
Asphalt
30 mm HRS Wearing Course
Asphalt
Foamed bitumen stabilised material
Remaining granular subbase 100 mm
Subgrade design CBR =6
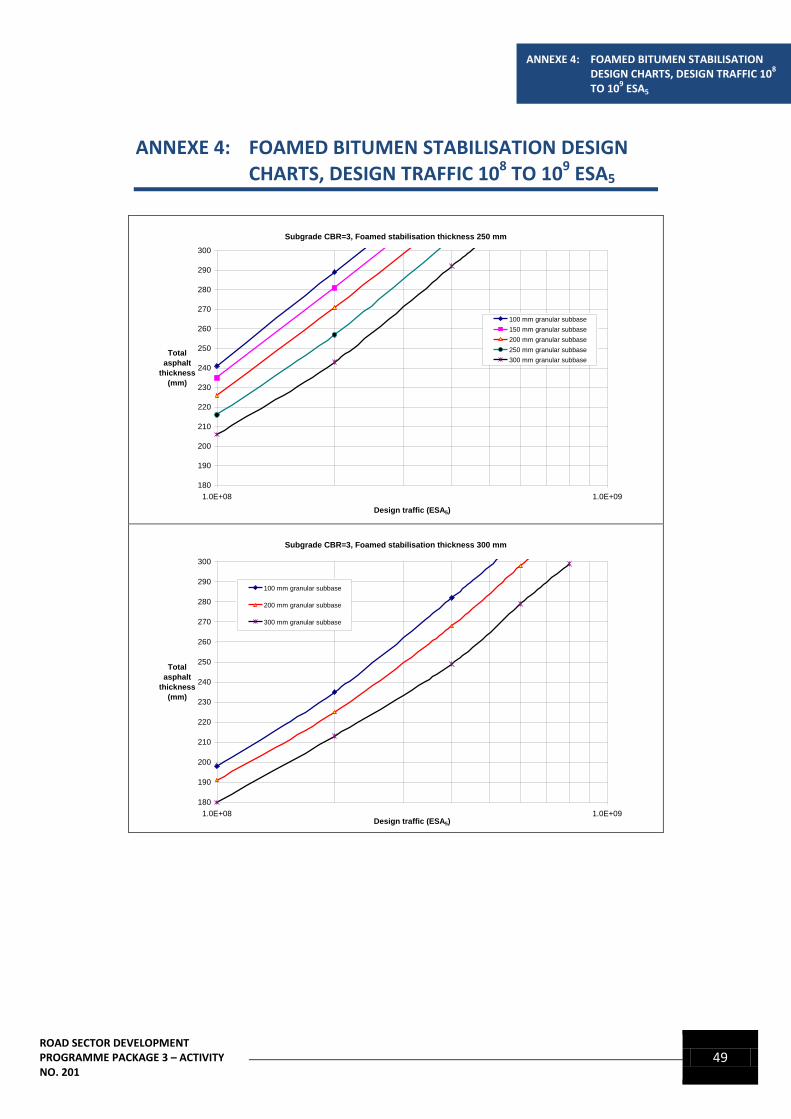
ROAD SECTOR DEVELOPMENT PROGRAMME PACKAGE 3 – ACTIVITY NO. 201
49
ANNEXE 4: FOAMED BITUMEN STABILISATION DESIGN CHARTS, DESIGN TRAFFIC 10
8
TO 109 ESA5
ANNEXE 4: FOAMED BITUMEN STABILISATION DESIGN CHARTS, DESIGN TRAFFIC 108 TO 109 ESA5
Subgrade CBR=3, Foamed stabilisation thickness 250 mm
180
190
200
210
220
230
240
250
260
270
280
290
300
1.0E+08 1.0E+09
Design traffic (ESA5)
Total
asphalt
thickness
(mm)
100 mm granular subbase
150 mm granular subbase
200 mm granular subbase
250 mm granular subbase
300 mm granular subbase
Subgrade CBR=3, Foamed stabilisation thickness 300 mm
180
190
200
210
220
230
240
250
260
270
280
290
300
1.0E+08 1.0E+09Design traffic (ESA5)
Total
asphalt
thickness
(mm)
100 mm granular subbase
200 mm granular subbase
300 mm granular subbase
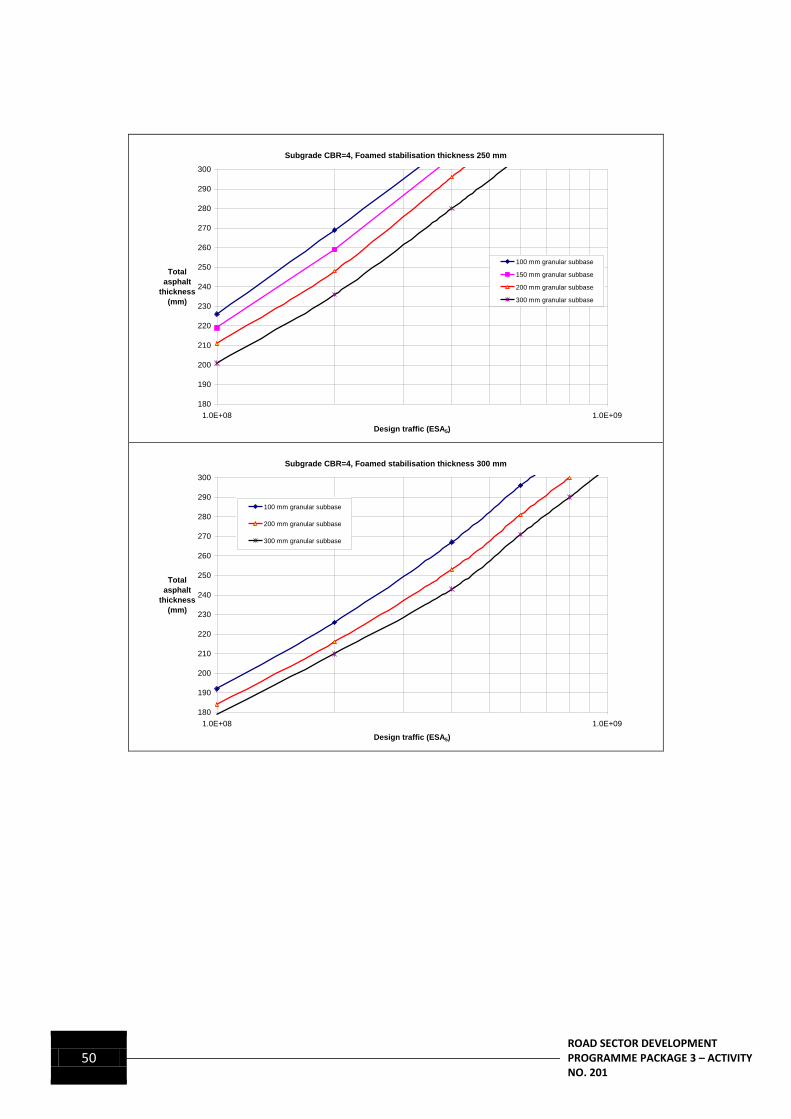
50 ROAD SECTOR DEVELOPMENT
PROGRAMME PACKAGE 3 – ACTIVITY NO. 201
Subgrade CBR=4, Foamed stabilisation thickness 250 mm
180
190
200
210
220
230
240
250
260
270
280
290
300
1.0E+08 1.0E+09
Design traffic (ESA5)
Total
asphalt
thickness
(mm)
100 mm granular subbase
150 mm granular subbase
200 mm granular subbase
300 mm granular subbase
Subgrade CBR=4, Foamed stabilisation thickness 300 mm
180
190
200
210
220
230
240
250
260
270
280
290
300
1.0E+08 1.0E+09
Design traffic (ESA5)
Total
asphalt
thickness
(mm)
100 mm granular subbase
200 mm granular subbase
300 mm granular subbase
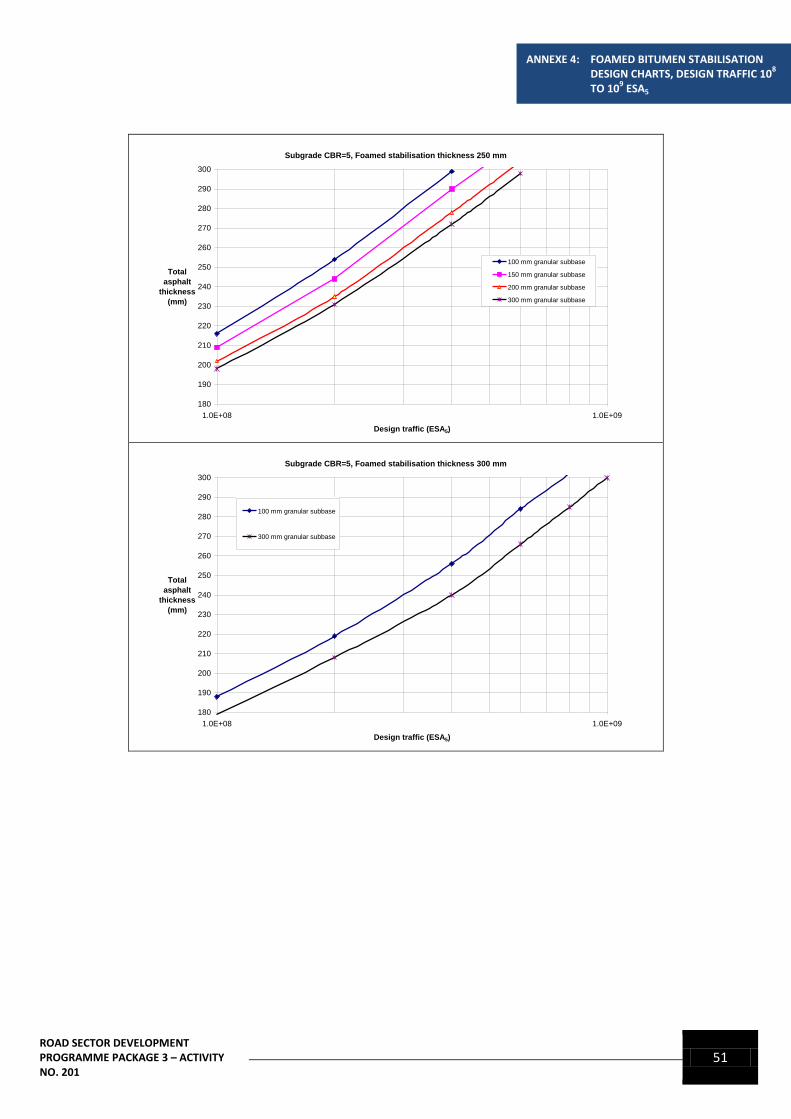
ROAD SECTOR DEVELOPMENT PROGRAMME PACKAGE 3 – ACTIVITY NO. 201
51
ANNEXE 4: FOAMED BITUMEN STABILISATION DESIGN CHARTS, DESIGN TRAFFIC 10
8
TO 109 ESA5
Subgrade CBR=5, Foamed stabilisation thickness 250 mm
180
190
200
210
220
230
240
250
260
270
280
290
300
1.0E+08 1.0E+09
Design traffic (ESA5)
Total
asphalt
thickness
(mm)
100 mm granular subbase
150 mm granular subbase
200 mm granular subbase
300 mm granular subbase
Subgrade CBR=5, Foamed stabilisation thickness 300 mm
180
190
200
210
220
230
240
250
260
270
280
290
300
1.0E+08 1.0E+09
Design traffic (ESA5)
Total
asphalt
thickness
(mm)
100 mm granular subbase
300 mm granular subbase
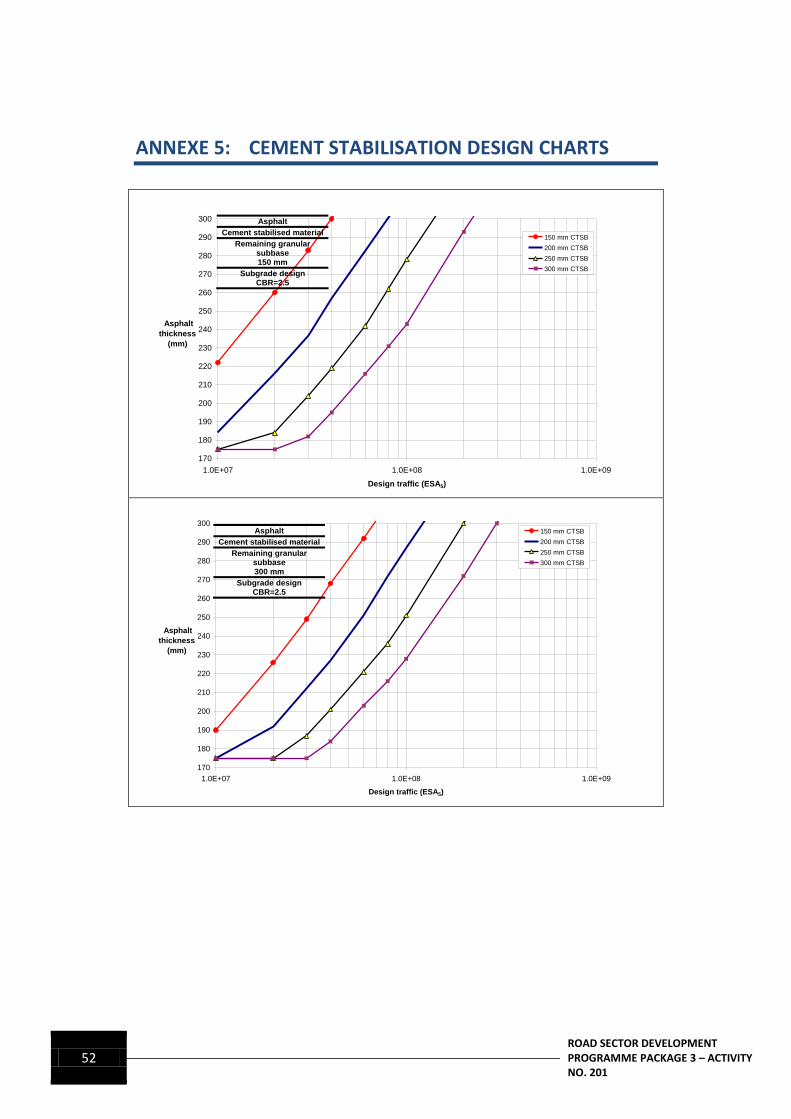
52 ROAD SECTOR DEVELOPMENT
PROGRAMME PACKAGE 3 – ACTIVITY NO. 201
ANNEXE 5: CEMENT STABILISATION DESIGN CHARTS
170
180
190
200
210
220
230
240
250
260
270
280
290
300
1.0E+07 1.0E+08 1.0E+09
Design traffic (ESA5)
Asphalt
thickness
(mm)
150 mm CTSB
200 mm CTSB
250 mm CTSB
300 mm CTSB
Asphalt
Cement stabilised material
Remaining granular subbase 150 mm
Subgrade design CBR=2.5
170
180
190
200
210
220
230
240
250
260
270
280
290
300
1.0E+07 1.0E+08 1.0E+09
Design traffic (ESA5)
Asphalt
thickness
(mm)
150 mm CTSB
200 mm CTSB
250 mm CTSB
300 mm CTSB
Asphalt
Cement stabilised material
Remaining granular subbase 300 mm
Subgrade design CBR=2.5
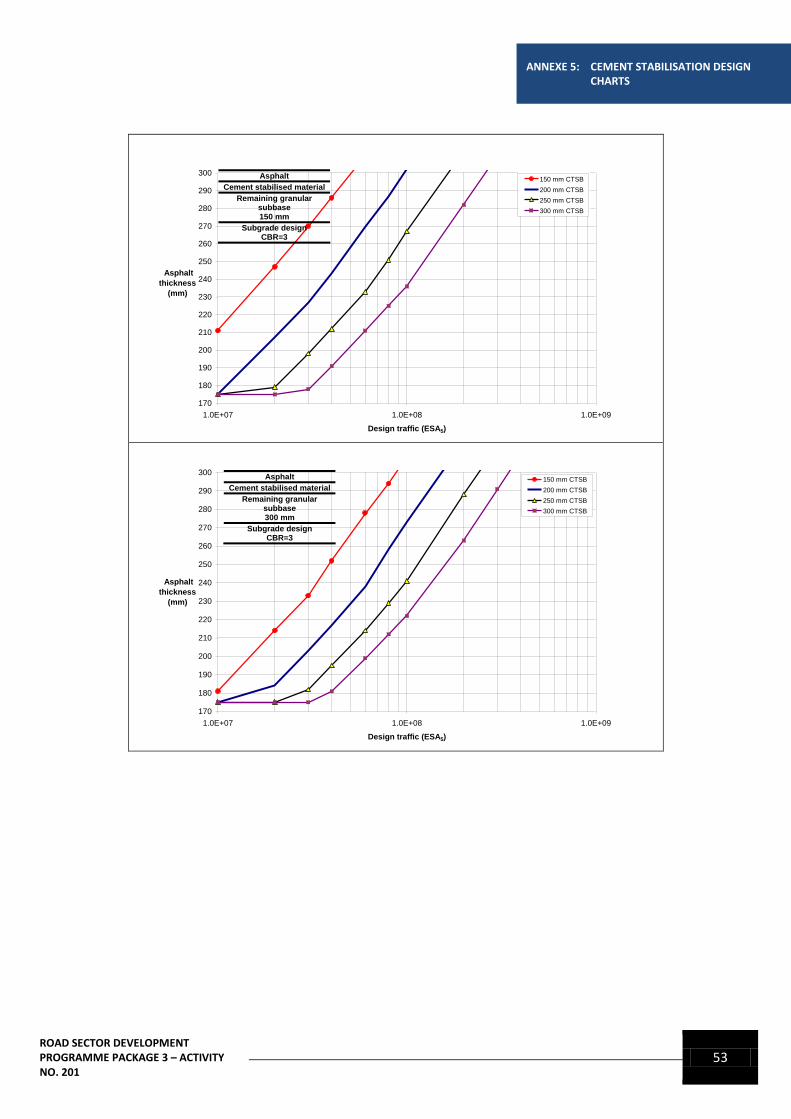
ROAD SECTOR DEVELOPMENT PROGRAMME PACKAGE 3 – ACTIVITY NO. 201
53
ANNEXE 5: CEMENT STABILISATION DESIGN CHARTS
170
180
190
200
210
220
230
240
250
260
270
280
290
300
1.0E+07 1.0E+08 1.0E+09
Design traffic (ESA5)
Asphalt
thickness
(mm)
150 mm CTSB
200 mm CTSB
250 mm CTSB
300 mm CTSB
Asphalt
Cement stabilised material
Remaining granular subbase 150 mm
Subgrade design CBR=3
170
180
190
200
210
220
230
240
250
260
270
280
290
300
1.0E+07 1.0E+08 1.0E+09
Design traffic (ESA5)
Asphalt
thickness
(mm)
150 mm CTSB
200 mm CTSB
250 mm CTSB
300 mm CTSB
Asphalt
Cement stabilised material
Remaining granular subbase 300 mm
Subgrade design CBR=3
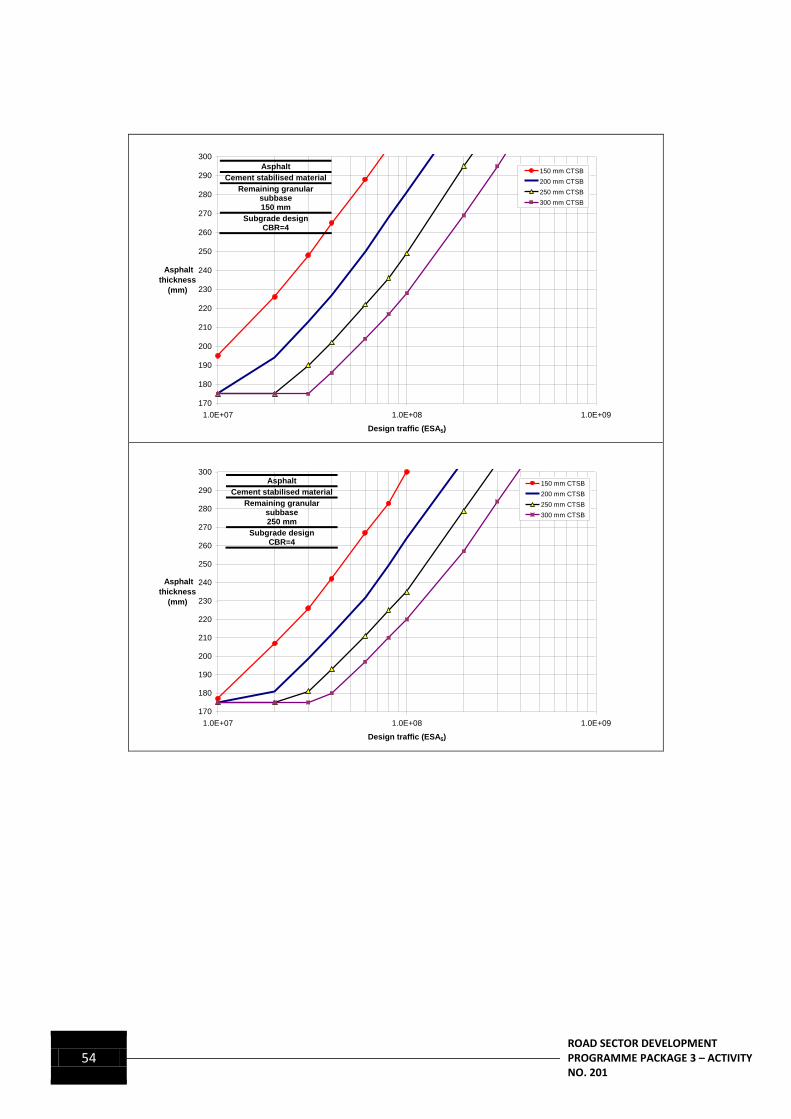
54 ROAD SECTOR DEVELOPMENT
PROGRAMME PACKAGE 3 – ACTIVITY NO. 201
170
180
190
200
210
220
230
240
250
260
270
280
290
300
1.0E+07 1.0E+08 1.0E+09
Design traffic (ESA5)
Asphalt
thickness
(mm)
150 mm CTSB
200 mm CTSB
250 mm CTSB
300 mm CTSB
Asphalt
Cement stabilised material
Remaining granular subbase 150 mm
Subgrade design CBR=4
170
180
190
200
210
220
230
240
250
260
270
280
290
300
1.0E+07 1.0E+08 1.0E+09
Design traffic (ESA5)
Asphalt
thickness
(mm)
150 mm CTSB
200 mm CTSB
250 mm CTSB
300 mm CTSB
Asphalt
Cement stabilised material
Remaining granular subbase 250 mm
Subgrade design CBR=4
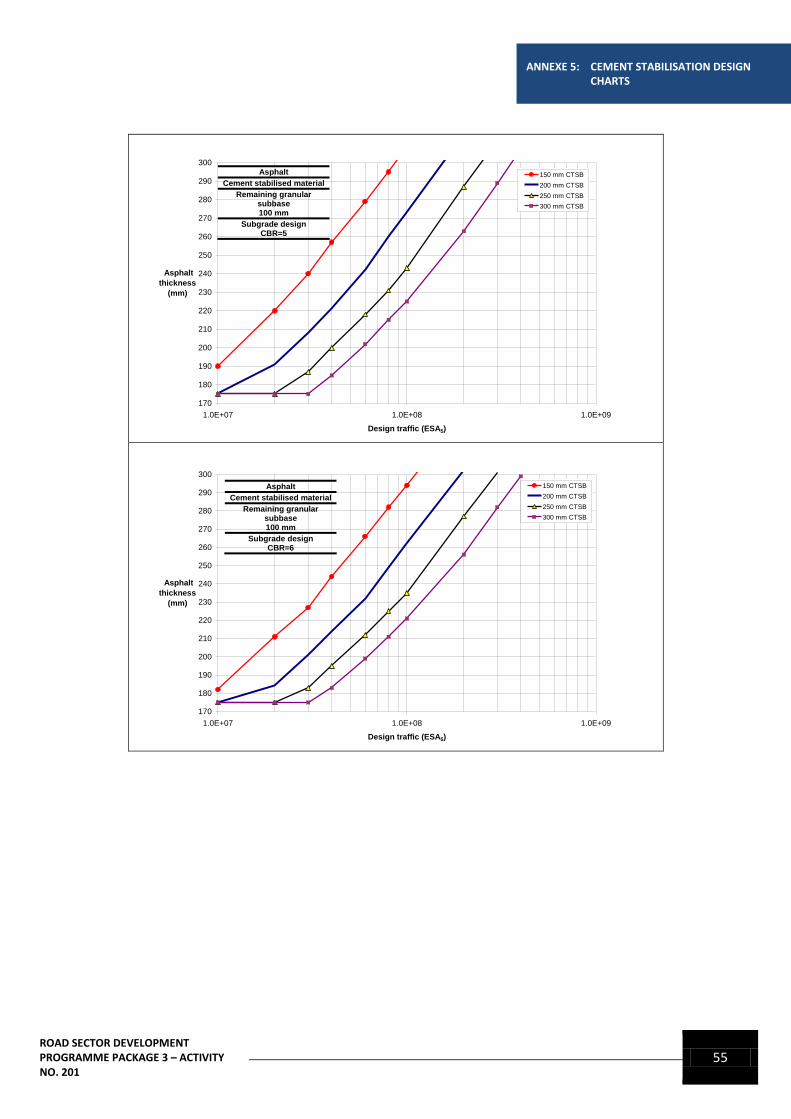
ROAD SECTOR DEVELOPMENT PROGRAMME PACKAGE 3 – ACTIVITY NO. 201
55
ANNEXE 5: CEMENT STABILISATION DESIGN CHARTS
170
180
190
200
210
220
230
240
250
260
270
280
290
300
1.0E+07 1.0E+08 1.0E+09
Design traffic (ESA5)
Asphalt
thickness
(mm)
150 mm CTSB
200 mm CTSB
250 mm CTSB
300 mm CTSB
Asphalt
Cement stabilised material
Remaining granular subbase 100 mm
Subgrade design CBR=5
170
180
190
200
210
220
230
240
250
260
270
280
290
300
1.0E+07 1.0E+08 1.0E+09
Design traffic (ESA5)
Asphalt
thickness
(mm)
150 mm CTSB
200 mm CTSB
250 mm CTSB
300 mm CTSB
Asphalt
Cement stabilised material
Remaining granular subbase 100 mm
Subgrade design CBR=6
56 ROAD SECTOR DEVELOPMENT
PROGRAMME PACKAGE 3 – ACTIVITY NO. 201
REFERENCES
AASHTO 1993, Guide for design of pavement structures, American Association of State Highway and Transportation Officials, Washington, DC, USA.
Asphalt Institute 2000, Asphalt overlays for highway and street rehabilitation, MS-17, Asphalt Institute, Lexington, KY, USA.
Austroads 1987, A guide to the visual assessment of pavement conditions, Austroads, Sydney, NSW.
Austroads 2002, Mix design for stabilised pavement materials, by G Foley, AP-T16/02, Austroads, Sydney, NSW.
Austroads 2008, Technical basis of the Austroads design procedures for flexible overlays on flexible pavements, by G Jameson, AP-T99/08, Austroads, Sydney, NSW.
Bennett, DW & Moffatt, MA 1995, Whole of life maintenance requirements of heavy duty pavements, ARR no, 264, ARRB Transport Research, Vermont South, Vic.
Berthelot, C, Scullion T, Gerbrandt, R & Safronetz, L 2001, ‘Application of ground penetrating radar for cold in-place recycled road systems’, Journal of Transportation Engineering, vol. 127, no. 4, pp. 269-274.
Descornet, G, 1989, ‘A criterion for optimising surface characteristics’, Transportation Research Board annual meeting, 8th, Transportation Research Board, Washington DC, USA.
DBM 2002, Perkerasan Lentur (New Flexible Pavement Design)
DBM 2005, Disain overlai berdasarkan lendutan (Design of Overlays)
Fu, P & Harvey, J 2007, ‘Temperature sensitivity of foamed asphalt mix stiffness: field and lab study’, International Journal of Pavement Engineering, vol. 8, no. 2, pp. 137-145.
Gerke, R 1987, Subsurface drainage of road structures, special report no. 35, Australian Road Research Board, Vermont South, Vic.
Highways Agency (UK) 1999, Design Manual for Roads and Bridges, Part 7 Foundation Design
Jenkins, K 2000, ‘Mix design considerations for cold and half-warm bituminous mixes with emphasis on foamed bitumen’, PhD dissertation, University of Stellenbosch, South Africa.
ROAD SECTOR DEVELOPMENT PROGRAMME PACKAGE 3 – ACTIVITY NO. 201
57
REFERENCES
Jones, J & Ramanujam, J 2008, Design of foamed bitumen stabilised pavements, Queensland Department of Main Roads, Brisbane, Qld.
Kerali, HGR 2000, HDM-4: Highway development and management: volume 1: overview of HDM-4, The Highway Development and Management Series, volume 1, World Road Association (PIARC), Cedex, France.
Leek, C 2001, ‘In situ foamed bitumen stabilisation: the City of Canning experience’, ARRB Transport Research conference, 20th, Melbourne, Victoria, ARRB Transport Research, Vermont South, Vic., 30 pp.
Little, DN 1995, Handbook for stabilisation of pavement subgrades and base courses with lime, National Lime Assoc., Kendall/Hunt Publishing, Dubuque, IA, USA.
Mincad Systems 2009, CIRCLY 5 users' manual, MINCAD Systems, Richmond, Vic.
NAASRA 1983, Guide to the control of moisture in roads, National Association of State Road Authorities, Sydney, NSW.
NAPA 1994, Guidelines for use of HMA overlays to rehabilitate PCC pavements, no. IS 117, National Asphalt Pavement Association, Maryland USA.
NCHRP 1994, Long-term performance of geosynthetics in drainage applications, report no. 367, National Cooperative Highway Research Program, Transport Research Board, Washington DC, USA.
NCHRP 1997, Pavement subsurface drainage systems, Synthesis of Highway Practice no. 239, National Cooperative Highway Research Program, Transport Research Board, Washington DC, USA.
QDMR 1992, Pavement rehabilitation manual, Pavement and Asset Strategy Branch, Queensland Department of Main Roads, Brisbane, Qld.
Porter, KP & Tinni, A 1993, Whole-of–life cost analysis for heavy duty pavements, Australian Asphalt Pavement Association, Kew, Vic.
Prem, H 1989, NAASRA roughness meter calibration via the road profile based international roughness index (IRI), report ARR 164, Australian Road Research Board, Vermont South, Vic.
Sherwood, P 1993, Soil stabilisation with cement and lime, Transport Research Laboratory, Crowthorne, UK.
Transport Research Laboratory, 1986, LR 1132, The structural design of bituminous roads
Transport Research Laboratory 1993, Overseas Road Note 31,

58 ROAD SECTOR DEVELOPMENT
PROGRAMME PACKAGE 3 – ACTIVITY NO. 201
Vuong, B 1991, EFROMD2 user’s manual: a computer-based program for back-calculating elastic properties from pavement deflection bowls, version 1, Australian Road Research Board, Vermont South, Vic.
Vuong, B, Potter, DW & Kadar, P 1988, ‘Analyses of a heavy duty granular pavement using finite element method and linear elastic back-calculation models,’ ARRB conference, 14th, Canberra, Australian Capital Territory, Australian Road Research Board, Vermont South, Vic, vol.14, no. 8, pp. 284-298.