road crash incidents in metro manila: a cross …euacademic.org/uploadarticle/3056.pdf · she is...
TRANSCRIPT

9890
ISSN 2286-4822
www.euacademic.org
EUROPEAN ACADEMIC RESEARCH
Vol. IV, Issue 11/ February 2017
Impact Factor: 3.4546 (UIF)
DRJI Value: 5.9 (B+)
Road Crash Incidents in Metro Manila:
A Cross-Sectional Analysis1
NORIE L. MANIEGO2
Polytechnic University of the Philippines
Abstract:
This study examines the status of road crash incidents in
Metro Manila for the year 2011.Also, it looks at the degree of
association between the number of road crash incidents and the
explanatory variables namely; the number of licensed drivers, number
of registered motorcycles and motor tricycles, and budget allotted to
road infrastructures. The impact of these explanatory variables as well
as their collective effect on the number of road crash incidents are
measured.
Percentages and weighted means are utilized in the study. In
addition, a double log multiple regression model and diagnostic tests
are employed in the study. These are the tests for correlation and its
significance, autocorrelation, significance of the parameter estimates,
overall significance of regression model, multicollinearity, measure of
goodness of fit and specification error.
It can be observed that majority of the road crash incidents in
Metro Manila are damage to property. Also, most of the crashes
1 Presented at the 3rd International Research Conference on Higher Education,
December 2-5, 2015, Travelers Hotel and Convention Center, Subic Bay Freeport,
Philippines. Copyright vested in International Multi-Disciplinary Research Journal 2 NORIE L. MANIEGO holds a Bachelor of Science degree in economics from the
Polytechnic University of the Philippines in Manila. She also holds a Master’s degree in
Applied Economics from De La Salle University under CHED Faculty Scholarship
Program. She also passed the academic requirements for a Master’s degree in
Economics at the University of Santo Tomas. She is the current chairperson of the
Department of Economics in the College of Social Sciences and Development and was a
former Chairperson of the Master of Arts in Economics at the PUP Graduate School.
She was the Chief of the Training Section of the Institute of Data and Statistical
Analysis from 2008 to 2013. She is also a co-author of Understanding Economics and
Economics: Principles and Applications, textbooks in basic economics.

Norie L. Maniego- Road Crash Incidents in Metro Manila: A Cross-Sectional
Analysis
EUROPEAN ACADEMIC RESEARCH - Vol. IV, Issue 11 / February 2017
9891
occurred at daytime but fatal crashes are high during night-time and
wee hours in the morning. Moreover, the results of the study show
that both the number of licensed drivers and number of motorcycles
and motor tricycles have significant positive correlations with the
number of road crash incidents. Furthermore, number of licensed
drivers and number of motorcycles and motor tricycles have significant
impacts on the number of road crash incidents. On the other hand,
budget allotted to road infrastructures does not have significant effect
on the road accidents. Taken collectively, the number of licensed
drivers and number of motorcycles and motor tricycles and budget
allotted to road infrastructure exert significant effect on the road crash
incidents in Metro Manila. It is therefore recommended that Land
Transportation Office should compel those individuals who want to get
a driver’s license to study in a driving school so that they will be able
to learn theoretical techniques, traffic signs and traffic rules and
regulations to lessen the road crash incidents due to driver’s
error/human error. Also, Metro Manila Development Authority should
strictly implement the use of the designated lanes for all motorcycles
and motor tricycles and firmly restricting private vehicles from using
these lanes to avoid road crashes.
Key words: road crash incidents, licensed drivers, budget for road
infrastructures, motorcycles and motor tricycles, fatal crashes,
damage to property
INTRODUCTION:
Road crash incidents occur when a vehicle collides with another
vehicle, hits a pedestrian, animal, or public property. Collision
usually may result in injury, damage of property, and even
death. In the Philippines, 85 percent of road crash was caused
by driver error or violations. Young drivers, male drivers, public
jeepney drivers and drivers with low educational attainment
had a significantly higher intention to commit traffic violations.
Also, social environment is a significant factor that influence
the road crash incidents in the Philippines. Intentions to

Norie L. Maniego- Road Crash Incidents in Metro Manila: A Cross-Sectional
Analysis
EUROPEAN ACADEMIC RESEARCH - Vol. IV, Issue 11 / February 2017
9892
commit violations were higher when other drivers saw that
there were no traffic enforcers around. 1
The particular problem of young drivers is their risk-
taking attitude while older drivers’ problems are their slower
reflexes, poorer motor control, and less visual perception.
Traffic accidents were due to motorcycle accidents with 78.6
percent while about 54 percent of it was drivers under the
influence of alcohol.2 According to Motorcycle Accidents in
Depth Study, human error is the leading cause of motorcycle
accidents and 50 percent of it were committed by drivers, 70
percent of these accidents were commonly caused by the failure
of the drivers to perceive the other vehicles. 3
In 2013, at least one person is killed in a road accident
in Metro Manila for each day according to the Metropolitan
Manila Development Authority (MMDA). 3 It only shows that in
one year, more than 365 persons are killed in road accidents in
Metro Manila alone. Data also show that in less urbanized
regions outside of Metro Manila, serious and fatal accidents are
more predominant while in Metro Manila damage to property
in terms of value per accident occurrence is higher.4
Efforts in terms of time and budget that the government
allocates towards improving road traffic safety is necessary.
Visible program of ensuring the operational roadworthiness of
the different classes of vehicles must be developed like
designing safer infrastructure and incorporating road safety
features into land-use and transport planning. The Department
of Infrastructure and Transport in Australia conducted a study
on how effective road infrastructure in their country. It is
estimated that 27 billion Australian dollars lost annually
because of road crashes and over 180,000 deaths because of
road traffic accidents since they began to record in 1925. But
over the last four decades road traffic accidents began to decline
despite the increasing number of registered vehicles and
population growth. Over the last four decades road deaths

Norie L. Maniego- Road Crash Incidents in Metro Manila: A Cross-Sectional
Analysis
EUROPEAN ACADEMIC RESEARCH - Vol. IV, Issue 11 / February 2017
9893
gradually decreased from 3,798 in 1970 to 1,304 in 2012. 5 The
road infrastructure is a big factor in reducing road accident.
There is a need to address the increasing road crash
incidents that is why the researcher attempted to determine
the status of the road crash incidents and identify the variables
that could affect the number of road traffic accidents in the
National Capital Region (NCR).
STATEMENT OF THE PROBLEM
General Problem
Generally, this study analyzed the status of the road crash
incidents and its determinants in the National Capital Region
(NCR) covering the year 2011.
Specific Problem
This study sought to provide answers to the following
questions:
1. What is the number of road crash incidents in Metro
Manila covering the year 2011?
1.1. By city
1.2. By time of the day
1.3. By accident factor
2. What is the distribution of vehicles involved in the
road crash incidents?
3. How do the following explanatory variables affect the
number of road crash incidents?
3.1. Number of licensed drivers
3.2. Number of registered motorcycles and motor
tricycles
3.3. Budget for road infrastructure
4. Is the effect of each explanatory variable individually
significant on the number of road crash accidents?
5. Is the collective effect of the explanatory variables to
the number of road crash incidents significant?

Norie L. Maniego- Road Crash Incidents in Metro Manila: A Cross-Sectional
Analysis
EUROPEAN ACADEMIC RESEARCH - Vol. IV, Issue 11 / February 2017
9894
6. Is the econometric model used in this study correctly
specified?
STATEMENT OF HYPOTHESES
The following null hypotheses were tested:
1. There is no significant relationship between road crash
incidents and each of the following variables:
1.1 Number of licensed drivers
1.2 Number of registered motorcycles and motor
tricycles
1.3 Budget for road infrastructure
2. Each of the explanatory variables has no significant
effect on the number of road crash incidents.
2.1 Number of licensed drivers
2.2 Number of registered motorcycles and motor
tricycles
2.3 Budget for road infrastructure
The explanatory variables such as the number of licensed
drivers, number of motorcycles and motor tricycles and budget
for road infrastructure when taken collectively has no
significant effect on the number of road crash incidents.
3. The econometric model used in this study is not correctly
specified.
THEORETICAL FRAMEWORK
According to Heinrich's Domino Theory by H.W. Heinrich, an
accident is caused by the mistakes of a person, which can be
social environment and inherited factor like alcoholism, fault of
a person (carelessness, recklessness, bad temper), unsafe act or
condition performing a task that leads to an accident then
injury in some cases to those involved. He said that the
personal injury is because of the accident due to the fault of a
careless person or poorly designed or maintained equipment

Norie L. Maniego- Road Crash Incidents in Metro Manila: A Cross-Sectional
Analysis
EUROPEAN ACADEMIC RESEARCH - Vol. IV, Issue 11 / February 2017
9895
which are part of the social environment. Also, he discussed
that the injury can be reduced or corrected through the three
“Es”, engineering, education and enforcement.6
In the present study, it focused on the number of road
crash incidents in Metro Manila. The number of road crash
incidents can be affected by the number of licensed drivers,
number of registered motorcycles and motor tricycles and
budget for road infrastructure. Budget for road infrastructure
and the number of licensed drivers are part of the social
environment. When the government allocates less budget for
road construction, this may lead to poor and less quality roads
for the motorists and drivers that may lead to road accidents.
Also, when a person gets a driver’s license, he/she is fully aware
of the traffic rules and regulations. Driving under the influence
of alcohol is prohibited and discussed to the drivers. Thus, an
accident may occur because of drunk and reckless driver.
Number of registered motorcycles and motor tricycles was
included as one of the determinants of road crash incidents
since literatures show that this factor affects the number of
road crash incidents.
SCOPE AND LIMITATIONS
The study focused on the road crash incidents in the National
Capital Region for the year 2011. There were 16 cities included
in the study; Caloocan, Las Piñas, Makati, Malabon,
Mandaluyong, Manila, Marikina, Muntinlupa, Navotas,
Parañaque, Pasay, Pasig, Pateros, Quezon City, San Juan,
Taguig, and Valenzuela. The independent variables used are
the number of licensed drivers, number of registered
motorcycles and motor tricycles, and budget for road
infrastructure.

Norie L. Maniego- Road Crash Incidents in Metro Manila: A Cross-Sectional
Analysis
EUROPEAN ACADEMIC RESEARCH - Vol. IV, Issue 11 / February 2017
9896
SIGNIFICANCE OF THE STUDY
The study would be beneficial to the government sector
particularly the Metro Manila Development Authority and
Land Transportation Office. It is timely for the government to
look at the factors that affect the increasing road crash
incidents in Metro Manila for them to review the traffic rules
and regulations as well as the issuance of license to the
motorists. Budget for road infrastructure must be given priority
by the government to provide safety road for the
motorists/drivers and passengers. Also, this study may provide
information to the motorists/drivers particularly the causes of
road crash incidents in Metro Manila. Through this study,
motorists/drivers may become very careful especially when they
are in the road.
REVIEW OF LITERATURES
A study on road traffic accidents and casualties in Bangladesh
by Mr. Sheikh showed that cities have higher accidents and
casualty rates than that of the non-cities. The main venues of
accidents and casualties are the national highways where buses
and trucks are predominantly involved.7 A linear regression
model was adopted in his study.
Another study conducted by Hammoudi discussed on
the major causes of road traffic accidents in Abu Dhabi. 8
According to him, the young people between 18-25 were
involved in road traffic accidents especially those who were not
wearing seatbelt, using mobile phone and under the influence
of alcohol while driving. Also, aggressive driving behavior like
speeding, tailgating and jumping red traffic light contributed to
road traffic accidents.
In the study of Deus Komba, he discussed the risk
factors which are related to road traffic accidents in Tanzania. 9
According to him, age, sex, over speeding, reckless driving,

Norie L. Maniego- Road Crash Incidents in Metro Manila: A Cross-Sectional
Analysis
EUROPEAN ACADEMIC RESEARCH - Vol. IV, Issue 11 / February 2017
9897
being a pedestrian or a motor cyclist were identified as risk
factors to road crash incidents. Young males are highly involved
in road crash incidents and the risk of dying at night was
significantly higher than at day time especially when it is
raining. He also identified that highway construction,
corruption, irresponsibility, poor management, driving while
using cellphone, driving without training, failure to respect and
obey traffic regulations, bad conditions of vehicles, age of the
vehicles and poor condition of the services were contributor of
the increasing road traffic accidents in Tanzania. It is
recommended in his study that the government of Tanzania
should review the law on the employment of drivers i.e. there
should be statutory mandate to train the drivers. Also,
improvement in the working condition of the police force, new
driving license system, and regular vehicle inspection were
recommended to lessen the number of road crash incidents.
RESEARCH METHODOLOGY
This chapter discusses the design and procedures undertaken
during the conduct of the study. It presents the research design,
source of data, and statistical treatment of data.
Research Design
The researchers used descriptive method in determining the
number of road crash incidents and its explanatory variables
such as the number of licensed drivers, number of registered
motorcycles and motor tricycles, and budget for road
infrastructure.
Sources of Data
The researchers used secondary data that were gathered from
different government institutions such as the Department of
Public Works and Highways (DPWH), Metropolitan Manila
Development Authority (MMDA), and Land Transportation

Norie L. Maniego- Road Crash Incidents in Metro Manila: A Cross-Sectional
Analysis
EUROPEAN ACADEMIC RESEARCH - Vol. IV, Issue 11 / February 2017
9898
Office (LTO). Furthermore, supplementing data from various
web sources were used. Specifically, the data on a number of
road crash incidents per city in NCR were collected from the
Road Safety Unit-Traffic Discipline Office of the Traffic
Engineering Center of the Metropolitan Manila Development
Authority (MMDA). Data on the budget for infrastructure were
gathered from the Department of Public Works and Highways
(DPWH). Data on the licensed drivers and number of registered
motorcycles and motor tricycles were taken from the Land
Transportation Office (LTO).
Data Treatment
The data used were presented in graphical and tabular forms.
Regression results and analysis were treated using Econometric
Views.
Statistical Treatment of Data
The functional relationship between the number of road crash
incidents and the number of licensed drivers, number of
registered motorcycles and motor tricycles and budget for road
infrastructure was generated using the multiple linear
regression analysis.
The following multiple regression model was used:
NRCI= β1 + β2 NLDR + β3 NRMCMT+ β4 BRI + εi
Where:
NRCI = number of road crash incidents
NLDR = number of licensed drivers
NRMCMT = total number of registered motorcycles and motor tricycles
BRI = budget for road infrastructure
β1, β2, β3, β4, β5 =parameters, εi = Error Term
1. Measure of Correlation
Correlation analysis determines the degree of association or
relationship between two variables. The most common measure

Norie L. Maniego- Road Crash Incidents in Metro Manila: A Cross-Sectional
Analysis
EUROPEAN ACADEMIC RESEARCH - Vol. IV, Issue 11 / February 2017
9899
of correlation is the Pearson Correlation Coefficient. Hence, it
is computed as follows:
∑
∑ ∑
√[∑ ∑
] ∑ [ ∑
]
The values of r generated by this equation will range from -1 to
1. A value of -1 indicated a perfect inverse correlation between
the variables, that is, when the value for the one variable is
high – the value for the other variable is low. A value of 0
indicates no relationship between the variables. A value of 1
indicates a perfect correlation between the variables. Other
than these, the degrees of correlation are the following:
2. Test of the Individual Significance of the Parameter
Estimates
To be able to test the statistical significance of the parameter
estimates, the t-test was applied. It was given as:
)ˆ(
ˆ
2
22
seT
where the value of the estimated parameter is divided by its
standard error to get the t-statistic (Gujarati, 2003).
If the value of t-statistic exceeds the critical value of the
t distribution at given level of significance with n-k degrees of
freedom, accept that β0, β1, β2, β3, β4, and β5 are statistically
significant.
r values Interpretation
-1.00 Perfect Negative Correlation
-0.99 to -0.60 Strong Negative Correlation
-0.59 to -0.30 Moderate Negative Correlation
-0.29 to -0.01 Weak Negative Correlation
0.00 No Correlation
+0.01 to +0.29 Weak Positive Correlation
+0.30 to +0.59 Moderate Positive Correlation
+0.60 to +0.99 Strong Positive Correlation
+1.00 Perfect Positive Correlation
Norie L. Maniego- Road Crash Incidents in Metro Manila: A Cross-Sectional
Analysis
EUROPEAN ACADEMIC RESEARCH - Vol. IV, Issue 11 / February 2017
9900
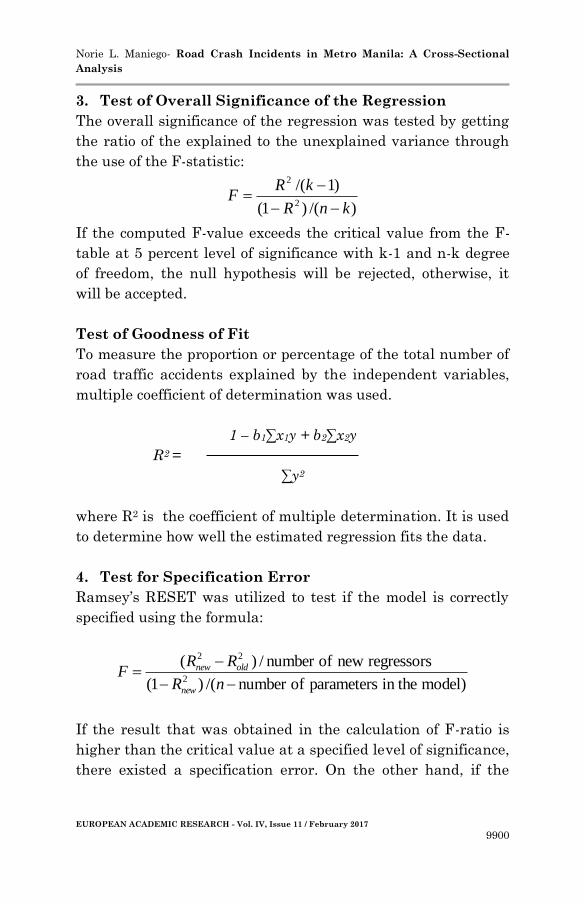
3. Test of Overall Significance of the Regression
The overall significance of the regression was tested by getting
the ratio of the explained to the unexplained variance through
the use of the F-statistic:
)/()1(
)1/(2
2
knR
kRF
If the computed F-value exceeds the critical value from the F-
table at 5 percent level of significance with k-1 and n-k degree
of freedom, the null hypothesis will be rejected, otherwise, it
will be accepted.
Test of Goodness of Fit
To measure the proportion or percentage of the total number of
road traffic accidents explained by the independent variables,
multiple coefficient of determination was used.
1 – b1∑x1y + b2∑x2y
R2 =
∑y2
where R2 is the coefficient of multiple determination. It is used
to determine how well the estimated regression fits the data.
4. Test for Specification Error
Ramsey’s RESET was utilized to test if the model is correctly
specified using the formula:
model) in the parameters ofnumber /()1(
regressors new ofnumber /)(2
22
nR
RRF
new
oldnew
If the result that was obtained in the calculation of F-ratio is
higher than the critical value at a specified level of significance,
there existed a specification error. On the other hand, if the

Norie L. Maniego- Road Crash Incidents in Metro Manila: A Cross-Sectional
Analysis
EUROPEAN ACADEMIC RESEARCH - Vol. IV, Issue 11 / February 2017
9901
calculated F-ratio is smaller than the critical value, it can be
concluded that there is no specification error in the model used.
PRESENTATION, ANALYSIS AND INTERPRETATION
OF RESULTS
Table 1. Distribution of Road Crash Incidents by Cities
in Metro Manila, 2011
Source:Metro Manila Accident Recording System ,MMDA 2011
The table above shows that the distribution of the road crash
incidents by Cities in the National Capital Region for year
2011. It shows that road crash incidents are divided into fatal,
non-fatal and damage to property. Out of the 77, 110 road crash
incidents, 79 percent of this is damage to property, 20.53 is for
non-fatal while 0.48 percent for fatal.
Furthermore, it shows that Pateros has the lowest
number of road crash incidents for the year 2011, followed by
Malabon and Navotas. These local government units can be
considered as the safest in Metro Manila in terms of road
City Fatal Non Fatal
Injury
Damage
to
Property
Total Percent
(%) Rank
Caloocan 14 648 2425 3087 4.00 10
Las Piñas 8 522 2547 3077 3.99 11
Makati 24 1075 6061 7160 9.29 2
Malabon 3 224 599 826 1.07 15
Mandaluyong 8 565 3058 3631 4.71 9
Manila 26 663 3555 4244 5.50 4
Marikina 14 1274 2537 3825 4.96 7
Muntinlupa 16 787 2224 3027 3.93 12
Navotas 1 168 625 794 1.03 16
Parañaque 18 912 2976 3906 5.07 5
Pasay 20 576 3167 3763 4.88 8
Pasig 20 1210 5633 6863 8.90 3
Pateros 0 1 35 36 0.05 17
Quezon City 142 5031 19644 24817 32.18 1
San Juan 2 231 1527 1760 2.28 14
Taguig 27 873 2955 3855 5.00 6
Valenzuela 27 1067 1345 2439 3.16 13
Grand Total 370 15,827 60,913 77,110 100.00
Average Accident Rate Per Day 1.01 43.36 166.88 211.26

Norie L. Maniego- Road Crash Incidents in Metro Manila: A Cross-Sectional
Analysis
EUROPEAN ACADEMIC RESEARCH - Vol. IV, Issue 11 / February 2017
9902
crashes is concerned, since they have lesser records on fatal and
non-fatal incidences. This lowest incidence of road crashes in
the said cities can be attributed to small land area within NCR,
no major arterial road compared to other cities, not considered
as a Central Business Districts and manageable traffic
direction and control.
Conversely, the City of Quezon dominates all the cities
of Metro Manila in terms of fatal road crash incidents followed
by Pasig, City of Manila and Makati. This is because of the
following factors: these are Central Business Districts (CBD’s)
with high social and economic activity, top cities that have the
biggest land area among the cities in Metro Manila, major
thoroughfares such as EDSA, Commonwealth Ave., Quezon
Ave., Radial Road 10 and Roxas Blvd. are located within these
cities.
These results are consistent with the study of
Mohammad Mizanur Rahman Sheikh that cities have higher
accidents and casualty rates than that of the non-cities.
Also, it shows that the average accident per day is 1.01
for fatal, 43.36 for non-fatal injury and 166.88 for damage to
property. Regardless on the type of incident, on the average,
there are 212 accidents in a day.
Table 2. Distribution of Road Crash Incidents by Time of the Day in
Metro Manila, 2011
Time Hour Fatal Non-Fatal Injury Damage to Property Grand
00:00-00:59 11 237 607 855
01:00-01:59 24 383 909 1316
02:00-02:59 26 372 925 1323
03:00-03:59 21 352 835 1208
04:00-04:59 23 399 1024 1446
05:00-05:59 16 489 1203 1708
06:00-06:59 16 709 1834 2559
07:00-07:59 6 809 2763 3578
08:00-08:59 8 831 3137 3976
09:00-09:59 7 768 3465 4240
10:00-10:59 11 816 3960 4787
11:00-11:59 10 794 3927 4731
12:00-12:59 17 857 3429 4303
13:00-13:59 14 660 3114 3788

Norie L. Maniego- Road Crash Incidents in Metro Manila: A Cross-Sectional
Analysis
EUROPEAN ACADEMIC RESEARCH - Vol. IV, Issue 11 / February 2017
9903
14:00-14:59 7 700 3624 4331
15:00-15:59 14 715 3725 4454
16:00-16:59 16 751 3334 4101
17:00-17:59 8 825 2885 3718
18:00-18:59 10 670 2673 3353
19:00-19:59 16 746 3211 3973
20:00-20:59 14 684 2797 3495
21:00-21:59 25 611 2564 3200
22:00-22:59 17 598 2152 2767
23:00-23:59 22 541 1784 2347
No Time Indicated 11 510 1032 1553
Grand Total 625 27,294 105,613 77110
Day-time 134 9,235 39,197 48,566
(06:00-17:59) 0.17% 11.98% 50.83% 62.98%
Night-time 236 6,592 21,716 28,544
(18:00-05:59) 0.31% 8.55% 28.16% 37.02%
On the average, 28,544 or 37.02% of road crashes occurred
during the night time i.e. 18:00 P.M. to 5:59 A.M. and without
time indicated, while 48,566 or 62.98% occurred during daytime
i.e. 6:00 A.M to 17:59 P.M. Even though most of the crashes
occurred at daytime, it can be observed in the table that fatal
crashes are high during night-time and wee hours in the
morning. The result is consistent with the study of Deus
Damian Komba that the risk of dying at night is higher than
during the day.
Table 3. Distribution of Road Crash Incidents by Accident Factor in
Metro Manila, 2011
Accident Factor Fatal
Non-
Fatal
Injury
Damage to
Property Total
Human Error (Alcohol suspected) 3 80 63 146
Human Error (Avoided Hitting Animal / Lost
Control / Wet-Slippery Road, (Avoided Hitting
Another Vehicle, Avoided Hitting Pedestrian )
17 36 53
Human Error (Backing Inattentively) 8 32 40
Human Error (Bad overtaking / Lost Control,
Bad Overtaking, Bad Turning, Cut by Another
Vehicle,Disobey sign or traffic lights)
9 21 30
Human Error (Driver Error) 3 843 1906 2752
Human Error (Entering One Way / Counter flow,
Inattentive, Lost balance, Loss control, Loss
control/alcohol suspected, Sudden stop,
Tired/asleep, Too close, Too fast, Using mobile
phone)
7 84 77 168

Norie L. Maniego- Road Crash Incidents in Metro Manila: A Cross-Sectional
Analysis
EUROPEAN ACADEMIC RESEARCH - Vol. IV, Issue 11 / February 2017
9904
Others (Due to Scattered Stones on the Road,
Flooded, Heavy Rain, Hit by running person,
Hold up, intentional, Poor lighting, Runover pot
holes, wet/Slippery road)
14 8 22
Vehicle Defect (Chain Detached, Flat tire, Lost
Brake, Mechanical, Sudden stop of Engine, Tire
Exploded)
1 25 44 70
No Accident Factor Stated 356 14747 58726 73829
Grand Total 370 15,827 60,913 77,110
Among the accident factors shown in table 3, the driver’s error
is the main cause of accidents with 2,752 i.e. 3 for fatal, 843 for
non-fatal injury and 1,906 for damage to property. Second
factor that has the highest number of road crash incidents is
the human error due to loss of control, loss of balance, too fast,
etc. with 168 incidents of which 7 are fatal, 84 are non-fatal
injury and 77 are damage to property. Moreover, alcohol
suspected is the third main reason for road crash incidents with
146 cases of which 3 are fatal, 80 and 63 for non-fatal injury
and damage to property, respectively.
Table 4. Distribution of Vehicles Involved in Road Crash Incidents in
Metro Manila, 2011
Vehicle Type Fatal % of
Total
Non
Fatal
Injury
% of
Total
Damage
to
Property
% of
Total
Total No.
of
Vehicles
Cycle-Pedicab 20 3.79% 820 3.16% 468 0.39% 1308
Motorcycle 163 30.87% 9896 38.09% 7778 6.50% 17,837
Motor Tricycle 18 3.41% 1483 5.71% 1962 1.64% 3,463
Car 91 17.23% 6600 25.40% 64702 54.06% 71,393
Jeepney 51 9.66% 2350 9.04% 9023 7.54% 11,424
Taxi / Fx 16 3.03% 1267 4.88% 6060 5.06% 7,343
Bus 34 6.44% 811 3.12% 6095 5.09% 6,940
Van 26 4.92% 1196 4.60% 10895 9.10% 12,117
Truck 84 15.91% 957 3.68% 8439 7.05% 9,480
Train 7 1.32% 9 0.03% 3 0.01% 19
Kuliglig - - 2 0.01% 10 0.01% 12
Horse-drawn
vehicle - - - - 2 0.01% 2
Push Cart - - 2 - 9 0.01% 11
Heavy Equipment - - - - 1 0.01% 1
Unknown Vehicle 18 3.41% 588 2.26% 4233 3.54% 4,839
TOTAL 528 100% 25,981 100% 119,680 100% 146,189

Norie L. Maniego- Road Crash Incidents in Metro Manila: A Cross-Sectional
Analysis
EUROPEAN ACADEMIC RESEARCH - Vol. IV, Issue 11 / February 2017
9905
In the table shown above, there are more than 146 thousand
vehicles involved in the road crash incidents. It can be observed
that motorcycles have the highest fatality incident rate with
163 or 30.87 percent of the total fatal incidents, then followed
by cars with 91 or 17.23 percent. For non-fatal incidents,
Motorcycles still have the highest rate with 9,896 or 38.09
percent share, followed by cars with 6,600 or 25.40 percent. For
damage to property incidents, cars got the highest rate with
64,702 or 54.02 percent
2. Analysis of Correlation Results
Table 5. Correlation Matrix of the Number of Road Crash Incidents,
Number of Licensed Drivers, Number of Motorcycles and Motor
Tricycles and Budget for Road Infrastructure
BRI NLD NRMCMT NRCI
BRI 1.000 0.462 0.374 0.121
NLD 0.462 1.000 0.770 0.777
NRMCMT 0.373 0.770 1.000 0.930
NRCI 0.121 0.777 0.930 1.000
Critical value 0.5140 at 0.05 (two-tail)
Table 5 shows that the number of licensed drivers and number
of registered motorcycles and motor tricycles are strongly
correlated to the number of road crash incidents as evidenced
by their correlation coefficients of 0.777 and 0.93, respectively.
The computed value of the number of licensed drivers and
number of registered motorcycles and motor tricycles are
greater than the critical value of 0.5140 at 0.05 level of
significance. Therefore, it can be concluded that the number of
licensed drivers and number of registered motorcycles and
motor tricycles are significantly correlated to the number of
road crash incidents.
On the other hand, budget for road infrastructure has a
weak correlation to the number of road crash incidents. The
correlation coefficient of 0.121 is less than the critical value of
0.5140 at 0.05 level of significance. Hence, budget for road

Norie L. Maniego- Road Crash Incidents in Metro Manila: A Cross-Sectional
Analysis
EUROPEAN ACADEMIC RESEARCH - Vol. IV, Issue 11 / February 2017
9906
infrastructure is not significantly correlated to the number of
road crash incidents.
Results of the Regression Analysis:
Regression Model:
2=0.8183 Durbin-watson stat=1.8239
F-stat=11.2639
Critical Values:
t-value(0.05) = 2.16
F-value(3,13) = 3.41
The results of the regression model on the number of road crash
incidents and the three (3) explanatory variables were
summarized above.
It shows that the number of licensed drivers and number
of registered motorcycles and motor tricycles have significant
effect on road crash incidents in 16 cities in the National
Capital Region (NCR). The calculated t-value of number of
licensed drivers and number of registered motorcycles and
motor tricycles are 2.4494 and 3.3289, respectively, which are
greater than the critical value of 2.16 at 5 percent level of
significance with 3 and 13 degrees of freedom. Hence, the
hypothesis that states that there is no significant effect
between the number of road crash incidents and number of
licensed drivers and number of registered motorcycles and
motor tricycles is rejected. Therefore, it can be concluded the
number of licensed drivers and number of registered
motorcycles and motor tricycles have significant effect on road
crash incidents. Holding other factors constant, for every one
percent increase in the number of licensed drivers and number
of registered motorcycles and motor tricycles, road crash
incidents will increase by 0.31 and 0.76 percent, respectively.

Norie L. Maniego- Road Crash Incidents in Metro Manila: A Cross-Sectional
Analysis
EUROPEAN ACADEMIC RESEARCH - Vol. IV, Issue 11 / February 2017
9907
This is consistent with the data above that the main cause of
road crash incidents is the driver’s error. Most of the drivers
who get license have limited knowledge on road rules and
regulations because most of them only learn how to drive
through their peers and not from a reputable driving school
where they can learn theoretical techniques and road rules and
regulations. Also, according to the reports of MMDA in 2011,
motorcycles have the highest fatality incident rate then
followed by cars while in non-fatal incidents, motorcycles still
have the highest rate, followed by cars.
The calculated t-value of -0.1515 is less than the critical
value of 2.16 at 5 percent level of significance on the budget for
road infrastructure. This means that hypothesis which states
that the budget for road infrastructure has no significant effect
on the number of road crash incidents is not rejected. Therefore,
budget for road infrastructure has no significant effect on the
number of road crash incidents.
The F-computed for the regression model is 11.2639
which is greater than the critical F-value of 3.41 at 0.05 level of
significance. Hence, the null hypothesis that the explanatory
variables when taken collectively has no effect on the number of
road crash incidents is rejected. It is therefore concluded that
the explanatory variables such as number of licensed drivers,
and the number of registered motorcycles and motor tricycles
and budget for road infrastructure when taken collectively have
significant effect on the number of road crash incidents.
The calculated coefficient of multiple determination is
0.8183. This means that 81.83 percent of the total variation on
road crash incidents is explained by changes in the budget for
road infrastructure, number of licensed drivers, and the
number of registered motorcycles and motor tricycles.
Table 6. Test for Specification Error
F-statistic 0.1546 Probability 0.7034
Norie L. Maniego- Road Crash Incidents in Metro Manila: A Cross-Sectional
Analysis
EUROPEAN ACADEMIC RESEARCH - Vol. IV, Issue 11 / February 2017
9908
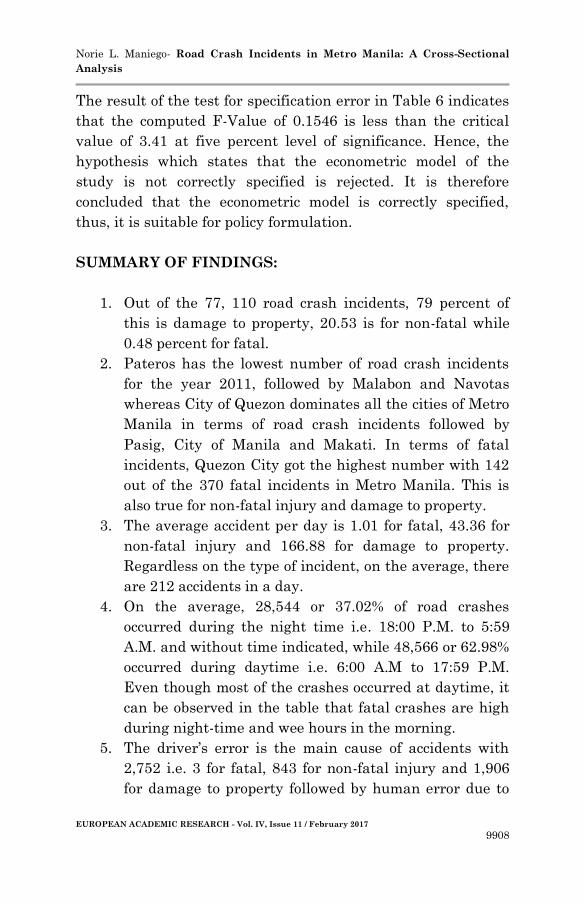
The result of the test for specification error in Table 6 indicates
that the computed F-Value of 0.1546 is less than the critical
value of 3.41 at five percent level of significance. Hence, the
hypothesis which states that the econometric model of the
study is not correctly specified is rejected. It is therefore
concluded that the econometric model is correctly specified,
thus, it is suitable for policy formulation.
SUMMARY OF FINDINGS:
1. Out of the 77, 110 road crash incidents, 79 percent of
this is damage to property, 20.53 is for non-fatal while
0.48 percent for fatal.
2. Pateros has the lowest number of road crash incidents
for the year 2011, followed by Malabon and Navotas
whereas City of Quezon dominates all the cities of Metro
Manila in terms of road crash incidents followed by
Pasig, City of Manila and Makati. In terms of fatal
incidents, Quezon City got the highest number with 142
out of the 370 fatal incidents in Metro Manila. This is
also true for non-fatal injury and damage to property.
3. The average accident per day is 1.01 for fatal, 43.36 for
non-fatal injury and 166.88 for damage to property.
Regardless on the type of incident, on the average, there
are 212 accidents in a day.
4. On the average, 28,544 or 37.02% of road crashes
occurred during the night time i.e. 18:00 P.M. to 5:59
A.M. and without time indicated, while 48,566 or 62.98%
occurred during daytime i.e. 6:00 A.M to 17:59 P.M.
Even though most of the crashes occurred at daytime, it
can be observed in the table that fatal crashes are high
during night-time and wee hours in the morning.
5. The driver’s error is the main cause of accidents with
2,752 i.e. 3 for fatal, 843 for non-fatal injury and 1,906
for damage to property followed by human error due to

Norie L. Maniego- Road Crash Incidents in Metro Manila: A Cross-Sectional
Analysis
EUROPEAN ACADEMIC RESEARCH - Vol. IV, Issue 11 / February 2017
9909
loss of control, loss of balance, too fast, etc. with 168
incidents of which 7 are fatal, 84 are non-fatal injury
and 77 are damage to property while alcohol suspected
is the third main reason for road crash incidents with
146 cases of which 3 are fatal, 80 and 63 for non-fatal
injury and damage to property, respectively.
6. The number of licensed drivers and number of registered
motorcycles and motor tricycles are strongly correlated
to the number of road crash incidents as evidenced by
their correlation coefficients of 0.777 and 0.93,
respectively while budget for road infrastructure has a
weak correlation to the number of road crash incidents
with a correlation coefficient of 0.121.
7. It shows that the number of licensed drivers and number
of registered motorcycles and motor tricycles have
significant effect on road crash incidents in 16 cities in
the National Capital Region (NCR) since the calculated
t-value of number of licensed drivers and number of
registered motorcycles and motor tricycles are 2.4494
and 3.3289, respectively, are greater than the critical
value of 2.16 at 5 percent level of significance. However,
the calculated t-value of -0.1515 is less than the critical
value of 2.16 at 5 percent level of significance on the
budget for road infrastructure, thus, the budget for road
infrastructure has no significant effect on the number of
road crash incidents.
8. The explanatory variables such as number of licensed
drivers, and the number of registered motorcycles and
motor tricycles and budget for road infrastructure when
taken collectively have significant effect on the number
of road crash incidents since the F-computed for the
regression model is 11.2639 which is greater than the
critical F-value of 3.41 at 0.05 level of significance.
9. Almost 82 percent (81.83%) of the total variation on road
crash incidents is explained by changes in the budget for

Norie L. Maniego- Road Crash Incidents in Metro Manila: A Cross-Sectional
Analysis
EUROPEAN ACADEMIC RESEARCH - Vol. IV, Issue 11 / February 2017
9910
road infrastructure, number of licensed drivers, and the
number of registered motorcycles and motor tricycles.
10. The econometric model is correctly specified since the
computed F-Value of 0.1546 is less than the critical
value of 3.41 at five percent level of significance.
CONCLUSIONS:
1. Majority of the road crash incidents in Metro Manila are
damage to property.
2. On the average, Pateros has the lowest number of road
crash incidents whereas Quezon City has the highest
number in terms of fatal, non-fatal injury and damage to
property.
3. Most of the road crashes occurred at daytime but fatal
crashes are high during night-time and wee hours in the
morning.
4. Driver’s error and alcohol suspected are two of the main
causes of road crash incidents.
5. The number of licensed drivers and number of registered
motorcycles and motor tricycles are strongly correlated
and significant to the number of road crash incidents
while budget for road infrastructure is weakly correlated
and insignificant.
6. The number of licensed drivers and number of registered
motorcycles and motor tricycles have significant effect
on road crash incidents in 16 cities in the National
Capital Region (NCR) whereas the budget for road
infrastructure has no significant effect on the number of
road crash incidents.
7. The explanatory variables such as number of licensed
drivers, and the number of registered motorcycles and
motor tricycles and budget for road infrastructure when
taken collectively have significant effect on the number
of road crash incidents.

Norie L. Maniego- Road Crash Incidents in Metro Manila: A Cross-Sectional
Analysis
EUROPEAN ACADEMIC RESEARCH - Vol. IV, Issue 11 / February 2017
9911
8. The econometric model can be used for policy
formulation.
RECOMMENDATIONS:
1. LTO should compel those individuals who want to get a
driver’s license to study in a driving school so that they
will be able to learn theoretical techniques, traffic signs
and traffic rules and regulations. This would lessen the
road crash incidents due to driver’s error/human error.
2. LTO should be strict in the implementation of their
policy i.e. seminar should be conducted to remind the
drivers about the do’s and don’ts in driving and the
penalties to the traffic violators should be really
imposed.
3. MMDA should strictly implement the use of the
designated lanes for all motorcycles and motor tricycles
and firmly restricting private vehicles from using these
lanes to avoid road crashes.
ENDNOTES
1. Acta Medica Philippina, Crash of Motorcycle Accident, 2012
2. Motorcycle Cruiser, MAIDS Motorcycle Accident Study:
Lessons from 921 Crashes, Retrieved on February 2013,
http://www.motorcyclecruiser.com/streetsurvival/maids_mot
orcycle_accident_study/#ixzz2cxFMpZje.
3. Mendoza, A. C., Applications of Psychology to the
Understanding and Modification of Road User Behavior.
University of the Philippines National Center for
Transportation Studies, Quezon City, Philippines, 2006.
4. Villoria, O.G. and Diaz, C. E., Road Accidents in the
Philippines, National Center for Transportation Studies,
UP, IATSS Research, Vol. 24, No.1, 2000.

Norie L. Maniego- Road Crash Incidents in Metro Manila: A Cross-Sectional
Analysis
EUROPEAN ACADEMIC RESEARCH - Vol. IV, Issue 11 / February 2017
9912
5. Department of Infrastructure and Transport, Road Safety,
Accessed on September 2013,
http://www.infrastructure.gov.au/roads/safety.
6. Work Zone Safety and Efficiency Transportation Center,
Accident Theories, Cleveland State University, Accessed on
September 2013,
academic.csuohio.edu/duffy_s/section_03.pdf.
7. Sheikh, M. R., A Statistical Analysis of Road Traffic
Accidents and Casualties in Bangladesh, Master Thesis,
2009, Edinburgh, Napor University, Accessed December
2013, www.researchrepository.napier.ac.ukf.2753.
8. Hammoudi, A.L., Causes and Strategies to Reduce Road
Traffic Accidents in Abu Dhabi, Dissertation Paper, Cardiff
School of Health Sciences, Cardiff Metropolitan University,
Accessed December 2013, https://repository.cardiffmet.ac.uk
9. Komba, D.D. , Risk Factors and road Traffic Accidents in
Tanzania: A Case Study of Kibha District, Master Thesis in
Developmental studies, Norwegian University of Science
and Technology, Trondheim, Accessed December 2013,
www.diva_portal.org
REFERENCES
1. ActaMedicaPhilippina, Crash of Motorcycle Accident, 2012
2. Department of Infrastructure and Transport, Road Safety,
Accessed on September 2013,
http://www.infrastructure.gov.au/roads/safety.
3. Garcia, George A. Fundamental Concepts and Methods in
Statistics P1,UST Publishing House 2003, ISBN 971-506-
225-3
4. Gujarati, Damodar N. 2003. Basic Econometrics. McGraw-
Hill Education
5. Hammoudi, A.L., Causes and Strategies to Reduce Road
Traffic Accidents in Abu Dhabi, Dissertation Paper, Cardiff

Norie L. Maniego- Road Crash Incidents in Metro Manila: A Cross-Sectional
Analysis
EUROPEAN ACADEMIC RESEARCH - Vol. IV, Issue 11 / February 2017
9913
School of Health Sciences, Cardiff Metropolitan University,
Accessed December 2013, https://repository.cardiffmet.ac.uk
6. Komba, D.D., Risk Factors and road Traffic Accidents in
Tanzania: A Case Study of Kibha District, Master Thesis in
Developmental studies, Norwegian University of Science
and Technology, Trondheim, Accessed December 2013,
www.diva_portal.org
7. Mendoza, A. C., Applications of Psychology to the
Understanding and Modification of Road User Behavior.
University of the Philippines National Center for
Transportation Studies, Quezon City, Philippines, 2006.
8. Metro Manila Accident Recording and Analysis System,
Traffic Accident Report January to December 2011,
Produced by the Road Safety Unit, Traffic Engineering
Center and Metropolitan Development Authority
9. Motorcycle Cruiser, MAIDS Motorcycle Accident Study:
Lessons from 921 Crashes, Retrieved on February 2013,
http://www.motorcyclecruiser.com/streetsurvival/maids_mot
orcycle_accident_study/#ixzz2cxFMpZje.
10. Sheikh, M. R., A Statistical Analysis of Road Traffic
Accidents and Casualties in Bangladesh, Master Thesis,
2009, Edinburgh, Napor University, Accessed December
2013, www.researchrepository.napier.ac.ukf.2753.
11. Villoria, O.G. and Diaz, C. E., Road Accidents in the
Philippines, National Center for Transportation Studies,
UP, IATSS Research, Vol. 24, No.1, 2000.
12. Work Zone Safety and Efficiency Transportation Center,
Accident Theories, Cleveland State University, Accessed on
September 2013,
academic.csuohio.edu/duffy_s/section_03.pdf.