rna secondary structure prediction and analysis02710/lectures/rnalecture2015.pdf · resources...
TRANSCRIPT

RNA secondary structure
prediction and analysis
1

Resources
• Lecture Notes from previous years: Takis Benos
• Covariance algorithm: Eddy and Durbin, Nucleic Acids Research, v22: 11, 2079
• Useful lecture slides from Larry Ruzzo, U of Washington and Phillip Compeau, UCSD
2

Outline
• RNA Folding
• Dynamic Programming for RNA secondary structure prediction• Nussinov et al and Zucker et al algorithms
• Covariance Model• Eddy and Durbin
3

Various types of RNA
• messenger RNA (mRNA)
• transfer RNA (tRNA)
• Ribosomal RNA (rRNA)
• small interfering RNA (siRNA)
• micro RNA (miRNA)
• small nuclear RNA (snRNA)
• small nucleolar RNA (snoRNA)
• guide RNA (gRNA)
• efference RNA(eRNA)
4
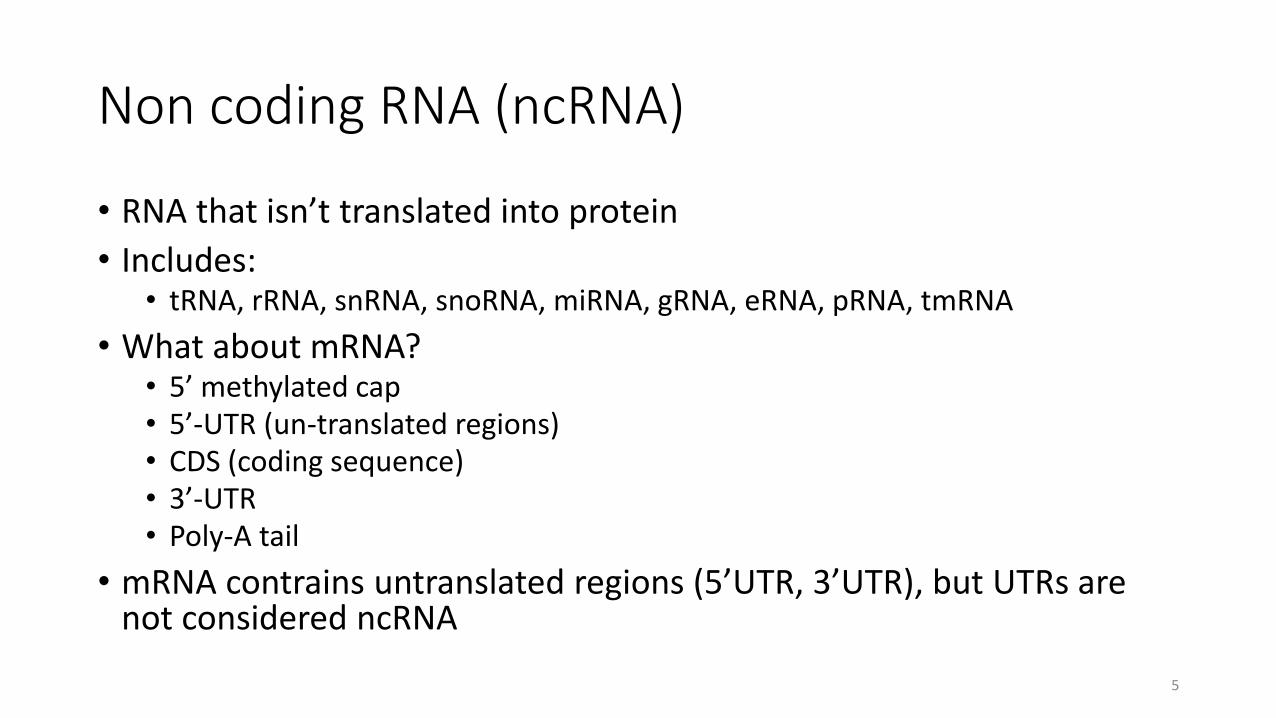
Non coding RNA (ncRNA)
• RNA that isn’t translated into protein
• Includes:• tRNA, rRNA, snRNA, snoRNA, miRNA, gRNA, eRNA, pRNA, tmRNA
• What about mRNA?• 5’ methylated cap• 5’-UTR (un-translated regions)• CDS (coding sequence)• 3’-UTR• Poly-A tail
• mRNA contrains untranslated regions (5’UTR, 3’UTR), but UTRs are not considered ncRNA
5

RNA Basics
• RNA bases: A, C, G, U
• Watson-Crick Pair • A-U (~ 2 kcal/mol)• G-C (~ 3 kcal/mol)
• Wobble pair• G-U (~ 1 kcal/mol)
• Non-Canonical pairs (modified suitably)
• Bases can only pair with one other base
Two hydrogen bonds
6

RNA Basics
• RNA bases: A, C, G, U
• Canonical Base Pairs• A-U
• G-C
• G-U
• Bases can only pair with one other base
Three hydrogen bonds => more stable
7

RNA Basics
• RNA bases: A, C, G, U
• Canonical Base Pairs• A-U
• G-C
• G-U
• Bases can only pair with one other base
‘wobble pairing’
8

9

10

11

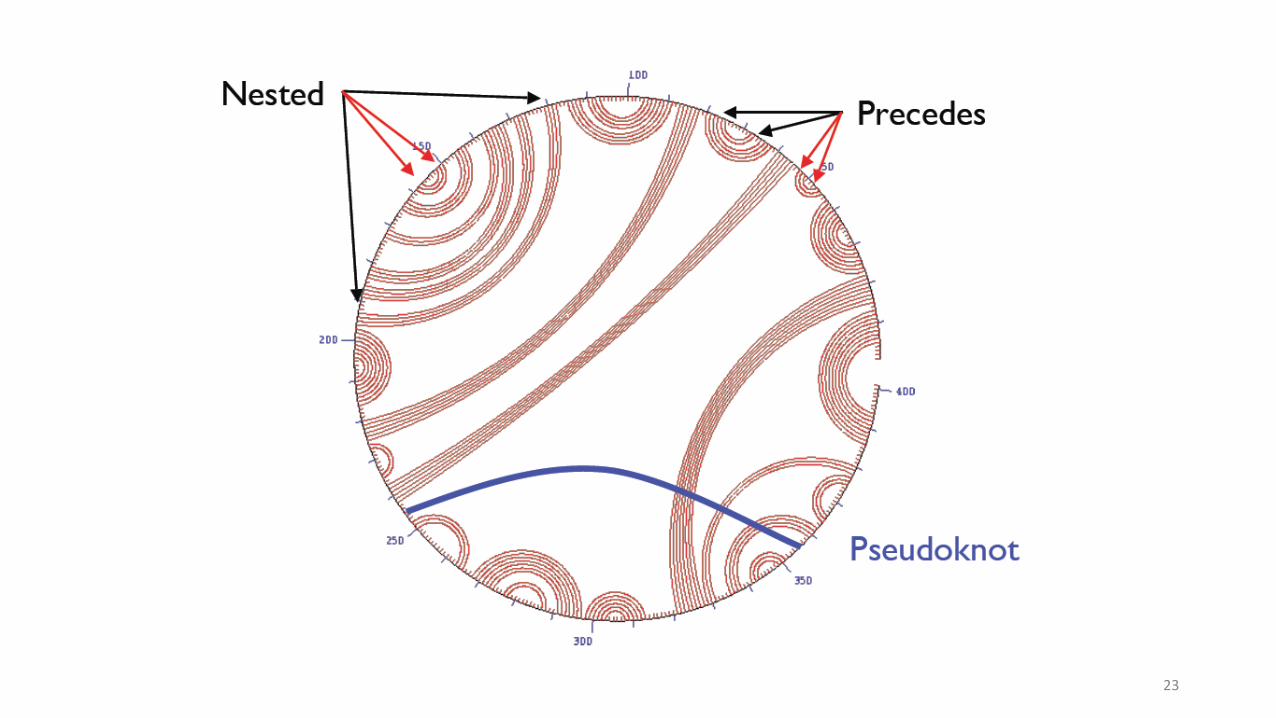
RNA Secondary Structure/Motifs
Single stranded
stem
Bulge loop
Hairpin loop
Multiloopor junction
Interior Loop
Pseudoknot
12

13

14

15

RNA importance
• Ribozymes (RNA enzymes)
• Retroviruses
• Effects on transcription, translation, splicing..
• Functional RNAs: rRNA, tRNA, snRNA, snoRNA, microRNA, RNAi, riboswitches, regulatory elements in 3’ and 5’ UTR
16

RNA motifs
• Function depends on sequence and secondary structure
• Functions include• Protein binding• Basepairing to another RNA• Modifying a nucleic acid bond
• Types:• Single-strand regions• Helices (or stems)• Bulges• Hairpin loops• Internal loops• Junctions
17

RNA Motifs Regulatory Effects
• Regulations of translations
• Processing of RNA
• Catalytic modification of other RNAs
• Transport and position in the cell
• Stability of RNA-transcript
• Expression of encoded proteins
18

Why predict structures?
• Knowing the shape of a biomolecule is invaluable in drug design and understanding disease mechanisms
• Current physical methods (X-Ray, NMR) are too expensive and time-consuming
• Predict shape from sequence of bases
• Four basic structures: helices, loops, bulges and junctions
19
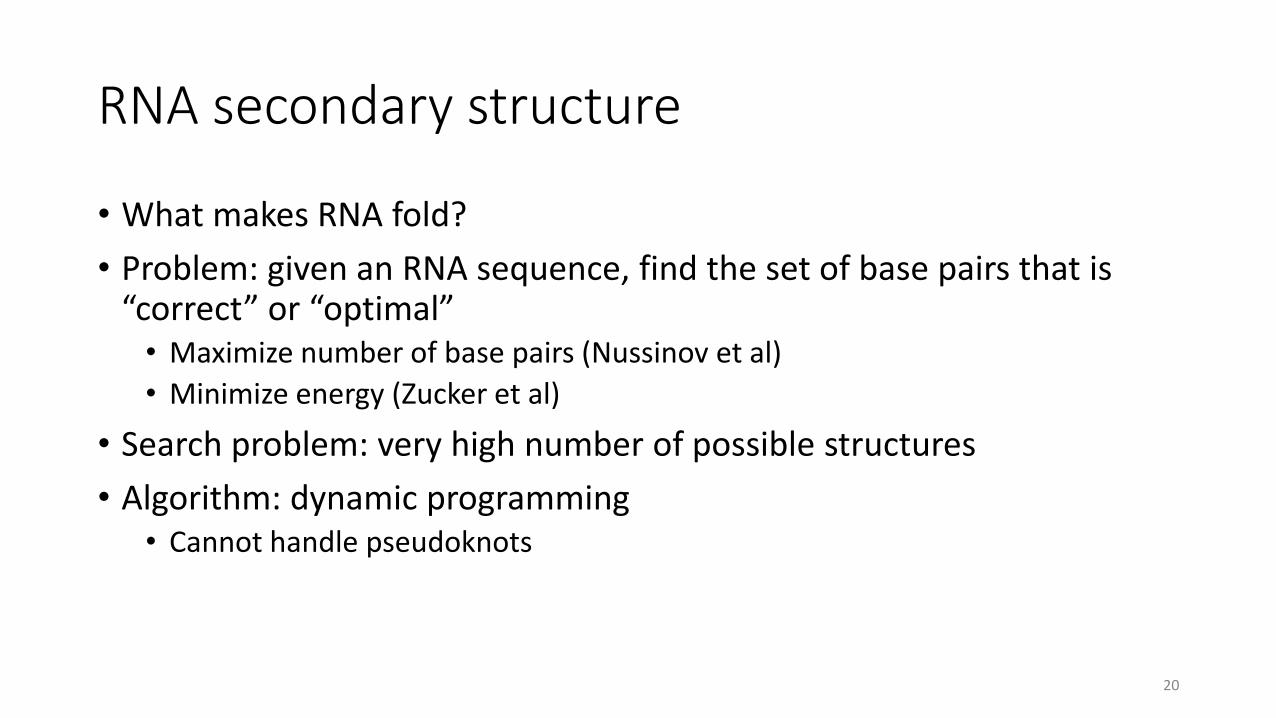
RNA secondary structure
• What makes RNA fold?
• Problem: given an RNA sequence, find the set of base pairs that is “correct” or “optimal”• Maximize number of base pairs (Nussinov et al)
• Minimize energy (Zucker et al)
• Search problem: very high number of possible structures
• Algorithm: dynamic programming• Cannot handle pseudoknots
20

21

22
23

24

25

26

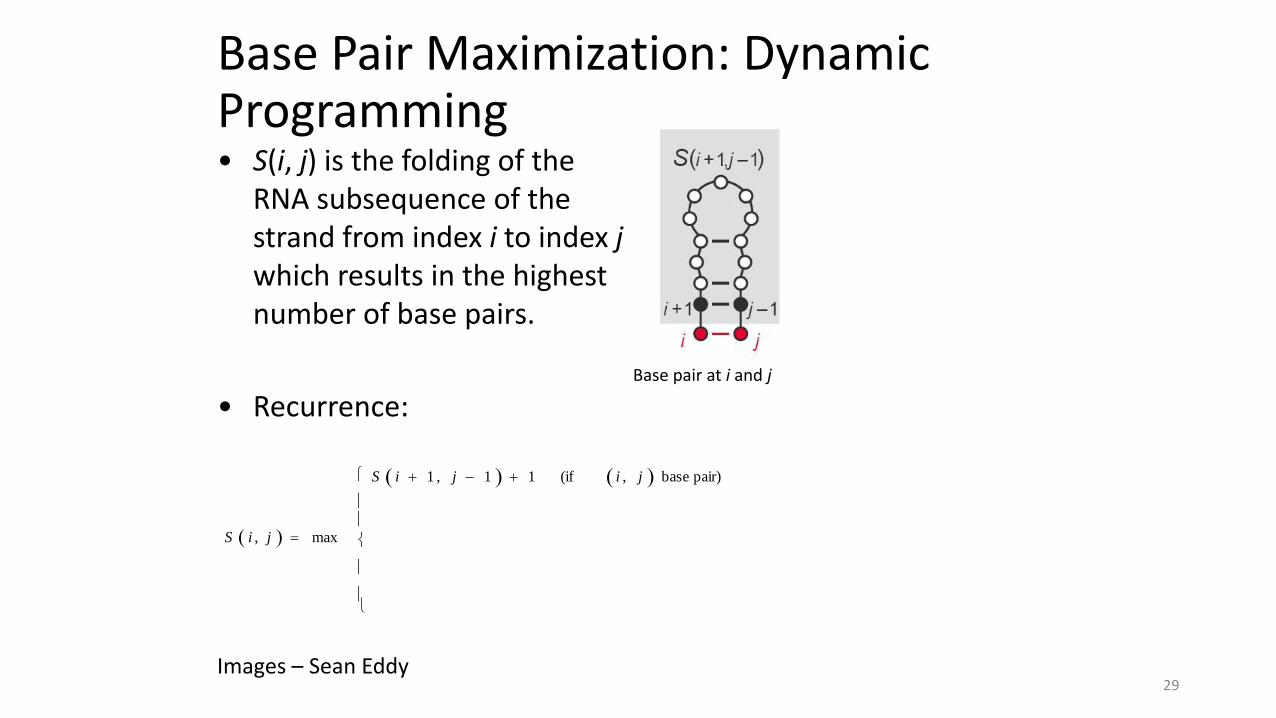
Base Pair Maximization: Dynamic Programming
Images – Sean Eddy
• S(i, j) is the folding of the RNA subsequence of the strand from index i to index jwhich results in the highest number of base pairs.
• Recurrence:
27

Base Pair Maximization: Dynamic Programming
Images – Sean Eddy
S i , j max
• S(i, j) is the folding of the RNA subsequence of the strand from index i to index jwhich results in the highest number of base pairs.
• Recurrence:
28
Base Pair Maximization: Dynamic Programming
Base pair at i and j
Images – Sean Eddy
S i , j max
S i 1 , j 1 1 (if i , j base pair)
• S(i, j) is the folding of the RNA subsequence of the strand from index i to index jwhich results in the highest number of base pairs.
• Recurrence:
29

Base Pair Maximization: Dynamic Programming
Base pair at i and j Unmatched at i
Images – Sean Eddy
S i , j max
S i 1 , j 1 1 (if i , j base pair)
S i 1 , j
• S(i, j) is the folding of the RNA subsequence of the strand from index i to index jwhich results in the highest number of base pairs.
• Recurrence:
30

Base Pair Maximization: Dynamic Programming
Base pair at i and j Unmatched at jUnmatched at i
Images – Sean Eddy
S i , j max
S i 1 , j 1 1 (if i , j base pair)
S i 1 , j
S i , j 1
• S(i, j) is the folding of the RNA subsequence of the strand from index i to index jwhich results in the highest number of base pairs.
• Recurrence:
31

Base Pair Maximization: Dynamic Programming
Base pair at i and j Unmatched at jUnmatched at i
Bifurcation
Images – Sean Eddy
S i , j max
S i 1 , j 1 1 (if i , j base pair)
S i 1 , j
S i , j 1
max1 k j
S i , k S k 1 , j
• S(i, j) is the folding of the RNA subsequence of the strand from index i to index jwhich results in the highest number of base pairs.
• Recurrence:
32

Images – Sean Eddy
Base Pair Maximization: Dynamic Programming
• Alignment Method:• Align RNA strand to itself
• Score increases for feasible base pairs
• Each score independent of overall structure
• Bifurcation adds extra dimension
Images—Sean Eddy33

Images – Sean Eddy
Base Pair Maximization: Dynamic Programming
• Alignment Method:• Align RNA strand to itself
• Score increases for feasible base pairs
• Each score independent of overall structure
• Bifurcation adds extra dimension
Initialize first two diagonals to 0
Images—Sean Eddy34

Images – Sean Eddy
Base Pair Maximization: Dynamic Programming
• Alignment Method:• Align RNA strand to itself
• Score increases for feasible base pairs
• Each score independent of overall structure
• Bifurcation adds extra dimension
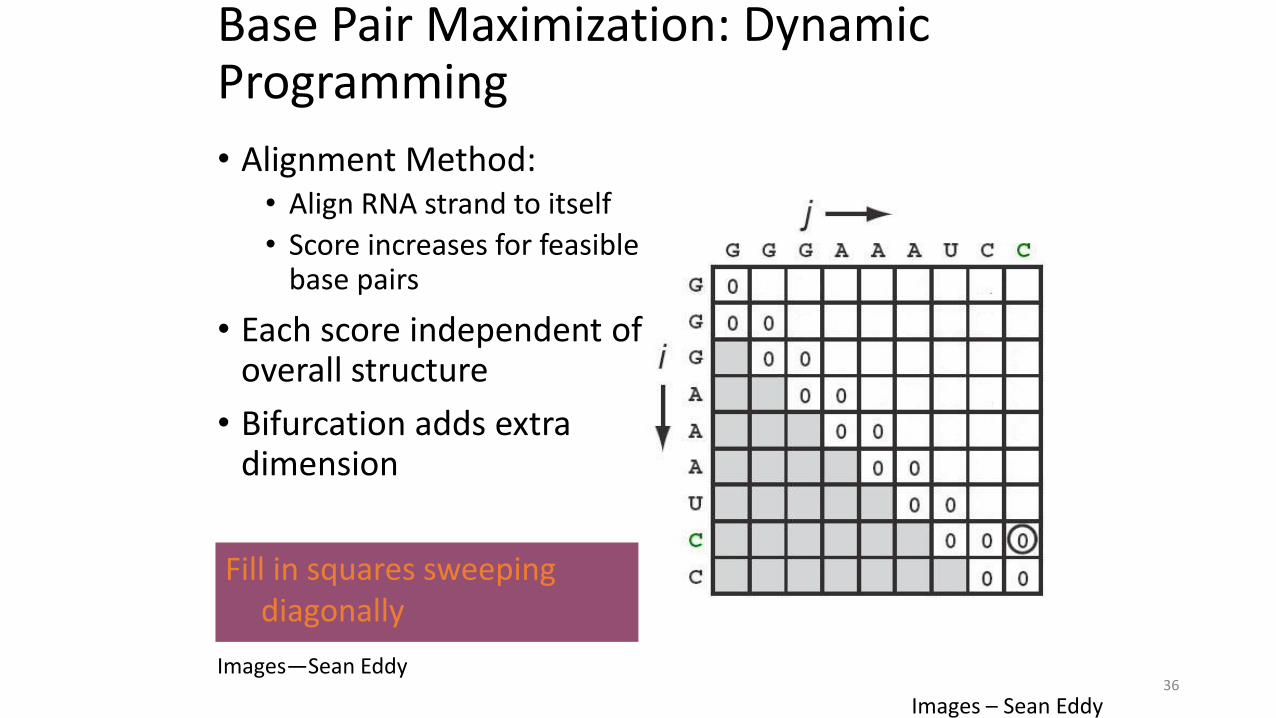
Fill in squares sweeping diagonally
Images—Sean Eddy35
Images – Sean Eddy
Base Pair Maximization: Dynamic Programming
• Alignment Method:• Align RNA strand to itself
• Score increases for feasible base pairs
• Each score independent of overall structure
• Bifurcation adds extra dimension
Fill in squares sweeping diagonally
Images—Sean Eddy36

Images – Sean Eddy
Base Pair Maximization: Dynamic Programming
• Alignment Method:• Align RNA strand to itself
• Score increases for feasible base pairs
• Each score independent of overall structure
• Bifurcation adds extra dimension
Bases cannot pair
Images—Sean Eddy37

Images – Sean Eddy
Base Pair Maximization: Dynamic Programming
• Alignment Method:• Align RNA strand to itself
• Score increases for feasible base pairs
• Each score independent of overall structure
• Bifurcation adds extra dimension
Bases can pair, similar to matched alignment
Images—Sean Eddy38

Images – Sean Eddy
Base Pair Maximization: Dynamic Programming
• Alignment Method:• Align RNA strand to itself
• Score increases for feasible base pairs
• Each score independent of overall structure
• Bifurcation adds extra dimension
Dynamic Programming—possible paths
Images—Sean Eddy39

Images – Sean Eddy
S(i, j – 1)
Base Pair Maximization: Dynamic Programming
• Alignment Method:• Align RNA strand to itself
• Score increases for feasible base pairs
• Each score independent of overall structure
• Bifurcation adds extra dimension
Dynamic Programming—possible paths
Images—Sean Eddy40

Dynamic Programming—possible paths
Images – Sean Eddy
S(i + 1, j)
Base Pair Maximization: Dynamic Programming
• Alignment Method:• Align RNA strand to itself
• Score increases for feasible base pairs
• Each score independent of overall structure
• Bifurcation adds extra dimension
Images—Sean Eddy41

Images—Sean EddyS(i + 1, j – 1) +1
Base Pair Maximization: Dynamic Programming
• Alignment Method:• Align RNA strand to itself
• Score increases for feasible base pairs
• Each score independent of overall structure
• Bifurcation adds extra dimension
Dynamic Programming—possible paths
42

Base Pair Maximization: Dynamic Programming
Bifurcation—add values for all k
Images—Sean Eddy
• Alignment Method:
• Align RNA strand to itself
• Score increases for feasible base pairs
• Each score independent of overall structure
• Bifurcation adds extra dimension
43

Base Pair Maximization: Dynamic Programming
Bifurcation—add values for all k
Images—Sean Eddy
• Alignment Method:
• Align RNA strand to itself
• Score increases for feasible base pairs
• Each score independent of overall structure
• Bifurcation adds extra dimension
44

Base Pair Maximization: Dynamic Programming
Bifurcation—add values for all k
Images—Sean Eddy
• Alignment Method:
• Align RNA strand to itself
• Score increases for feasible base pairs
• Each score independent of overall structure
• Bifurcation adds extra dimension
45

Base Pair Maximization: Dynamic Programming
Bifurcation—add values for all k
Images—Sean Eddy
• Alignment Method:
• Align RNA strand to itself
• Score increases for feasible base pairs
• Each score independent of overall structure
• Bifurcation adds extra dimension
46

Base Pair Maximization: Drawbacks
• Base pair maximization will not necessarily lead to the most stable structure.• It may create structure with many interior loops or hairpins which are
energetically unfavorable.
• Results comparable to aligning sequences with scattered matches—not biologically reasonable.
47

Energy Minimization
• Thermodynamic Stability• Estimated using experimental
techniques.• Theory : Most Stable = Most
likely
• No pseudoknots due to algorithm limitations.
• Attempts to maximize the score, taking thermodynamics into account.
• MFOLD and ViennaRNA
48

49
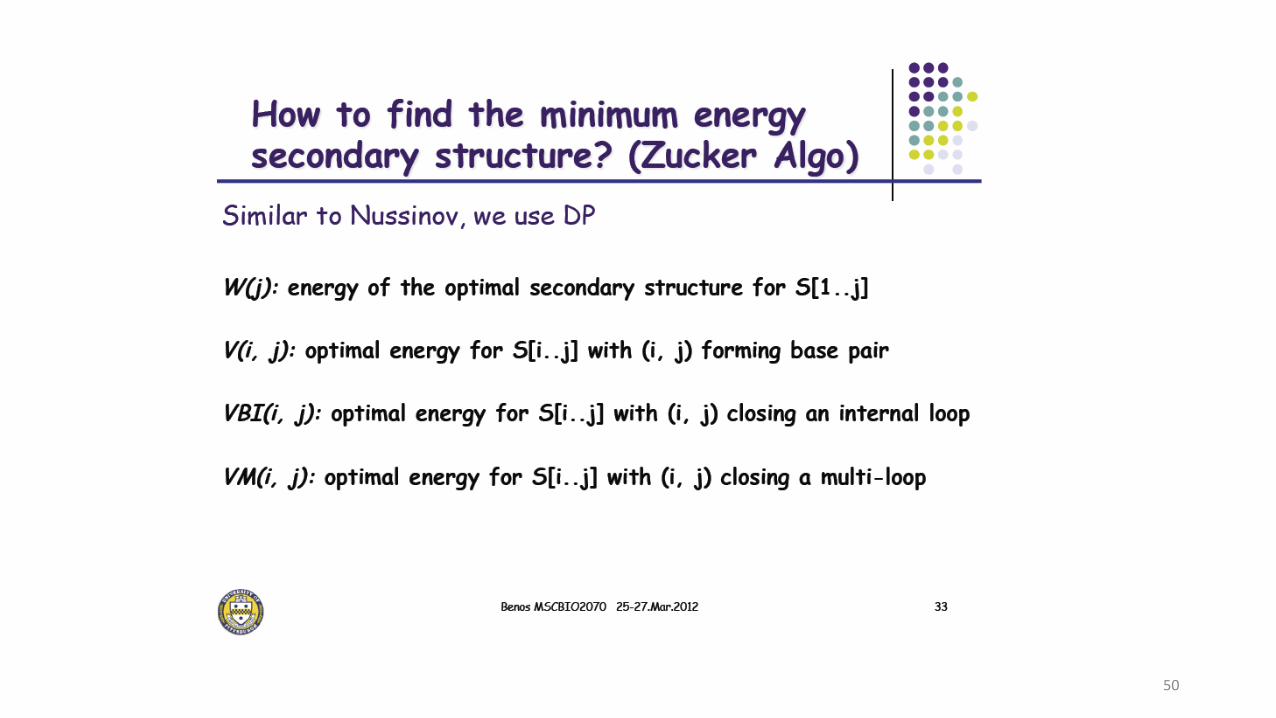
50
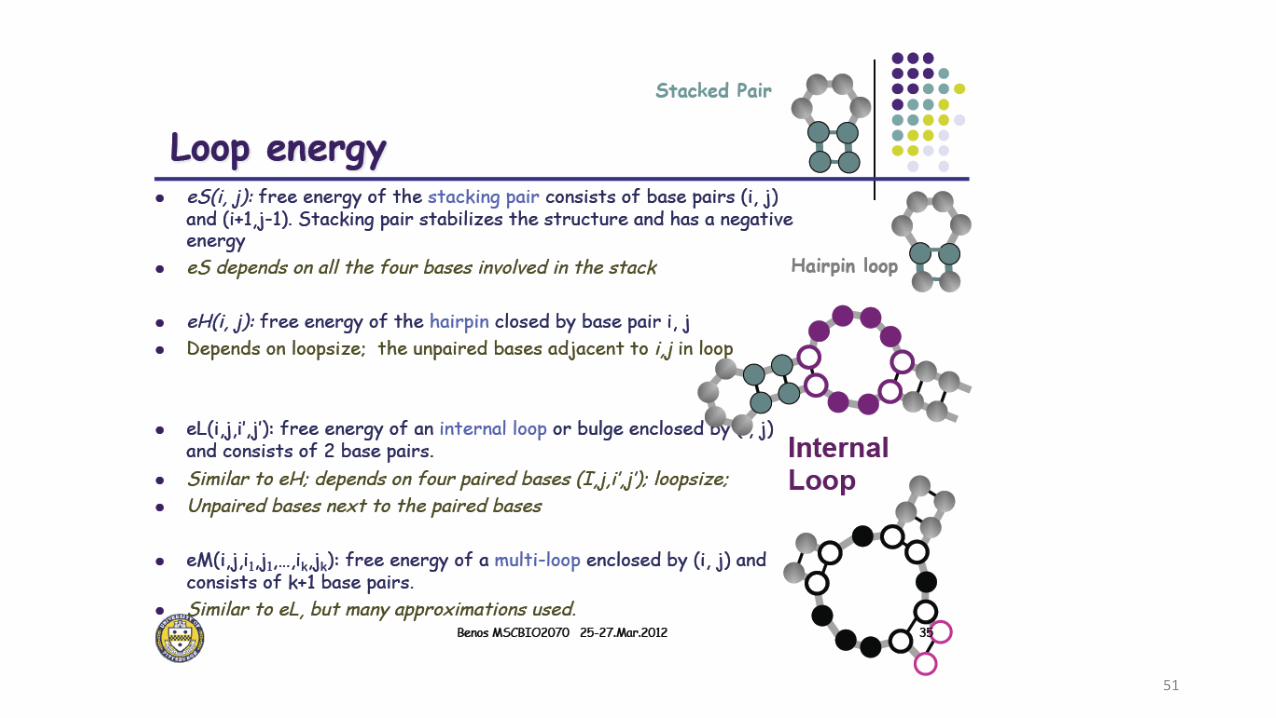
51
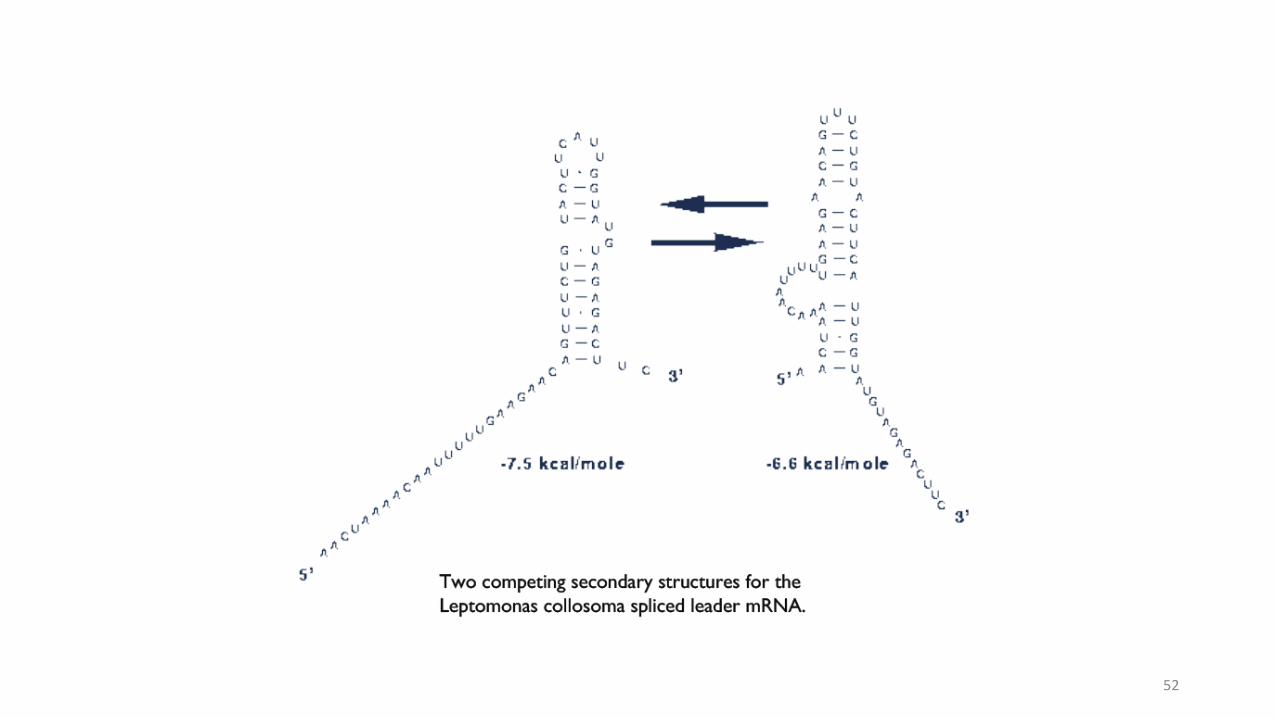
52

Energy Minimization Results• Linear RNA strand folded back on itself to create
secondary structure• Circularized representation uses this requirement
• Arcs represent base pairing
Images – David Mount53

Energy Minimization Results
• All loops must have exactly three bases in them.• Equivalent to having at least three base pairs between arc
endpoints.
Images – David Mount54
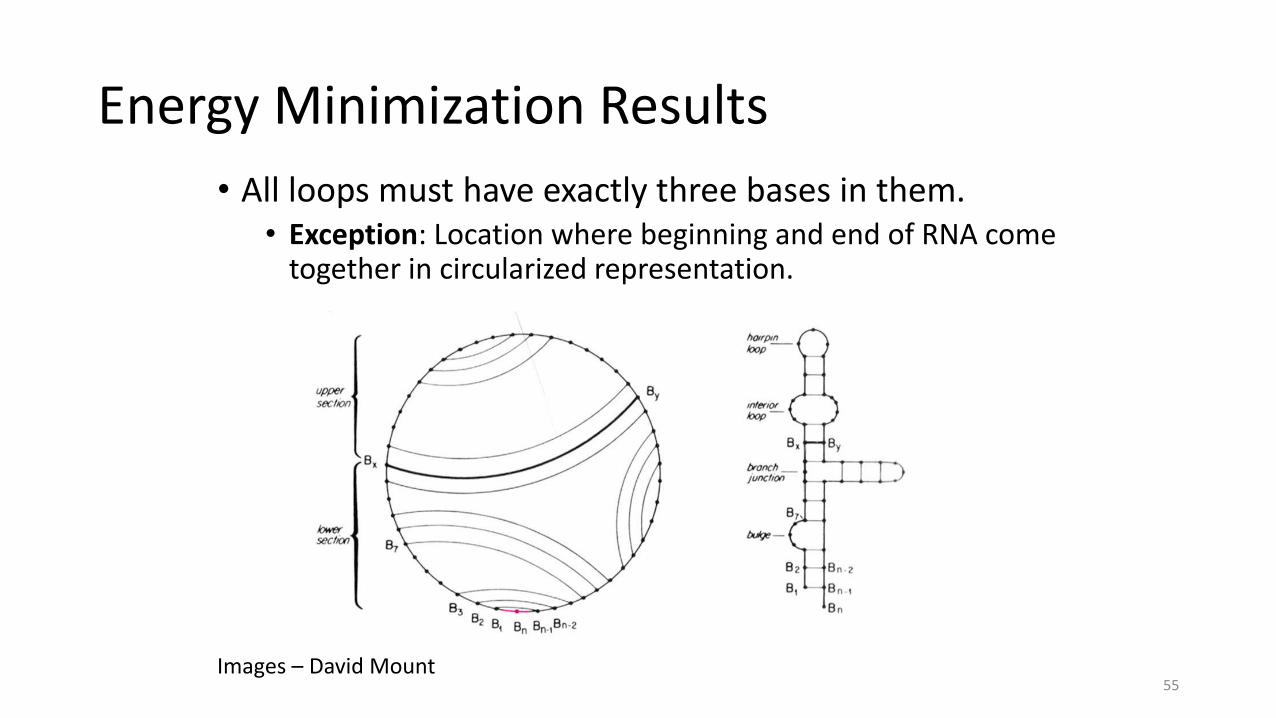
Energy Minimization Results
• All loops must have exactly three bases in them.• Exception: Location where beginning and end of RNA come
together in circularized representation.
Images – David Mount55

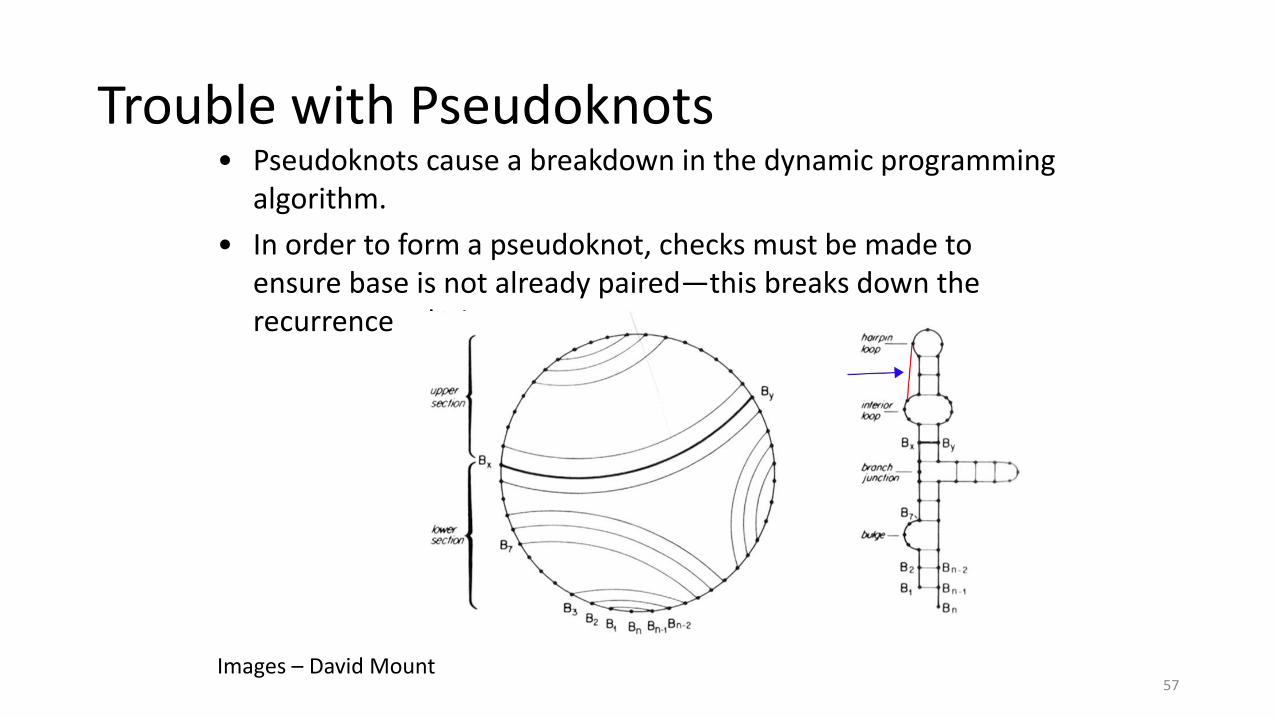
Trouble with Pseudoknots• Pseudoknots cause a breakdown in the dynamic programming
algorithm.
• In order to form a pseudoknot, checks must be made to ensure base is not already paired—this breaks down the recurrence relations.
Images – David Mount56
Trouble with Pseudoknots• Pseudoknots cause a breakdown in the dynamic programming
algorithm.
• In order to form a pseudoknot, checks must be made to ensure base is not already paired—this breaks down the recurrence relations.
Images – David Mount57

Trouble with Pseudoknots• Pseudoknots cause a breakdown in the dynamic programming
algorithm.
• In order to form a pseudoknot, checks must be made to ensure base is not already paired—this breaks down the recurrence relations.
Images – David Mount58

Energy Minimization: Drawbacks
• Computes only one optimal structure.
• Optimal solution may not represent the biologically correct solution.
59
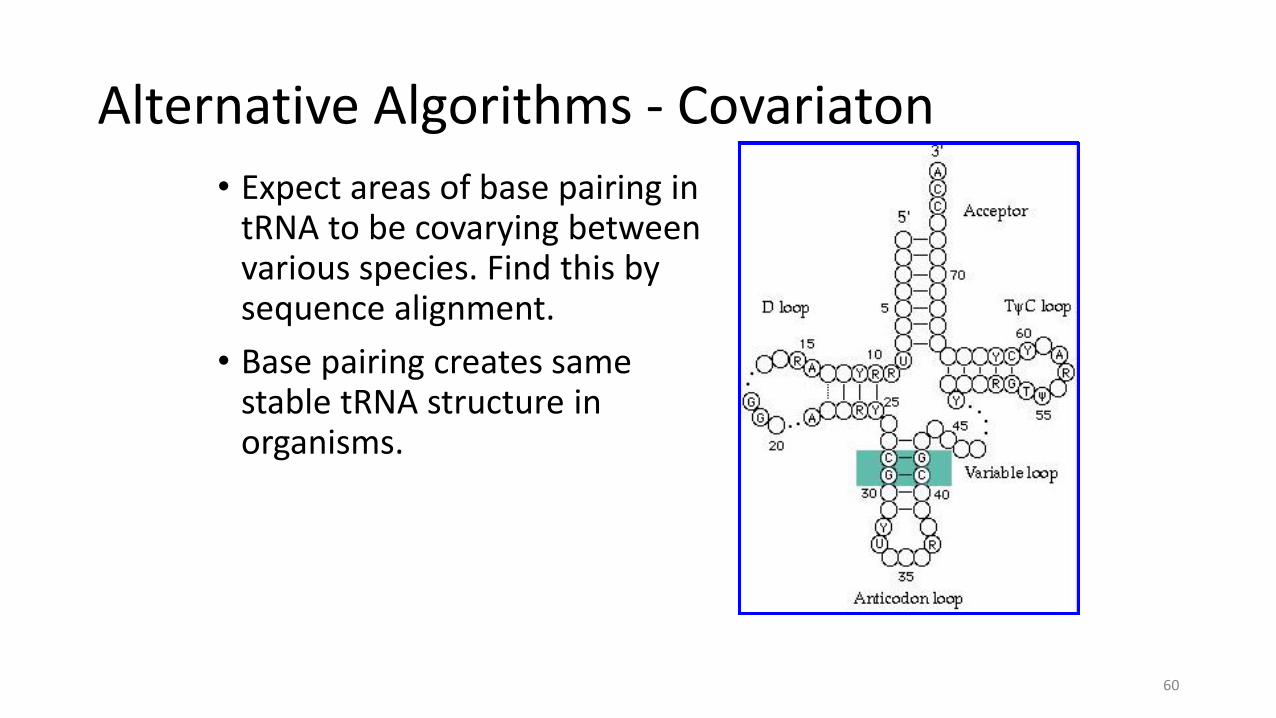
Alternative Algorithms - Covariaton
• Expect areas of base pairing in tRNA to be covarying between various species. Find this by sequence alignment.
• Base pairing creates same stable tRNA structure in organisms.
60

Sequence Alignment to Determine Structure
• Bases pair in order to form backbones and determine the secondary structure.
• Aligning bases based on their ability to pair with each other gives an algorithmic approach to determining the optimal structure.
61

62

63

Alternative Algorithms - Covariaton• Expect areas of base pairing in
tRNA to be covarying between various species.
• Base pairing creates same stable tRNA structure in organisms.
• Mutation in one base yields pairing impossible and breaks down structure.
64

Alternative Algorithms - Covariaton• Expect areas of base pairing in
tRNA to be covarying between various species.
• Base pairing creates same stable tRNA structure in organisms.
• Mutation in one base yields pairing impossible and breaks down structure.
• Covariation ensures ability to base pair is maintained and RNA structure is conserved.
65

66

67

Binary Tree Representation of RNA Secondary Structure
• Representation of RNA structure using Binary tree
• Nodes represent• Base pair if two bases are shown
• Loop if base and “gap” (dash) are shown
• Pseudoknots still not represented
• Tree does not permit varying sequences• Mismatches
• Insertions & Deletions
Images – Eddy et al.68

Binary Tree Representation of RNA Secondary Structure
• Representation of RNA structure using Binary tree
• Nodes represent• Base pair if two bases are shown
• Loop if base and “gap” (dash) are shown
• Pseudoknots still not represented
• Tree does not permit varying sequences• Mismatches
• Insertions & Deletions
Images – Eddy et al.69

Binary Tree Representation of RNA Secondary Structure
• Representation of RNA structure using Binary tree
• Nodes represent• Base pair if two bases are shown
• Loop if base and “gap” (dash) are shown
• Pseudoknots still not represented
• Tree does not permit varying sequences• Mismatches
• Insertions & Deletions
Images – Eddy et al.70

Binary Tree Representation of RNA Secondary Structure
• Representation of RNA structure using Binary tree
• Nodes represent• Base pair if two bases are shown
• Loop if base and “gap” (dash) are shown
• Pseudoknots still not represented
• Tree does not permit varying sequences• Mismatches
• Insertions & Deletions
Images – Eddy et al.71

Covariance Model
• Covariance Model: HMM which permits flexible alignment to an RNA structure – emission and transition probabilities
• Model trees based on finite number of states • Match states – sequence conforms to the model:
• MATP: State in which bases are paired in the model and sequence.
• MATL & MATR: State in which either right or left bulges in the sequence and the model.
• Deletion – State in which there is deletion in the sequence when compared to the model.
• Insertion – State in which there is an insertion relative to model.
72

Covariance Model
• Covariance Model: HMM which permits flexible alignment to an RNA structure – emission and transition probabilities
• Transitions have probabilities.• Varying probability: Enter insertion, remain in current state, etc.
• Bifurcation: No probability, describes path.
73

Covariance Model (CM) Training Algorithm
S i , j max
S i 1 , j 1 M i , j
S i 1 , j
S i , j 1
maxi k j
S i , k S k 1 , j
• S(i, j) = Score at indices i and j in RNA when aligned to the Covariance Model.
• Frequencies obtained by aligning model to “training data”—consists of sample sequences.• Reflect values which optimize alignment of sequences to model.
74

Covariance Model (CM) Training Algorithm
S i , j max
S i 1 , j 1 M i , j
S i 1 , j
S i , j 1
maxi k j
S i , k S k 1 , j
• S(i, j) = Score at indices i and j in RNA when aligned to the Covariance Model.
• Frequencies obtained by aligning model to “training data”—consists of sample sequences.• Reflect values which optimize alignment of sequences to model.
Frequency of seeing the symbols (A, C, G, U) together in locations i and jdepending on symbol.
75

Covariance Model (CM) Training Algorithm
S i , j max
S i 1 , j 1 M i , j
S i 1 , j
S i , j 1
maxi k j
S i , k S k 1 , j
• S(i, j) = Score at indices i and j in RNA when aligned to the Covariance Model.
• Frequencies obtained by aligning model to “training data”—consists of sample sequences.• Reflect values which optimize alignment of sequences to model.
Independent frequency of seeing the symbols (A, C, G, T) in locations i or j depending on symbol.
76

Covariance Model (CM) Training Algorithm
S i , j max
S i 1 , j 1 M i , j
S i 1 , j
S i , j 1
maxi k j
S i , k S k 1 , j
• S(i, j) = Score at indices i and j in RNA when aligned to the Covariance Model.
• Frequencies obtained by aligning model to “training data”—consists of sample sequences.• Reflect values which optimize alignment of sequences to model.
Independent frequency of seeing the symbols (A, C, G, U) in locations i or j depending on symbol.
77

Alignment to CM Algorithm
• Calculate the probability score of aligning RNA to CM.
• Three dimensional matrix—O(n³)• Align sequence to given subtrees
in CM.• For each subsequence, calculate
all possible states.
• Subtrees evolve from bifurcations• For simplicity, left singlet is
default.
Images—Eddy et al.78

Alignment to CM Algorithm
• For each calculation, take into account:
• Transition (T) to next state.
• Emission probability (P) in the state as determined by training data.
Images—Eddy et al.79

Alignment to CM Algorithm
• For each calculation, take into account:
• Transition (T) to next state.
• Emission probability (P) in the state as determined by training data.
Images—Eddy et al.80

Alignment to CM Algorithm
• For each calculation, take into account:
• Transition (T) to next state.
• Emission probability (P) in the state as determined by training data.
Images—Eddy et al.81

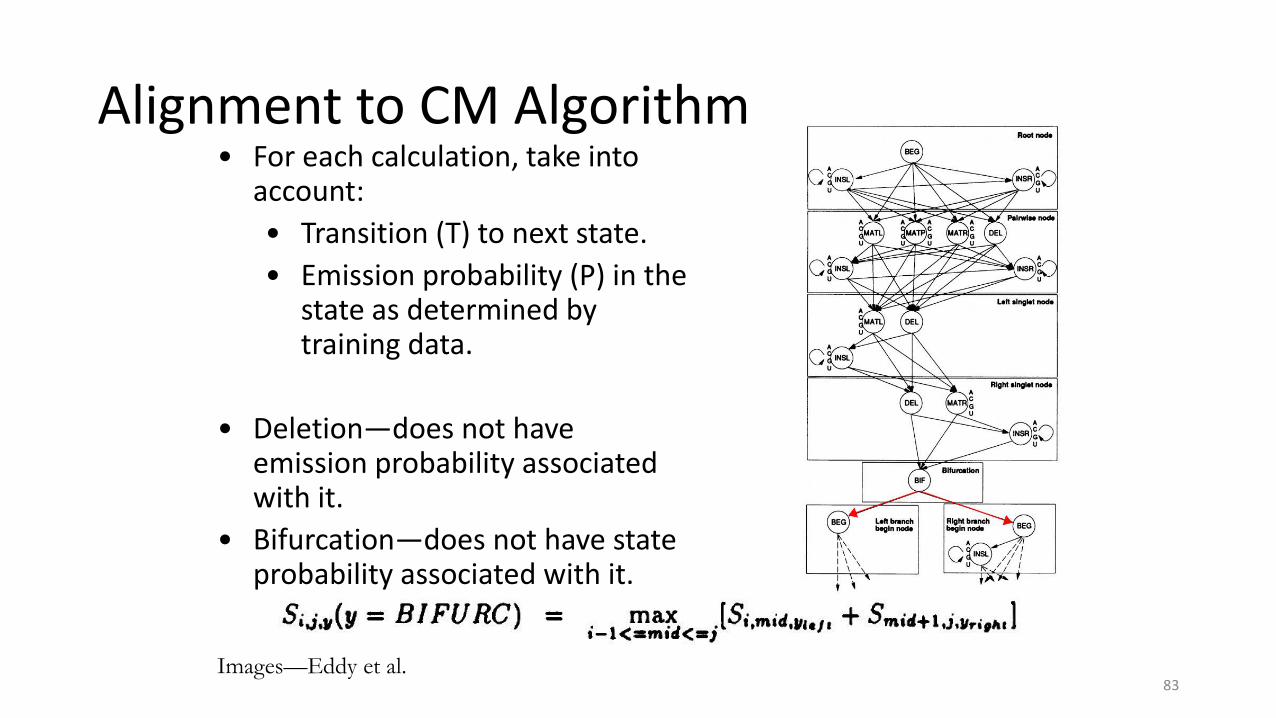
Alignment to CM Algorithm• For each calculation, take into
account:
• Transition (T) to next state.
• Emission probability (P) in the state as determined by training data.
• Deletion—does not have emission probability associated with it.
Images—Eddy et al.82
Alignment to CM Algorithm• For each calculation, take into
account:
• Transition (T) to next state.
• Emission probability (P) in the state as determined by training data.
• Deletion—does not have emission probability associated with it.
• Bifurcation—does not have state probability associated with it.
Images—Eddy et al.83

Covariance Model Drawbacks
• Needs to be well trained.
• Not suitable for searches of large RNA.• Structural complexity of large RNA cannot be modeled
• Runtime
• Memory requirements
84