rna editing genes associated with extreme old age in humans
TRANSCRIPT
RNA Editing Genes Associated with Extreme Old Age inHumans and with Lifespan in C. elegansPaola Sebastiani1.*, Monty Montano2.*, Annibale Puca3, Nadia Solovieff1, Toshio Kojima4, Meng C.
Wang5, Efthymia Melista6, Micah Meltzer2, Sylvia E. J. Fischer5, Stacy Andersen7, Stephen H. Hartley1,
Amanda Sedgewick8, Yasumichi Arai9, Aviv Bergman10, Nir Barzilai11, Dellara F. Terry7, Alberto Riva12,
Chiara Viviani Anselmi3, Alberto Malovini3, Aya Kitamoto4, Motoji Sawabe13, Tomio Arai13, Yasuyuki
Gondo14, Martin H. Steinberg6, Nobuyoshi Hirose9, Gil Atzmon11, Gary Ruvkun5, Clinton T. Baldwin6",
Thomas T. Perls7"
1 Department of Biostatistics, Boston University School of Public Health, Boston, Massachusetts, United States of America, 2 Department of Medicine Sections of Infectious
Diseases, Boston University School of Medicine, Boston, Massachusetts, United States of America, 3 Department of Genetics, IRCCS Multimedica, Milan, Italy,
4 Computational Systems Biology Research Group, Advanced Science Institute, RIKEN, Yokohama, Kanagawa, Japan, 5 Department of Genetics, Massachusetts General
Hospital and Harvard Medical School, Boston, Massachusetts, United States of America, 6 Center for Human Genetics, Boston University School of Medicine, Boston,
Massachusetts, United States of America, 7 Geriatrics Section, Department of Medicine, Boston University School of Medicine, Boston, Massachusetts, United States of
America, 8 Department of Bioengineering, Boston University School of Engineering, Boston, Massachusetts, United States of America, 9 Division of Geriatric Medicine,
Department of Internal Medicine, Keio University School of Medicine, Tokyo, Japan, 10 Department of Systems & Computational Biology, Albert Einstein College of
Medicine, Bronx, New York, United States of America, 11 Institute of Aging Research and Diabetes Research Center, Departments of Medicine and Genetics, Albert Einstein
College of Medicine, Bronx, New York, United States of America, 12 Department of Molecular Genetics and Microbiology, University of Florida at Gainesville, Florida,
United States of America, 13 Department of Pathology, Tokyo Metropolitan Geriatric Hospital, Tokyo, Japan, 14 Clinical Thanatology and Geriatric Behavioral Science,
Graduate School of Human Sciences, Osaka University, Suita, Osaka, Japan
Abstract
Background: The strong familiality of living to extreme ages suggests that human longevity is genetically regulated. Themajority of genes found thus far to be associated with longevity primarily function in lipoprotein metabolism and insulin/IGF-1 signaling. There are likely many more genetic modifiers of human longevity that remain to be discovered.
Methodology/Principal Findings: Here, we first show that 18 single nucleotide polymorphisms (SNPs) in the RNA editinggenes ADARB1 and ADARB2 are associated with extreme old age in a U.S. based study of centenarians, the New EnglandCentenarian Study. We describe replications of these findings in three independently conducted centenarian studies withdifferent genetic backgrounds (Italian, Ashkenazi Jewish and Japanese) that collectively support an association of ADARB1and ADARB2 with longevity. Some SNPs in ADARB2 replicate consistently in the four populations and suggest a strong effectthat is independent of the different genetic backgrounds and environments. To evaluate the functional association of thesegenes with lifespan, we demonstrate that inactivation of their orthologues adr-1 and adr-2 in C. elegans reduces mediansurvival by 50%. We further demonstrate that inactivation of the argonaute gene, rde-1, a critical regulator of RNAinterference, completely restores lifespan to normal levels in the context of adr-1 and adr-2 loss of function.
Conclusions/Significance: Our results suggest that RNA editors may be an important regulator of aging in humans andthat, when evaluated in C. elegans, this pathway may interact with the RNA interference machinery to regulate lifespan.
Citation: Sebastiani P, Montano M, Puca A, Solovieff N, Kojima T, et al. (2009) RNA Editing Genes Associated with Extreme Old Age in Humans and with Lifespanin C. elegans. PLoS ONE 4(12): e8210. doi:10.1371/journal.pone.0008210
Editor: Joanna Mary Bridger, Brunel University, United Kingdom
Received July 22, 2009; Accepted November 3, 2009; Published December 14, 2009
Copyright: � 2009 Sebastiani et al. This is an open-access article distributed under the terms of the Creative Commons Attribution License, which permitsunrestricted use, distribution, and reproduction in any medium, provided the original author and source are credited.
Funding: This work was supported by National Institutes of Health grants: R01 HL087681 (to M.H.S), K24 AG025727 (to T.T.P), R01 AR055115 (to M.M.), RO1 AG027216(to C.B.), the Italian Ministry of Research and University (to A. P. and A. M), and the following grants to G.A, A.B. and N.B.: AG-027734, AG-18728, RR-12248, DK-20541,and M01-RR12248 and a grant from the Glenn Foundation. M.C.W. is supported by a Life Sciences Research Foundation fellowship. S.E.J.F. is supported by the MGHECOR Fund for Medical Discovery. The funders had no role in study design, data collection and analysis, decision to publish, or preparation of the manuscript.
Competing Interests: The authors have declared that no competing interests exist.
* E-mail: [email protected] (PS); [email protected] (MM)
. These authors contributed equally to this work.
" These authors also contributed equally to this work.
Introduction
Exceptional longevity (EL) in humans, defined as living to
extreme old ages such as 100 years and older, is strongly familial
[1–8] and the factors that facilitate such exceptional survival
have broad public health significance including a marked delay
in age-related disability [9–11] and certain age-related diseases
[12–14]. Genetically, exceptional longevity is presumed to be a
complex trait [15–19]. Several candidate gene association
studies have been successful in discovering longevity-associated
PLoS ONE | www.plosone.org 1 December 2009 | Volume 4 | Issue 12 | e8210

genes in humans. However, these variants have been mainly
related to lipoprotein metabolism [20–22], FOXO proteins
[23,24], and insulin/IGF-1 signaling [25] It is likely that many
more genetic modifiers of human aging have yet to be discovered
[25].
In this study, we investigate two genes in the A(adenosine) to I
(inosine) RNA editing pathway, a post-transcriptional process by
which adenosine residues are converted to inosine resulting in a
change in gene expression or protein function. Targets of RNA
editing include a large number of genes as well as micro RNA.
Thus, it is not surprising that such a non-specific cellular process
would be involved in a general maintenance of cellular health and
lifespan. However, such an implication has not been previously
demonstrated.
Here, we first report significant association of these genes with
EL in four centenarian studies that include the New England
Centenarian Study (NECS), with more than 1,500 US individuals
of primarily North European ancestry, aged between 90 and 119
years; the Southern Italian Centenarian Study (SICS) –a study of
nonagenarians and centenarians from a closed population of
Cilento, South Italy; the Ashkenazi Jewish Centenarian Study
(AJCS), a study of approximately 300 nonagenarians and
centenarians from a founder population of North Eastern
European background, all resident in the US; and the Japanese
Centenarian Study (JCS), a study of Japanese centenarians that
has focused on ‘‘semi-supercentenarians’’ subjects living past 105
years [26]. The characteristics of the four populations allow us to
assess the robustness of the associations to varying genetic
background and environment.
We further evaluate the functional significance of the RNA
editing candidate genes in C. elegans lifespan studies and show that
silencing orthologs of these genes reduces median survival by 50%.
We also show that life span is fully restored by additional
knockdown of an RNA interference gene, supporting the
functional role of these genes in determining lifespan and
implicating a novel axis for future aging studies.
Results and Discussion
Selection of Candidate GenesWe selected the two genes to study for multiple reasons. First, in
a preliminary genome wide screening using pooled DNA samples
from approximately 130 male centenarians and 130 younger male
controls from the NECS [27], we identified several single
nucleotide polymorphisms (SNPs) in the RNA-editing genes
ADARB1 (21q22.3), and ADARB2 (10p15.3) that were associated
with extreme old age. ADARB1 exhibited the strongest evidence
for genetic association with 5 SNPs that met genome-wide
significance, with the posterior odds of allelic association .1,500
[27]. The probability of these 5 SNPs simultaneously associated
under the null hypothesis of no association was 10213 based upon
a hyper-geometric distribution. Second, this gene lies in chromo-
some 21q21 and trisomy 21 (Down syndrome) resembles
accelerated aging, with premature age-related changes including
in the skin and hair, increased frequency of premature cataracts,
hearing loss, menopause and Alzheimer’s disease [28] suggesting
that genes in chromosome 21 could affect lifespan. Third, among
the top genes identified from the preliminary genetic screen, RNA
editing represents a general cellular process that might be expected
to improve cellular health; and RNA editing activity has been
associated with innate immune response [29,30] and age-related
syndromes that include dementia and amyotrophic lateral sclerosis
(ALS) [31].
Subjects Selected for the Association StudyFrom the NECS, genotype data were obtained from 281 males,
aged 96–114 years and 596 females, aged 100–119 years. We
selected cutoff ages of 96 years for males and 100 years for females
of the NECS to focus on the extreme top 1% survival based on the
U.S. Social Security Administration cohort life table (http://www.
ssa.gov/OACT/NOTES/as116/as116LOT.html). NECS refer-
ent cohort subjects consisted of 270 spouses of centenarian
offspring and children of parents who died at the mean age of 73
years (average life expectancy for the parents’ birth cohort).
Additional referent subjects were selected from the Illumina
iControlDB database using genome-wide genetic matching as
detailed in the methods (n = 1635). Note that approximately 100
male centenarians included in the pooling-based genome screen-
ing overlap with this second set. Given that the overlap is relatively
small (,10%) and that the subsequent analysis uses a different
analytic approach (genotype data from individual subjects), we do
not think the overlap is a significant concern.
From the SICS, we used genotype data from 271 males, ages
90–108 years and 188 females, aged 90–109 years (total = 459).
Data from 200 male and 132 female SICS referent cohort subjects
aged 18–48 years were used in this analysis. From the AJCS,
genotype data were obtained from 299 oldest subjects (108 males
aged 95 and older and 191 females aged 99 and older) and 269
younger referent cohort subjects (spouses of the offspring of
centenarians, aged 85 and younger, without evidence of parental
longevity). Four hundred and seventy oldest old subjects (82 males
aged 100–110 years and 388 females, aged 100–116 years) and
538 referent cohort subjects (randomly selected Japanese subjects,
aged 19–89 years) constituted the Japanese association study.
Table 1 reports further summaries of subjects’ characteristics. Ages
of the extreme old were validated with birth certificates (in the case
Table 1. Study Subjects characteristics.
Males Females All Males Females All
NECS oldest old NECS controls
Sample Size 281 596 877 149 121 270
Median Age 102 103 103 75 74 75
Age Range 96–114 100–119 96–119 58–85 53–85 53–85
SICS oldest old SICS controls
Sample Size 271 188 459 200 132 332
Median Age 94 98 96 34 32 33
Age Range 90–109 90–109 90–109 18–48 18–48 18–48
NA Illumina controls
Sample Size 418 1217 1635
Median Age 47 46 47
Age Range 30–75 30–75 30–75
AJCS oldest old AJCS controls
Sample Size 108 191 299 118 151 269
Median Age 99 101 100 77 73 73
Age Range 95–108 99–112 95–112 54–85 46–85 46–85
JCS oldest old JCS controls
Sample Size 82 388 470 178 360 538
Median Age 104 106 106 21 72 69
Age Range 100–111 100–116 100–116 19–89 19–89 19–89
Reported are summaries of the last contact ages.doi:10.1371/journal.pone.0008210.t001
RNA Editing and Oldest Age
PLoS ONE | www.plosone.org 2 December 2009 | Volume 4 | Issue 12 | e8210

of the JCS, the Basic Resident Registration Card). All subjects
were enrolled by studies with Institutional Review Board approval
and oversight.
Association of ADARB1 with Exceptional LongevityWe examined the associations of 31 SNPs in ADARB1 in the
NECS and SICS samples using recessive and dominant models
with Bayesian logistic regression [32]. The details of the statistical
analysis are in the Methods and the significant results are
summarized in Table 2 that provides the physical positions and
allele frequencies derived from the HapMap for these SNPs, and
Table 3 (rows 14–15). Five SNPs in ADARB1 are strongly
associated with extreme old age in the NECS, and the association
of SNP rs414743 remains significant even after imposing
stringent corrections for multiple comparisons (Bayesian signif-
icance ,0.05/145 = 0.00035 where 145 is the overall number of
SNPs included in this analysis). The five SNPs tag one region of
strong linkage disequilibrium (LD) of the gene (Figure 1). None of
the SNPs reached statistical significance in the SICS although the
three SNPs rs2838809, rs2838810 and rs2838816 exhibited
consistent associations in terms of odds ratios and allele
frequencies and, when the NECS and SICS data were combined,
the three SNPs remained statistically significant. These three
SNPs have extreme minor allele frequencies in the NECS
centenarians (MAF,0.01), while the allele frequencies in the
controls are very close to referent allele frequencies from the
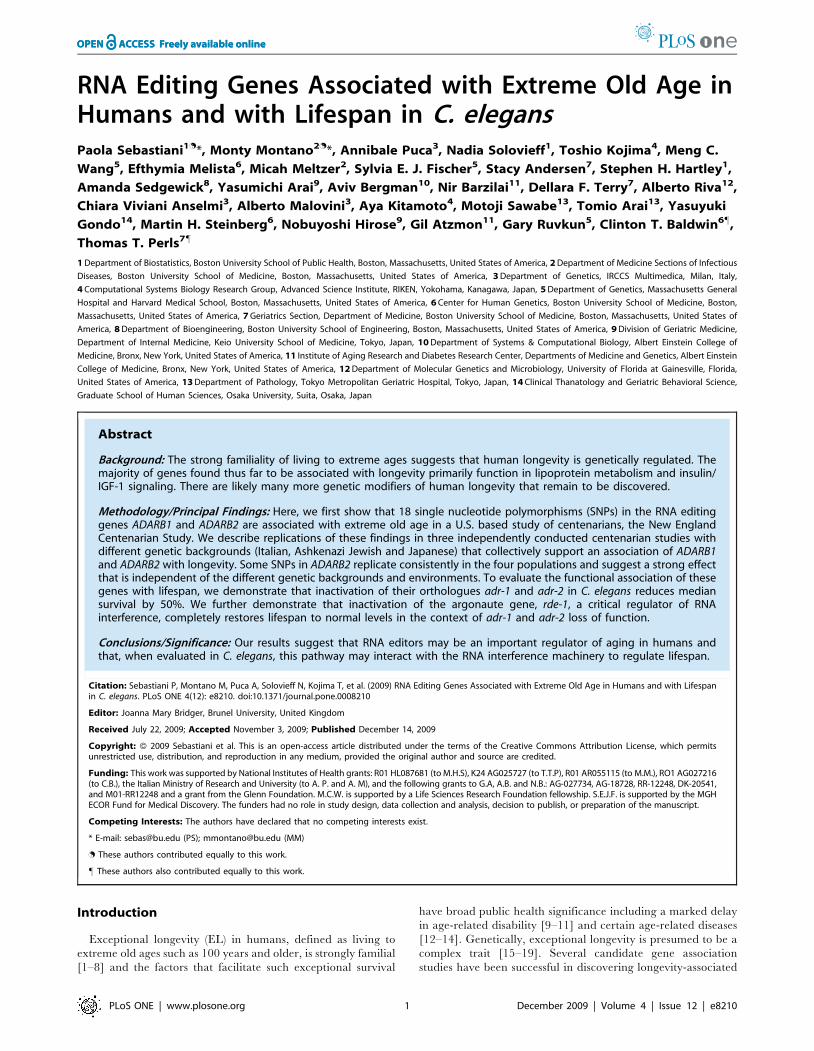
HapMap (Table 3). Figure 2 displays the scatter plot of genotype
intensities generated from BeadStudio that rules out genotyping
errors thus suggesting that these are real associations and not
artifacts.
To further test the generalizability of these results to other
independent groups, we evaluated these associations in the
AJCS and the JCS, using a combination of proxy SNPs typed
with the Affymetrix platforms and SNPs in Table 3 typed with
more traditional techniques (See methods). Table 4 summa-
rizes the results of the replication study of 4 of the 5 SNPs and
one additional proxy SNP is in Table 5. None of these SNPs in
ADARB1 replicates the results in the NECS and SICS samples
although the significant association of the SNP rs17004734
that is within 2Kb from rs414743 is consistent with the
presence of longevity associated variants in the region. Because
the SNPs used in the NECS and SICS are chosen to best
capture the genetic variations of Caucasians from the
HapMap, they may not be the correct choice for this founder
population and indeed Figure 1 shows a different pattern of
LD in ADARB1 in the AJCS subjects. All ADARB1 SNPs in
Table 3 and two additional proxy SNPs were genotyped in the
JCS subjects and Tables 6 and 7 summarize the results. The
last three SNPs in Table 6 show effects that are consistent with
the NECS and SICS subjects but do not reach statistical
significance, even when the data from the three studies are
aggregated. Figure 3 shows the posterior densities of the ORs
for the three rare SNPs that are suggestive of association but
would need much larger sample sizes to reach statistical
significance. The association of two proxy SNPs for rs2838816
in Table 7 is again consistent with the presence of longevity
Table 2. Summary of selected SNPs.
Row SNP Chr positionRisk versusreferent alleles CEPH JPT
1 rs10903420 10 1333726 AA v AG/GG 0.327 0.058
2 rs1007147 10 1341088 AA v AG/GG 0.312 0.091
3 rs2805562 10 1357514 AA v AG/GG 0.15 0.058
4 rs884949 10 1361610 AA v AC/CC 0.124 0
5 rs2805533 10 1374633 AA/AG v GG 0.77 0.92
6 rs2387653 10 1397826 AA v AG/GG 0.097 0
7 rs2805535 10 1450432 AA v AG/GG 0.699 0.151
8 rs2805543 10 1454892 AA v AG/GG 0.46 0.105
9 rs3898610 10 1474759 AA v AG/GG 0.841 0.686
10 rs1533484 10 1481339 AA/AG v GG 0.442 0.791
11 rs2676192 10 1495474 AA v AG/GG 0.301 0.419
12 rs2387952 10 1657365 AA v AG/GG 0.69 0.616
13 rs17294019 10 1659347 AA/AG v GG 0.196 0.012
14 rs3788157 21 45335136 AA v AG/GG 0.63 0.65
15 rs414743 21 45336503 AA/AG v GG 0.47 0.31
16 rs2838809 21 45445866 AA v AG/GG 0.009 0
17 rs2838810 21 45447751 AA/AG v GG 1 1
18 rs2838816 21 45454470 AA v AG/GG 0.009 0
List of 18 SNPs —13 in the gene ADARB2 (10p15.3) and 5 in the gene ADARB1 (21q22.3) — that are associated with exceptional longevity with either dominant orrecessive models. The table reports a sequential number for easy identification in the other tables and figures (column 1), the SNP identifier from dbSNP (column 2),chromosome and physical position from the human genome NCBI Build 36.3 (columns 3 and 4), the risk versus referent alleles that were associated with exceptionallongevity using dominant and recessive models (column 5), the frequencies of the risk allele in the HapMap CEPH and JPT. Note that several of alleles in the Japanesegroup have allele frequencies that change substantially from the CEPH, and the SNPs in rows 4 and 6 become monomorphic.doi:10.1371/journal.pone.0008210.t002
RNA Editing and Oldest Age
PLoS ONE | www.plosone.org 3 December 2009 | Volume 4 | Issue 12 | e8210

Ta
ble
3.
SNP
sin
AD
AR
B2
(10
p1
5.3
)an
dA
DA
RB
1(2
1q
22
.3)
that
are
asso
ciat
ed
wit
he
xce
pti
on
allo
ng
evi
tyin
NEC
San
dSI
CS
sub
ject
s.
Ro
wS
NP
Ris
kv
ers
us
refe
ren
ta
lle
les
CE
PH
NE
CS
(87
7o
lde
sto
ld,
18
08
con
tro
ls)
SIC
S(4
59
old
est
old
,4
29
con
tro
ls)
NE
CS
+SIC
S
OR
Ba
ye
ssi
gp
(A)
OR
Ba
ye
ssi
gp
(A)
OR
Ba
ye
ssi
gp
(A)
AD
AR
B2
1rs
10
90
34
20
AA
vA
G/G
G0
.32
71
.28
(1.0
7;1
.53
)0
.00
48
0.2
8/0
.23
1.1
4(0
.84
;1.5
4)
0.1
21
20
.28
/0.2
51
.25
(1.0
7;1
.45
)0
.00
20
0.2
8/0
.24
2rs
10
07
14
7A
Av
AG
/GG
0.3
12
1.3
5(1
.13
;1.6
4)
0.0
01
50
.27
/0.2
21
.25
(0.9
2;1
.66
)0
.20
40
0.2
9/0
.25
1.3
4(1
.15
;1.5
9)
0.0
00
30
.27
/0.2
2
3rs
28
05
56
2A
Av
AG
/GG
0.1
51
.22
(0.9
6;1
.54
)0
.05
00
0.1
5/0
.12
1.3
8(0
.97
;1.9
7)
0.0
38
40
.20
/0.1
51
.32
(1.0
9;1
.59
)0
.00
22
0.1
6/0
.13
4rs
88
49
49
AA
vA
C/C
C0
.12
41
.19
(0.9
2;1
.53
)0
.09
11
0.1
2/0
.10
1.3
1(0
.87
;1.9
6)
0.0
97
80
.14
/0.1
11
.24
(1.0
1;1
.54
)0
.02
11
0.1
2/0
.10
5rs
28
05
53
3A
A/A
Gv
GG
0.7
70
.91
(0.7
5;1
.12
)0
.19
04
0.7
8/0
.81
0.8
3(0
.60
;1.1
4)
0.1
21
70
.76
/0.7
90
.86
(0.7
2;1
.02
)0
.03
81
0.7
9/0
.81
6rs
23
87
65
3A
Av
AG
/GG
0.0
97
1.1
7(0
.91
;1.5
0)
0.1
05
30
.14
/0.1
21
.12
(0.7
8;1
.62
)0
.26
99
0.1
70
.16
1.2
1(0
.99
;1.4
9)
0.0
34
30
.15
/0.1
3
7rs
28
05
53
5A
Av
AG
/GG
0.6
99
1.3
6(1
.02
;1.8
3)
0.0
24
90
.75
/0.6
91
.31
(0.9
7;1
.79
)0
.03
95
0.7
2/0
.66
1.3
7(1
.11
;1.6
8)
0.0
01
70
.74
/0.6
8
8rs
28
05
54
3A
Av
AG
/GG
0.4
61
.23
(1.0
4;1
.45
)0
.00
55
0.5
4/0
.49
1.3
6(1
.03
;1.7
6)
0.0
15
60
.51
/0.4
31
.24
(1.0
8;1
.42
)0
.00
08
0.5
3/0
.48
9rs
38
98
61
0A
Av
AG
/GG
0.8
41
1.4
2(1
.11
;1.7
7)
0.0
01
50
.88
/0.8
31
.19
(0.8
0;1
.74
)0
.19
73
0.8
7/0
.85
1.3
6(1
.12
;1.6
7)
0.0
01
50
.87
/0.8
4
10
rs1
53
34
84
AA
/AG
vG
G0
.44
20
.81
(0.7
0;0
.97
)0
.01
09
0.3
5/0
.40
0.7
9(0
.63
;1.0
1)
0.0
42
80
.43
/0.4
90
.86
(0.7
5;0
.98
)0
.01
47
0.3
8/0
.42
11
rs2
67
61
92
AA
vA
G/G
G0
.30
10
.81
(0.6
7;0
.98
)0
.00
96
0.2
6/0
.30
0.9
5(0
.74
;1.3
1)
0.3
86
90
.26
/0.2
70
.83
(0.7
1;0
.96
)0
.00
86
0.2
6/0
.30
12
rs2
38
79
52
AA
vA
G/G
G0
.69
1.3
7(1
.15
;1.6
6)
0.0
00
40
.75
/0.6
91
.05
(0.8
0;1
.37
)0
.34
84
0.6
6/0
.65
1.2
0(1
.04
;1.4
0)
0.0
07
30
.72
/0.6
8
13
rs1
72
94
01
9A
A/A
Gv
GG
0.1
96
0.6
9(0
.55
;0.8
6)
0.0
00
50
.14
/0.1
90
.80
(0.5
9;1
.10
)0
.08
26
0.2
2/0
.27
0.7
8(0
.65
;0.9
3)
0.0
03
00
.17
/0.2
1
AD
AR
B1
14
rs3
78
81
57
AA
vA
G/G
G0
.63
1.2
3(1
.05
;1.4
5)
0.0
07
50
.65
/0.6
20
.90
(0.6
8;1
.19
)0
.23
18
0.6
5/0
.67
1.1
6(1
.00
;1.3
4)
0.0
20
40
.65
/0.6
2
15
rs4
14
74
3A
A/A
Gv
GG
0.4
70
.72
(0.6
1;0
.85
),
10
25
0.4
0/0
.48
1.0
8(0
.83
;1.4
5)
0.2
68
90
.49
/0.4
60
.83
(0.7
2;0
.96
)0
.00
53
0.4
3/0
.48
16
rs2
83
88
09
AA
vA
G/G
G0
.00
90
.27
(0.0
5;0
.93
)0
.00
96
0.0
03
/0.0
09
0.5
8(0
.15
;1.9
7)
0.1
97
30
.01
1/0
.01
60
.46
(0.1
9;1
.08
)0
.02
97
0.0
05
/0.0
1
17
rs2
83
88
10
AA
/AG
vG
G1
3.7
1(1
.12
;19
.29
)0
.01
36
0.9
97
/0.9
90
2.2
9(0
.63
;10
.33
)0
.10
88
0.9
91
/0.9
84
2.7
3(1
.11
;8.2
5)
0.0
13
60
.99
5/0
.99
18
rs2
83
88
16
AA
vA
G/G
G0
.00
90
.28
(0.0
5;0
.93
)0
.01
16
0.0
03
/0.0
09
0.5
8(0
.15
;1.9
8)
0.1
93
40
.01
1/0
.01
60
.48
(0.1
8;1
.04
)0
.03
09
0.0
05
/0.0
1
Th
efi
rst
13
SNP
sar
ein
the
ge
ne
AD
AR
B2
(10
p1
5.3
)an
dth
ela
stfi
veSN
Ps
inth
eg
en
eA
DA
RB
1(2
1q
22
.3).
Co
lum
ns
1–
4p
rovi
de
de
tails
of
the
SNP
sas
inta
ble
2.
Co
lum
ns
5–
7re
po
rtth
ere
sult
so
fth
eas
soci
atio
nin
the
NEC
San
dre
fere
nt
sub
ject
sb
ase
do
nB
aye
sian
log
isti
cre
gre
ssio
no
fd
om
inan
tan
dre
cess
ive
mo
de
ls.
Spe
cifi
cally
,co
lum
n5
rep
ort
sth
eB
aye
sian
est
imat
eo
fth
eo
dd
sra
tio
and
95
%cr
ed
ible
inte
rval
wit
hin
bra
cke
ts,
colu
mn
s6
rep
ort
sth
eB
aye
ssi
gn
ific
ance
that
isd
efi
ne
das
1-p
(OR
.1
)w
he
nth
ep
ost
eri
or
est
imat
eo
fth
eO
Ris
.1
and
1-p
(OR
,1
)w
he
nth
ep
ost
eri
or
est
imat
eo
fth
eO
Ris
,1
.Th
isn
um
be
ris
the
po
ste
rio
rp
rob
abili
tyo
fth
en
ull
hyp
oth
esi
sO
R#
1w
he
nw
ee
stim
ate
OR
.1
(or
OR
$1
wh
en
we
est
imat
eO
R,
1)
sosm
allv
alu
es
pro
vid
est
ron
ge
vid
en
ceag
ain
stth
en
ull
hyp
oth
esi
san
dit
issi
mila
rto
the
Bay
es
p-v
alu
ep
rop
ose
db
yA
lth
man
.Co
lum
n7
rep
ort
sth
ep
ost
eri
or
pro
bab
ility
of
the
risk
alle
lein
case
san
dco
ntr
ols
.Hig
hlig
hte
din
bo
ldar
eth
esi
gn
ific
ant
asso
ciat
ion
s(B
aye
ssi
gn
ific
ance
,0
.05
).C
olu
mn
s8
–1
0re
po
rtth
ere
plic
atio
ns
inth
eSI
CS
and
hig
hlig
hte
din
bo
ldar
eth
e4
SNP
sth
atar
esi
gn
ific
ant
inth
isan
alys
is.
Co
lum
ns
11
–1
2re
po
rtth
ere
sult
so
fth
ean
alys
isw
he
nth
ed
ata
fro
mth
etw
ost
ud
ies
are
agg
reg
ate
d.
Alt
ho
ug
ho
nly
15
SNP
sre
ach
stat
isti
cal
sig
nif
ican
cein
the
NEC
San
do
nly
4SN
Ps
inth
eSI
CS,
all
18
hav
eco
nsi
ste
nt
eff
ect
san
dw
he
nd
ata
of
the
two
stu
die
sar
eag
gre
gat
ed
,al
lSN
Ps
rem
ain
sig
nif
ican
tan
dth
esi
gn
ific
ance
of
11
of
the
mb
eco
me
sst
ron
ge
r.d
oi:1
0.1
37
1/j
ou
rnal
.po
ne
.00
08
21
0.t
00
3
RNA Editing and Oldest Age
PLoS ONE | www.plosone.org 4 December 2009 | Volume 4 | Issue 12 | e8210

associated variants in this gene that may not be captured by
our SNP selection in the Japanese population.
Association of ADARB2 with Exceptional LongevityWe examined the associations of 114 SNPs in ADARB2 in the
NECS and SICS samples using the same recessive and dominant
models. Ten SNPs were strongly associated with extreme old age
in the NECS, and one remains significant even after correcting for
multiple comparisons (SNPs rs2387952, Bayesian significance
0.0004,0.05/145). Four of these significant SNPs (rs2805562;
rs2805533; rs2805543; and rs1533484) were also replicated in the
SICS (Bayes significance ,0.05) (Table 3). The remaining six
SNPs did not reach statistical significance in the SICS but did
exhibit consistent associations in terms of odds ratios and allele
frequencies and combining data from the NECS and SICS made
these ten associations even stronger plus an additional three other
SNPs became statistically significant. These SNPs tag a region of
approximately 160Kb in ADARB2 that includes two blocks of LD
(Figure 4).
Tables 4 and 5 summarize the results of the replication of 10 of
these SNPs in AJCS subjects. Two of the SNPs reach statistical
significance in this set (rows 3 and 13) but one has opposite effects
compared to the NECS and SICS (rows 13). However, SNPs in
rows 1, 5–9, 11 and 12 have effects that are consistent with the
NECS and SICS and, when the data of the 3 studies are
aggregated, they become significant (columns 12–14). The SNPs in
Figure 1. Pattern of LD among the SNP in ADARB1 (chromosome 21) that are associated with exceptional longevity. The four plotsdisplay the pattern of LD captured by the SNPs associated with exceptional longevity in ADARB1 (chromosome 21) using data from the NECS, SICS,AJCS and JCS. The intensity of red represents the strength of LD measured by D9.doi:10.1371/journal.pone.0008210.g001
RNA Editing and Oldest Age
PLoS ONE | www.plosone.org 5 December 2009 | Volume 4 | Issue 12 | e8210
rows 2, 4, and 11 were not typed but proxy SNPs typed with the
Affymetrix 6.0 array confirm strong associations of variants in the
same region with EL. These SNPs are summarized in Table 5 and
are a good proxy for the SNPs originally typed in the NECS and
SICS as shown by their proximity in terms of physical distance
,10kb and linkage disequilibrium measured by D9 and r2.
Only SNP rs2805533 reached statistical significance in the JCS
set, with an effect that was consistent with the observed effect in
the NECS, SICS and AJCS samples (Table 6). The SNP
rs1533484 was borderline significant (Bayesian significance
,0.06) and demonstrates consistent effects with the NECS and
SICS results, but the allele frequencies are substantially different.
The SNP rs10903420 was also significant but with an opposite
effect compared to the NECS, SICS and AJCS subject sets. Note
however the substantial differences in both allele frequencies and
pattern of LD that may explain the different patterns of
associations in this ethnically very distinct sample. Genotype data
of additional SNPs in Table 7 provide further evidence for the
existence of variants in the region between physical positions
1340K and 1500K of chromosome 10 that are associated with
exceptional longevity.
Age TrendsFor some SNPs, a clear monotonic pattern associated with
increasing age was observed (Figure 5). This monotonic pattern is
consistent with a genetic effect that results from alleles positively
associated with EL becoming more frequent in older individuals,
while alleles that are negatively associated with EL become less
frequent. This pattern has also been observed for ApoE alleles [33]
and is consistent with the phenomenon of demographic selection
[34]. These increases in allele frequencies with age also illustrate
the increasing gain of power conferred by studying centenarians
and even more so, subjects age 105+ years, in genetic studies of
exceptional survival.
Functional StudiesTo go beyond statistical association, we chose to investigate the
possible functional role of these genes in regulating lifespan by
evaluating their influence on lifespan in the nematode, C. elegans, a
robust model organism for candidate lifespan gene discovery. The
A-to-I RNA editing gene family and their enzymatic editing
activity has been well conserved in a broad array of species
including humans, mice, flies, zebrafish, xenopus and notably, C.
elegans [31,35]. For lifespan analysis, we focused on C. elegans,
which has two orthologues of ADARB1 and ADARB2 with RNA
editing activity, adr-1 and adr-2 [36] (see phylogenetic tree in
Figure S1). Because C. elegans has an average lifespan of
approximately 20 days, the influence of candidate genes on
lifespan can be readily tested. Therefore, to evaluate whether adr
loss-of-function influences C. elegans lifespan, we monitored the
lifespan of single and double mutants of adr-1(gv6) and adr-2(gv42).
Both of these alleles are deletions that remove at least a third of the
coding sequence and are presumed null alleles [36] (Figure 6a and
Figure S2). Strains carrying mutations in adr-1 and adr-2 displayed
a shorter lifespan than the wild-type control N2 worms (log-rank
test p,1028). Remarkably, aside from the decline in lifespan,
there were no other obvious defects, in contrast with gain-of-
function studies that noted lethality in Drosophila [37].
The insulin-like growth factor (IGF) pathway is a well known
lifespan regulatory axis in worms [38], flies [39,40], mice [41], and
humans [42]. Inactivation of the C. elegans insulin like receptor
gene daf-2 by dsRNA increased lifespan of both the wild type N2
worms, confirming previous studies. Notably, knockdown of daf-2
by dsRNA also increased lifespan in the background of adr-1 and
adr-2 null mutations, resulting in a lifespan phenocopy similar to
the wild type N2 worms (Figure 6a). Similar extensions of lifespan
were seen with single adr-1 or adr-2 mutants, (Figure S2). These
data suggest that IGF axis mediated increases in lifespan due to
daf-2 remain active in the presence of adr-1 and adr-2 background
genotypes, but with less potency than in a N2 wild type
background. From these data, we cannot exclude the possibility
that knockdown of RNA editing genes in adr-1 or adr-2 mutants
results in increased RNAi activity. In this scenario, increased
RNAi might target genes downstream of daf-16 (seven daf-16 gene
targets have been identified in comparative analysis of daf-2 versus
daf-2::daf-16 strains [43]), thereby reducing the potency of daf-2
dependent increases in lifespan.
In a previous study, mutations in both adr-1 and adr-2 resulted in
increased GFP reporter transgene silencing, suggesting that
declines in ADAR function are associated with an increase in
RNA interference (RNAi), which would account for the GFP
silencing in those experiments. When the argonaute gene rde-1,
which is essential for RNA induced silencing complex (RISC)
formation, was introduced into adr-1;adr-2 worms containing the
transgenes, the increased GFP silencing due to ADAR knockdown
was suppressed [44]. This suggests cross-regulation between RNA
editors and RNA interference that is further supported by results
Figure 2. Result of genotype cluster algorithm from BeadStudio. The three plots show the normalized intensities in polar coordinate and thecluster definition from BeadStudio for NECS subjects. The clear separation suggests that the genotype calls are robust.doi:10.1371/journal.pone.0008210.g002
RNA Editing and Oldest Age
PLoS ONE | www.plosone.org 6 December 2009 | Volume 4 | Issue 12 | e8210

Ta
ble
4.
Re
plic
atio
nin
the
AJC
Ssu
bje
ctse
t.
Ro
wS
NP
Ris
kv
ers
us
refe
ren
ta
lle
les
CE
PH
NE
CS
+SIC
SA
JCS
(29
9o
lde
sto
ld,
26
9co
ntr
ols
)N
EC
S+S
ICS
+AJC
S
OR
Ba
ye
ssi
gp
(A)
OR
Ba
ye
ssi
gp
(A)
OR
Ba
ye
ssi
gp
(A)
AD
AR
B2
1rs
10
90
34
20
AA
vA
G/G
G0
.32
71
.25
(1.0
7;1
.45
)0
.00
20
0.2
8/0
.24
1.3
7(0
.87
;2.1
8)
0.0
86
10
.27
/0.2
11
.26
(1.0
9;1
.45
)0
.00
10
0.2
8/0
.24
2rs
10
07
14
7A
Av
AG
/GG
0.3
12
1.3
4(1
.15
;1.5
9)
0.0
00
30
.27
/0.2
2
3rs
28
05
56
2A
Av
AG
/GG
0.1
51
.32
(1.0
9;1
.59
)0
.00
22
0.1
6/0
.13
1.8
8(1
.10
;3.2
2)
0.0
09
50
.21
/0.1
71
.39
(1.1
6;1
.65
),
10
25
0.1
7/0
.13
4rs
88
49
49
AA
vA
C/C
C0
.12
41
.24
(1.0
1;1
.54
)0
.02
11
0.1
2/0
.10
5rs
28
05
53
3A
A/A
Gv
GG
0.7
70
.86
(0.7
2;1
.02
)0
.03
81
0.7
9/0
.81
0.7
3(0
.45
;1.1
8)
0.0
95
50
.76
/0.8
10
.84
(0.7
2;0
.98
)0
.01
29
0.7
8/0
.81
6rs
23
87
65
3A
Av
AG
/GG
0.0
97
1.2
1(0
.99
;1.4
9)
0.0
34
30
.15
/0.1
31
.40
(0.8
3;2
.38
)0
.10
30
0.2
0/0
.15
1.2
7(1
.05
;1.5
3)
0.0
08
20
.17
/0.1
3
7rs
28
05
53
5A
Av
AG
/GG
0.6
99
1.3
7(1
.11
;1.6
8)
0.0
01
70
.74
/0.6
81
.27
(0.8
2;1
.95
)0
.14
76
0.8
1/0
.77
1.2
8(1
.06
;1.5
4)
0.0
05
00
.73
/0.7
0
8rs
28
05
54
3A
Av
AG
/GG
0.4
61
.24
(1.0
8;1
.42
)0
.00
08
0.5
3/0
.48
1.2
6(0
.85
;1.8
7)
0.1
21
70
.51
/0.4
51
.22
(1.0
8;1
.39
)0
.00
01
0.5
2/0
.47
9rs
38
98
61
0A
Av
AG
/GG
0.8
41
1.3
6(1
.12
;1.6
7)
0.0
01
50
.87
/0.8
40
.63
(0.3
5;1
.16
)0
.06
85
0.8
7/0
.91
1.2
9(1
.07
;1.5
5)
0.0
03
50
.87
/0.8
4
10
rs1
53
34
84
AA
/AG
vG
G0
.44
20
.86
(0.7
5;0
.98
)0
.01
47
0.3
8/0
.42
11
rs2
67
61
92
AA
vA
G/G
G0
.30
10
.83
(0.7
1;0
.96
)0
.00
86
0.2
6/0
.30
0.7
7(0
.52
;1.1
5)
0.0
98
60
.27
/0.3
20
.83
(0.7
2;0
.95
)0
.00
37
0.2
6/0
.30
12
rs2
38
79
52
AA
vA
G/G
G0
.69
1.2
0(1
.04
;1.4
0)
0.0
07
30
.72
/0.6
80
.95
(0.6
1;1
.44
)0
.39
77
0.6
7/0
.69
1.1
7(1
.01
;1.3
4)
0.0
14
60
.71
/0.6
8
13
rs1
72
94
01
9A
A/A
Gv
GG
0.1
96
0.7
8(0
.65
;0.9
3)
0.0
03
00
.17
/0.2
11
.42
(0.9
5;2
.13
)0
.04
51
0.3
1/0
.24
AD
AR
B1
14
rs3
78
81
57
AA
vA
G/G
G0
.63
1.1
6(1
.00
;1.3
4)
0.0
20
40
.65
/0.6
20
.73
(0.5
0;1
.05
)0
.04
63
0.5
8/0
.65
15
rs4
14
74
3A
A/A
Gv
GG
0.4
70
.83
(0.7
2;0
.96
)0
.00
53
0.4
3/0
.48
16
rs2
83
88
09
AA
vA
G/G
G0
.00
90
.46
(0.1
9;1
.08
)0
.02
97
0.0
05
/0.0
11
.19
(0.4
4;3
.29
)0
.36
62
0.0
40
/0.0
34
17
rs2
83
88
10
AA
/AG
vG
G1
2.7
3(1
.11
;8.2
5)
0.0
13
60
.99
5/0
.99
0.9
9(0
.39
;2.5
3)
0.4
95
10
.95
6/0
.95
6
18
rs2
83
88
16
AA
vA
G/G
G0
.00
90
.48
(0.1
8;1
.04
)0
.03
09
0.0
05
/0.0
11
.06
(0.3
8;3
.06
)0
.45
73
0.0
35
/0.0
34
List
of
the
SNP
sin
AD
AR
B2
and
AD
AR
B1
that
reac
hst
atis
tica
lsi
gn
ific
ance
inth
eN
ECS
and
SIC
San
dw
ere
atte
mp
ted
tob
ere
plic
ate
din
the
AJC
Sse
t.T
he
firs
t7
colu
mn
sre
po
rtth
ed
eta
ilso
fth
eSN
Ps
asd
esc
rib
ed
inth
ele
ge
nd
of
Tab
le3
.Co
lum
ns
8–
11
rep
ort
the
resu
lts
for
14
of
the
18
SNP
sin
Tab
le3
that
we
reg
en
oty
pe
din
25
5o
lde
sto
ldan
d2
27
you
ng
er
con
tro
lso
fth
eA
JCS.
On
ly3
SNP
sre
ach
stat
isti
cals
ign
ific
ance
inth
isse
t(r
ow
s3
,13
and
14
)b
ut
two
of
the
mh
ave
op
po
site
eff
ect
sco
mp
are
dto
the
NEC
San
dSI
CS
(ro
ws
13
and
14
).H
ow
eve
r,SN
Ps
inro
ws
1,5
–9
,11
and
12
hav
ee
ffe
cts
that
are
con
sist
en
tw
ith
the
NEC
San
dSI
CS
and
,wh
en
the
dat
ao
fth
e3
stu
die
sar
eag
gre
gat
ed
,th
ey
be
com
esi
gn
ific
ant
(co
lum
ns
12
–1
4).
Th
eSN
Ps
inro
ws
2,4
,10
and
11
we
ren
ot
typ
ed
be
cau
sep
roxy
SNP
sfr
om
ano
ng
oin
gg
en
om
ew
ide
asso
ciat
ion
stu
dy
con
du
cte
dw
ith
the
Aff
yme
trix
6.0
arra
ysu
gg
est
stro
ng
asso
ciat
ion
sin
the
sam
ere
gio
n.
do
i:10
.13
71
/jo
urn
al.p
on
e.0
00
82
10
.t0
04
RNA Editing and Oldest Age
PLoS ONE | www.plosone.org 7 December 2009 | Volume 4 | Issue 12 | e8210

from Tonkin et al [45], wherein they demonstrated that a mild
chemotaxis defect of the adr-1;adr-2 double mutant could be
rescued by an rde-1 mutant [45]. Therefore, to evaluate the
potential for cross-regulation between RNA editing and RNA
interference in the context of lifespan, we evaluated adr-1; adr-2
mediated declines in lifespan in the presence of the RNAi defective
strain, rde-1(ne-219). Remarkably, and consistent with previous
results, the loss of rde-1 completely restored lifespan declines
associated with adr-1; adr-2 loss-of-function (Figure 6b). We
interpret these data as expanding the interaction between these
two RNA regulatory pathways to include lifespan determination.
Our experiments with C. elegans raise the question as to the
precise role for A-to-I RNA editing gene activity in human aging,
which remains unknown. However, the demonstration that this
family of genes is implicated in the regulation of aging in other
organisms warrants validation in other species, particularly
humans, and provides a novel regulatory axis for future studies
on regulatory pathways that influence the aging process. We
speculate that as of yet unidentified ADAR variants delay age
associated declines in ADAR activity. We note that a reduction in
ADAR enzymatic activity is associated with Dementia, ALS and
Alzheimers disease in normal aging individuals [46]. Consistent
with this interpretation, analysis of published transcriptional
profiles of aging in C. elegans indicate that adr-1 and adr-2
expression peak in early adulthood and decline with age rather
precipitously. The declines observed in that study are compatible
with a protective role for ADAR alleles in aging.
Prior to this study, RNA editing had not been directly
implicated in the regulation of aging in humans or C. elegans.
Although the impact upon lifespan that we observed in C. elegans
appears to be independent of insulin signaling (Figure 6a), the
interaction between RNA editing and RNA interference is likely to
be complex since decreased insulin signaling in C. elegans can also
affect RNA interference [47] and may suggest threshold effects
associated with declining levels of insulin signaling. Future studies
will be needed to identify and characterize targets of RNA editing
and their potential role(s) in modulating RNA interference activity,
in the context of aging and age-related diseases.
Our analysis provides strong evidence for association of
ADARB1 and ADARB2 with extreme old age. Our findings of
strongest association in the NECS sample are consistent with that
sample being both the largest and oldest of the four studies. The
lack of reproducibility for some SNPs may have been due to
differences in overall genetic background (ethnicity), size and
younger ages of the oldest old samples. Nonetheless, associations
were noted across four different study populations suggesting that
the associations between ADARB1 and ADARB2 and EL are robust
to different genetic backgrounds and environmental exposures.
ADARB2 is a very large gene spanning more than 500Kb in
chromosome 10, but our analysis narrows the association to a
region of approximately 100Kb that could be followed-up by fine
mapping or sequencing for discovering functional variants and to
provide a better understanding of the function of these genes in
human aging.
Materials and Methods
Ethic StatementSubjects included in the NECS, SICS, AJCS and JCS provided
written informed consent, and all research involving human
subjects was approved by the Institutional Review Boards of
Boston University, Boston, USA (NECS), the ‘‘Istituto di Ricovero
e Cura a Carattere Scientifico ‘‘Multimedica, Milano, Italy (SICS),
Albert Eistein College of Medicine, Bronx, USA (AJCS), Keio
Ta
ble
5.
Re
plic
atio
nin
the
AJC
Ssu
bje
ctse
tu
sin
gp
roxy
SNP
s.
Ro
wS
NP
Ris
kv
ers
us
refe
ren
ta
lle
les
CE
PH
NE
CS
+SIC
SP
rox
yS
NP
sA
JCS
(25
5o
lde
sto
ld,
22
7co
ntr
ols
)R
isk
ve
rsu
sre
fere
nt
all
ele
OR
Ba
ye
ssi
gp
(A)
SN
PP
osi
tio
nD
ista
nce
D9/
r2O
RB
ay
es
sig
p(A
)
2rs
10
07
14
7A
Av
AG
/GG
0.3
12
1.3
4(1
.15
;1.5
9)
0.0
00
30
.27
/0.2
2rs
28
04
09
71
35
21
29
11
04
10
.63
/0.3
0.5
6(0
.33
;0.9
1)
0.0
10
.76
/0.8
5A
A/A
Tv
TT
4rs
88
49
49
AA
vA
C/C
C0
.12
41
.24
(1.0
1;1
.54
)0
.02
11
0.1
2/0
.10
rs1
09
03
42
61
36
13
86
22
24
1.0
0/0
.58
1.6
2(1
.00
;2.7
3)
0.0
26
90
.23
/0.1
6C
Cv
CT
/TT
15
rs4
14
74
3A
A/A
Gv
GG
0.4
70
.83
(0.7
2;0
.96
)0
.00
53
0.4
3/0
.48
rs1
70
04
73
44
53
45
88
62
38
31
.00
/0.0
70
.29
(0.0
6;1
.00
)0
.02
59
0.9
5/0
.98
AA
/AG
vG
G
Ad
dit
ion
alp
roxy
SNP
sth
atw
ere
ge
no
typ
ed
inth
eA
JCS
set
and
tag
the
sam
ere
gio
nas
sho
wn
by
the
irp
roxi
mit
yin
term
so
fp
hys
ical
dis
tan
ce,
10
kban
dlin
kag
ed
ise
qu
ilib
riu
mm
eas
ure
db
yD
9an
dr2
(Se
eal
soFi
gu
re1
).d
oi:1
0.1
37
1/j
ou
rnal
.po
ne
.00
08
21
0.t
00
5
RNA Editing and Oldest Age
PLoS ONE | www.plosone.org 8 December 2009 | Volume 4 | Issue 12 | e8210

University, Tokyo, Japan (JCS). All data were analyzed anony-
mously. Control data from the Illumina iControlDB database were
anonymized.
SNP GenotypingFor the NECS and SICS samples, 1 ug of genomic DNA was
analyzed on the Illumina 370 CNV chip (Illumina, San Diego,
CA) and only samples with at least a 93% call rate were used for
the analysis. For the AJCS and JCS, genotyping was originally
performed with the Affymetrix 6.0 chip and 5.0 chips, respectively
with required call rates of 99% or greater. Affymetrix Birdseed
algorithm and Illumina Beadstudio were used for genotype calling.
Non overlapping SNPs that were not approximated by SNPs with
substantial LD (D9.0.8) were genotyped with Sequenom (AJCS)
and BigDye Terminator cycle sequencing kit and an ABI Prism
3730xl DNA analyzer (Applied Biosystems, CA, USA). The
sequence data were analyzed with ABI PRISM SeqScape
Software version 2.6 (Applied Biosystems).
Creation of a Genetically Matched Control SetA referent cohort sample for the NECS subjects was constructed
utilizing genotype data from the Illumina iControlDB database
and principal components analysis was used to match cases and
controls by genetic background. To reduce chances of stratifica-
tion, we identified 2,077 Caucasian referent subjects from the
Illumina iControlDB, all genotype with Illumina arrays, with
known age at enrollment between 30 and 75 years, and we used
the principal component analysis implemented in the program
EIGENSTRAT [48] to examine the structure of this referent
group compared to the NECS and SICS subjects. The analysis
showed that both the NECS and the Illumina controls are
comprised of three major clusters that correspond to northwest,
northeast and southwest Europeans, but in the Illumina controls
sample there were also subjects with different levels of admixture
between the three clusters Figure S3. We therefore randomly
sampled 1,538 subjects from the three major clusters to create a
control set that matched the genetic background of the NECS
extreme old sample set as suggested in [49]. We use the same
procedure to identify 81 female and 16 male subjects to be added
to the set of SICS controls. The random-selection procedure was
repeated twice and lead to the same results.
Genetic Association Analysis (Pooled DNA Samples)The statistical analysis of pooling based genome-wide genotype
data is described in [27]. Briefly, the method uses Bayesian
association tests to score the evidence for allelic associations
between centenarians and controls. Prior distributions represent
the prior knowledge about the expected number of genes that may
be implicated with the trait and therefore correct for multiple
comparisons. The analysis also uses linkage disequilibrium (LD)
based filters to retain associations that are supported by clusters of
SNPs in LD.
Genetic Association Analysis (Individual DNA Samples)The genotype data of the 31 SNPs in the genes ADARB1 and
114 SNPs in ADARB2 were individually analyzed using Bayesian
logistic regression [32] to fit dominant and recessive models of
inheritance adjusted by gender. The marginal posterior distribu-
tions of the ORs were estimated using the implementation of
Gibbs sampling in WinBugs 1.4 [50], and the 2.5th and 97.5th
Table 6. Replication in the JCS subject set.
Row SNPRisk versusreferent alleles CEPH NECS+SICS JPT JCS (470 oldest old, 538 controls)
OR Bayes sig p(A) OR Bayes sig p(A)
ADARB2 1 rs10903420 AA v AG/GG 0.327 1.25(1.07;1.45) 0.0020 0.28/0.24 0.058 0.51(0.23;1.07) 0.0397 0.03/0.045
2 rs1007147 AA v AG/GG 0.312 1.34(1.15;1.59) 0.0003 0.27/0.22 0.091 1.10(0.68;1.81) 0.3435 0.08/0.075
3 rs2805562 AA v AG/GG 0.15 1.32(1.09;1.59) 0.0022 0.16/0.13 0.058 0.67(0.26;1.56) 0.1813 0.02/0.03
4 rs884949 AA v AC/CC 0.124 1.24(1.01;1.54) 0.0211 0.12/0.10 0
5 rs2805533 AA/AG v GG 0.77 0.86(0.72;1.02) 0.0381 0.79/0.81 0.92 0.59(0.37;0.92) 0.0110 0.88/0.93
6 rs2387653 AA v AG/GG 0.097 1.21(0.99;1.49) 0.0343 0.15/0.13 0
7 rs2805535 AA v AG/GG 0.699 1.37(1.11;1.68) 0.0017 0.74/0.68 0.151 1.02(0.69;1.49) 0.4690 0.14/0.14
8 rs2805543 AA v AG/GG 0.46 1.24(1.08;1.42) 0.0008 0.53/0.48 0.105 0.86(0.57;1.30) 0.2381 0.10/0.12
9 rs3898610 AA v AG/GG 0.841 1.36(1.12;1.67) 0.0015 0.87/0.84 0.686 1.09(0.83;1.43) 0.2619 0.66/0.64
10 rs1533484 AA/AG v GG 0.442 0.86(0.75;0.98) 0.0147 0.38/0.42 0.791 0.79(0.58;1.07) 0.0641 0.76/0.80
11 rs2676192 AA v AG/GG 0.301 0.83(0.71;0.96) 0.0086 0.26/0.30 0.419 0.92(0.71;1.19) 0.2542 0.40/0.42
12 rs2387952 AA v AG/GG 0.69 1.20(1.04;1.40) 0.0073 0.72/0.68 0.616 0.98(0.76;1.28) 0.4576 0.59/0.60
13 rs17294019 AA/AG v GG 0.196 0.78(0.65;0.93) 0.0030 0.17/0.21 0.012 0.54(0.12;2.03) 0.1846 0.01/0.02
ADARB1 14 rs3788157 AA v AG/GG 0.63 1.16(1.00;1.34) 0.0204 0.65/0.62 0.65 1.03(0.79;1.36) 0.4080 0.67/0.66
15 rs414743 AA/AG v GG 0.47 0.83(0.72;0.96) 0.0053 0.43/0.48 0.31 1.14(0.86;1.52) 0.183 0.29/0.26
16 rs2838809 AA v AG/GG 0.009 0.46(0.19;1.08) 0.0297 0.005/0.01 0 0.81(0.36;1.81) 0.2959 0.028/0.034
17 rs2838810 AA/AG v GG 1 2.73(1.11;8.25) 0.0136 0.995/0.99 1 1.14(0.50;2.60) 0.3791 0.974/0.970
18 rs2838816 AA v AG/GG 0.009 0.48(0.18;1.04) 0.0309 0.005/0.01 0 0.81(0.36;1.79) 0.3032 0.029/0.034
Lists of the SNPs in ADARB2 and ADARB1 that reach statistical significance in the NECS and SICS and were attempted to be replicated in the JCS set. The first 7 columnsreport the details of the SNPs as described in the legend of Table 3. Columns 8–11 report the results for 14 of the 18 SNPs in Table 3 that were genotyped in 470 oldestold and 538 younger controls of the JCS. Only 3 SNPs reach statistical significance in this set (rows 1, 5 and 10) but one of them have opposite effects compared to theNECS and SICS (row 1). We did not attempt to merge the results from different populations because of the substantial differences in allele frequencies.doi:10.1371/journal.pone.0008210.t006
RNA Editing and Oldest Age
PLoS ONE | www.plosone.org 9 December 2009 | Volume 4 | Issue 12 | e8210
percentile were used to estimate 95% credible intervals (CI) for the
ORs. The 50th percentile was used to estimate the OR, and the
frequency of OR.1 was used to estimate the posterior probability
p(OR.1). The Gibbs sampler was run for at least 10,000
iterations and the last 10,000 simulated values were used to
estimate these parameters. We used as prior distributions on the
regression coefficients of the logit function normal distributions
with mean 0 and standard deviation 3.2 that determine a normal
prior distribution of the log(OR) with mean 0 (no association) and
a variance that ranges between 10 with no genetic effect to 40 with
a gene6gender effect. This set of prior distributions was
determined to make the analysis robust to rare alleles (frequen-
cy,0.10) and we searched for the largest variance that allowed
successful execution of the Gibbs sampler. These prior distribu-
tions bias the analysis toward the null hypothesis and reduce false
positive associations.
The Bayes significance was defined as 1- p(OR.1) when the
posterior estimate of the OR was .1, and 1-p(OR,1) when the
posterior estimate of the OR was ,1, and an association was
deemed significant in the NECS, SICS, or the data aggregated
from the two studies, if the Bayes significance was smaller than
0.05. This measure of significance is the posterior probability of
the null hypothesis OR#1 (or OR$1) so that small values denotes
strong evidence against the null hypothesis [32]. This analysis
identified 18 significant SNPs (Table 3), that is more than twice the
number expected by chance in 145 independent tests and two
SNPs remained significant even after correcting the threshold for
the number of tests. Furthermore, the probability that 18 SNPs
could be simultaneously found significantly associated under the
null hypothesis of no association is 0.0002, using the binomial
distribution with n = 145, x = 18 and p = 0.05. An association that
was significant in the aggregated NECS and SICS data was
deemed replicated in either the AJCS or JCS studies if the same
SNP was significant (Bayes significance ,0.05) with the same
genetic model and consistent effects; or the same SNP did not
reach statistical significance (Bayes significance $0.05), but the
ORs in the different studies were in the same direction and when
the data from the studies were aggregated, the association was
significant. The rationale for the second condition is that both the
AJCS and JC have smaller sample sizes, and therefore have less
power compared to the NECS. However, consistent effects and
increased significance when the aggregated data are analyzed
show that the lack of association in the replication study is due to
lack of power if effects are similar across different studies. This
strategy has been used to increase the power of genetic association
studies, see for example [51]. The results are in Tables 4, 5, 6
and 7.
We conducted a similar analysis stratified by gender but the
limited sample sizes did not produce strongly significant results.
Linkage Disequilibrium (LD) HeatmapsWe used HaploView 4.1 to create the LD heatmaps and LD
displays were generated using the D9 color scheme where white
represents D9 = 0, red represents D9 = 1, and different shades of
red represent 0,D9,1 (Figures 1 and 4).
Lifespan Measurements in C. elegansTo synchronize worms for lifespan, eggs were isolated (N2, adr-
1, adr-2, adr-1;adr-2, rde-1, rde-4, adr-1;adr-2;rde-1) and synchronized
by hatching overnight in the absence of food at 20C. Synchronized
L1 larvae were counted and plated (10 worms/plate, n = 60) on
Escherichia coli bacterial lawns (OP50) on NGM media and
allowed to develop to L4-stage larvae at 20C. 5-fluorodeoxyur-
idine (FudR) solution was added to a final concentration of 0.1mg/
Ta
ble
7.
Re
plic
atio
nin
the
JCS
sub
ject
set
usi
ng
pro
xySN
Ps.
Ro
wS
NP
Ch
rp
osi
tio
nN
EC
S+S
ICS
SN
Pp
osi
tio
nD
ista
nce
D9/
r2JP
CS
(43
2o
lde
sto
ld,
34
6co
ntr
ols
)R
isk
ve
rsu
sre
fere
nt
all
ele
s
OR
Ba
ye
ssi
gp
(A)
OR
Ba
ye
ssi
gp
(A)
2rs
10
07
14
71
01
34
10
88
1.3
4(1
.15
;1.5
9)
0.0
00
30
.27
/0.2
2rs
28
04
09
91
34
63
20
52
32
0.6
3/0
.30
.61
(0.3
4;1
.07
)0
.04
22
0.9
1/0
.94
CC
/CG
vG
G
4rs
88
49
49
10
13
61
61
01
.24
(1.0
1;1
.54
)0
.02
11
0.1
2/0
.10
rs1
09
03
42
61
36
13
86
22
24
1.0
0/0
.58
1.7
0(0
.97
;3.0
5)
0.0
33
20
.09
/0.0
6C
Cv
CT
/TT
6rs
23
87
65
31
01
39
78
26
1.2
2(0
.98
;1.4
8)
0.0
34
30
.15
/0.1
3rs
17
22
16
52
14
06
47
28
64
60
.91
/0.2
21
.84
(1.0
1;3
.58
)0
.02
34
0.0
8/0
.05
CC
vC
G/G
G
7rs
28
05
53
51
01
45
04
32
1.3
7(1
.11
;1.6
8)
0.0
01
70
.74
/0.6
8rs
45
43
90
41
45
31
58
27
26
0.8
8/0
.20
0.4
4(0
.23
;0.8
0)
0.0
03
10
.91
/0.9
6C
C/C
Gv
GG
18
rs2
83
88
16
21
45
45
44
70
0.4
8(0
.18
;1.0
4)
0.0
30
90
.00
5/0
.01
rs6
51
82
19
45
47
91
45
24
67
50
.08
/0.0
31
.36
(1.0
3;1
.82
)0
.02
02
0.5
0/0
.43
AA
/AT
vT
T
rs2
83
88
24
45
47
98
13
25
34
30
.08
/0.0
30
.54
(0.3
0;0
.86
)0
.00
59
0.8
9/0
.93
CC
/CT
vT
T
Ad
dit
ion
alSN
Ps
that
we
reg
en
oty
pe
din
the
JCS
set
and
corr
ob
ora
teas
soci
atio
ns
inth
eN
ECS
and
SIC
Ssu
bje
cts
sets
.d
oi:1
0.1
37
1/j
ou
rnal
.po
ne
.00
08
21
0.t
00
7
RNA Editing and Oldest Age
PLoS ONE | www.plosone.org 10 December 2009 | Volume 4 | Issue 12 | e8210

ml to prevent reproduction. Worms were kept at 20C and lifespan
monitored by counting on alternate days. Lifespan was defined as
the first day of adulthood (adult lifespan = 0) to death. Aside from
reduced lifespan, the worms appeared normal in size and general
behavior, consistent with previous reports on adr mutant strains
[36]. We did observe altered chemotaxis during routine passage of
the worms to maintain stocks, as previously noted [36]. We also
noted reduced progeny viability (data not shown). However, these
Figure 3. Posterior densities of ORs. Posterior densities of the ORs for the 3 SNPs in ADARB1 with rare alleles and moderate effects in the dataaggregated from NECS, SICS and JCS. Significant associations would results in posterior densities not overlapping 1 and definite evidence of either anOR,1 or an OR.1, while all of the three densities have heavy tails and do not provide definite evidence against the null hypothesis of no association.doi:10.1371/journal.pone.0008210.g003
Figure 4. Pattern of LD among the SNP in ADARB2 (chromosome 10) that are associated with exceptional longevity. The four plotsdisplay the pattern of LD captured by the SNPs associated with exceptional longevity in ADARB2 (chromosome 10) in the NECS, SICS, AJCS and JCSdata. The intensity of red cells represents the strength of LD measured by D9. The LD pattern in the NECS, SICS and AJCS subjects are very similar butdiffer substantially from the pattern of LD in the JCS subjects in which two SNPs become almost monomorphic (rs884949 and rs2387653).Highlighted in red are the SNPs that replicate the results in the AJCS and JCS subjects.doi:10.1371/journal.pone.0008210.g004
RNA Editing and Oldest Age
PLoS ONE | www.plosone.org 11 December 2009 | Volume 4 | Issue 12 | e8210
are unlikely to have influenced our lifespan measurements, since
the adult worms were made sterile using FudR and were not
transferred during the course of the lifespan assay.
RNAi and Lifespan MeasurementEggs were isolated from gravid worms and synchronized by
hatching overnight in the absence of food. The synchronized L1
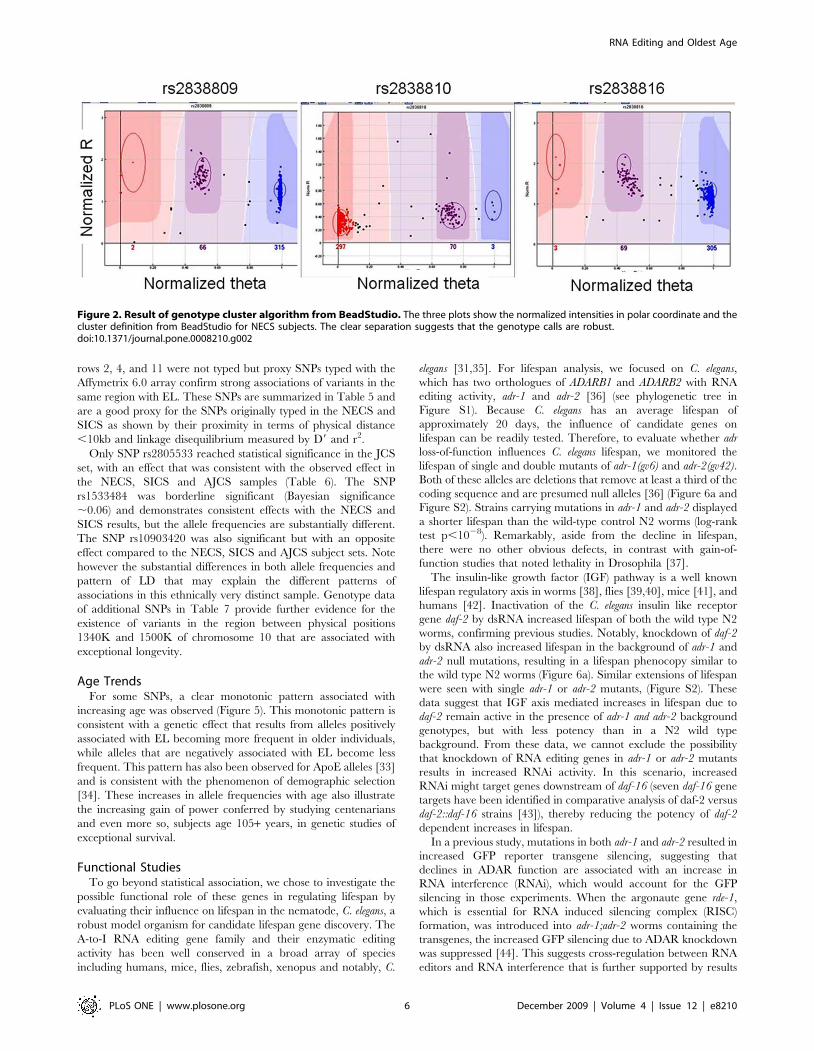
Figure 5. Age related trend of allele frequencies. The two barplots show the age related trend of allele frequencies of SNPs rs17294019(ADARB2, SNP # 98 in Table 1) and rs3788157 (ADARB1, SNP # 135 in Table 1) in the NECS (n = 1,023). The frequencies of the common allele for bothSNPs were stratified in the age groups 90–99; 100–105, 106 and higher. Trends of allele frequencies for increasing age groups are consistent with astrong correlation between genotype and phenotype that results in substantial enrichment of protective alleles in older subjects.doi:10.1371/journal.pone.0008210.g005
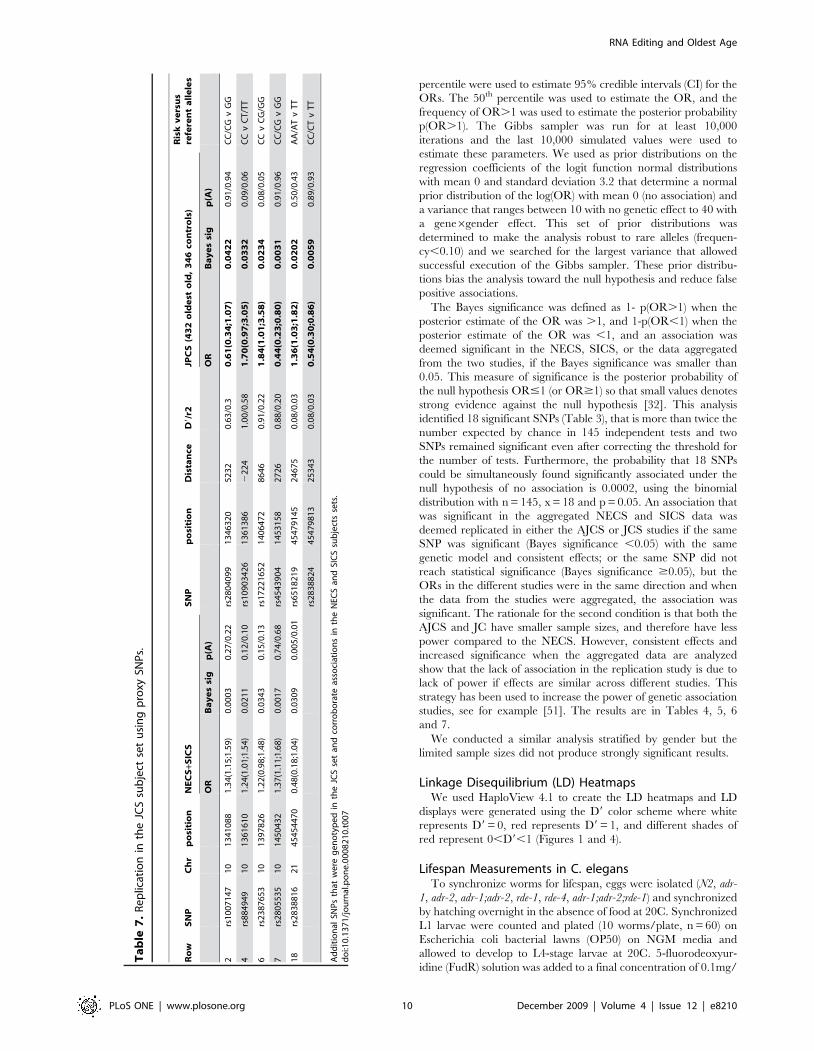
Figure 6. ADAR mediated decline in lifespan, daf-2 influence, and rde-1 rescue. a) Lifespan using mutant strains for adr-1;adr-2 in the contextof dsRNA mediated gene inactivation of daf-2. Synchronized worms at the larval stage 4 (L4) were sterilized with FudR and allowed to feed onbacterial lawns that contained dsRNA for daf-2. Note: adr-1; adr-2 double mutant (red solid), adr-1; adr-2 double mutant with dsRNA for daf-2 (redhatched), N2 wild type (blue solid), N2 with dsRNA for daf-2 (blue hatched). Note decline in lifespan due to adr-1; adr-2 compared with N2 wildtype.Also note increases in lifespan of both N2 and adr-1; adr-2 in the presence of dsRNA for daf-2. The 50% survival time in the adr-1; adr-2 mutantanimals was 10 days (95% limits 9 and 12 days) compared with 20 days (95% limits 18 and 20 days) for N2 wild-type control worms. RNAi to daf-2increases lifespan to 34 days (95% limits 32 and 40 days), compared with 20 days for the wild type (N2 worms fed empty vector (RNAi)). daf-2 geneinactivation, in the background of the adr-1 and adr-2 null mutations also restored lifespan to 18 days (95% limits 16 and 20 days), compared with 10days for the adr-1;adr-2 double mutant strain. b) Lifespan using mutant strains for adr-1;adr-2 (solid red), N2 wildtype (solid blue), rde-1 (greyhatched), adr-1; adr-2; rde-1 (grey solid) demonstrate declines in lifespan using mutant strains and full rescue of lifespan in an RNAi defective (rde-1)background. The adr-1; adr-2 mutant was again about half as long lived as wild-type (median survival time 9 days for adr-1;adr-2 strain (95% limits 9and 11 days), and median survival time 21 days (95% limits 18 and 21 days), for N2 wild-type worms. The survival distribution of the triple mutant adr-1;adr-2; rde-1 is median lifespan 21 days (95% limits 18 and 21 days), which is significantly different from adr-1;adr-2, with a median lifespan of 9 days(95% limits 9 and 11 days). The lifespan of rde-1 was modestly reduced compared with the wild-type N2, as was reported previously29. Inset boxesdisplays 50% survival (days) for each condition and demonstrates that daf-2 gene inactivation increases lifespan, in both wild type and in adr-1;adr-2mutant strains (a) and that RNAi knockout (rde-1) restores lifespan.doi:10.1371/journal.pone.0008210.g006
RNA Editing and Oldest Age
PLoS ONE | www.plosone.org 12 December 2009 | Volume 4 | Issue 12 | e8210
larvae were then placed on OP50-containing agar plates and
allowed to develop to L4-stage larvae at 20C. The L4-stage larvae
were washed thoroughly, and placed either on Escherichia coli
HT115 with empty RNAi vector or Escherichia coli HT115
expressing double-stranded RNA (dsRNA) for daf-2. Briefly,
dsRNA -expressing bacteria were grown overnight in LB with
50 ug/ml ampicillin and then seeded onto RNAi NGM plates
containing 5 mM isopropylthiogalactoside (IPTG). The RNAi
bacteria were induced overnight at room temperature for dsRNA
expression. About 30 synchronized L4-stage animals were added
to each well and allowed to develop to adults, followed by the
addition of FudR. Worms were kept at 20C, and their lifespan was
monitored. Worms feeding on bacteria carrying the empty vector
were used as a negative control. Log-rank test in the R package
survival was used for the statistical analysis.
Supporting Information
Figure S1 Phylogenetic clustering and alignment of ADARs
form multiple species. Phylogenetic clustering and alignment of
ADARs form multiple species, including Human, chimp, bull, cat,
rat, chicken, wolf and nematode (C. elegans). Sequences were
aligned by using the neighbor-joining algorithm with Clustal X,
gap-stripped with corrections for multiple substitutions, and
bootstrap analyzed with 1,000 bootstrap resamplings. Phylograms
were generated with NJ-plot. The tree is unrooted and was
generated using a Neighbor Joining algorithm implemented in
Clustal X. Note bootstrap values defining the three main ADAR
branches.
Found at: doi:10.1371/journal.pone.0008210.s001 (0.07 MB TIF)
Figure S2 C. elegans lifespan results using individual gene
mutant strains. C. elegans lifespan results using individual gene
mutant strains, as indicated. Eggs were isolated from gravid worms
and synchronized by hatching overnight in the absence of food.
The synchronized L1 larvae were then placed on OP50-
containing agar plates and allowed to develop to L4-stage larvae
at 20C. The L4-stage larvae were washed thoroughly, and placed
on Escherichia coli expressing double-stranded RNA (dsRNA) for
daf-2. Briefly, dsRNA -expressing bacteria were grown overnight
in LB with 50 ug/ml ampicillin and then seeded onto RNAi NGM
plates containing 5 mM isopropylthiogalactoside (IPTG). The
RNAi daf-2 bacteria were induced overnight at room temperature
for daf-2 dsRNA mediated knockdown expression. About 30
synchronized L4-stage animals were added to each well and
allowed to develop to adults, followed by the addition of FudR.
Worms were kept at 20C, and their lifespan was monitored.
Worms feeding on bacteria carrying the empty vector were used as
a negative control. Animals were scored every 1 to 2 days
subsequently and scored as dead when they no longer responded
to gentle prodding.
Found at: doi:10.1371/journal.pone.0008210.s002 (0.05 MB TIF)
Figure S3 Population structure of NECS centenarians and
controls, SICS centenarians and controls, and Illumina controls.
Population structure of NECS centenarians (blue) and controls
(red), SICS centenarians (green) and controls (orange), and Illumina
controls (grey). Each scatter plot shows the first two principal
components that were estimated using genotype data for more than
300K SNPs in NECS, SICS and Illumina subjects using the
program Eigenstrat. From top to bottom, left to right: (Blue) scatter
plot of the first two principal components in centenarians of the
NECS. The two principal components (PC1 displayed in the x-axis
and PC2 in the y-axis) identify 3 major clusters that based on the
ancestry of the NECS centenarians can be labeled as NW
Europeans (PC1,0.005 and 20.0125,PC2,0.0125), Ashkenazi
Jews (PC1.0.005 and PC2,20.0125) and SW Europeans/
Italians (PC1.0.005 and PC2.0.0125). The thresholds on the
principal components were identified by splitting the components
using mixture models. (Green) scatter plot of the first two principal
components in centenarians of the SICS. In agreement with the
analysis of NECS subjects, the centenarians of the SICS have a SW
European genetic background. (Red) scatter plot of the first two
principal components in controls of the NECS that display
approximately the same population substructure of centenarians;
(Grey) scatter plot of the first two principal components in the
Illumina controls. The plots show that the controls have a
population substructure similar to the NECS cases and controls
but also a larger level of admixture between the three European
subgroups. (Orange) scatter plot of the first two principal
components in controls of the SICS that exhibit the same SW
European genetic background of SICS centenarians. Note that the
plot of PC1 and PC2 for NECS controls (red) is repeated twice to
facilitate the two comparisons within NECS subjects and between
NECS and Illumina controls.
Found at: doi:10.1371/journal.pone.0008210.s003 (0.12 MB TIF)
Acknowledgments
We are grateful to the subjects and their families of the four centenarian
studies. We thank Elixir Pharmaceuticals and Fondazione Longevita for
the DNA from referent cohort subjects residing in Cilento, Italy and
Illumina for access to its control subject genotype database, and Ms Yukiko
Abe, and Ms Sanae Fujimaki (Division of geriatric medicine, Department
of Internal medicine, Keio University School of medicine) for their
technical assistance and excellent secretarial work.
Author Contributions
Conceived and designed the experiments: PS MM MHS GR CB TP.
Performed the experiments: PS MM TK MCW EM MM SEJF YA CVA
AK GA CB. Analyzed the data: PS MM NS SHH AS AM TP.
Contributed reagents/materials/analysis tools: PS MM AAP TK SLA
SHH YA AB NB DT AR MS TA YG MHS NH GA GR CB TP. Wrote
the paper: PS MM NS MHS GR CB TP.
References
1. Christensen K, Johnson TE, Vaupel JW (2006) The quest for genetic
determinants of human longevity: challenges and insights. Nat Rev Genet 7:
436–448.
2. Gudmundsson H, Gudbjartsson DF, Frigge M, Gulcher JR, Stefansson K (2000)
Inheritance of human longevity in Iceland. Eur J Hum Genet 8: 743–749.
3. Hjelmborg JV, Iachine I, Skytthe A, Vaupel JW, McGue M, et al. (2006)
Genetic influence on human lifespan and longevity. Hum Genet 119: 312–
321.
4. Kerber RA, O’Brien E, Smith KR, Cawthon RM (2001) Familial excess
longevity in Utah genealogies. J Gerontol A Biol Sci Med Sci 56: B130–139.
5. Perls T, Shea-Drinkwater M, Bowen-Flynn J, Ridge SB, Kang S, et al. (2000)
Exceptional familial clustering for extreme longevity in humans. J Am Geriatr
Soc 48: 1483–1485.
6. Perls TT, Wilmoth J, Levenson R, Drinkwater M, Cohen M, et al. (2002) Life-
long sustained mortality advantage of siblings of centenarians. Proc Natl Acad
Sci USA 99: 8442–8447.
7. Schoenmaker M, de Craen AJ, de Meijer PH, Beekman M, Blauw GJ, et al.
(2006) Evidence of genetic enrichment for exceptional survival using a family
approach: the Leiden Longevity Study. European Journal of Human Genetics
14: 79–84.
8. Terry DF, Wilcox MA, McCormick MA, Pennington JY, Schoenhofen EA,
et al. (2004) Lower all-cause, cardiovascular, and cancer mortality in
centenarians’ offspring. J Am Geriatr Soc 52: 2074–2076.
9. Christensen K, McGue M, Petersen I, Jeune B, Vaupel JW (2008) Exceptional
longevity does not result in excessive levels of disability. Proc Natl Acad Sci U S A
105: 13274–13279.
RNA Editing and Oldest Age
PLoS ONE | www.plosone.org 13 December 2009 | Volume 4 | Issue 12 | e8210
10. Hitt R, Young-Xu Y, Silver M, Perls T (1999) Centenarians: the older you get,
the healthier you have been. Lancet 354: 652.11. Terry DF, Sebastiani P, Andersen SL, Perls TT (2008) Disentangling the roles of
disability and morbidity in survival to exceptional old age. Arch Intern Med 168:
277–283.12. Atzmon G, Schechter C, Greiner W, Davidson D, Rennert G, et al. (2004)
Clinical phenotype of families with longevity. J Am Geriatr Soc 52: 274–277.13. Evert J, Lawler E, Bogan H, Perls T (2003) Morbidity profiles of centenarians:
survivors, delayers, and escapers. J Gerontol A Biol Sci Med Sci 58: 232–237.
14. Schoenhofen EA, Wyszynski DF, Andersen S, Pennington J, Young R, et al.(2006) Characteristics of 32 supercentenarians. J Am Geriatr Soc 54:
1237–1240.15. Finch CE, Tanzi RE (1997) Genetics of aging. Science 278: 407–411.
16. Salvioli S, Olivieri F, Marchegiani F, Cardelli M, Santoro A, et al. (2006) Genes,ageing and longevity in humans: problems, advantages and perspectives. Free
Radic Res 40: 1303–1323.
17. Sorkin J, Post W, Pollin TI, O’Connell JR, Mitchell BD, et al. (2005) Exploringthe genetics of longevity in the Old Order Amish. Mech Ageing Dev 126:
347–350.18. Perls T (2001) Genetic and phenotypic markers among centenarians.
J Gerontol A Biol Sci Med Sci 56: M67–70.
19. Perls T, Kunkel L, Puca A (2002) The genetics of aging. Curr Opin Genet Dev12: 362–369.
20. Barzilai N, Atzmon G, Schechter C, Schaefer EJ, Cupples AL, et al. (2003)Unique lipoprotein phenotype and genotype associated with exceptional
longevity. JAMA 290: 2030–2040.21. Atzmon G, Rincon M, Schechter CB, Shuldiner AR, Lipton RB, et al. (2006)
Lipoprotein genotype and conserved pathway for exceptional longevity in
humans. PLoS Biol 4: e113.22. Atzmon G, Pollin TI, Crandall J, Tanner K, Schechter CB, et al. (2008)
Adiponectin levels and genotype: a potential regulator of life span in humans.J Gerontol A Biol Sci Med Sci 63: 447–453.
23. Willcox BJ, Donlon TA, He Q, Chen R, Grove JS, et al. (2008) FOXO3A
genotype is strongly associated with human longevity. Proc Natl Acad Sci U S A105: 13987–13992.
24. Flachsbart F, Caliebe A, Kleindorp R, Blanche H, von Eller-Eberstein H, et al.(2009) Association of FOXO3A variation with human longevity confirmed in
German centenarians. Proc Natl Acad Sci U S A 106: 2700–2705.25. Vijg J, Campisi J (2008) Puzzles, promises and a cure for ageing. Nature 454:
1065–1071.
26. Kojima T, Kamei H, Aizu T, Arai Y, Takayama M, et al. (2004) Associationanalysis between longevity in the Japanese population and polymorphic variants
of genes involved in insulin and insulin-like growth factor 1 signaling pathways.Exp Gerontol 39: 1595–1598.
27. Sebastiani P, Zhao Z, Abad-Grau MM, Riva A, Hartley SW, et al. (2008) A
hierarchical and modular approach to the discovery of robust associations ingenome-wide association studies from pooled DNA samples. BMC Genetics 9: 6.
28. Yang Q, Rasmussen SA, Friedman JM (2002) Mortality associated with Down’ssyndrome in the USA from 1983 to 1997: a population-based study. Lancet 359:
1019–1025.29. Yang JH, Luo X, Nie Y, Su Y, Zhao Q, et al. (2003) Widespread inosine-
containing mRNA in lymphocytes regulated by ADAR1 in response to
inflammation. Immunology 109: 15–23.30. Finch CE, Morgan TE (2007) Systemic inflammation, infection, ApoE alleles,
and Alzheimer disease: a position paper. Curr Alzheimer Res 4: 185–189.
31. Maas S, Kawahara Y, Tamburro KM, Nishikura K (2006) A-to-I RNA editingand human disease. RNA Biol 3: 1–9.
32. Balding DJ (2006) A tutorial on statistical methods for population associationstudies. Nat Rev Genet 7: 781–791.
33. Schachter F, Faure-Delanef L, Guenot F, Rouger H, Froguel P, et al. (1994)Genetic associations with human longevity at the APOE and ACE loci. Nat
Genet 6: 29–32.
34. Vaupel JW, Carey JR, Christensen K, Johnson TE, Yashin AI, et al. (1998)
Biodemographic trajectories of longevity. Science 280: 855–860.
35. Morse DP, Aruscavage PJ, Bass BL (2002) RNA hairpins in noncoding regions
of human brain and Caenorhabditis elegans mRNA are edited by adenosine
deaminases that act on RNA. Proc Natl Acad Sci U S A 99: 7906–7911.
36. Tonkin LA, Saccomanno L, Morse DP, Brodigan T, Krause M, et al. (2002)
RNA editing by ADARs is important for normal behavior in Caenorhabditiselegans. EMBO J 21: 6025–6035.
37. Keegan LP, Brindle J, Gallo A, Leroy A, Reenan RA, et al. (2005) Tuning ofRNA editing by ADAR is required in Drosophila. EMBO J 24: 2183–2193.
38. Kenyon C, Chang J, Gensch E, Rudner A, Tabtiang R (1993) A C. elegansmutant that lives twice as long as wild type. Nature 366: 461–464.
39. Clancy DJ, Gems D, Harshman LG, Oldham S, Stocker H, et al. (2001)Extension of life-span by loss of CHICO, a Drosophila insulin receptor substrate
protein. Science 292: 104–106.
40. Tatar M, Kopelman A, Epstein D, Tu MP, Yin CM, et al. (2001) A mutant
Drosophila insulin receptor homolog that extends life-span and impairsneuroendocrine function. Science 292: 107–110.
41. Holzenberger M, Dupont J, Ducos B, Leneuve P, Geloen A, et al. (2003) IGF-1receptor regulates lifespan and resistance to oxidative stress in mice. Nature 421:
182–187.
42. Suh Y, Atzmon G, Cho M-O, Hwang D, Bingrong L, et al. (2008) Functionally
significant insulin-like growth factor 1 receptor mutations in centenarians. Proc
Natl Acad Sci U S A 105: 3438–3442.
43. Lee SS, Kennedy S, Tolonen AC, Ruvkun G (2003) DAF-16 target genes that
control C. elegans life-span and metabolism. Science 300: 644–647.
44. Knight S, Bass B (2002) The role of RNA editing by ADARs in RNAi. Mol Cell
Biol 10: 809–817.
45. Tonkin LA, Bass BL (2003) Mutations in RNAi rescue aberrant chemotaxis of
ADAR mutants. Science 302: 1725.
46. Lund J, Tedesco P, Duke K, Wang J, Kim SK, et al. (2002) Transcriptional
profile of aging in C. elegans. Curr Biol 12: 1566–1573.
47. Wang D, Ruvkun G (2004) The insulin pathway regulates RNAi in C. elegans.
Cold Spring Harbor Symposium on Quantitative Biology, 69th edition 69:429–433.
48. Price AL, Patterson NJ, Plenge RM, Weinblatt ME, Shadick NA, et al. (2006)Principal components analysis corrects for stratification in genome-wide
association studies. Nat Genet 38: 904–909.
49. Hinds DA, Stokowski RP, Patil N, Konvicka K, Kershenobich D, et al. (2004)
Matching strategies for genetic association studies in structured populations.Am J Hum Genet 74: 317–325.
50. Spiegelhalter DJ, Myles JP, Jones DR, Abrams KR (1999) Methods in healthservice research. An introduction to bayesian methods in health technology
assessment. BMJ 319: 508–512.
51. Thorleifsson G, Walters GB, Gudbjartsson DF, Steinthorsdottir V, Sulem P,et al. (2009) Genome-wide association yields new sequence variants at seven loci
that associate with measures of obesity. Nat Genet 41: 18–24.
RNA Editing and Oldest Age
PLoS ONE | www.plosone.org 14 December 2009 | Volume 4 | Issue 12 | e8210