rn - fs.fed.us
TRANSCRIPT


"When the sap begins to rise, they make a notch Rn the trunk of the tree, and by means of a pipe of wood inserted in it, upon which the liquor runs as in a gutter, and is received in a vessel below. That it might run in abundance, there should be much snow on the ground-that it freeze the night be- fore and that the heavens be serene-and that it should not be too cold in the day. As the sap thickens it runs the Iess, and in time it stops en- tirely."
Comments by M. L'Abbe de la Porte About the Huron Indians
April 8, 7 749
The Authors
KENNETH F. LANCASTER is Field Representative, Resource Management, for the Northeastern Area, State and Private Forestry, USDA Forest Service.
RUSSELL S. WALTERS is a Research Forester a t the a
Sugar Maple Laboratory of the Northeastern Forest Experiment Station of the USDA Forest Service.
FREDERICK M. LAING is Research Associate in the Department of Botany at the University of Vermont.
RAYMOND T. F'OULDS is Extension Forester a t the University of Vermont.
MANUSCRIPT RECEIVED FOR PUBLICATION 11 MAY 1973

A Silvicu tural Guide for Developing A SUGARBUSH
Abstract A practical guide for the management of a sugarbush. Guidelines
are established for the manipulation of stand density and stocking to promote the development of healthy vigorous trees with deep, wide crowns, the necessary attributes for highest possible yield of sugar- rich sap. Specific treatments are prescribed for sapling, poletimber and srnall sawtimber stands and a procedure is provided for testing a sugarbush for sweetness, to select trees for thinning.
WITH A STRONG demand for maple syrup-and healthy prices-a commer-
cial sap or syrup operation seems to be a very promising venture for a landowner. Sugarbush management is one technique for improving profit potential by increasing the yield of sweet sap. Even greater financial returns are possible by combining management with new methods of sap collection and processing.
We have established management guidelines for each size class of trees to help maximize gains from the sugarbush. These recommenda- tions are based on silvicultural observations and experience, current research, and related literature.
In sapling stands, the crop tree selection method is recommended. In pole stands and larger, stocking should be reduced to a point that would be considered understocked for timber production. This will promote rapid crown expansion and provide an acceptable level of sap production.
Background
Maple syrup is one of this country's oldest agricultural commodities. When the first set- tlers arrived in this country, Indians were using rnaple sugar as an important food item. The settlers eagerly adopted the Indians' source of sugar, and through the years maple sugar became an important article of diet.
Maple sugar production increased rapidly in this country until about 1860, when the cheaper cane sugar gradually began to replace maple sugar. Since then, except for an increase during World War I, production has been on the decline. Presently, very little sugar is being produced. The major emphasis is on syrup production. I n 1971, 962,000 gallons of syrup were made. This was the smallest amount produced in agy year since yearly estimates were begun in 1916,
The production of maple syrup has always been a farm enterprise, and recently has

proven to be a most profitable one. With the decline in the number of farms and in the ac- tive farm maple groves or sugarbushes, the opportunity has not diminished. In fact with modern equipment-plastic tubing, mechan- ical tapping tools, etc.- the opportunity has increased. The decline in production has brought record prices, so that profit potential for both the sap and syrup producer is now greater than ever before.
Sap collection accounts for 40 percent or more of the cost of syrup production. Reduc- ing this cost would have a strong influence on the returns from a syrup operation. Using trees that produce a high volume of sap with higp sugar content reduces the cost of han- dling the sap necessary to produce a given amount of syrup. These high-producing trees develop by good management of sugar maple stands and not by chance.
To manage \a sugarbush effectively, i t is essential to know the characteristics of a tree that will produce large volumes of sugar-rich sap. Research has shown that the ideal sugar- bush tree is a vigorous, fast-growing tree that has a deep, wide, fully developed crown ex- posed as much as possible to sunlight. It has also demonstrated that sugar maples possess- ing these characteristics tend to produce sweeter sap and greater quantities of sap than slower-growing, smaller-crowned trees. Trees with larger crowns have greater leaf surface area and therefore have a greater capacity to carry on photosynthesis-the mechanism that produces the carbohydrates, or sugar, stored within the tree.
Sap production per tree increases with live crown ratio, width of crown, and rate of diam- eter growth. In a study conducted by the Ohio Agricultural Experiment Station (Moore
typical of forest-grown trees. Growth rate, which is related to crown size, is strongly cor- related with sap yields. Moore et al., found that trees with a growth rate of 5 to 10 rings per inch yielded about 30 percent more sap than trees growing a t the rate of 15 to 20 rings per inch.
I t has long been known by those familiar with the maple business that some sugar maple trees are "sweeter" than others. Why some trees produce sweeter sap has been a matter of study for several years. Although some of the variability among trees can be attributed to genetic differences, environ- mental factors such as live crown ratio, crown diameter, and crown exposure all play a sig- nificant role.
Stevenson and Bartoo (1940), who reported on extensive sweetness studies in Pennsyl- vania, found that forest-grown trees produce sap about 30 percent lower in sugar content than open-grown trees. The sugar content of forest-grown trees averaged about 2.25 per- cent, in contrast to 3.34 percent for open- grown trees. Moore et al. (1951) and Morrow (1955), substantiated this correlation. Their reports indicate that open-grown trees are about 15 to 20 percent sweeter than forest- grown trees.
These known facts about sap sweetness and sap yields can easily be incorporated into field practice by careful tree selection. Ideally, trees that are inherently sweet should be iden- tified early, when they are small, and thin- nings should be made frequently to allow them to grow and expand rapidly. Identifying the sweeter trees in young stands and favoring them by judicious thinning can greatly im- prove sap production.
et al. 1951), the effects of these factors were identified. Trees with crowns averaging 50 to
Managing the Sugarbush
75 percent of the total height yielded about The objective of sugarbush management is 25 percent more sap than similar trees with a to produce the highest possible yield of sugar- crown ratio of less than 50 percent. rich sap per acre. This is accomplished through
Width of crown had a more dynamic effect. the manipulation of stand density and stock- Trees with crowns over 30 feet wide, crowns ing to foster the .development of healthy, characteristic of trees in an open stand, pro- vigorous trees with deep, wide crowns. duced over 100 percent more sap than trees Although much has been written on the sub- having the same stem diameter but with ject, two publications "A Guide to Sugarbush crowns less than 20 feet wide, a crown size Stocking", by Srnith and Gibbs (1970) and

in Vermont", by Foulds e t al. (1 956) prob- ably have the greatest applicability. Both papers summarize existing knowledge on the subject and both are based on maximum crown size related to tree diarneter LInd num- ber of t?rees per acre, The recommendations that follow are based essentially on the in- formation presented in these two papers and other pertinent data, and expanded to include a technique of stand analysis not dissimilar to timber management, In fact, thz method suggested uses the same stand-examination methods and prescription-writing procedures used in timber management (Leak et al. 1969).
The "Diagnostic Tally Sheet for Sugarbush Stands" (Table 1) provides the means of gathering the data necessary for making sound management decisions. The tally is used to deterrnine th; number of trees and basal area per acre, the necessary ingredients of the "Stocking Chart" (fig. 1) for even-aged north- ern hardwoods. The chart provides the means of comparing existing stand stocking with the suggested stocking levels for increased sap yield. For example, in figure 1, the B level represents minimum stocking for timber ob- jectives. The C level is considered as under- stocked for quality timber production, but in pole and larger stands not previously thinned it is an acceptable level for improving sap production. The S level is the minimum stock- ing for maximum crown development with full
if there are 80 to 100 well distributed sugar maple trees per acre. For stands averaging 6 inches in diameter and over, use the '"iagnostic Tally Sheet for Sugarbush Stands." Take 4 to 10 sample points with a 10-factor prism and count only trees in the main crown canopy, the intermediate to dominant trees. Record the trees by diameter class in the proper block of the cumulative tally. Summarize plot data and determine the total number of trees and basal area per acre for the stand. Use the stocking chart to determine the basal area a t the C level or the level selected for management. Insert data under stand description and use i t as the basis of a stand prescription.
11. Stand Prescription
I. Saplings
Thinning should start early in the life of the stand when trees average 2 to 4 inches in diarneter, and should be made a t 5 to 10-year intervals. Early thinning encourages the development of large side branches and increases rapid diarn- eter growth. I t is a t this young age that deep crowns can be maintained or developed most successfully. The crop tree selection method can be applied quite successfully in these stands. In writing the prescription con- sider the following:
utilization of crown space. However, this ideal a. To insure adequate stocking of crown development is attainable only if man-
agement is started early in the life of the about 80 to 100 trees when the stand reaches an average size of 10 inches stand-at sapling or small pole size-and in diameter, select 100 to 125 domi- carried to stand maturity. nants or co-dominants with good
Field Procedures and Prescriptions
I. Stand Analysis
In sapling stands averaging between 2 and 4 inches in diameter, the intent of stand analysis is to determine if there are enough
stem and crown forrns, free of defects such as acute forking.
b. Favor the sweet tree. Use a sugar refractometer (fig. 2) to measure the amount of sugar in the sap. For test- ing a sugarbush for sweetness, fol- low the field procedure suggested in the next section.
maple trees for management., This assess- c. Free of the crowns of the selected rnent can usually be made by a cursory crop trees on all sides to create open- observation. A stand is adequately stocked ings between crowns of 6 to 7 feet.

Ta
ble
1 .-
Dia
gn
ost
ic
tally
sh
eet
for
sug
arb
ush
sto
n&
[Fo
r th
e d
eter
min
atio
n o
f th
e nu
mbe
r of
tre
es p
er a
cre,
ave
rage
st
and
dia
met
er, s
tock
ing,
an
d s
paci
ng fo
r su
gar
bu
sh m
anag
emen
t]
---- m
-- --
Db
h
Num
ber
of
tree
s ta
llie
d ---
" -----
--
--
(in
ches
) 1
2 3
4 5
6 7
8 @
9
10
11
12
13
14
15
2 45
8 91
7 13
75
1834
22
92
2750
32
09
3667
41
25
4584
50
42
5501
59
59
6417
68
76
--
- ---
----
4
115
229
344
458
573
688
802
917
1031
11
46
1260
13
75
1490
16
04
1719
8 29
57
8
6
115
143
172
201
229
258
287
315
344
372
401
430
-- -
10
18
37
55
73
92
110
128
147
165
-- --p
183
202
220
238
257
275
- --
-. - -- - -
---
12
1
3
25
38
5 1
64
76
89
102
115
--
127
140
153
165
178
191
- - -
-- -
---
- --
14
9
19
28
37
47
56
65
75
84
94
103
112
16
7 14
2 1
29
36
43
50
5 7
64
72
79
86
Ta
lly
Leg
end
--
--
--
18
6
11
17
23
28
34
40
45
51
57
62
68
/
-----
-- ----
20
5 9
14
18
23
27
32
37
41
O
24
---
3 6
10
13
1
6
19
22
25
29
Nun
zber
of
26
3 5
8 11
14
16
19
22
24
pl
ots
No
. o
f tr
ees/
acre
-
--
- - - - - -
- -
- -
28
2 5
7 9
12
14
16
19
21
-
- -
---.-
---
Tot
al N
um
ber
of
Tre
es P
er A
cre.
-Add
-the
la
st f
igur
es c
heck
ed o
n ea
ch l
ine
and
div
ide
by
the
num
ber
of
poin
t sa
mpl
es t
alli
ed.
BA
Per
Acr
e.-A
dd
the
tota
l nu
mbe
r of
en
trie
s in
eac
h si
ze c
lass
, m
ulti
ply
by 1
0 an
d d
ivid
e by
th
e nu
mbe
r of
po
int
sam
ples
tal
lied
. (B
A f
acto
r =
10)
ST
AN
D D
ES
CR
IPT
ION
: N
umbe
r of
tr
ees
per
acr
e-
Tre
es p
er a
cre
at
C l
ev
el
(o
r le
vel
sele
cted
for
man
agem
ent)
ST
AN
D P
RE
SC
RIP
TIO
N:
BA
per
acr
e A
vera
ge s
tan
d d
bh _
---_
__
__
,
-
Mar
k f
or c
utt
ing
-
__
_ t
rs
=
BA
or
gir
dlin
g (T
ota
l min
us C
or
sele
cted
leve
l)
BA
at
C l
ev
el
(o
r se
lect
ed
leve
l) Ave
rage
cro
p t
ree
spac
ing
feet

Figure 1.-Stocking chart for even-aged northern hardwoods, based on number of trees in the main canopy, average diameter, and basal area per acre. For timber objectives, stands above the A line are overstocked. Stands between A and B lines are adequately stocked. Stands between B and C line should be adequately stocked within 10 years. Stands below the C line are definitely understocked. For sugarbush management, maple stands at the S line are at minimum stocking levels.
TREES P E R ACRE
Figure 2.-The sugar refractomcter: (a) cover; (b) dark circular area where drop of rap is placed: (c) glass prism: (d) eyepiece; (e) small adjustment screw is l~sed in calibrating the instr~~ment.
5

d. Select one crop tree within each In the application of management: - spacing distance, 20 to 25 feet, and
a. Identify the sweetest trees for re- crown release it. Leave trees between tention in the stand. Determine
the crop trees that are not competing sweetness in the fall or during the for crown space.
sugaring season.
2. Poletimber b. Reduce the stocking to the C level
The objective in stands of 6 to 10 inches diameter is to iaprove growing condi- tions for desirable crop trees by achiev- ing good spacing between crowns. A comparison of present stocking in basal area with the recommended level will provide the basis for a sound prescrip- 4. tion for management. In thinning poletimber stands:
SB a. Favor the sweet tree as determined by the refractometer measurements made in the fall or spring.
b. In stands previously thinned for crow* expansion, reduce the stock- ing level to bring it between the C and S lines, giving proper considera- tion to distribution of trees and crown development needs.
and strive for an even distribution of stems. If the stand was previously thinned or is sparsely stocked, reduce stocking below the C level and close to the S level to allow for continued expansion of crowns.
Large Sawtimber, 15 inches or more
Stands of this size class, grown under forest conditions for the most part, will benefit little from thinning. Any cul- tural activity should aim to improve the health of the stand by removing de- cayed sugar maples, trees of other species, and poor-risk trees or trees susceptible to wind breakage. Removal will usually be on a tree-by-tree basis rather than by stocking or spacing. In overmature stands or stands that need to be regenerated, clearcutting in
c. Stands - ~ o t previously thinned for strips, patches, or groups of $$-acre or sap production: Reduce the stocking more is recommended. The size of the to the C level. The first thinning of patch or management unit will vary these stands entails some danger of depending on topography and accessi- sunscald, insects, and windthrow, but bility. In all cases, the opening must be these dangers are minimized if stock- easily identified on the ground and ing is not reduced below the C level. easily managed as a unit.
3. Small Sawtimber
The greatest immediate response in stands averaging 12 to 15 inches in diam- eter can be brought about by the in- creased diameter growth that accom- panies crown expansion. Fast growing trees, free to grow, produce significantly more sap than slow-growing competing trees. If these stands are being tapped, there will be a period of reduced sap production after thinning because there are fewer trees to tap. Within a short time, hokvever, sap yield will start to increase, and if conditions are suitable, will continue to do so until production exceeds that before thinning.
Field Procedure for Testing A Sugarbush for Sweetness
The percentage of sugar maple sap may vary considerably during the day as well as from day to day and season to season. To obtain comparable data when testing a group of trees, the testing must be done within a short time. In testing a large number of trees, such as an entire sugarbush, do not try to test all the trees a t once. The best method might be to consider the readings from trees tested in a 2-hour period as one group of comparable readings, and readings taken during the next 2-hour period as a separate group. This can

Figure 3.-Testing sugar maple sap for sweetness can be accorn- ~ l ished by collecting a drop of sap for the sugar refractometer. Use an awl (A) to pierce the bark into the wood, insert a hypodermic needle (B) firmly into the wood, or use an ordinary toothpick (C).
be continued as long as the sap flow lasts. works very well (fig. 3b). Those with large Sugar readings can be compared within each bores and short stems are the most durable. group, but comparisons should not be made A good choice would be a 13-gage needle with between groups. a I-inch stem. The needle should be pressed
od begins, sap in some trees will start running before others. At the end of a flow, some trees stop before others. To avoid repeated trips to some trees to obtain a sap sample it is best to wait until the flow has we11 started before beginning the testing and to stop as soon as a few trees are found to have stopped flowing.
A sugar refractometer should be used for testing sap because i t is fast and accurate and requires only a drop of sap to obtain a reading. The simplest way of obtaining a drop of sap is to cut a twig or small branch with pruning shears. On those trees where twigs or small branches are not within reach, a hole must be made in the trunk of the tree. Because sap from twigs give a higher reading than sap from tree trunks, it is important when testing a sugarbush that only one source be used-the twig or the trunk.
In obtaining sap from the trunk, first make a hole through the bark with a sharp awl (fig. 3a). Some sort of device must be inserted in the hole to carry sap away from the tree, and it has been found that a h y p o d e r ~ c needle
firmly or tapped into the hole. I t is important that needles be washed before they are reused.
Whichever method is used, twig or trunk, you can avoid waiting for the drop of sap to appear by working several adjacent trees be- fore testing the sap for sweetness.
With care, sharp toothpicks can be substi- tuted for needles with the same results (fig. 3c). They must be pushed firmly into the wood so they are held firmly. Also, they must rest on the bottom of the hole a t the outer edge, otherwise, the sap will run down the bark.
To find the sweetest trees as a guide to thinning a young stand, the first requirement is to establish an average. This can be deter- mined by testing each tree or every second or third tree along a transect. Areas that include any major change in slope or exposure within the sugarbush should be tested separately. The sum of the readings from these sample trees, divided by the number of samples, establishes the working average for that particular testing period. Trees with readings below average should be identified with colored ribbon or

paint spots. In thinning, remove as many of these trees of below-average sweetness as necessary to produce the desired stocking. A separate working average for sample trees should be computed for every 2- to 4-hour testing period, for best results.
Weather conditions play an important part in testing with any of the procedures men- tioned above. Rain q snow may permit dilu- tion of the sap drop and give incorrect read- ings. Moderate or stronger winds may blow the sap drops away or may concentrate the sugar by evaporating some of the water if the drop is exposed very long. The sap will run longer if the needles or toothpicks are in- serted on the warmer side of the tree.
e Conclusion
These management guidelines were devel- oped to improve sugarbush profit potential by increasing yields of sweet sap. This is ac- complished through manipulation of stand density and stocking to promote development of healthy, vigorous trees with deep, wide crowns. Best results are achieved when man- agement is started a t an early age, preferably when the trees -are sapling size. Thinnings should not only favor trees with good condi- tion and position but also those with superior sweetness or sugar content.
In sapling stands, the crop tree selection method is recommended. Thinnings in these stands should be light and frequent, no more than 5 to 10 years apart. In pole stands and larger, reducing the stocking to a point that would be considered understocked for timber production will promote rapid crown expan- sion and maximum sap production.
Literature Cited
Cope, J. A. 1946. THE SILVICCLTURE OF THE SUGARBUSH. J. FOR. 44: 642-649.
Foulds, R. T. Jr., J. Weir, E. B. Walter, and R. A. Farrington.
1956. STANDARDS FOR SUGARBUSH MANAGEMENT IN VERMONT. Vt. Dep. For. Parks, 4 p.
Jones, C. H. 1967. THE MAPLE RlJLE OF EIGHTY-SIX. Natl. Maple Syrup Dig. 6: 18-19.
Leak, W. R., D. S. Solomon, and S. M. Filip. 1969. A SILVICULTURAL GUIDE FOR NORTHERN HARD- WOODS IN THE NORTHEAST. USDA For. Serv. Res. Pap. NE-143, 34 p., illus.
McIntyre, A. C. 1932. THE MAPLE PRODUCTS INDUSTRY OF PENN- SYLVANIA. Pa. State Coll., Sch. Agrie. Exp. Sta. Bull. 280, 47 p., illus.
Moore, H. R., W. R. Anderson, and R. H. Baker. 1951. OHIO MAPLE SYRUP . . . SOME FACTORS IN- FLUENCING PRODUCTION. Ohio Agrie. Exp. Sta. Res. Bull. 718, 53 p., illus.
Morrow, R. R. 1955. INF'LUENCE OF TREE CROWN ON SAP PRODUC- TION. N. Y. Agric. Exp. Sta. Bull. 916, 30 p., illus.
Nyland, R. D., and V. J. Rudolph 1969. PROFITABLE TAPPING OF SUGAR MAPLES I N MICHIGAN'S LOWER PENINSULA. Mich. State Univ. Agric. Exp. Sta. and Coop. Ext. Ser. Res. Rep. 81, 11 p., illus.
Robbins, P. W. 1960. THE YIELD OF MAPLE SAP PER TAPHOLE. Q. Bull. Mich. Agric. Exp. Sta., 43: 142-146.
Rudolph, V. J. 1969. SGGARBUSH MANAGEMENT. Natl. Maple Syrup Dig., 7: 18-19.
Stevenson, D. C . , and R. A. Bartoo. 1940. COMPARISON OF THE SUGAR PERCENT OF SAP IN MAPLE TREES GROWING IN OPEN AND DENSE STANDS. Pa. State For. Sch. Res. Pap. 1, 3 p.
Smith, H. C., and C . B. Gibbs. 1970. A GUIDE TO SUGARBUSH STOCKING USDA For. Serv. Res. Pap. NE-171, 8 p., illus.
Smith, H. C., and G. M. Keiser. 1971. TESTING SUGAR MAPLE FOR SWEETNESS WITH A REFRACTOMETER. USDA For. Serv. Res. Note NE-138, 4 p., illus.
WiHits, C . 0. 1965. REV. MAPLE SYRUP PRODUCERS MANUAL. USDA Agr. Handb. 134, 112 p., illus.

Appendix
Rules of Thumb a. An ideal sugarbush has at least 1000 or more
tapholes or 70 to 90 taps per acre. _ b. Sap from four tapholes will yield about 1 gallon of syrup per year.
c. The compass location of the taphole is not im- portant.
d, Normal sap yield per tap will range from 5-20 gallons per season. This can be increased to 25 gallons or more by using a vacuum pump.
e. Trees in the 18- to 20-inch diarnekr class will produce over 50 percent more sap per taphole than 8- to 10-inch trees.
f. "Rule of 86" by Jones (1967). This give the amount of sap required to produce a gallon of syrup at various levels of sap sugar content. As an example, it takes about 86 gallons of sap of 1 percent sugar to produce 1 gallon of syrup. Only 43 gallons of 2 percent sap are required to produce 1 gallon of syrup. In other words, to establish the sap-syrup relationship, divide the percentage of sugar in the sap into 86.
11 Table 2.-Number o f tapholes that can safely be
made in a tree -. -
Diameter Tapholes per tree
Inches Less than 10 10-14 15-19 20-24 25 or more
No. 0 1 2 3 4
111 Table 3.-Comparison of average sap flow of sugar maple a n d soft maple, arranged b y diarnefer classes on basis of number of buckets per tree of both species. Somerset County, Pennsylvania, 7 93 7 (Mclntyref
Average Sugar Soft Dimeter number of maple
class buckets Average Average hung flow flow
Inches No. Quarts* Quarts* 9-16 1.0 8.9 5.5
17-23 1.5 15.1 7.4 24-28 2.2 17.7 12.5 29-33 2.8 22.4 13.4 34-36 3.6 27.7 20.3 37-45 3.8 31.7 18.9
Soft maple trees produce less sap that is less sweet than hard maple trees.
+Sap Aow during a short period-not a seasonal flow.
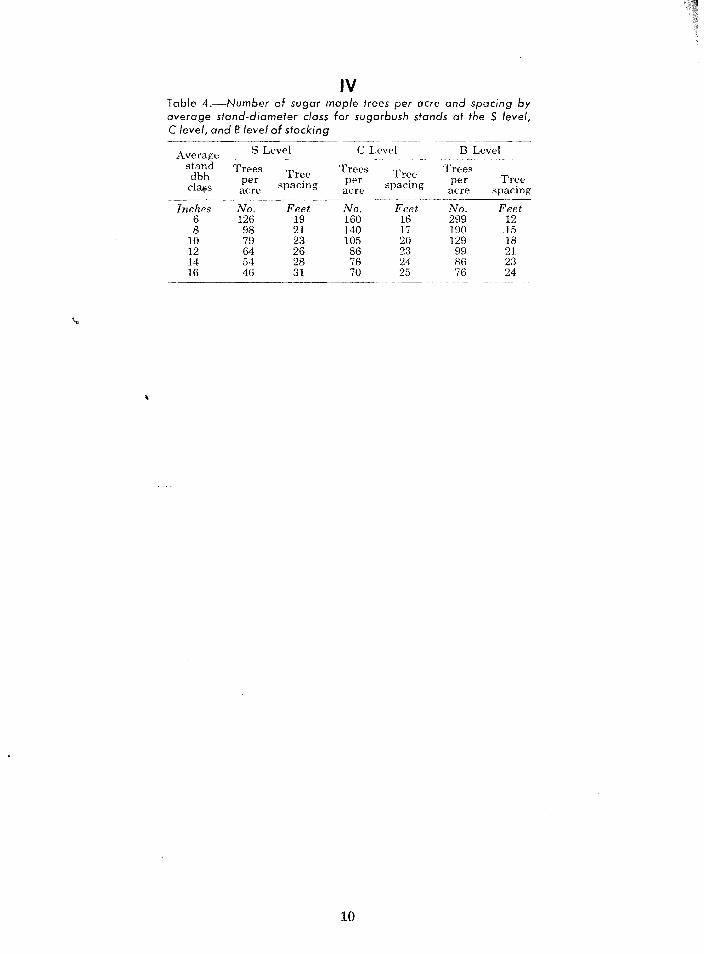
Table 4.-Number of sugar maple trees per acre and spacing by average stand-diameter class for sugarbush stands af the S level, C level, and 6 level of stocking
Average C Level B Level --
stand Trees dbh per Tree Trees Tree Trees per Tree ~ 1 ~ s acre 'pacing g& 'pacing acre spacing
Inches No. Feet No. Feet No. Feet 6 126 19 160 16 299 12 8 98 2 1 140 17 190 15
10 79 23 105 20 129 18 12 64 26 86 23 99 2 1 14 54 28 76 24 86 23 16 46 3 1 70 25 76 24

Tab
le 5
.-E
xam
ple
o
f us
e o
f th
e d
iag
no
stic
tal
ly s
hee
t fo
r su
gar
bu
sh s
tan
ds
X"
[Fo
r th
e det
erm
inat
ion o
f th
e nu
mbe
r of
tre
es p
er a
cre,
aver
age
stan
d d
iam
eter
, sto
ckin
g, a
nd s
paci
ng f
or s
ugar
bush
man
agem
ent]
--------
----
-
Dbh
- N
umbe
r of
tree
s ta
llie
d
-----
- (i
nch
es)
1 2
3 4
5 6
7 8
9
bo
I1
13
14
15
12
----
-----
2 458
917
1375
1834
2292
2750
3209
3667
4125
4584
5042
5501
5959
6417
6876
- - - ------
-----
----
- v
4 --
115
229
344
458
573
688
802
917
1831
1146
1260
1375
1490
1604
1719
--
- --
-- ------
6 /51
;)lo2
/153
/204
x255
/306
/357
/407
458
509
560
611
662
713
764
-- --
-
-A
"
- ,/ 57
/ 86
/I15
/I43
/172
x201
/229
258
287
315
344
372
401
430
8
/29
-- - -
- --
10
/ 18
/ 37
(3 55
/ 73
/ 92
/ 110
128
147
165
--- --
- - -
- - - - -
-
183
202
220
238
257
275
---
-
---
-- --
--
12
/13
/25
/38
-----
51
64
76
89
102
115
--
127
140
153
165
178
191
-- ---
-- -
- - - -
- --
-
14
9
19
28
37
47
56
65
75
84
94
103
112
---
-- T
all
y L
egen
d 16
C7 /I4
2 1
29
36
43
50
57
64
72
79
86
-
18
6 11
17
23
28
34
40
45
51
57
62
68
P
--
MA
~~
20
5
9 14
18
23
27
32
37
41
0
p>ir
? ,
Nu
mbe
r o
f pl
ots
x [j
t llc
: q
t-
*<
ic )
No
, of
tree
s/ac
re
Tot
al N
um
ber
of
Tre
es P
crr
Acr
e.-A
dd
the
last
fig
ure
s ch
eeke
d on
eac
h li
ne
and d
ivid
e by
th
e num
ber
of
poin
t sa
mple
s ta
llie
d.
'j 7
+ 2 2
7 +
, , *
+ 3 8 /4
7
-1-
L
= Jp
BA
Per
Acr
e.-A
dd
the
tota
l num
ber
of
entr
ies
in e
ach
size
cla
ss,
mult
iply
by 10 a
nd d
ivid
e by
th
e num
ber
of
poin
t sa
mple
s ta
llie
d.
(BA
fac
tor =
10)
27 X
lo
; d7
3 -:
= h
d
ST
AN
D D
ES
CR
IPT
ION
: N
um
ber
of
tree
s per
ae
re
dz
Tre
es p
er a
cre
at
C l
evel
/+
3
(or
leve
l se
lect
ed f
or
man
agem
ent)
ST
AN
D P
RE
SC
RIP
TIO
N:
- 2
Mar
k f
or
cutt
ing
tree
s =
& B
A
or g
irdli
ng
(To
tal m
inus
C o
r se
lect
ed le
vel
)
BA
per
acr
e LS
BA
at
c le
vel
Jbc
(or
sele
cted
lev
el) A
vera
ge c
rqp t
ree
spac
ing
feet
4'
Ave
rage
sta
nd d
bh - %
:-L
.