rm of boulton information bulletin 97-25
TRANSCRIPT
Rural Municipality of Boulton
Information Bulletin 97-25
Rural Municipality of Boulton Information Bulletin 97-25 Page 1
Rural Municipality of Boulton
Information Bulletin 97-25
Prepared by:
Manitoba Land Resource Unit,Brandon Research Centre, Research Branch,Agriculture and Agri-Food Canada.
Department of Soil Science, University of Manitoba.
Manitoba Soil Resource Section,Soils and Crops Branch, Manitoba Agriculture.
Printed October, 1997
Page 2 Information Bulletin 97-25 Rural Municipality of Boulton
PREFACE
This is one of a new series of information bulletins for individual
rural municipalities of Manitoba. They serve to introduce the newly
developed digital soil databases and illustrate several typical derived
and interpretive map products for agricultural land use planning
applications. The bulletins will also be available in diskette format
for each rural municipality.
Information contained in this bulletin may be quoted and utilized
with appropriate reference to the originating agencies. The authors
and originating agencies assume no responsibility for the misuse,
alteration, re-packaging, or re-interpretation of the information.
This information bulletin serves as an introduction to the land
resource information available for the municipality. More detailed
information, including copies of the primary soil and terrain maps
at larger scales, may be obtained by contacting
Manitoba Land Resource Unit
Room 360 Ellis Bldg, University of Manitoba,
Winnipeg, Manitoba R3T 2N2
Phone: 204-474-6118 FAX: 204-474-7633.
CITATION
Manitoba Land Resource Unit, 1997. Soils and Terrain. An
Introduction to the Land Resource. Rural Municipality of Boulton.
Information Bulletin 97-25, Brandon Research Centre, Research
Branch, Agriculture and Agri-Food Canada.
ACKNOWLEDGEMENTS
This project was supported under the Canada-Manitoba Agreementof Agricultural Sustainability.
The following individuals and agencies contributed significantly tothe compilation, interpretation, and derivation of the informationcontained in this report.
Managerial and administrative support was provided by:
R.G. Eilers, Head, Manitoba Land Resource Unit, BrandonResearch Centre, Research Branch, Agriculture and Agri-FoodCanada.G.J. Racz, Head, Dept. of Soil Science, University of Manitoba.F. Wilson, Manager, Manitoba Land and Soil Programs, PFRA,Agriculture and Agri-Food Canada.K.S. McGill, Chief, Land Utilization and Soil Survey, Soils andCrops Branch, Manitoba Agriculture.
Technical support was provided by:
G.W. Lelyk, Manitoba Land Resource Unit, Brandon ResearchCentre, Research Branch, Agriculture and Agri-Food Canada.J. Fitzmaurice, N. Lindberg, A. Waddell, M. Fitzgerald and S. Grift,Dept. of Soil Science, University of Manitoba.J. Griffiths, C. Aglugub, Manitoba Soil Resource Section, Soils andCrops Branch, Manitoba Agriculture.R. Lewis, PFRA, Agriculture and Agri-Food Canada.G.F. Mills, P.Ag, Winnipeg, Manitoba
Professional expertise for data conversion, correlation, andinterpretation was provided by:
W.R. Fraser and W. Michalyna, Manitoba Land Resource Unit,Brandon Research Centre, Research Branch, Agriculture and Agri-Food Canada.P. Haluschak and G. Podolsky, Manitoba Soil Resource Section,Soils and Crops Branch, Manitoba Agriculture.
Rural Municipality of Boulton Information Bulletin 97-25 Page 3
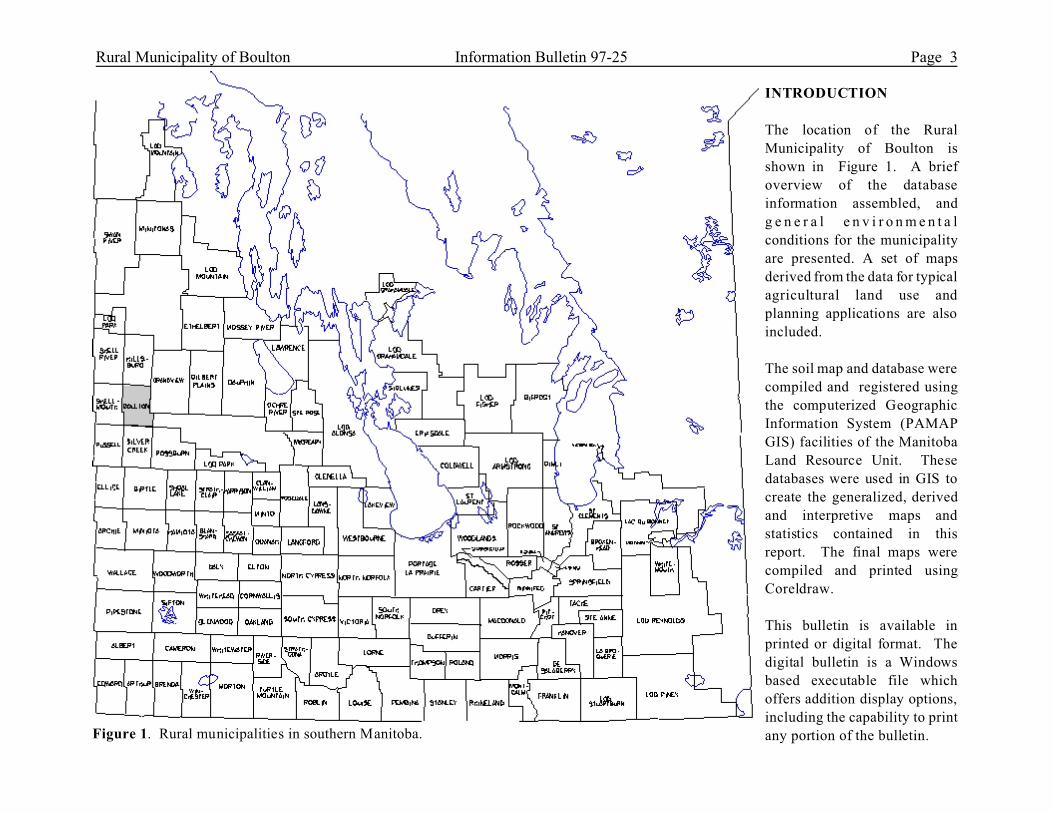
Figure 1. Rural municipalities in southern Manitoba.
INTRODUCTION
The location of the Rural
Municipality of Boulton is
shown in Figure 1. A brief
overview of the database
information assembled, and
g e n e r a l e n v i r o n m e n t a l
conditions for the municipality
are presented. A set of maps
derived from the data for typical
agricultural land use and
planning applications are also
included.
The soil map and database were
compiled and registered using
the computerized Geographic
Information System (PAMAP
GIS) facilities of the Manitoba
Land Resource Unit. These
databases were used in GIS to
create the generalized, derived
and interpretive maps and
statistics contained in this
report. The final maps were
compiled and printed using
Coreldraw.
This bulletin is available in
printed or digital format. The
digital bulletin is a Windows
based executable file which
offers addition display options,
including the capability to print
any portion of the bulletin.
Page 4 Information Bulletin 97-25 Rural Municipality of Boulton
Rural Municipality of Boulton Information Bulletin 97-25 Page 5
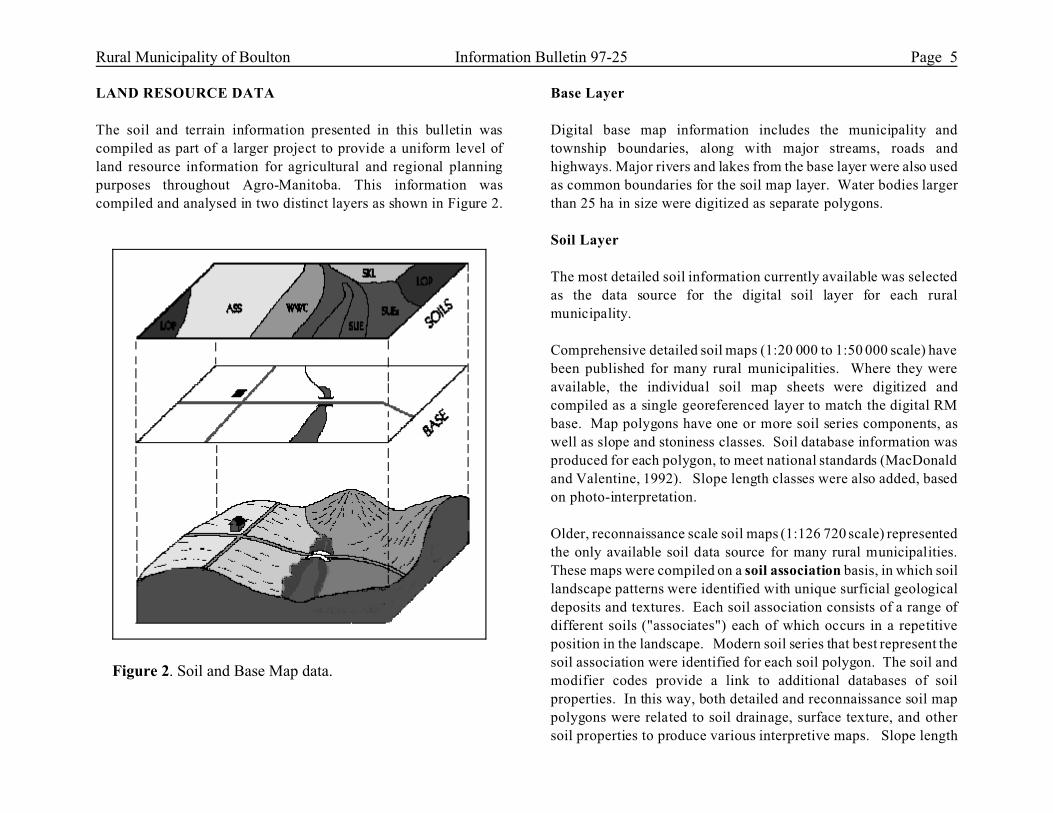
Figure 2. Soil and Base Map data.
LAND RESOURCE DATA
The soil and terrain information presented in this bulletin was
compiled as part of a larger project to provide a uniform level of
land resource information for agricultural and regional planning
purposes throughout Agro-Manitoba. This information was
compiled and analysed in two distinct layers as shown in Figure 2.
Base Layer
Digital base map information includes the municipality and
township boundaries, along with major streams, roads and
highways. Major rivers and lakes from the base layer were also used
as common boundaries for the soil map layer. Water bodies larger
than 25 ha in size were digitized as separate polygons.
Soil Layer
The most detailed soil information currently available was selected
as the data source for the digital soil layer for each rural
municipality.
Comprehensive detailed soil maps (1:20 000 to 1:50 000 scale) have
been published for many rural municipalities. Where they were
available, the individual soil map sheets were digitized and
compiled as a single georeferenced layer to match the digital RM
base. Map polygons have one or more soil series components, as
well as slope and stoniness classes. Soil database information was
produced for each polygon, to meet national standards (MacDonald
and Valentine, 1992). Slope length classes were also added, based
on photo-interpretation.
Older, reconnaissance scale soil maps (1:126 720 scale) represented
the only available soil data source for many rural municipalities.
These maps were compiled on a soil association basis, in which soil
landscape patterns were identified with unique surficial geological
deposits and textures. Each soil association consists of a range of
different soils ("associates") each of which occurs in a repetitive
position in the landscape. Modern soil series that best represent the
soil association were identified for each soil polygon. The soil and
modifier codes provide a link to additional databases of soil
properties. In this way, both detailed and reconnaissance soil map
polygons were related to soil drainage, surface texture, and other
soil properties to produce various interpretive maps. Slope length
Page 6 Information Bulletin 97-25 Rural Municipality of Boulton
classes were also added, based on photo-interpretation.
Rural Municipality of Boulton Information Bulletin 97-25 Page 7
SOIL AND TERRAIN OVERVIEW
The Rural Municipality (RM) of Boulton covers an area of 6
townships (approximately 58 163 hectares) of land in western
Manitoba (page 3). Approximately 20 percent of this land area is in
the Riding Mountain National Park. There are no major population
centres in the municipality and agriculture services generally are
provided from larger towns in the surrounding region.
The climate in the municipality can be related to the weather data
from Russell. The mean annual temperature is 1.1/C and the mean
annual precipitation is 484 mm (Environment Canada, 1993). The
average frost-free period is 104 days and degree-days above 5/Caverage 1450 (Ash, 1991). The calculated seasonal moisture deficit
for the period between May and September is 200 to 250 mm. The
estimated effective growing degree days (EGDD) above 5/Caccumulated from date of seeding to the date of the first fall frost is
1200 to 1400 (Agronomic Interpretations Working Group, 1995).
These parameters provide an indication of moisture and heat energy
available for crop growth. As most of the land in the RM occurs at
higher elevations, the growing season available for crop growth is
somewhat cooler and shorter than that indicated for Russell.
Physiographically, the RM of Boulton is located in the Saskatchewan
Plain (Canada-Manitoba Soil Survey, 1980). The majority of the RM
occurs in the Riding Mountain Upland whereas the southwest portion
is at a slightly lower elevation in the Newdale Plain. Elevations range
from 570 m asl in the southwest to 630 m in the Riding Mountain
Upland. A steep sided glacial meltwater channel entrenched some 30
m into the land surface drains northwesterly to the Valley River.
Birdtail Creek flows to the east and south in a similar valley. The land
surface in the RM is generally hummocky with local relief of 3 to 9
m and slopes of 5 to 9 percent. Local areas of higher relief in excess
of 9 m and slopes of 9 to 15 percent also occur. An undulating to
hummocky area with lower relief and slopes of 2 to 5 percent occurs
in the southwest portion of the RM and along the northeast boundary
of the municipality (page 9).
The soil materials in this RM consist primarily of loamy textured
glacial till (morainal) deposits. Local areas of thin, loamy lacustrine
sediments underlain by stratified sand and gravel which in turn are
underlain by water-worked loamy glacial till occur near the glacial
meltwater valleys (page 11).
Soils in the municipality have been mapped at a reconnaissance
level (1:126 720 scale) and published in the soil survey reports for
the Rossburn and Virden map sheet areas (Ehrlich et al., 1956) and
the Grandview map sheet area (Ehrlich et al., 1959). The soils in the
municipality are classified as dominantly Gray Luvisols (Waitville
Association) and Dark Gray Chernozems (Erickson Association) ith
significant areas of Black Chernozems (Newdale Association) in the
southwest part of the RM (Expert Committee on Soil Survey,
1987). Local areas of poorly drained soils (Gleysols) and shallow
organic (peat) soils are common in depressional areas of the
landscape. Regosolic soils occur on stratified minor stream deposits
in the valleys and on steeply sloping areas of eroded slopes (page
11). A more detailed and complete description of the type,
distribution and textural variability of soils in the municipality is
provided in the published reconnaissance soil surveys (Ehrlich et al.,
1956, 1959).
External drainage of the municipality is facilitated via tributaries to
the Valley River to the north, Shell River to the west and Birdtail
Creek to the south. Drainage of hummocky terrain in the
municipality is generally poorly developed and characterized by
numerous enclosed poorly drained depressions and potholes
containing shallow ponds and small lakes. The majority of soils in
the RM are well drained with minor areas of imperfect drainage on
lower slopes. Areas of poorly drained and peaty soils are common
in the depressional areas throughout this landscape (page 13).
Salinity is a minor concern in the RM (page 15), occurring at only
a few locations, usually in association with imperfectly drained
soils on lower slopes in the landscape. Other management
considerations are primarily related to topography and drainage
Page 8 Information Bulletin 97-25 Rural Municipality of Boulton
(page 17). There are no significant soil textural considerations (sandy
or clayey soils) or bedrock outcrops to contend with in this RM. Most
of the soils are variably stony. Within some areas bordering the
meltwater channels, the soils have been modified by stream erosion
and as a result, are coarse textured and frequently very stony.
Nearly 48 percent of the land in the RM rated as Class 3 for
agriculture capability (page 19) and about 47 percent of the area is
rated Fair for irrigation suitability (page 21). Topography is the main
limitation. Well drained soils of the Newdale association in gently
sloping landscapes are rated in Class 2 for agriculture and Good for
irrigation. Very poorly drained soils, Organic (peaty) soils and steeply
sloping soils are rated in Class 6 for agriculture. These soils are rated
Poor for irrigation. Poor drainage affects some 11 percent of the
soils in the RM, which are rated as Class 5 and 6 for agriculture
capability and Poor for irrigation.
A major issue currently receiving considerable attention is the
sustainability of agricultural practices and their potential impact on
the soil and groundwater environment. To assist in highlighting this
concern to land planners and agricultural producers, an assessment of
potential environmental impact (EI) under irrigation has been included
in this bulletin (page 23). The majority of the RM is at Moderate risk
of degradation. However, steeply sloping soils and waterworked areas
with sandy and gravelly subsoils are rated as having a High potential
for impact on the environment under irrigation. These conditions
increase the risk for deep leaching of potential contaminants on the
soil surface and the potential for rapid runoff from the soil surface into
adjacent wetlands or water bodies. This EI map is intended to be used
in association with the irrigation suitability map.
Another issue of concern to producers, soil conservationists and land
use specialists is soil erosion caused by agricultural cropping and
tillage practices. To highlight areas with potential for water erosion,
a risk map has been included to show where special practices should
be adopted to mitigate this risk (page 25). Nearly 50 percent of the
land in the RM is at Severe risk of degradation and 15 percent is
considered to have a High risk for degradation from water erosion.
Management practices focus primarily on maintaining adequate
crop residues to provide sufficient surface cover. However,
provision of adequate protection of the steeper sloping lands most
at risk may require a shift in land use away from annual cultivation
to production of perennial forages and pasture or permanent tree
cover.
Land use in the RM of Boulton is primarily agricultural although
about 30 percent of the land remains in woodland and 21 percent is
in grassland. An assessment of the status of land use in 1995 was
obtained through an analysis of satellite imagery. It showed that
annual crops occupied about 34% of the land in the RM, while the
remaining areas were in forest (30%), grassland (21.3%), and forage
production (3.3%). Wetlands and small water bodies occupy 9.3%
of the RM. Much of the woodland and grassland area provides
native pasture for livestock. Various non-agricultural uses such as
recreation and infrastructure for urban areas and transportation
occupy about 2 percent of the RM (page 27).
While the majority of the soils in the RM of Boulton have moderate
to moderately severe limitations for arable agriculture, careful
choice of crops and maintenance of adequate surface cover is
essential for the management of sensitive lands with steeper slopes.
This includes leaving adequate crop residues on the surface to
provide sufficient trash cover during the early spring period. The
provision of minimum tillage practices, and crop rotations including
forage will help to reduce the risk of soil degradation and maintain
productivity.
Probably the most important conditions affecting the long-term
agricultural use of land in this municipality are soil and landscape
limitations such as topographic pattern and steeply sloping lands
Implementation of appropriate conservation practices to deal with
these conditions on a site by site basis will help to insure that
agriculture land-use is sustainable over the long-term.
Rural Municipality of Boulton Information Bulletin 97-25 Page 9
DERIVED AND INTERPRETIVE MAPS
A large variety of computer derived maps can be generated from the
digital and landscape datadases are stored in digital format. These
maps are based on selected combinations of database values and
assumptions.
Derived maps show information that is given in one or more columns
in the computer map legend (such as soil drainage, salinity, or slope
class).
Interpretive maps portray more complex land evaluations based on
a combination of soil and landscape information. Interpretative maps
typically show land capabilities, suitabilities, or risks related to
sustainability.
Several examples of derived and interpretive maps are included in this
information bulletin:
Derived Maps
Slope Classes
Generalized Soil
Drainage
Salinity
Management Consideration
Interpretative Maps
Agricultural Capabilities
Irrigation Suitability
Potential Environmental Impact
Water Erosion Risk
Land Use.
The maps have all been reduced in size and generalized (simplified)
in order to portray conditions for an entire rural municipality on one
page. These generalized maps provide a useful overview of
conditions within a municipality, but are not intended to apply to
site specific land parcels. On-site evaluations are recommended for
localized site specific land use suitability requirements.
Digital databases derived from recent detailed soil inventories
contain additional detailed information about significant inclusions
of differing soil and slope conditions in each map polygon. This
information can be portrayed at larger map scale than shown in this
bulletin.
Information concerning particular interpretive maps, and the
primary soil and terrain map data, can be obtained by contacting the
Manitoba Soil Resource Section of Manitoba Agriculture, the local
PFRA office, or the Manitoba Land Resource Unit.
Page 10 Information Bulletin 97-25 Rural Municipality of Boulton
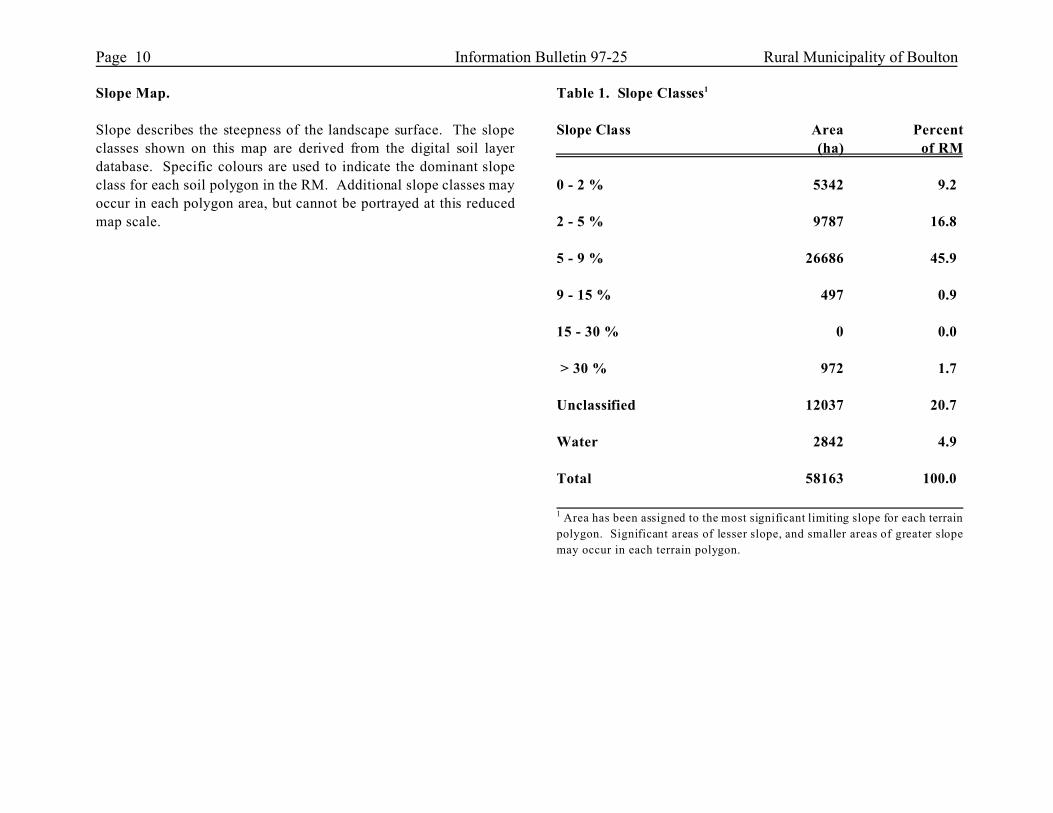
Slope Map.
Slope describes the steepness of the landscape surface. The slope
classes shown on this map are derived from the digital soil layer
database. Specific colours are used to indicate the dominant slope
class for each soil polygon in the RM. Additional slope classes may
occur in each polygon area, but cannot be portrayed at this reduced
map scale.
Table 1. Slope Classes1
Slope Class Area Percent
(ha) of RM
0 - 2 % 5342 9.2
2 - 5 % 9787 16.8
5 - 9 % 26686 45.9
9 - 15 % 497 0.9
15 - 30 % 0 0.0
> 30 % 972 1.7
Unclassified 12037 20.7
Water 2842 4.9
Total 58163 100.0
1 Area has been assigned to the most significant limiting slope for each terrain
polygon. Significant areas of lesser slope, and smaller areas of greater slope
may occur in each terrain polygon.
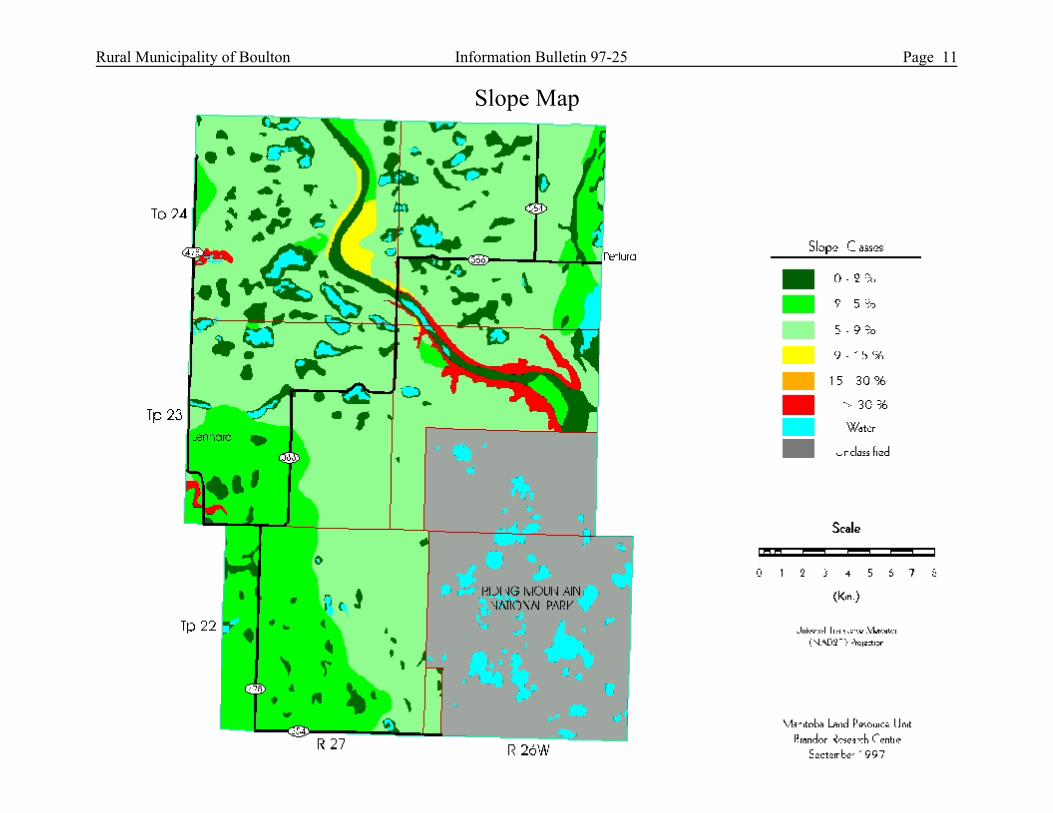
Rural Municipality of Boulton Information Bulletin 97-25 Page 11
Slope Map
Page 12 Information Bulletin 97-25 Rural Municipality of Boulton
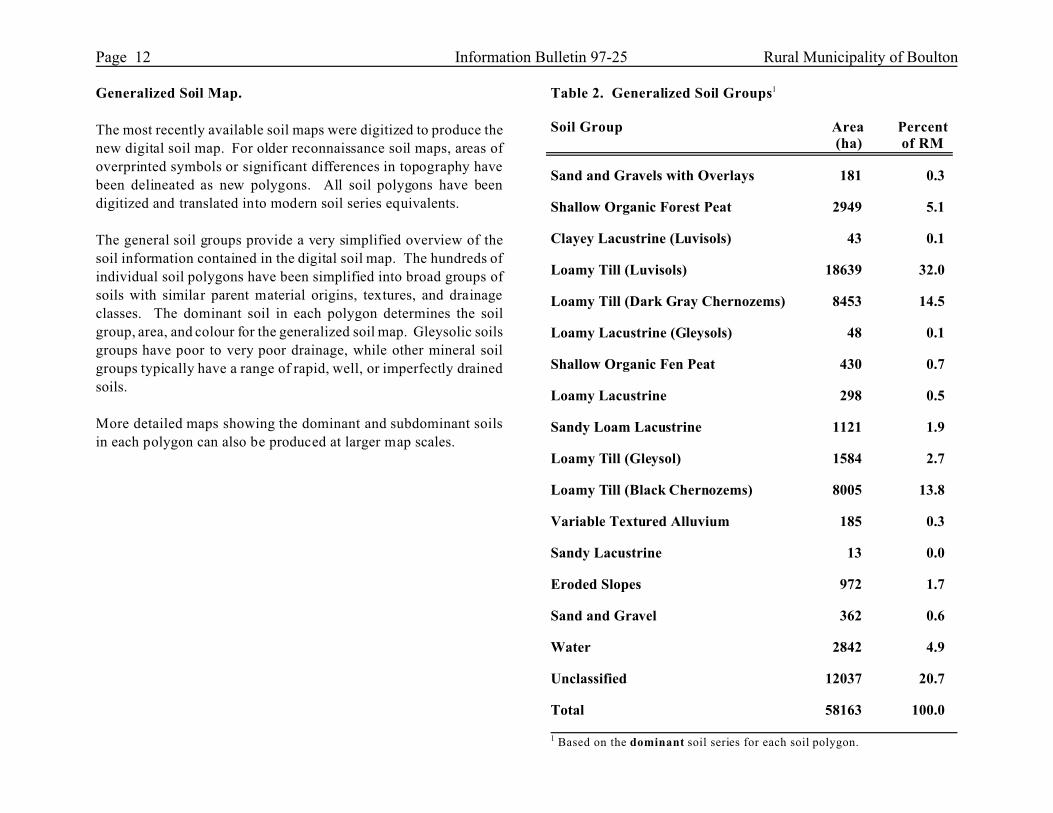
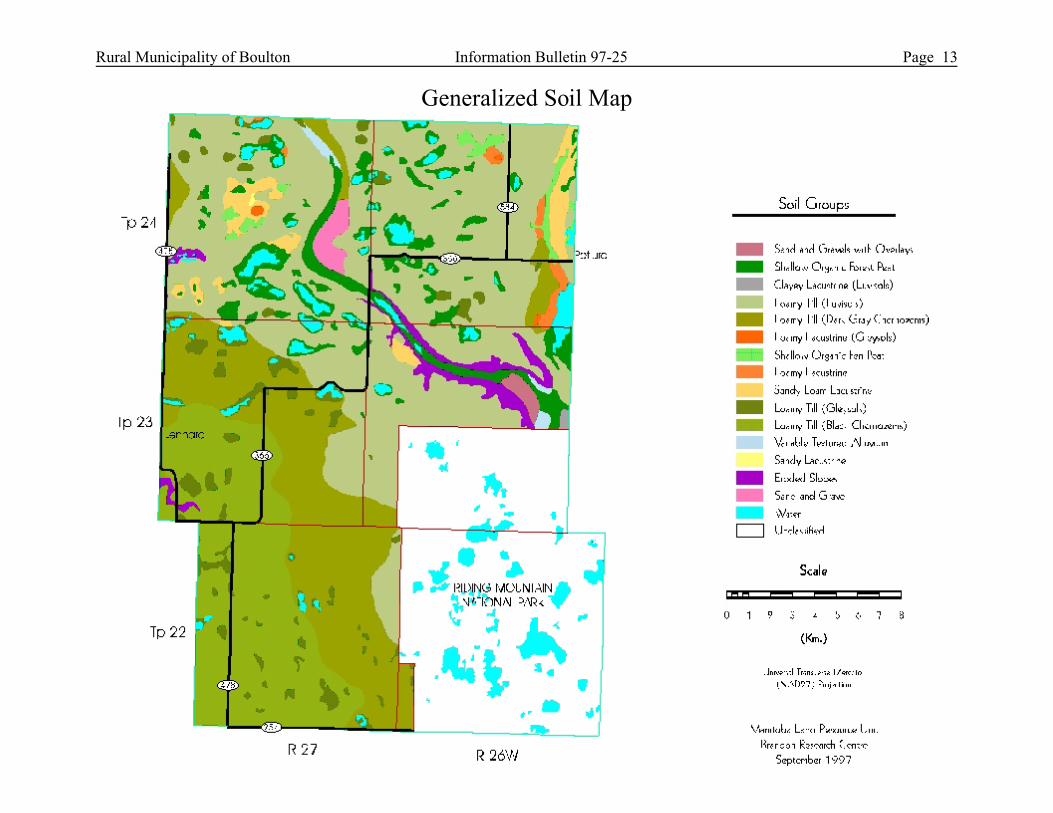
Generalized Soil Map.
The most recently available soil maps were digitized to produce the
new digital soil map. For older reconnaissance soil maps, areas of
overprinted symbols or significant differences in topography have
been delineated as new polygons. All soil polygons have been
digitized and translated into modern soil series equivalents.
The general soil groups provide a very simplified overview of the
soil information contained in the digital soil map. The hundreds of
individual soil polygons have been simplified into broad groups of
soils with similar parent material origins, textures, and drainage
classes. The dominant soil in each polygon determines the soil
group, area, and colour for the generalized soil map. Gleysolic soils
groups have poor to very poor drainage, while other mineral soil
groups typically have a range of rapid, well, or imperfectly drained
soils.
More detailed maps showing the dominant and subdominant soils
in each polygon can also be produced at larger map scales.
Table 2. Generalized Soil Groups1
Soil Group Area Percent (ha) of RM
Sand and Gravels with Overlays 181 0.3
Shallow Organic Forest Peat 2949 5.1
Clayey Lacustrine (Luvisols) 43 0.1
Loamy Till (Luvisols) 18639 32.0
Loamy Till (Dark Gray Chernozems) 8453 14.5
Loamy Lacustrine (Gleysols) 48 0.1
Shallow Organic Fen Peat 430 0.7
Loamy Lacustrine 298 0.5
Sandy Loam Lacustrine 1121 1.9
Loamy Till (Gleysol) 1584 2.7
Loamy Till (Black Chernozems) 8005 13.8
Variable Textured Alluvium 185 0.3
Sandy Lacustrine 13 0.0
Eroded Slopes 972 1.7
Sand and Gravel 362 0.6
Water 2842 4.9
Unclassified 12037 20.7
Total 58163 100.0
1 Based on the dominant soil series for each soil polygon.
Rural Municipality of Boulton Information Bulletin 97-25 Page 13
Generalized Soil Map
Page 14 Information Bulletin 97-25 Rural Municipality of Boulton
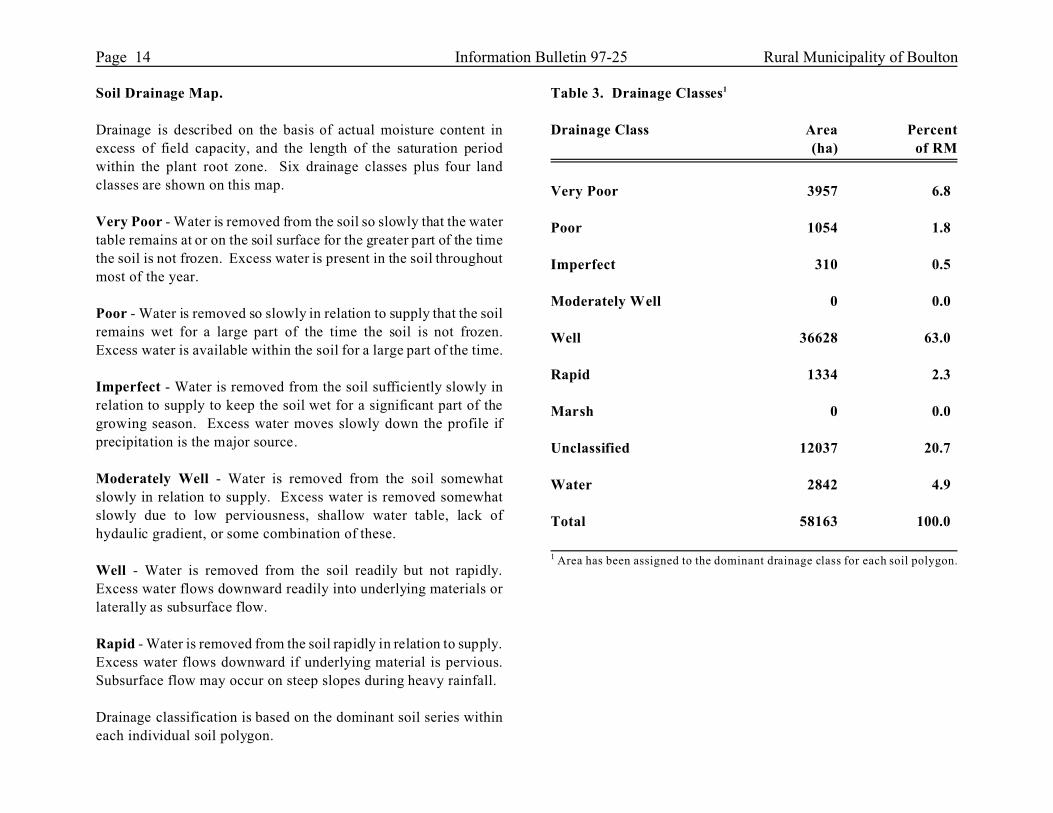
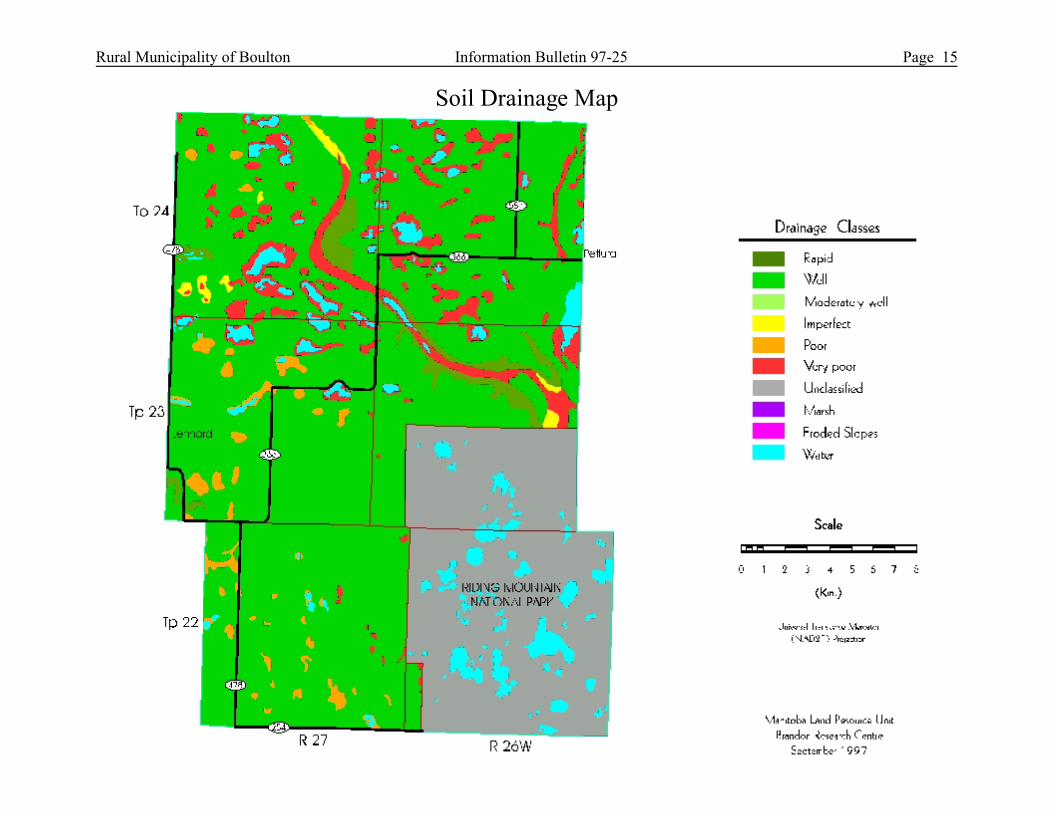
Soil Drainage Map.
Drainage is described on the basis of actual moisture content in
excess of field capacity, and the length of the saturation period
within the plant root zone. Six drainage classes plus four land
classes are shown on this map.
Very Poor - Water is removed from the soil so slowly that the water
table remains at or on the soil surface for the greater part of the time
the soil is not frozen. Excess water is present in the soil throughout
most of the year.
Poor - Water is removed so slowly in relation to supply that the soil
remains wet for a large part of the time the soil is not frozen.
Excess water is available within the soil for a large part of the time.
Imperfect - Water is removed from the soil sufficiently slowly in
relation to supply to keep the soil wet for a significant part of the
growing season. Excess water moves slowly down the profile if
precipitation is the major source.
Moderately Well - Water is removed from the soil somewhat
slowly in relation to supply. Excess water is removed somewhat
slowly due to low perviousness, shallow water table, lack of
hydaulic gradient, or some combination of these.
Well - Water is removed from the soil readily but not rapidly.
Excess water flows downward readily into underlying materials or
laterally as subsurface flow.
Rapid - Water is removed from the soil rapidly in relation to supply.
Excess water flows downward if underlying material is pervious.
Subsurface flow may occur on steep slopes during heavy rainfall.
Drainage classification is based on the dominant soil series within
each individual soil polygon.
Table 3. Drainage Classes1
Drainage Class Area Percent
(ha) of RM
Very Poor 3957 6.8
Poor 1054 1.8
Imperfect 310 0.5
Moderately Well 0 0.0
Well 36628 63.0
Rapid 1334 2.3
Marsh 0 0.0
Unclassified 12037 20.7
Water 2842 4.9
Total 58163 100.0
1 Area has been assigned to the dominant drainage class for each soil polygon.
Rural Municipality of Boulton Information Bulletin 97-25 Page 15
Soil Drainage Map
Page 16 Information Bulletin 97-25 Rural Municipality of Boulton
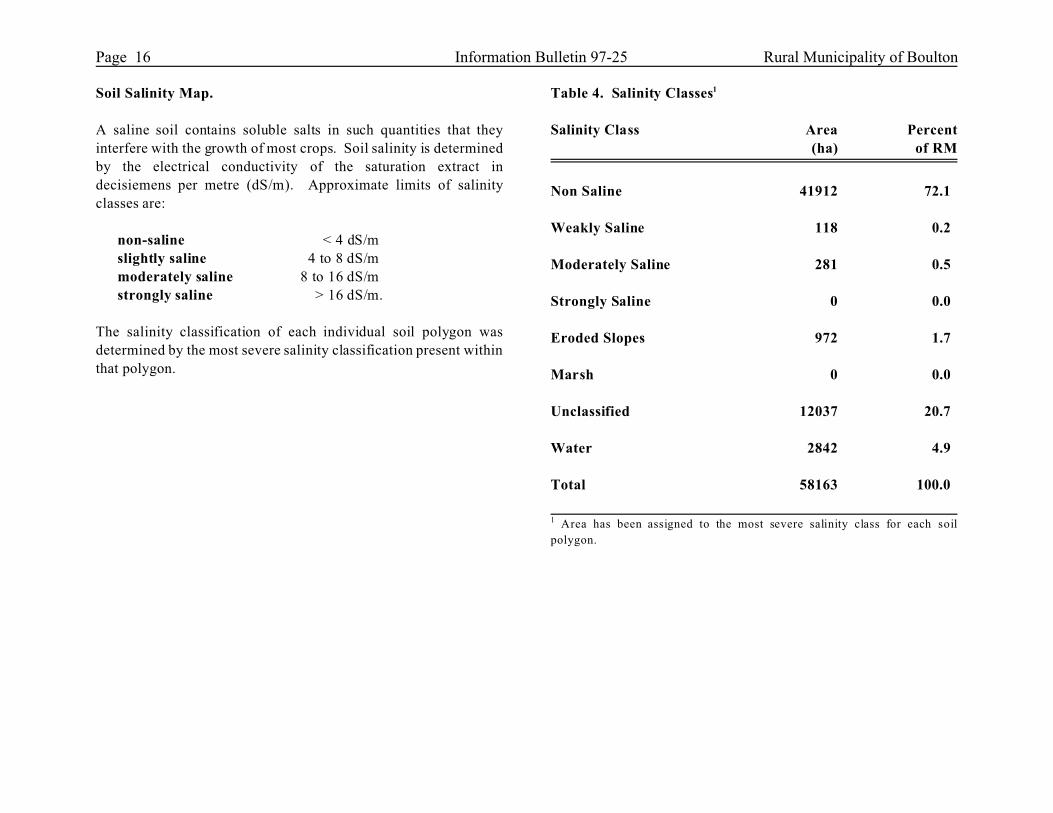
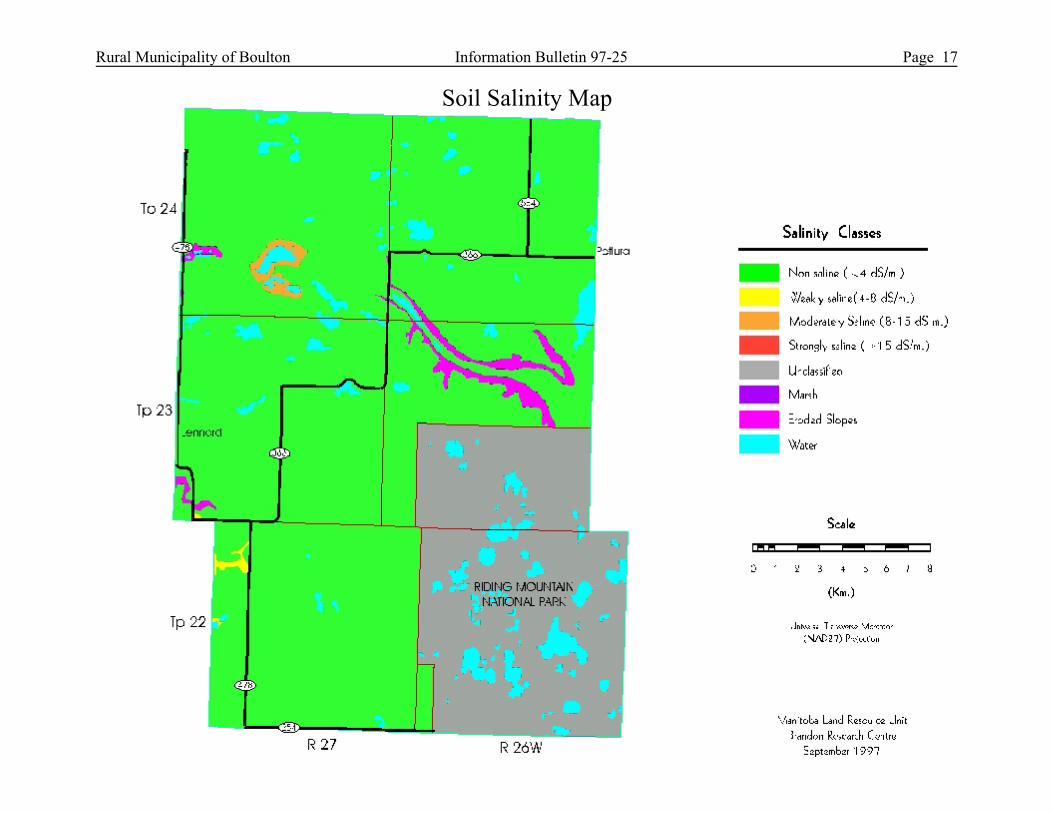
Soil Salinity Map.
A saline soil contains soluble salts in such quantities that they
interfere with the growth of most crops. Soil salinity is determined
by the electrical conductivity of the saturation extract in
decisiemens per metre (dS/m). Approximate limits of salinity
classes are:
non-saline < 4 dS/m
slightly saline 4 to 8 dS/m
moderately saline 8 to 16 dS/m
strongly saline > 16 dS/m.
The salinity classification of each individual soil polygon was
determined by the most severe salinity classification present within
that polygon.
Table 4. Salinity Classes1
Salinity Class Area Percent
(ha) of RM
Non Saline 41912 72.1
Weakly Saline 118 0.2
Moderately Saline 281 0.5
Strongly Saline 0 0.0
Eroded Slopes 972 1.7
Marsh 0 0.0
Unclassified 12037 20.7
Water 2842 4.9
Total 58163 100.0
1 Area has been assigned to the most severe salinity class for each soil
polygon.
Rural Municipality of Boulton Information Bulletin 97-25 Page 17
Soil Salinity Map
Page 18 Information Bulletin 97-25 Rural Municipality of Boulton
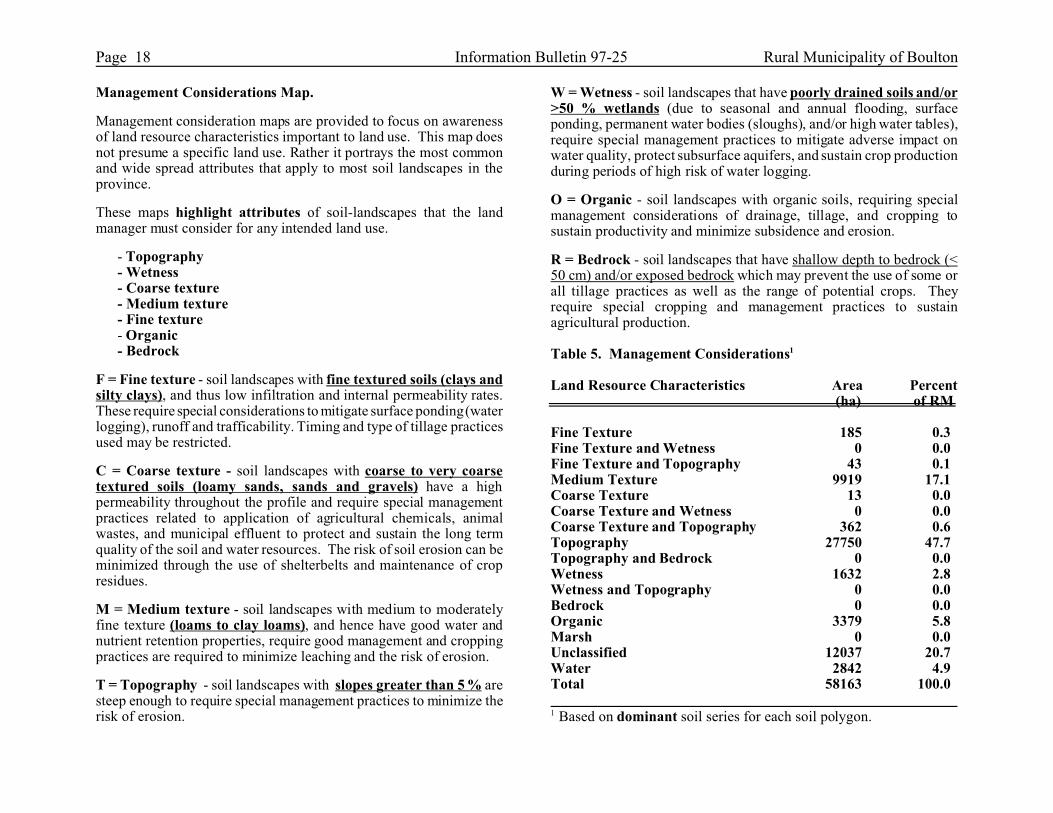
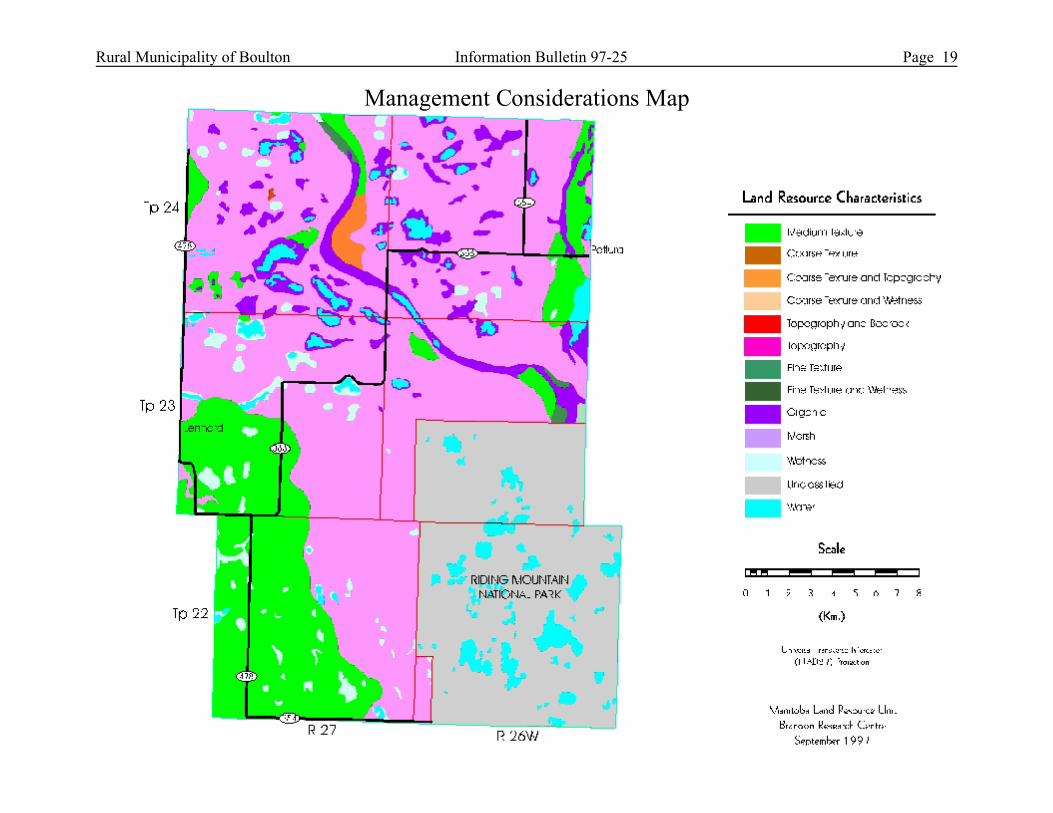
Management Considerations Map.
Management consideration maps are provided to focus on awarenessof land resource characteristics important to land use. This map doesnot presume a specific land use. Rather it portrays the most commonand wide spread attributes that apply to most soil landscapes in theprovince.
These maps highlight attributes of soil-landscapes that the landmanager must consider for any intended land use.
- Topography - Wetness - Coarse texture- Medium texture - Fine texture - Organic- Bedrock
F = Fine texture - soil landscapes with fine textured soils (clays andsilty clays), and thus low infiltration and internal permeability rates.These require special considerations to mitigate surface ponding (waterlogging), runoff and trafficability. Timing and type of tillage practicesused may be restricted.
C = Coarse texture - soil landscapes with coarse to very coarsetextured soils (loamy sands, sands and gravels) have a highpermeability throughout the profile and require special managementpractices related to application of agricultural chemicals, animalwastes, and municipal effluent to protect and sustain the long termquality of the soil and water resources. The risk of soil erosion can beminimized through the use of shelterbelts and maintenance of cropresidues.
M = Medium texture - soil landscapes with medium to moderatelyfine texture (loams to clay loams), and hence have good water andnutrient retention properties, require good management and croppingpractices are required to minimize leaching and the risk of erosion.
T = Topography - soil landscapes with slopes greater than 5 % aresteep enough to require special management practices to minimize therisk of erosion.
W = Wetness - soil landscapes that have poorly drained soils and/or>50 % wetlands (due to seasonal and annual flooding, surfaceponding, permanent water bodies (sloughs), and/or high water tables),require special management practices to mitigate adverse impact onwater quality, protect subsurface aquifers, and sustain crop productionduring periods of high risk of water logging.
O = Organic - soil landscapes with organic soils, requiring specialmanagement considerations of drainage, tillage, and cropping tosustain productivity and minimize subsidence and erosion.
R = Bedrock - soil landscapes that have shallow depth to bedrock (<50 cm) and/or exposed bedrock which may prevent the use of some orall tillage practices as well as the range of potential crops. Theyrequire special cropping and management practices to sustainagricultural production.
Table 5. Management Considerations1
Land Resource Characteristics Area Percent (ha) of RM
Fine Texture 185 0.3Fine Texture and Wetness 0 0.0Fine Texture and Topography 43 0.1Medium Texture 9919 17.1Coarse Texture 13 0.0Coarse Texture and Wetness 0 0.0Coarse Texture and Topography 362 0.6Topography 27750 47.7Topography and Bedrock 0 0.0Wetness 1632 2.8Wetness and Topography 0 0.0Bedrock 0 0.0Organic 3379 5.8Marsh 0 0.0Unclassified 12037 20.7Water 2842 4.9Total 58163 100.0
1 Based on dominant soil series for each soil polygon.
Rural Municipality of Boulton Information Bulletin 97-25 Page 19
Management Considerations Map
Page 20 Information Bulletin 97-25 Rural Municipality of Boulton
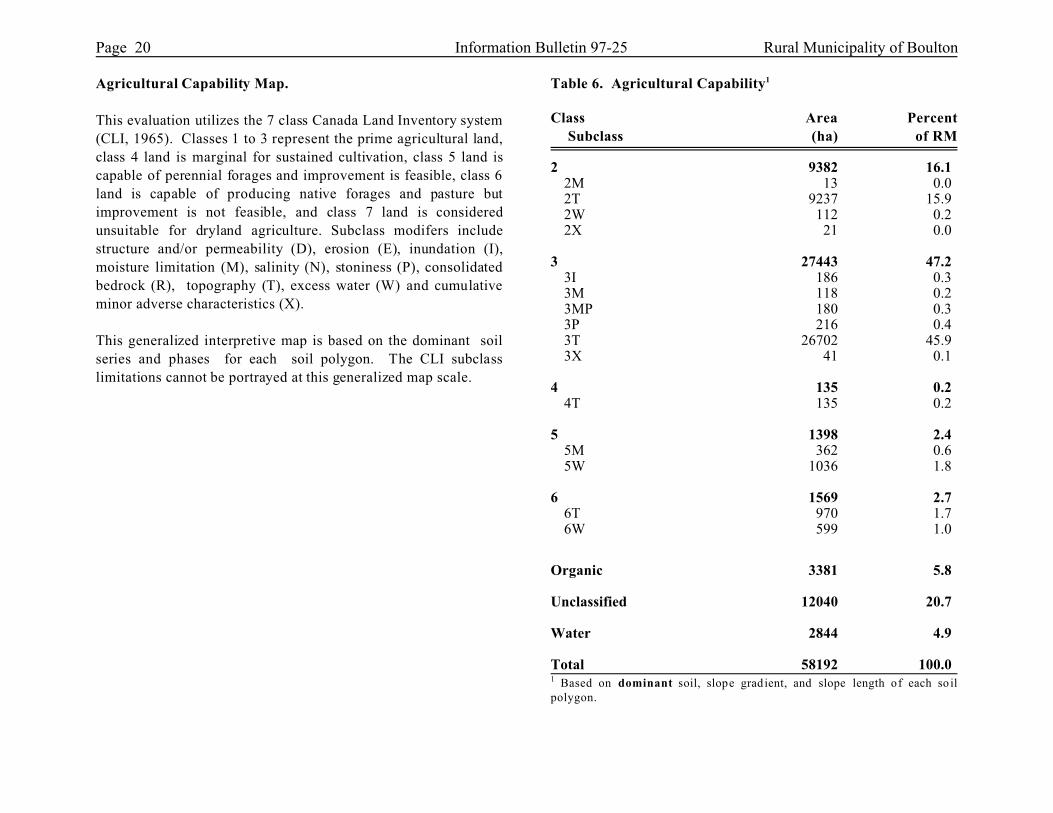
Agricultural Capability Map.
This evaluation utilizes the 7 class Canada Land Inventory system
(CLI, 1965). Classes 1 to 3 represent the prime agricultural land,
class 4 land is marginal for sustained cultivation, class 5 land is
capable of perennial forages and improvement is feasible, class 6
land is capable of producing native forages and pasture but
improvement is not feasible, and class 7 land is considered
unsuitable for dryland agriculture. Subclass modifers include
structure and/or permeability (D), erosion (E), inundation (I),
moisture limitation (M), salinity (N), stoniness (P), consolidated
bedrock (R), topography (T), excess water (W) and cumulative
minor adverse characteristics (X).
This generalized interpretive map is based on the dominant soil
series and phases for each soil polygon. The CLI subclass
limitations cannot be portrayed at this generalized map scale.
Table 6. Agricultural Capability1
Class Area Percent
Subclass (ha) of RM
2 9382 16.12M 13 0.02T 9237 15.92W 112 0.22X 21 0.0
3 27443 47.23I 186 0.33M 118 0.23MP 180 0.33P 216 0.43T 26702 45.93X 41 0.1
4 135 0.24T 135 0.2
5 1398 2.45M 362 0.65W 1036 1.8
6 1569 2.76T 970 1.76W 599 1.0
Organic 3381 5.8
Unclassified 12040 20.7
Water 2844 4.9
Total 58192 100.01 Based on dominant soil, slope gradient, and slope length of each so ilpolygon.
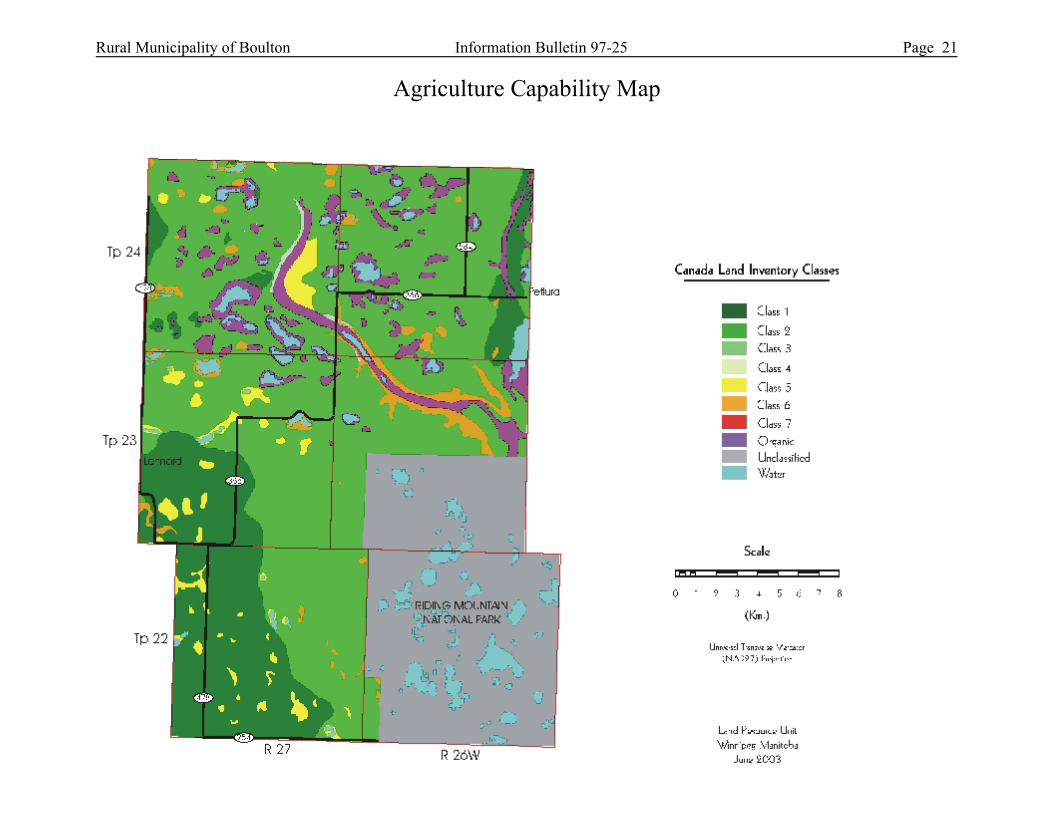
Rural Municipality of Boulton Information Bulletin 97-25 Page 21
Agriculture Capability Map
Page 22 Information Bulletin 97-25 Rural Municipality of Boulton
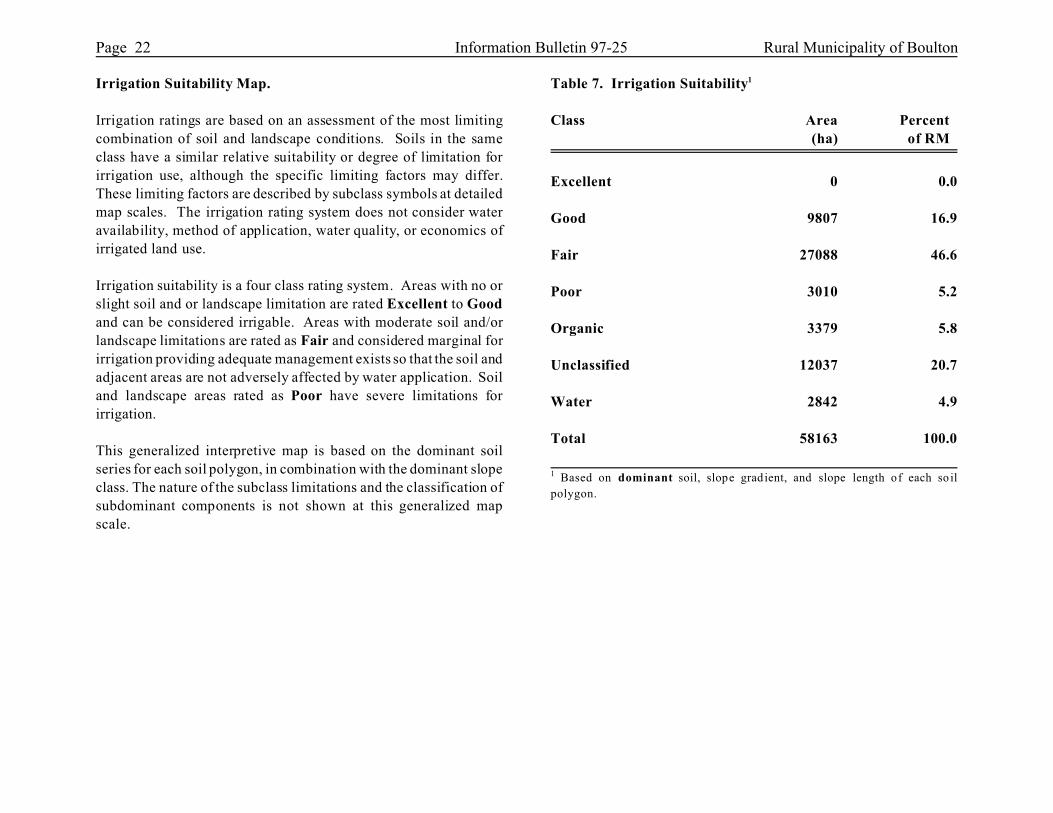
Irrigation Suitability Map.
Irrigation ratings are based on an assessment of the most limiting
combination of soil and landscape conditions. Soils in the same
class have a similar relative suitability or degree of limitation for
irrigation use, although the specific limiting factors may differ.
These limiting factors are described by subclass symbols at detailed
map scales. The irrigation rating system does not consider water
availability, method of application, water quality, or economics of
irrigated land use.
Irrigation suitability is a four class rating system. Areas with no or
slight soil and or landscape limitation are rated Excellent to Good
and can be considered irrigable. Areas with moderate soil and/or
landscape limitations are rated as Fair and considered marginal for
irrigation providing adequate management exists so that the soil and
adjacent areas are not adversely affected by water application. Soil
and landscape areas rated as Poor have severe limitations for
irrigation.
This generalized interpretive map is based on the dominant soil
series for each soil polygon, in combination with the dominant slope
class. The nature of the subclass limitations and the classification of
subdominant components is not shown at this generalized map
scale.
Table 7. Irrigation Suitability1
Class Area Percent
(ha) of RM
Excellent 0 0.0
Good 9807 16.9
Fair 27088 46.6
Poor 3010 5.2
Organic 3379 5.8
Unclassified 12037 20.7
Water 2842 4.9
Total 58163 100.0
1 Based on dominant soil, slope gradient, and slope length of each so il
polygon.
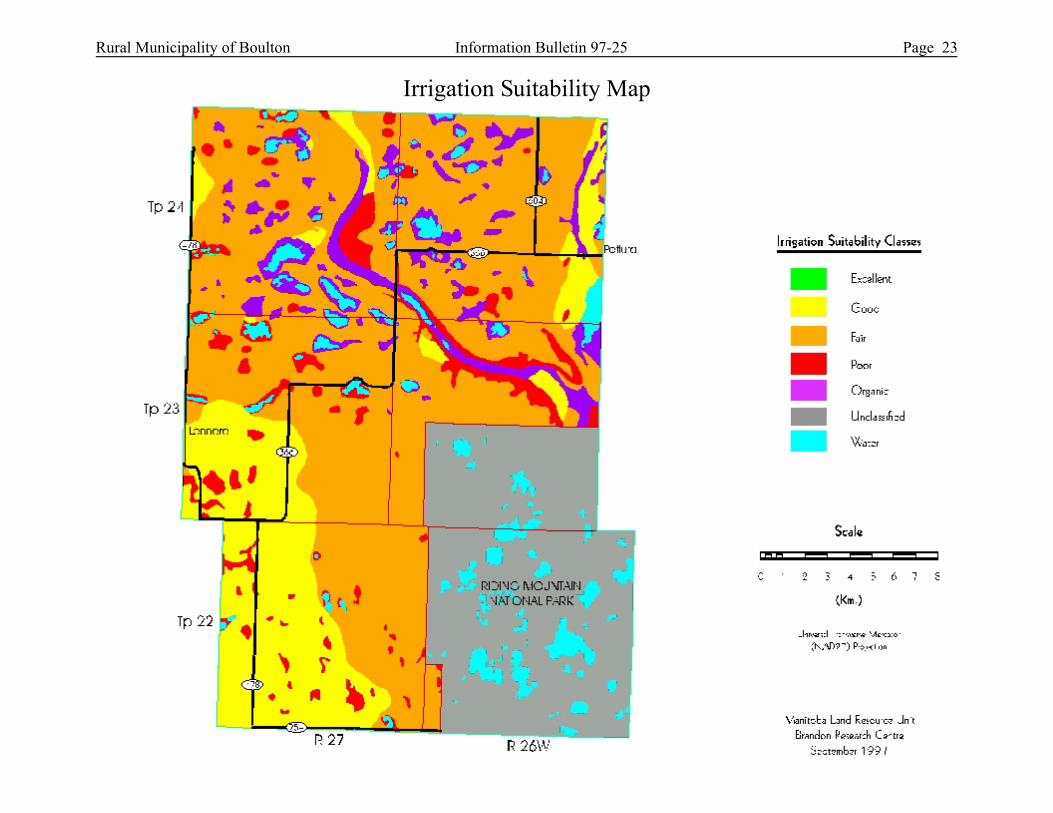
Rural Municipality of Boulton Information Bulletin 97-25 Page 23
Irrigation Suitability Map
Page 24 Information Bulletin 97-25 Rural Municipality of Boulton
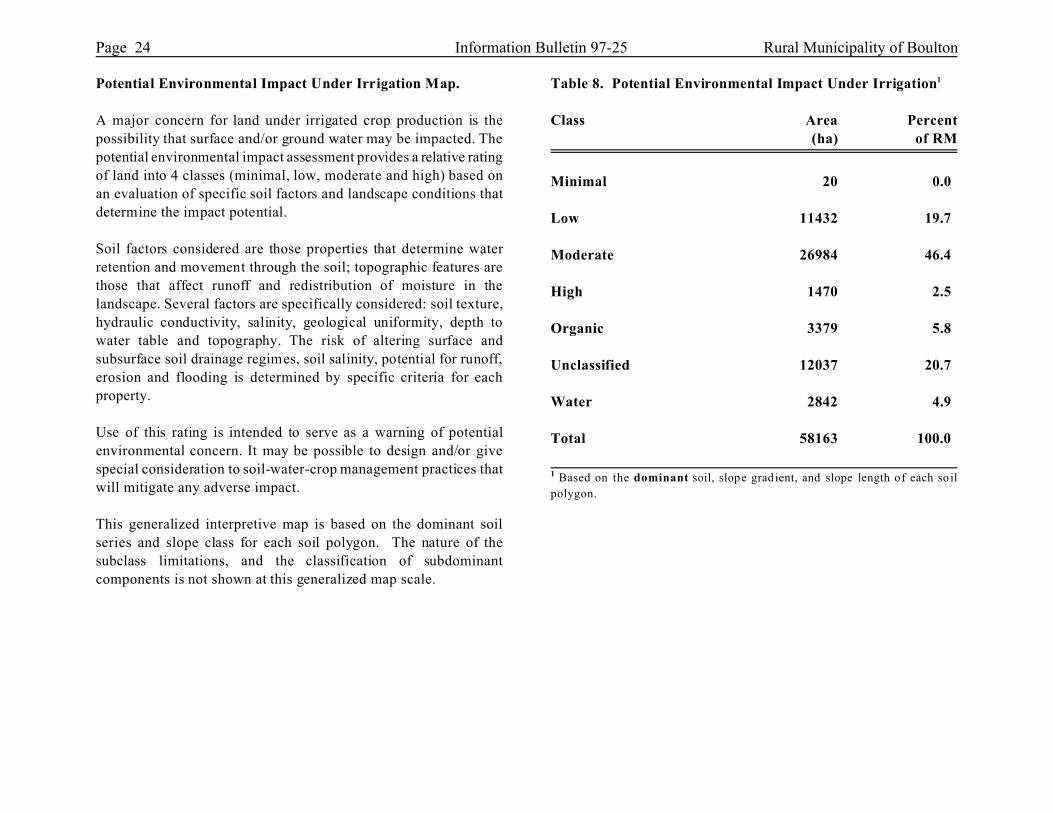
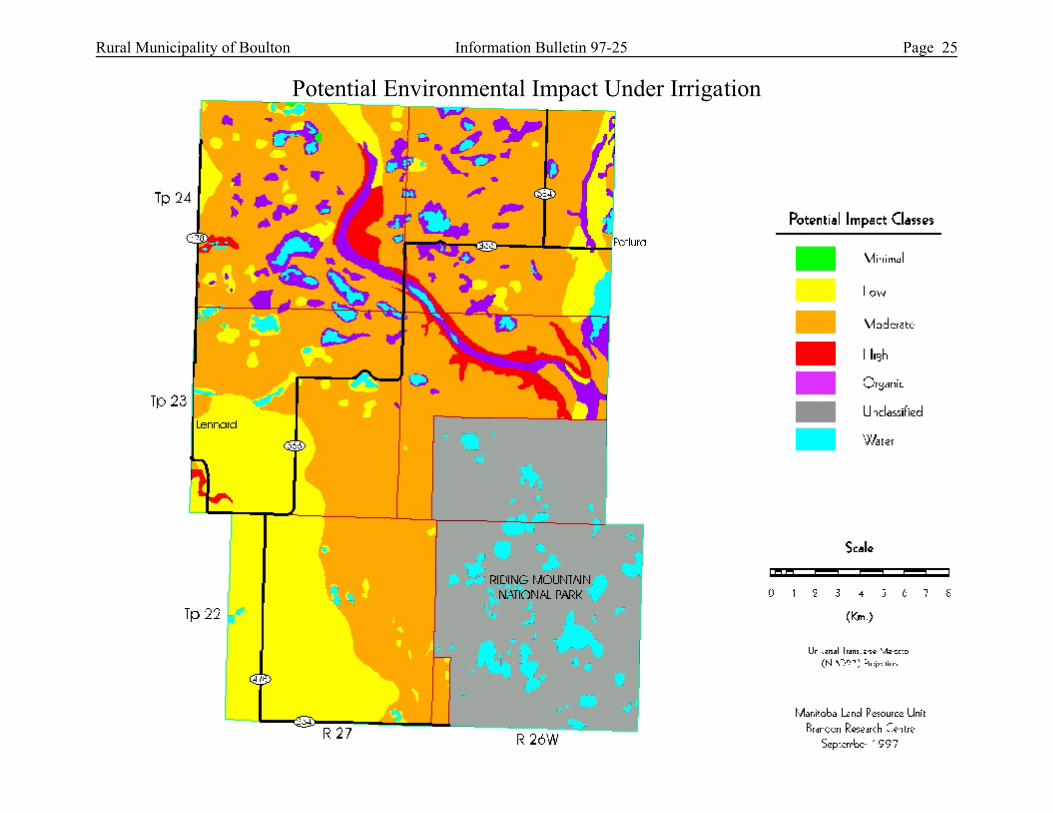
Potential Environmental Impact Under Irrigation Map.
A major concern for land under irrigated crop production is the
possibility that surface and/or ground water may be impacted. The
potential environmental impact assessment provides a relative rating
of land into 4 classes (minimal, low, moderate and high) based on
an evaluation of specific soil factors and landscape conditions that
determine the impact potential.
Soil factors considered are those properties that determine water
retention and movement through the soil; topographic features are
those that affect runoff and redistribution of moisture in the
landscape. Several factors are specifically considered: soil texture,
hydraulic conductivity, salinity, geological uniformity, depth to
water table and topography. The risk of altering surface and
subsurface soil drainage regimes, soil salinity, potential for runoff,
erosion and flooding is determined by specific criteria for each
property.
Use of this rating is intended to serve as a warning of potential
environmental concern. It may be possible to design and/or give
special consideration to soil-water-crop management practices that
will mitigate any adverse impact.
This generalized interpretive map is based on the dominant soil
series and slope class for each soil polygon. The nature of the
subclass limitations, and the classification of subdominant
components is not shown at this generalized map scale.
Table 8. Potential Environmental Impact Under Irrigation1
Class Area Percent
(ha) of RM
Minimal 20 0.0
Low 11432 19.7
Moderate 26984 46.4
High 1470 2.5
Organic 3379 5.8
Unclassified 12037 20.7
Water 2842 4.9
Total 58163 100.0
1 Based on the dominant soil, slope gradient, and slope length of each so il
polygon.
Rural Municipality of Boulton Information Bulletin 97-25 Page 25
Potential Environmental Impact Under Irrigation
Page 26 Information Bulletin 97-25 Rural Municipality of Boulton
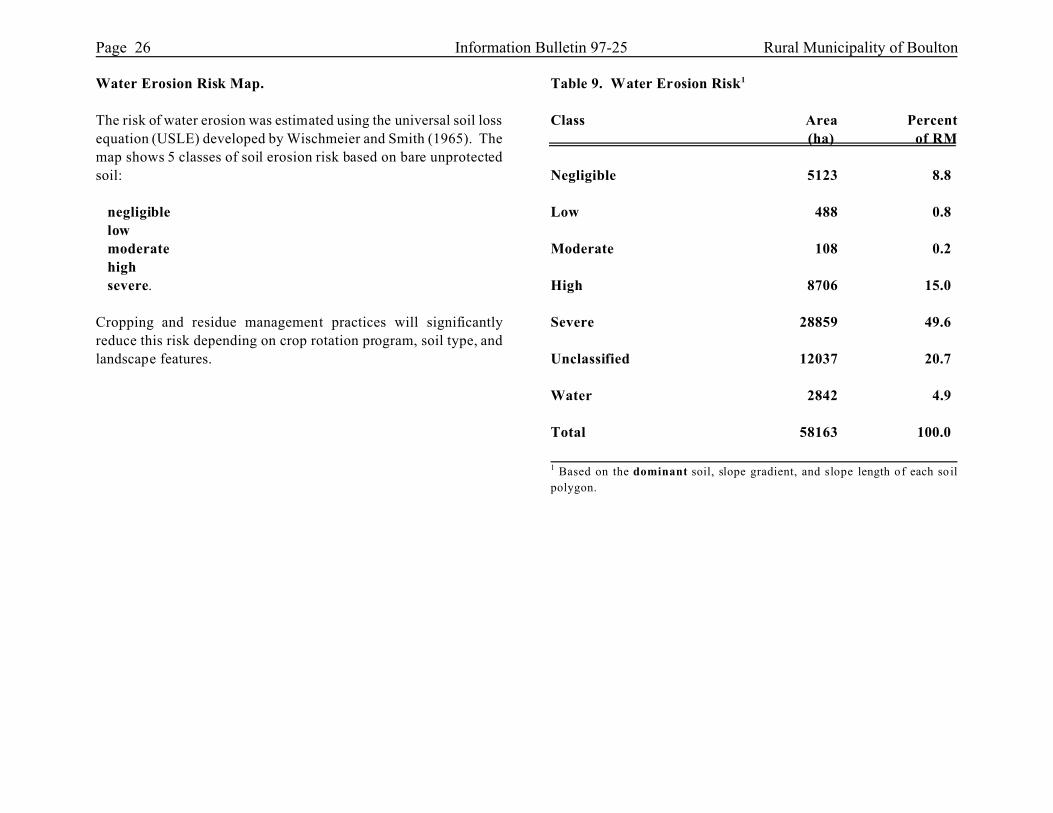
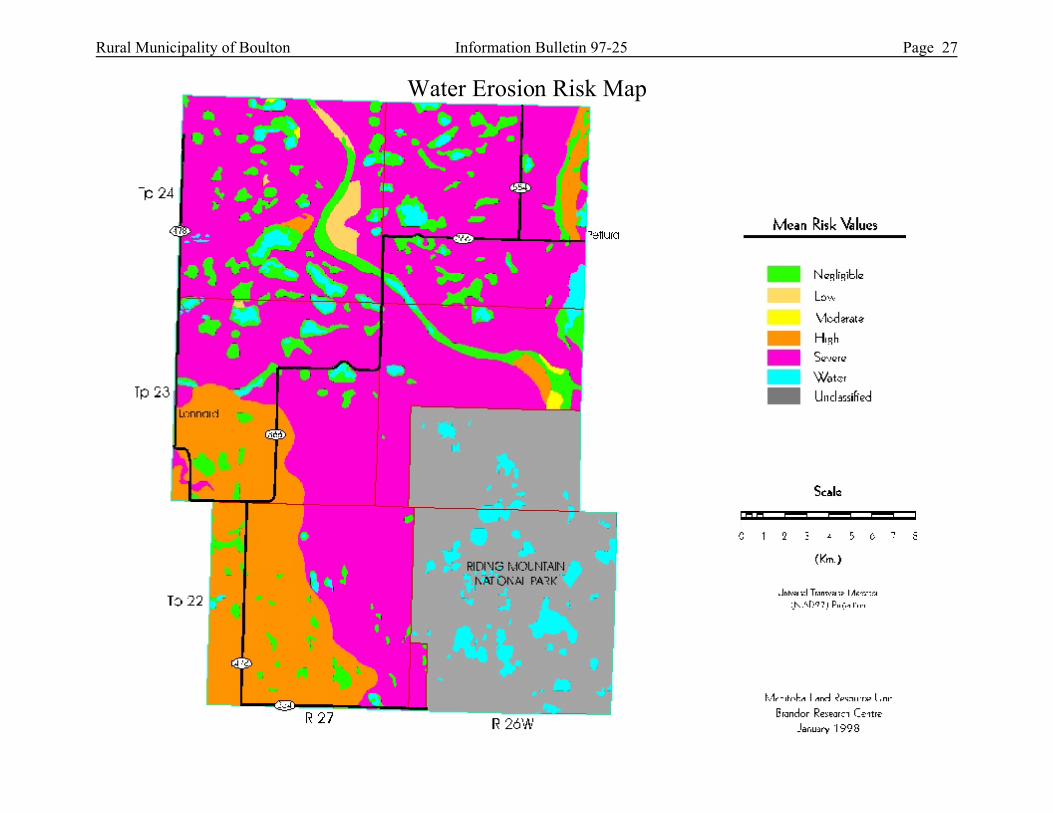
Water Erosion Risk Map.
The risk of water erosion was estimated using the universal soil loss
equation (USLE) developed by Wischmeier and Smith (1965). The
map shows 5 classes of soil erosion risk based on bare unprotected
soil:
negligible
low
moderate
high
severe.
Cropping and residue management practices will significantly
reduce this risk depending on crop rotation program, soil type, and
landscape features.
Table 9. Water Erosion Risk1
Class Area Percent
(ha) of RM
Negligible 5123 8.8
Low 488 0.8
Moderate 108 0.2
High 8706 15.0
Severe 28859 49.6
Unclassified 12037 20.7
Water 2842 4.9
Total 58163 100.0
1 Based on the dominant soil, slope gradient, and slope length of each so il
polygon.
Rural Municipality of Boulton Information Bulletin 97-25 Page 27
Water Erosion Risk Map
Page 28 Information Bulletin 97-25 Rural Municipality of Boulton
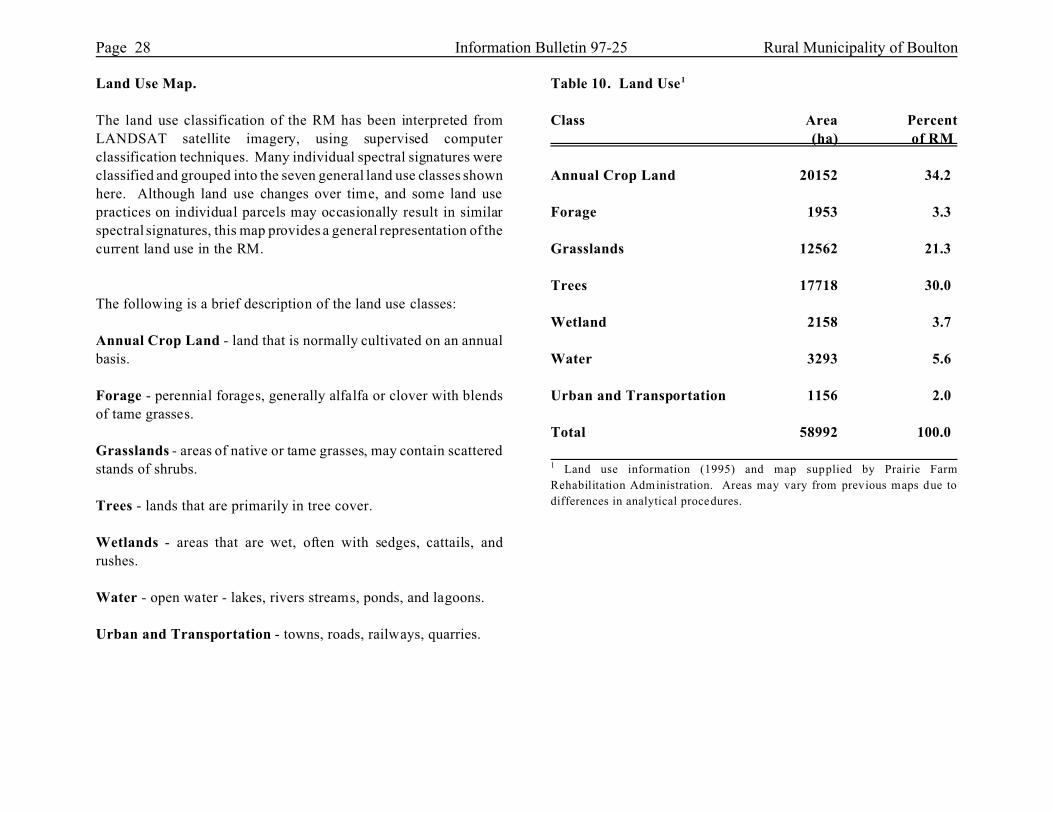
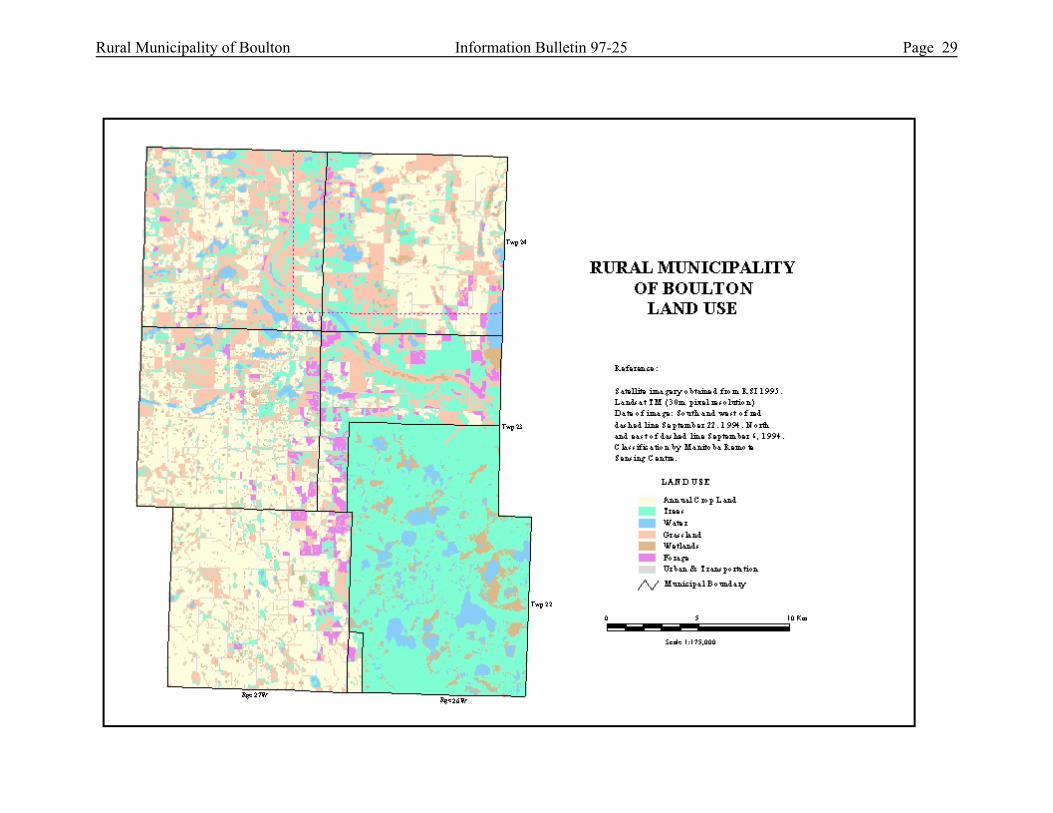
Land Use Map.
The land use classification of the RM has been interpreted from
LANDSAT satellite imagery, using supervised computer
classification techniques. Many individual spectral signatures were
classified and grouped into the seven general land use classes shown
here. Although land use changes over time, and some land use
practices on individual parcels may occasionally result in similar
spectral signatures, this map provides a general representation of the
current land use in the RM.
The following is a brief description of the land use classes:
Annual Crop Land - land that is normally cultivated on an annual
basis.
Forage - perennial forages, generally alfalfa or clover with blends
of tame grasses.
Grasslands - areas of native or tame grasses, may contain scattered
stands of shrubs.
Trees - lands that are primarily in tree cover.
Wetlands - areas that are wet, often with sedges, cattails, and
rushes.
Water - open water - lakes, rivers streams, ponds, and lagoons.
Urban and Transportation - towns, roads, railways, quarries.
Table 10. Land Use1
Class Area Percent
(ha) of RM
Annual Crop Land 20152 34.2
Forage 1953 3.3
Grasslands 12562 21.3
Trees 17718 30.0
Wetland 2158 3.7
Water 3293 5.6
Urban and Transportation 1156 2.0
Total 58992 100.0
1 Land use information (1995) and map supplied by Prairie Farm
Rehabilitation Administration. Areas may vary from previous maps due to
differences in analytical procedures.
Rural Municipality of Boulton Information Bulletin 97-25 Page 29
Page 30 Information Bulletin 97-25 Rural Municipality of Boulton
REFERENCES
Agronomic Interpretations Working Group. 1995. Land Suitability
Rating System for Agricultural Crops: 1. Spring-seeded Small
Grains. Edited by W.W. Pettapeice. Tech Bull. 1995-6E. Centre
for Land and Biological Resources Research, Agriculture and
Agrifood Canada, Ottawa. 90 pages, 2 maps.
Canada Land Inventory. 1965. Soil Capability Classification for
Agriculture. Canada Land Inventory Report No. 2. ARDA, Dept.
of Forestry, Canada, Ottawa.
Canada-Manitoba Soil Survey. 1980. Physiographic Regions of
Manitoba. Ellis Bldg., University of Manitoba, Winnipeg. Revised.
Unpublished Report.
Canada-Manitoba Soil Survey. 1979. Ecological Regions and
Subregions in Manitoba. Ellis Bldg., University of Manitoba,
Winnipeg. Revised. Unpublished Report.
Ehrlich, W.A., Pratt, L.E. and Poyser, E.A. 1956 Report of
Reconnaissance Soil Survey of Rossburn and Virden Map Sheet
Areas. Soils Report No. 6. Manitoba Soil Survey. Published by
Manitoba Dept. of Agriculture. 121pp and 2 maps.
Ehrlich, W.A., Pratt, L.E. and Leclaire, F.P. 1959 Report of
Reconnaissance Soil Survey of Grandview Map Sheet Area. Soils
Report No. 9. Manitoba Soil Survey. Published by Manitoba Dept.
of Agriculture. 121pp and 2 maps.
Eilers R.G. 1983. Soils of the Roblin Area. Report No. D47.
Canada-Manitoba Soil Survey. Winnipeg.
Environment Canada. 1982. Canadian Climatic Normals 1951-1980.
Frost, Vol. 6; Atmospheric Environment, Downsview, Ontario.
Environment Canada. 1993. Canadian Climatic Normals 1961-1990.
Prairie Provinces. Atmospheric Environment, Downsview, Ontario.
Expert Committee on Soil Survey. 1987. The Canadian System of
Soil Classification. Second Edition. Publ. No. 1646. Research
Branch, Agriculture Canada.
Irrigation Suitability Classification Working Group. 1987. An
Irrigation Suitability Classification System for the Canadian
Prairies. LRRC contribution no. 87-83, Land Resource Research
Centre, Research Branch, Agriculture Canada, Ottawa
MacDonald, K.B., and Valentine, K.W.G. 1992. CanSIS Manual 1
CanSIS/NSDB: A General Description. Land Resource Division,
Centre for Land and Biological Resources Research, Research
Branch, Agriculture Canada, Ottawa.
Manitoba Land Resource Unit. 1997. Soil and Terrain
Classification System Manual. In preparation. Ellis Bldg.
University of Manitoba. Winnipeg.
Podolsky, G. 1985. Soils of the Binscarth and Russell Areas.
Report No. D54. Canada-Manitoba Soil Survey. Winnipeg.
Wischmeier, W.H. and Smith, D.D. 1965. Predicting Rainfall-
erosion Loss from Cropland East of the Rocky Mountains. U.S.
Department of Agriculture, Agriculture Handbook No. 282, U.S.
Government Printing Office, Washington, D.C.