r.k. lyons r.v. machen - texas a&m...
TRANSCRIPT

Managing Natural Resources – Stocking Rate, Carrying Capacity & Animal UnitsGillespie County Beef & Range Field DayMay 12, 2011
R.K. LyonsR.V. Machen

Goals
• Personal
• Resources
–Soil
–Plants
–Animals
• How are they related?

“I love ground nesting birds, especially quail. How can I draw them into the yard?”
How are these goals related?

What is “Job One”?

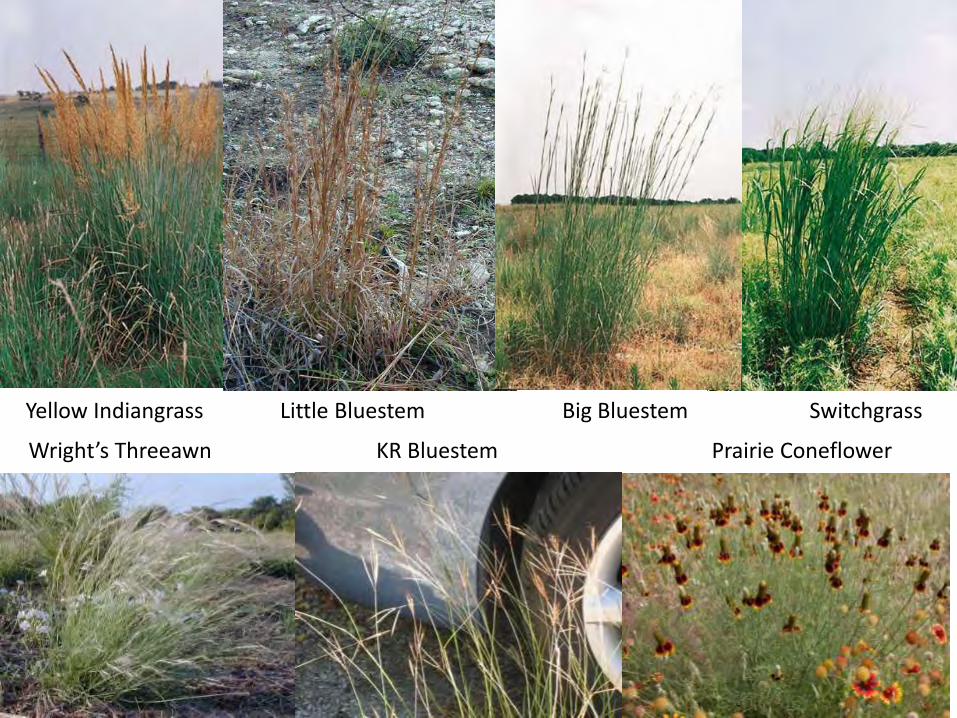
Yellow Indiangrass Little Bluestem Big Bluestem Switchgrass
Wright’s Threeawn KR Bluestem Prairie Coneflower

Wildlife Management


How can I monitor progress toward
achieving my goal(s)?
Range Health


Why is Rangeland Health
Important?
Robert K. Lyons, Ph.D.
Extension Range Specialist

Rangeland Health Definition
Degree of sustained integrity of:
Soils
Ecological processes
Photosynthesis
Nutrient cycling

Rangeland Management Standard
Minimum:
prevent human induced loss of rangeland
health

Rangeland Health Thresholds
Healthy
At risk
Unhealthy

Health Criteria & Thresholds
Healthy At Risk Unhealthy
No movement Moving on site Moving off site
Soil Stability

Nutrients/Energy & Thresholds
Healthy At Risk Unhealthy
Good distribution Fragmented Fragmented; large barren areas; pedestaled plants
Plants & Litter
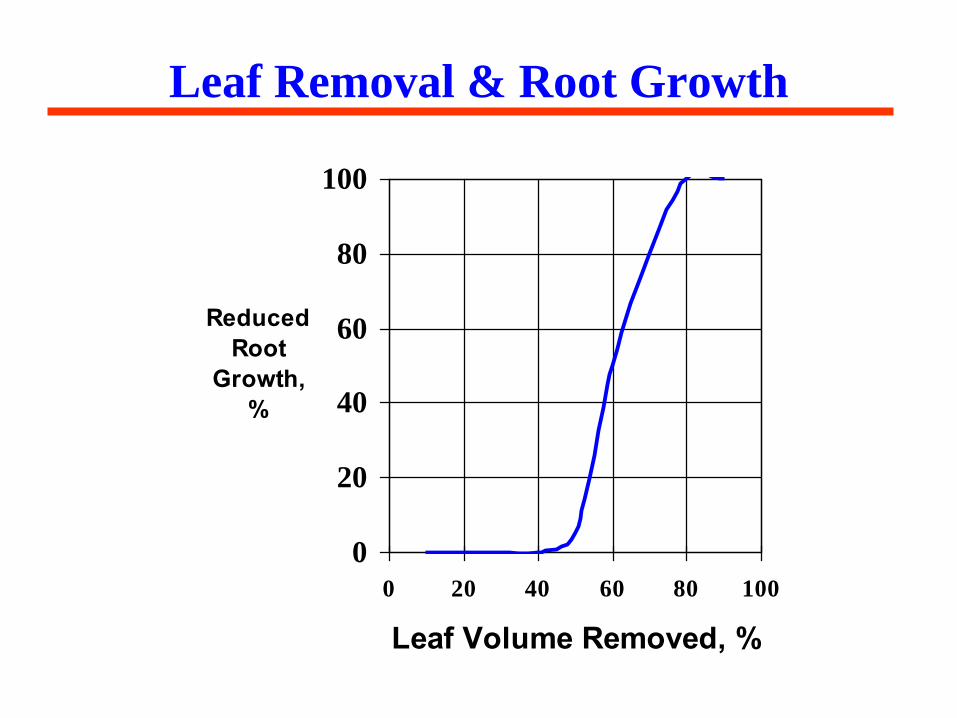
Leaf Removal & Root Growth
0
20
40
60
80
100
0 20 40 60 80 100
Leaf Volume Removed, %
Reduced Root
Growth, %

Heavy, Frequent Defoliation
Reduces root growth & sizewater infiltration water absorption nutrient absorption
Loss of competitive advantage
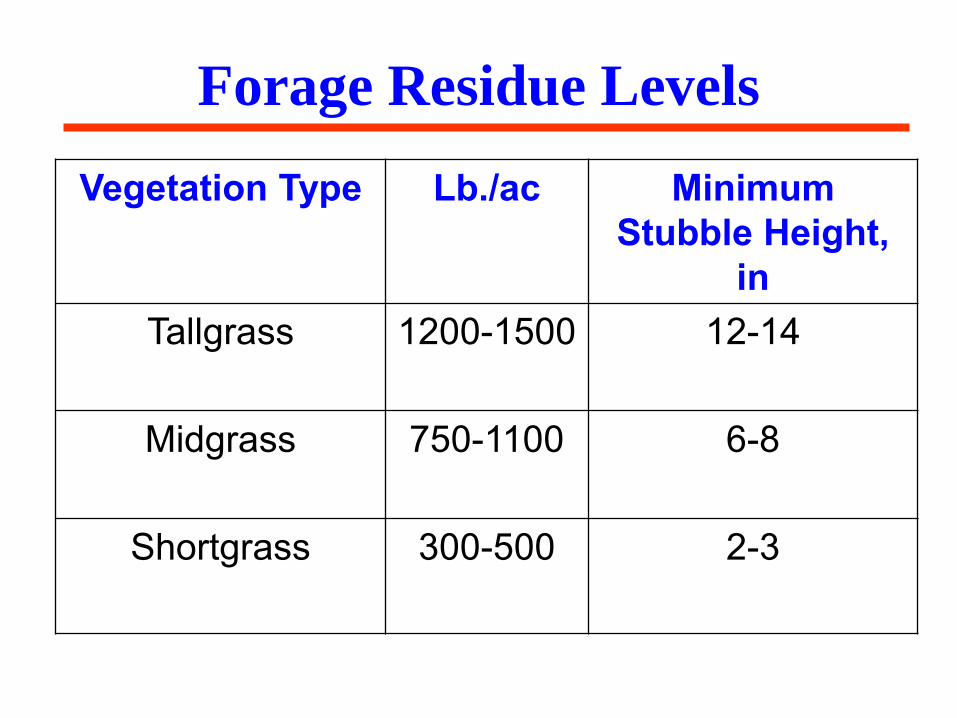
Forage Residue Levels
Vegetation Type Lb./ac Minimum Stubble Height,
inTallgrass 1200-1500 12-14
Midgrass 750-1100 6-8
Shortgrass 300-500 2-3

How grass grows
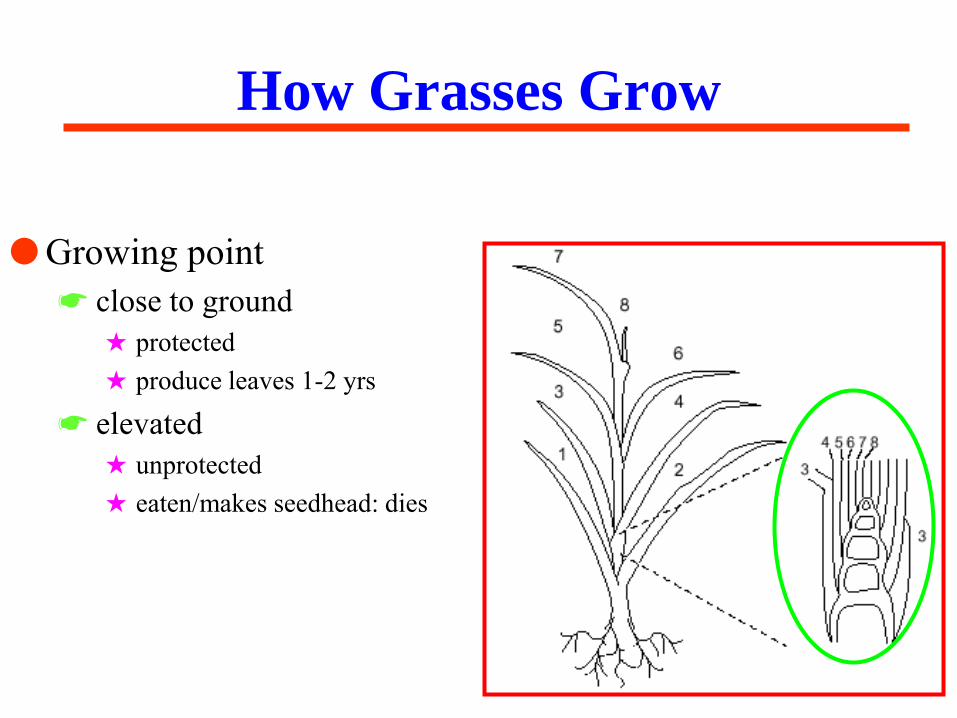
How Grasses Grow
Growing point close to ground
protected produce leaves 1-2 yrs
elevated unprotected eaten/makes seedhead: dies


Growing Point Elevation &
Grazing Resistance
Grass species Growing point elevation/ reproductive tiller ratio
Grazing resistance
Buffalograss Remain close to ground High
Little bluestem Elevation late w/ large number reproductive tillers
Moderate
Sideoats grama Elevation late w/ large number reproductive tillers
Moderate
Switchgrass Early Low
Yellow Indiangrass Early Low
Johnsongrass High number reproductive tillers
Low


Evaporation
Infiltration
Transpiration
Runoff
Rainfall Movement From Range Watersheds
Percolation

Grazing Management
• Leaving a forage residue Protects soil Increases rainfall
effectiveness Increases forage
production
0
500
1000
1500
2000
2500
3000
3500
4000
Fo
ra
ge P
ro
du
cti
on
,
lbs/
ac
100 500 1500
January Forage
Residue, lbs/ac
16.5
16.9
9.7
Forage Residue & Rainfall Effectiveness


Animal Unit- relates different animals to a common base – forage consumption.An animal unit is the number of animal(s) which consume 26 pounds of forage (DM) per day.
1,000 lb cow5 sheep6 goats7 deer
17 jackrabbits52 free-range hens

“Animal Unit”wt.
Aoudad 200Axis 160Blackbuck 75Fallow 130Mouflon 120Red Deer 450Sika 145
Whitetail 100
Cattle 1000Sheep 90Spanish goat 90Boer X goat 135
from Exotics on the Range, Mungall & Sheffield, 1994

“Animal Unit”wt. intake
Aoudad 200 0.035Axis 160 0.035Blackbuck 75 0.04Fallow 130 0.035Mouflon 120 0.035Red Deer 450 0.03Sika 145 0.035
Whitetail 100 0.035
Cattle 1000 0.026Sheep 90 0.04Spanish goat 90 0.04Boer X goat 135 0.04
from Exotics on the Range, Mungall & Sheffield, 1994

“Animal Unit”wt. intake lb/day
Aoudad 200 0.035 7.00Axis 160 0.035 5.60Blackbuck 75 0.04 3.00Fallow 130 0.035 4.55Mouflon 120 0.035 4.20Red Deer 450 0.03 13.50Sika 145 0.035 5.08
Whitetail 100 0.035 3.50
Cattle 1000 0.026 26.00Sheep 90 0.04 3.60Spanish goat 90 0.04 3.60Boer X goat 135 0.04 5.40
from Exotics on the Range, Mungall & Sheffield, 1994

“Animal Unit”wt. intake lb/day AUE hd/AU
Aoudad 200 0.035 7.00 0.27 3.7Axis 160 0.035 5.60 0.22 4.6Blackbuck 75 0.04 3.00 0.12 8.7Fallow 130 0.035 4.55 0.18 5.7Mouflon 120 0.035 4.20 0.16 6.2Red Deer 450 0.03 13.50 0.52 1.9Sika 145 0.035 5.08 0.20 5.1
Whitetail 100 0.035 3.50 0.13 7.4
Cattle 1000 0.026 26.00 1.00 1.0Sheep 90 0.04 3.60 0.14 7.2Spanish goat 90 0.04 3.60 0.14 7.2Boer X goat 135 0.04 5.40 0.21 4.8
from Exotics on the Range, Mungall & Sheffield, 1994

How many 1,000 lb cow’s are out there?

1200 lb 1200 lb
Production Stage ……………. Early Lactation
Daily Feed ………………….…. Good Bermudagrass hay11% CP, 54% TDN
Daily DM intake 25.5 lbDaily weight change -0.98 lb
Days to Lose 1 BCS 94
Daily DM intake 27.7 lbDaily weight change -2.88 lb
Days to Lose 1 BCS 29http://www.ansi.okstate.edu/exten/cowculator/

Daily DM intake 5.6 lb
Head/AU 4.6
160 lb 100 lb
Daily DM intake 3.5 lb
Head/AU 7.4
1 AU consumes = 26 lb DM/day

Daily DM intake 4.0 lb
Head/AU 6.4
100 lb 180 lb
Daily DM intake 7.2 lb
Head/AU 3.6
1 AU consumes = 26 lb DM/day

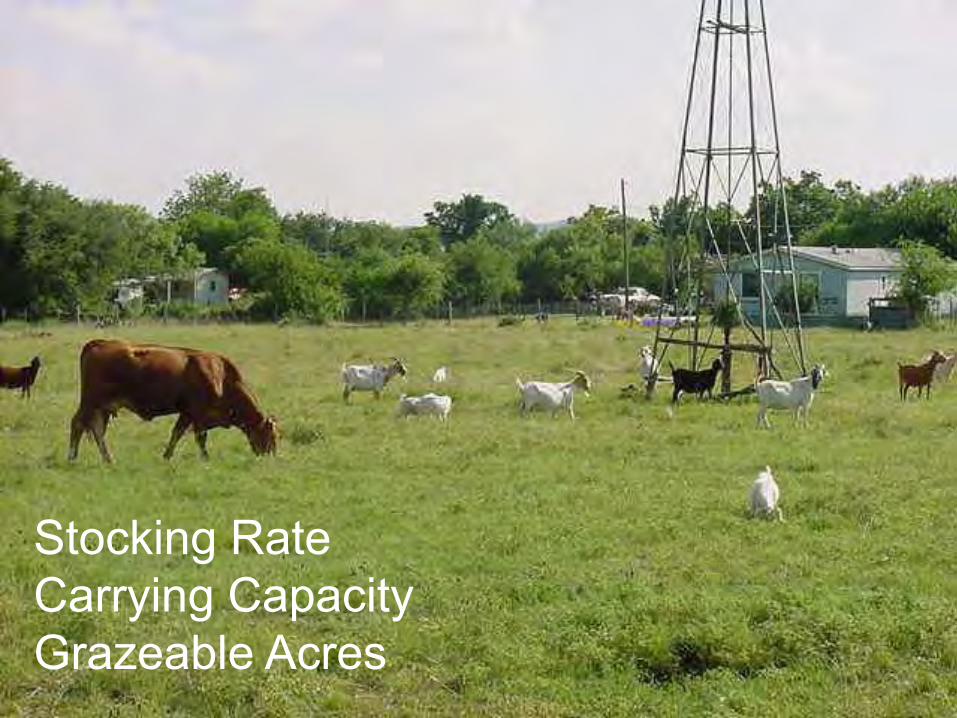
Stocking RateCarrying Capacity Grazeable Acres


Carrying Capacity, Stocking
Rate, & Grazeable Acres
Robert K. Lyons, Ph.D.Extension Range Specialist

Stocking Rate vs. Carrying Capacity
•Stocking rateAcres allotted to an animal Acres/animal unit/year
• Carrying capacityStocking rate possible w/o resource damageNumbers not set in stone, only guidelines

Carrying Capacity/Stocking
Rate Considerations
•Take half 25% to livestock 25% to trampling, insects, decay
•Leave halfProtect soil Plant vigor & protection
Take Half-Leave Half


Gillespie County
Major Soil Component Carrying Capacity
Soil Annual
Production, lb/ac
25% Production to
Livestock, lbs/ac
Carrying Capacity,
Ac/AUY
1 900-1800 225-450 42 21
2 1801-2800 450-700 21 14
3 2801-3500 700-875 14 11
4 3501-4500 875-1125 11 18
5 4501-6000 1125-1500 8 6
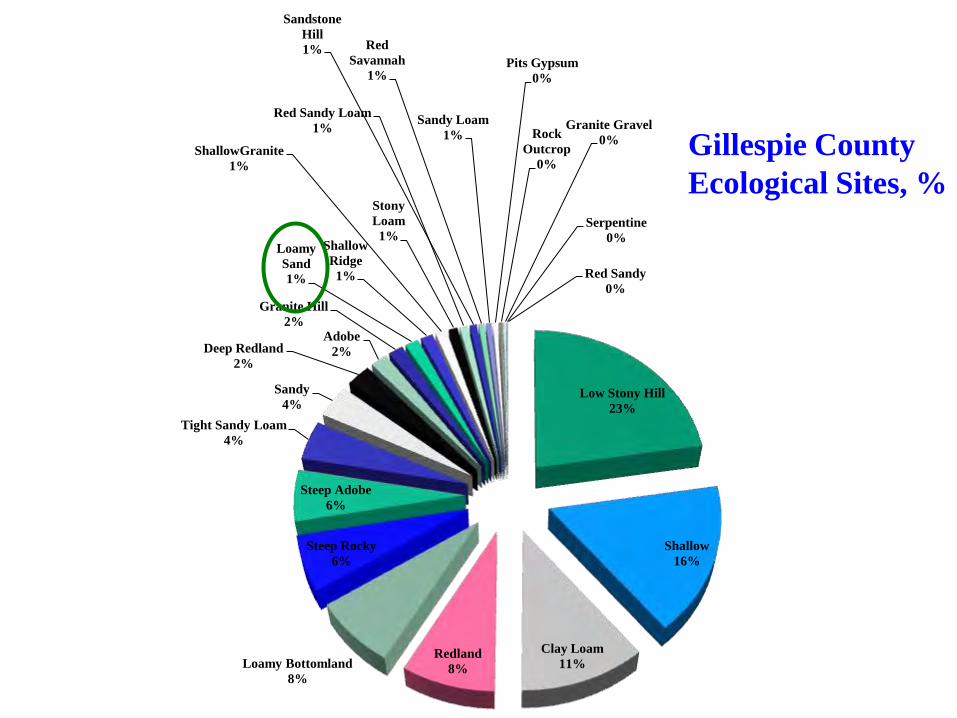
Low Stony Hill
23%
Shallow
16%
Clay Loam
11%Redland
8%Loamy Bottomland
8%
Steep Rocky
6%
Steep Adobe
6%
Tight Sandy Loam
4%
Sandy
4%
Deep Redland
2%
Adobe
2%
Granite Hill
2%
Loamy
Sand
1%
Shallow
Ridge
1%
ShallowGranite
1%
Stony
Loam
1%
Red Sandy Loam
1%
Sandstone
Hill
1% Red
Savannah
1%
Sandy Loam
1%
Pits Gypsum
0%
Rock
Outcrop
0%
Granite Gravel
0%
Serpentine
0%
Red Sandy
0%
Gillespie County
Ecological Sites, %

Low Stony Hill
152,125
Shallow
110,765Clay Loam
75,382
Redland
56,107
Loamy Bottomland
50,864
Steep Rocky
41,490
Steep Adobe
38,162
Tight Sandy Loam
28,729Sandy
24,175
Deep Redland
16,815Adobe
11,448
Granite
Hill
10,138
Loamy Sand
9,221
Shallow
Ridge
8,456
ShallowGranite
7,628
Stony
Loam
5,962
Red Sandy
Loam
5,615
Sandstone Hill
4,838
Red
Savannah
4,021
Sandy
Loam
3,762
Pits
Gypsum
3,207
Clay
Flat
3,146
Rock
Outcrop
2,816
Granite
Gravel
1,494
Serpentine
781Red
Sandy
353Dams
11
Pits Mine
3
Gillespie County
Ecological Site, Acres

Low Stony Hill
Theoretical Carrying Capacities
0
5
10
15
20
25
30
Favorable Average Unfavorable
9
14
28
Carrying
Capacity,
Ac/AUY
Rainfall

Stocking Rate Perspectives
Range resource Animal performance

Stocking Rate Considerations
• Proper stocking rate (carrying capacity) example:30 ac /animal unit/year
• Animal unit (1000-lb cow)Forage demand, 26 lbs/day
• 1200-lb cowForage demand, 1200 lbs x 0.026 = 31 lbs/day
Animal unit equivalent, 31 lbs ÷ 26 lbs = 1.2 Stocking rate, 30 ac/AUY x 1.2 = 36 ac/cow
Animal Size

Stocking Rate Considerations
• Proper stocking rate (carrying capacity) example:30 ac/animal unit/year
• 1200-lb cow, weaning 500-lb calf
Forage demand, 1200 lbs x 0.026 = 31 lbs/day Animal unit equivalent, 30 lbs ÷ 26 lbs = 1.2 Stocking rate, 1.2 x 30 ac/AUY = 36 ac/cow
• 1200-lb cow, weaning 600-lb calf
Forage demand, 1200 lbs x 0.03 = 36 lbs/day Animal unit equivalent, 36 lb ÷ 26 lb = 1.4 Stocking rate, 1.4 x 30 ac/AUY = 42 ac/cow
Animal Productivity

Stocking Rate Considerations
•Ranch/pasture size• Brush cover/density• Topography• Distance to water • Forage preference
Grazeable Acres

GPS Collars

Gravelly Redland:Low Stony Hill
Preference
2.5:1
Edwards Plateau Ranch 2


8173
25
00
10
20
30
40
50
60
70
80
90
Use, %
1 2 3 4
Brush Density Score


Rock Cover, % Use, % No Use
<28 68 32
>28 12 88

Forage Preference

Slope
0102030405060708090
100
Cumulative GPS
Positions, %
1 3 5 7 9 11 13 15 17 19 21 23 25 27 29Slope, %

Grazeable Acres
Distance to Water Percent Use
0.5 1001.0 901.25 801.5 601.75 402.0 202.5 10

Water
Access
N & S
Available
Gravelly Redland
Low Stony Hill

Gravelly Redland
Low Stony Hill
Water
Access
North Only

Gravelly Redland
Low Stony Hill
Water
Access
South Only

Edwards Plateau Ranch 3
Deep Redland
1%
Gravelly Redland
3% Redland
8%
Low Stony Hill
37%
Steep Rocky
51%

Edwards Plateau Ranch 3
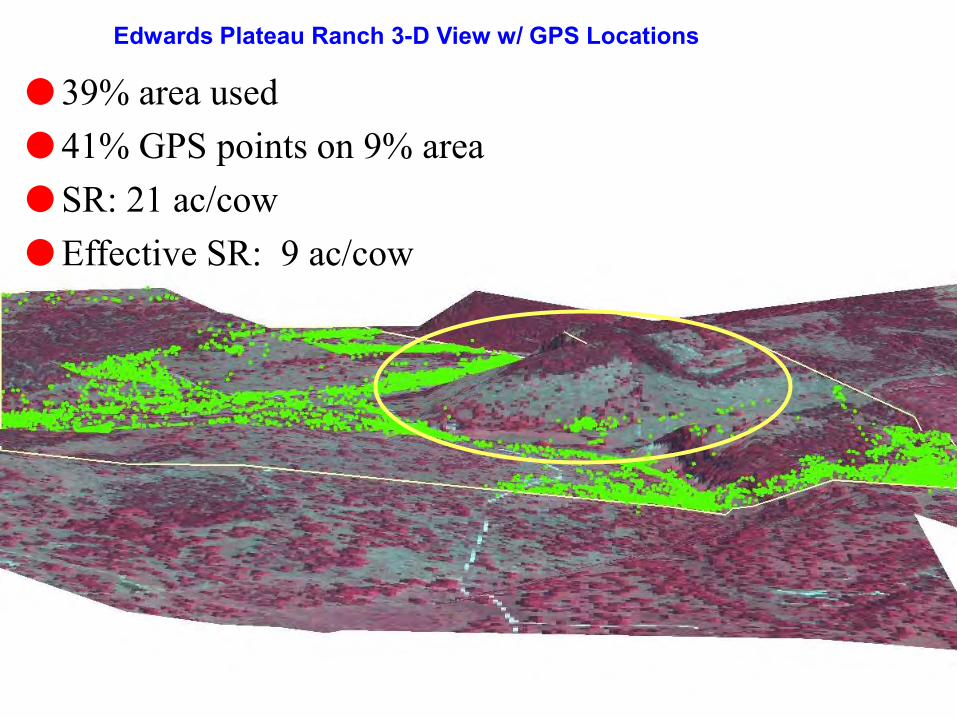
Edwards Plateau Ranch 3-D View w/ GPS Locations
39% area used 41% GPS points on 9% area SR: 21 ac/cowEffective SR: 9 ac/cow

Carrying Capacity &
Stocking Rate
• Monitoring: can’t set it & forget it Range resource Forage residue Range health indicators
Animal performance Body condition scores Gain records
How Do You Know Your’re Getting it Right?
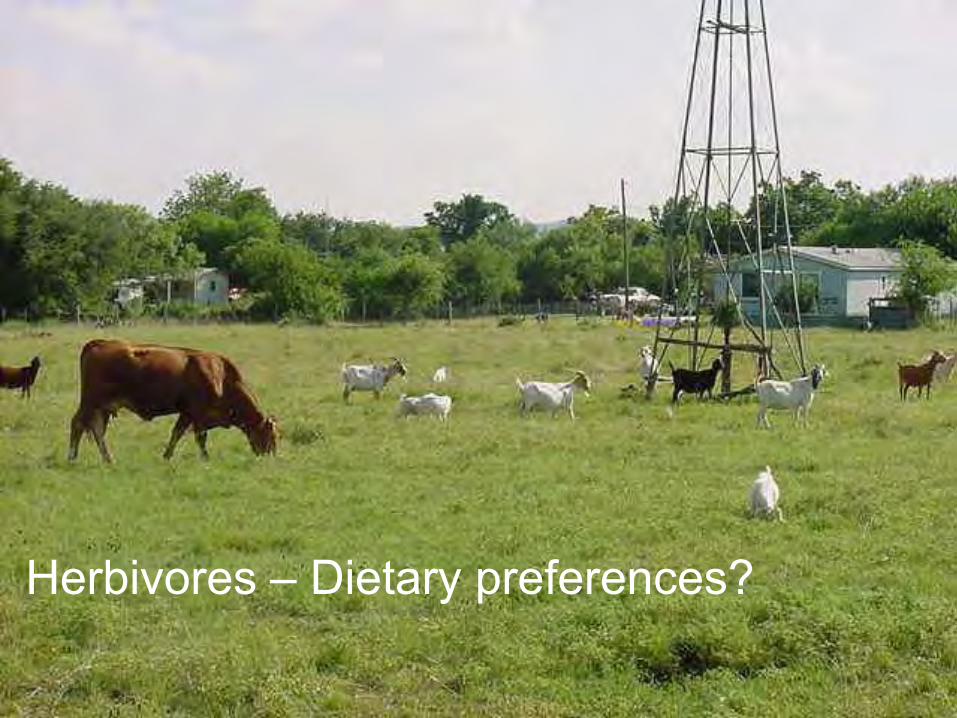
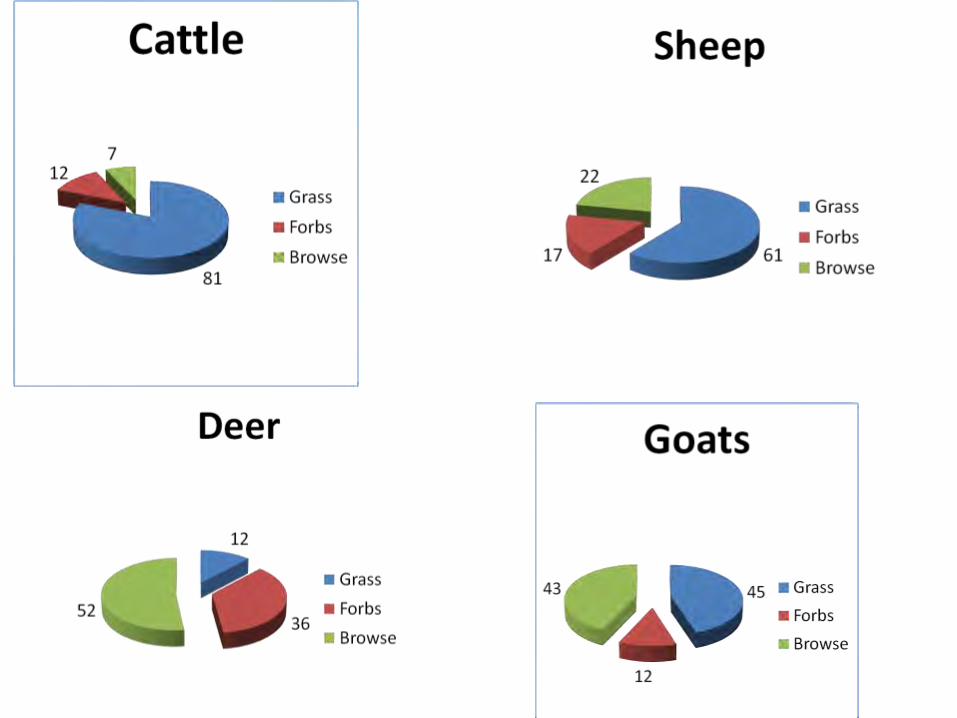
Herbivores – Dietary preferences?

Annual Diet Composition, %
81
127
Cattle
Grass
Forbs
Browse6117
22
Sheep
Grass
Forbs
Browse
from What Range Herbivores Eat and Why, Lyons et al., B-6037

Annual Diet Composition, %
45
12
43
Goats
Grass
Forbs
Browse
12
3652
Deer
Grass
Forbs
Browse
from What Range Herbivores Eat and Why, Lyons et al., B-6037


% Browse0
50100
10 23 50 6530
Approximate Annual Diet –% Browse
from “The Use and Management of Browse in the Edwards
Plateau of Texas”, NRCS Pub., 1994

Competition Among DeerKerr Wildlife Area, 1971
• 96 acre enclosure
– 6 whitetail deer
– 6 sika deer
• No livestock
• Primary browse
– Shinoak
– Liveoak
• Mid 70’s = record rainfall
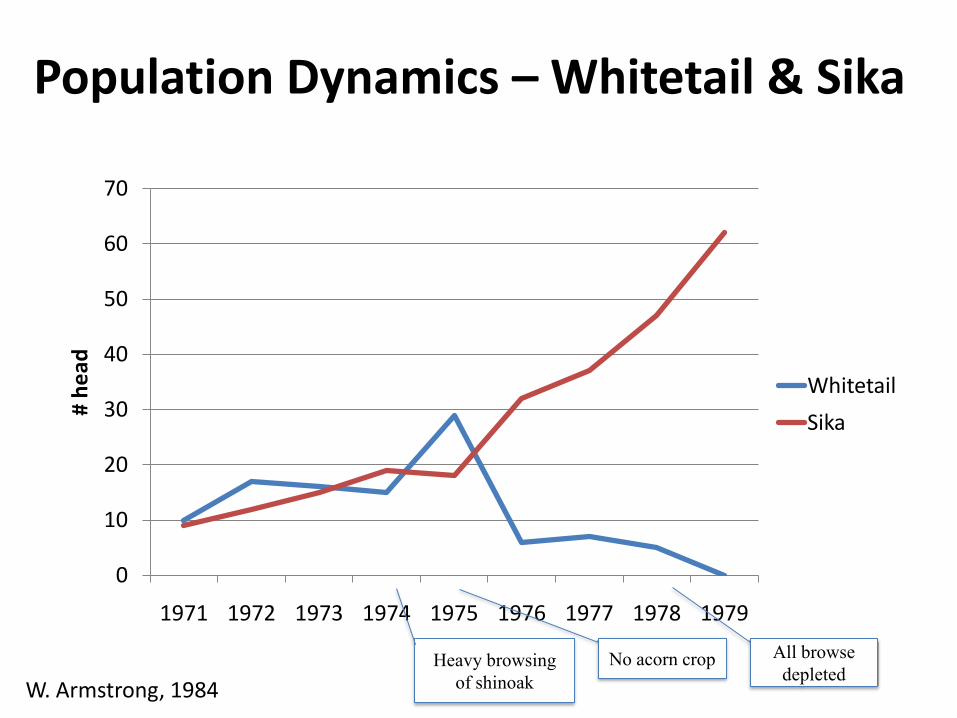
Population Dynamics – Whitetail & Sika
0
10
20
30
40
50
60
70
1971 1972 1973 1974 1975 1976 1977 1978 1979
# h
ead
Whitetail
Sika
Heavy browsing
of shinoak
No acorn crop All browse
depletedW. Armstrong, 1984


Diet Preference


Thank you