river water quality index for morocco using a fuzzy inference system
TRANSCRIPT
Mourhir et al. Environmental Systems Research 2014, 3:21http://www.environmentalsystemsresearch.com/content/3/1/21
RESEARCH Open Access
River water quality index for Morocco using afuzzy inference systemAsmaa Mourhir1*, Tajjeeddine Rachidi2 and Mohammed Karim3
Abstract
Background: The aim of this work is to propose a new river water quality index using fuzzy logic. The proposedfuzzy index combines quality indicators’ prescribed thresholds extracted mainly from the Moroccan and the Quebecwater legislations. The latter is reputed for its strict water quality assessment. The proposed index combines sixindicators, and not only does it exhibit a tool that accounts for the discrepancy between the two base indices, butalso provides a quantifiable score for the determined water quality. These classifications with a membership gradecan be of a sound support for decision-making, and can help assign each section of a river a gradual qualitysub-objective to be reached.
Results: To demonstrate the applicability of the proposed approach, the new index was used to classify waterquality in a number of stations along the basins of Bouregreg-Chaouia and Zizi-Rhéris. The obtained classificationswere then compared to the conventional physicochemical water quality index currently in use in Morocco. Theresults revealed that the fuzzy index provided stringent classifications compared to the conventional index in 41%and 33% of the cases for the two basins respectively. These noted exceptions are mainly due to the big disparitiesbetween the different quality thresholds in the two standards, especially for fecal coliform and total phosphorus.
Conclusions: These large disparities put forward an argument for the Moroccan water quality legislation to beupgraded to align water and environmental assessment methods with other countries in order to mitigate the risksof failing to achieve a good ecological status.
Keywords: Water quality index; Surface water; Fuzzy logic; Bouregreg-chaouia basin; Zizi-rhéris basin
BackgroundWater quality indices aim at turning several complex in-dicators into a single synthesized value that describesthe water quality of a particular source, and which is un-derstandable by a wide audience including non-expertslike the public or decision and policy-makers. There exista number of water quality indices based on different indi-cators and aggregation methods used today throughoutthe world, such as the U.S. National Sanitation Foun-dation Water Quality Index (NSFWQI); the CanadianCouncil of Ministers of the Environment Water QualityIndex (CCMEWQI); the British Columbia Water QualityIndex (BCWQI), and the Oregon Water Quality Index(OWQI).
* Correspondence: [email protected] of Sciences and Engineering, Al Akhawayn University in Ifrane,PO.Box 2083, Ifrane 53000, MoroccoFull list of author information is available at the end of the article
© 2014 Mourhir et al.; licensee Springer. This isAttribution License (http://creativecommons.orin any medium, provided the original work is p
A general flaw with conventional water quality indicesis that they depend on human expertise with subjectiveand ambiguous information, which might raise a numberof issues in water quality assessment. Another majorproblem is that quality indicator concentrations, no mat-ter how far from or close to the limits have the same im-pact on the final score and might fall within the sameclasses (Icaga 2007). To deal with ambiguity and uncer-tainties, fuzzy logic, which was first introduced by (Zadeh1965) is commonly used as a powerful formalism in envir-onmental evaluation and assessment such as in water orair pollution issues. Ecological impact classification andenvironmental decision-making using fuzzy logic are dis-cussed in detail by (Shepard 2005; Silvert 1997, 2000).According to the authors, using fuzzy logic is very con-venient in the assessment of environmental issues becauseit can solve properly the ambiguities and subjectivity in-herent in these problems. It also helps conciliating con-flicting observations due to human expertise, and last but
an Open Access article distributed under the terms of the Creative Commonsg/licenses/by/4.0), which permits unrestricted use, distribution, and reproductionroperly cited.
Mourhir et al. Environmental Systems Research 2014, 3:21 Page 2 of 12http://www.environmentalsystemsresearch.com/content/3/1/21
not least, it can provide decision-makers with the abilityto make well-informed decisions that are technicallysound and legally defensible. Moreover, with fuzzy logicone can describe water quality in a location as being 10%excellent and 90% just good, which is not possible withclassical approaches to water quality.Fuzzy logic has shown a good promise in modeling new
water quality indices. (Lu et al. 1999; Chang et al. 2001)studied the feasibility of applying Fuzzy Synthetic Evalu-ation (FSE) to water quality. The Fuzzy ComprehensiveAssessment (FCA) method was used by (Shen et al. 2005)to investigate pollution and evaluate the soil environmen-tal quality of the Taihu lake watershed. (Liou et al. 2003)applied a two-stage fuzzy set theory to river quality evalu-ation in Taiwan. (Ocampo-Duque et al. 2006) used fuzzylogic and a comprehensive multi-attribute decision-aidingmethod based on the Analytic Hierarchy Process (AHP)to estimate the relative importance of water quality indica-tors. A 6-step procedure to develop a fuzzy water qualityindex was described in (Icaga 2007), and was applied tolake water. In another study by (Sadiq and Tesfamariam2008), a Weighted Averaging Operator (OWA) was usedfor aggregation in developing the water quality index.(Lermontov et al. 2009; Roveda et al. 2010) developedfuzzy water quality indices for Brazilian rivers, and com-pared their performance with the conventional WQIs. Adifferent approach was carried out by (Nasiri et al. 2007);the authors proposed a fuzzy multi-attribute decision sup-port system to compute the water quality index and tooutline the prioritization of alternative plans based on theextent of improvements in water quality. (Mahapatra et al.2011) used a Cascaded Fuzzy Inference System (CFS) todesign a multi-input, multi-output water quality index. Ina recent study, (Gharibi et al. 2012) developed a FWQI forwhich the water quality indicators were practical and easyto measure, including heavy metals, and used the index toassess water quality in the Mamloo dam for drinkingpurposes. A different approach based on hybrid fuzzy-probability models was adopted in (Ocampo-Duque et al.2013; Nikoo et al. 2011). In a recent work, (Wang et al.2014) used variable fuzzy set and the information entropytheory as an assessment model to evaluate water qualityof the Meiliang Bay in Taihu Lake Basin in China.The water quality in Moroccan rivers and streams is
becoming more and more of a concern because of thesignificant amount of pollutants discharged into theseecosystems, in most cases without any treatment. Physico-chemical and microbiological measurements and analysesare performed regularly by a number of public administra-tions. However, these analyses remain insufficient giventhe diversity of chemicals and the variety of pollutionsources. This said; considerable efforts have been deployedrecently in Morocco to improve water quality. The adop-tion of the “10-95” Water Law in 1995, the establishment
of River Basin Management Agencies, the adoption of na-tional plans for integrated water resource management,the adoption of a national program for sewerage andwastewater treatment in 2008, as well as the WaterStrategy in 2009 are all actions in favor of better waterquality outcomes. However, the application of the “10-95”texts is slow, and there is no improvement worthy to men-tion as yet in water quality, which remains generally de-graded. In addition, the quality indicators used in analysisremain insufficient today, and pesticides intensified by theMaroc Vert plan are not taken into account. Only a sim-plified set of indicators that are realistic and easy to meas-ure are actually used in the conventional index to estimateriver water quality. For the other indicators (like heavymetals); the techniques used to evaluate these indicatorsare either complicated, time consuming, or costly, whichresults in discarding them from consideration in the finalassessment of water quality.Clearly, from the deficiencies cited above, there is a
need to upgrade the Moroccan legislation on water qual-ity to include a new index. Such an index must factor inthe use of indicators with direct causes on human andanimal health, as well as evaluation thresholds. Our ap-proach is progressive, and consists of providing, throughfuzzy logic, a new index that captures the essence of theexisting one (the conventional physiochemical index de-signed by a Decree in 2002 and never revised since), andyet incorporates the benefits of another well standingindex. This is an initial step to improve water quality as-sessment through enhancement of threshold values inorder to account for real water pollution, the index stillneeds to be improved to take into consideration contam-ination with heavy metals. For this purpose, the overallwater quality index of Quebec (IQBP) (Hébert 1997) waschosen. The IQBP is very comparable to the Moroccanconventional water quality index, which will be referredto in the remainder of the text as (IMBP). Both IMBPand IQBP estimate water quality based on a number ofphysicochemical and bacteriological indicators, and pro-vide water quality classes for multiple usages. They arealso similar in terms of the evaluation method usedwhich is based on the “minimum operator” that assignsthe lowest indicator quality to the overall water qualityin a given location. Moreover, the approach used to de-sign the IQBP index relied on a group of thirty waterquality experts and professionals from different horizons(chemists, biologists, managers, etc..) who have beenconsulted according to the Delphi method (Linstone andTuroff 1975). However, a quick comparison between theMoroccan water quality indicator threshold values andthe ones used in Quebec reveals a big disparity betweenthe two standards.In this work, fuzzy methodology is used to come up
with a water quality index that we will be referring to as
Mourhir et al. Environmental Systems Research 2014, 3:21 Page 3 of 12http://www.environmentalsystemsresearch.com/content/3/1/21
MFWQI, by combining the Moroccan and Quebec stan-dards. Membership functions for the different waterquality indicators were developed considering boundar-ies from both water regulatory bodies. A fuzzy inferencesystem was used to assess water quality with a member-ship grade in a number of stations along the basin understudy. In the aforementioned studies about fuzzy indices,the generation of membership functions is usually donebased on expert opinions, and hence remains difficult tomaintain or update because they require expert consult-ation every time. In this paper, an easy-to-use method isintroduced; it facilitates the generation of suitable mem-bership functions based on a combination of alreadyestablished standards by merging water quality thresh-olds in an automatic way. For any given indicator, thequality threshold values are determined in both stan-dards; trapezoidal and triangular membership functionsare then derived automatically based on interval inter-section and linear interpolation. Furthermore, rules arederived automatically based on the number of variablesas well as the number of membership functions, and theaggregation method used. If n is the number of requiredinput variables, each represented with m membershipfunctions, then the total number of rules required tomodel the system is m^n. Our approach in this work is
Figure 1 Comparison of IMBP and MFWQI indices for the different sta
to automatically generate the fuzzy index with minimumneed for expert involvement.The concepts needed to model an index using fuzzy
logic, including membership functions and fuzzy inferencesteps are described concisely in the Methods section.
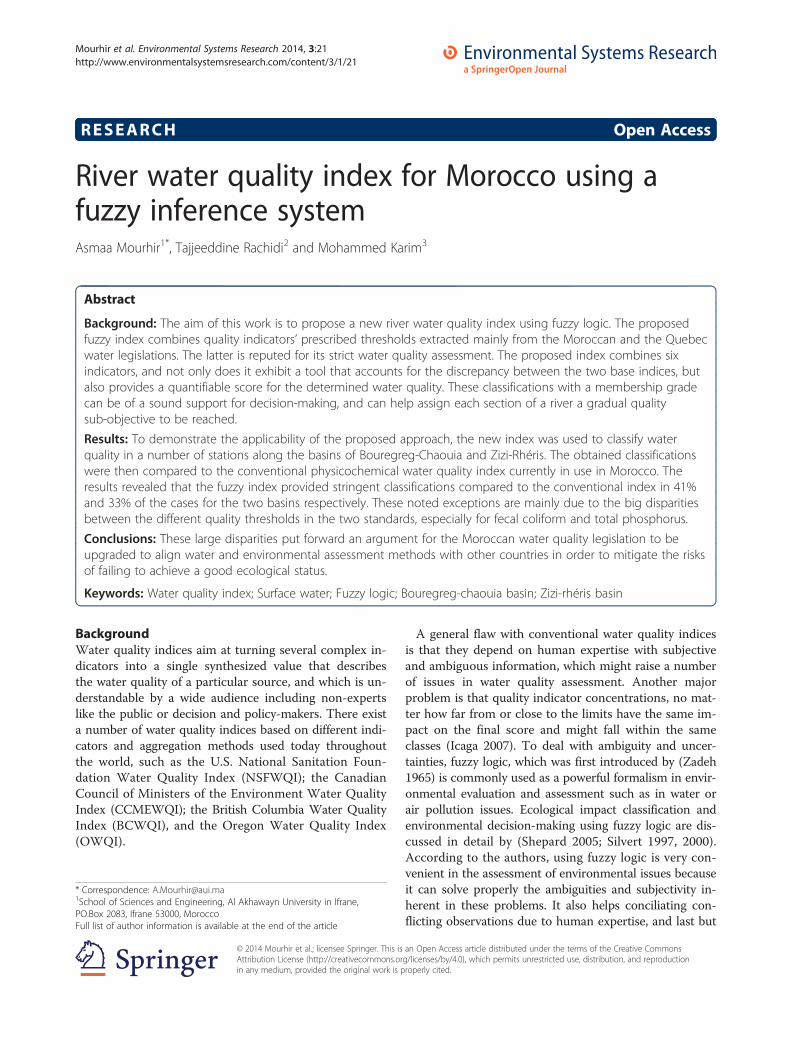
Results and discussionThe results of comparison between the MFWQI andthe conventional IMBP for each sampling site of theBouregre-Chaouia basin over the period under studyare illustrated in Figure 1.Based on the IMBP simplified quality grid shown in
Table 1, the results of the monitoring performed duringfour campaigns showed that 76% of the sampled surfacewater points had a poor to very poor quality in January-09,as compared to 23% of good to average quality. However,in July-09 the quality improved to 44% points of good toaverage quality as compared to 56% points of poor to verypoor quality.Based on the MFWQI, the results showed that 88% of
the sampled surface water points had a poor to very poorquality in January-09, as compared to only 12% of good toaverage quality. In July-09 the quality improved to 32%points of good to average quality as compared to 68%points of poor to very poor quality.
tions of the Bouregreg-Chaouia basin.
Table 1 Simplified rating table for the IMBP water quality indicators (Official Bulletin N°. 5062 of 5 December 2002)
Sub-index DO BOD5 COD NH4+ TP FC Index
(mg/L) (mg/L) (mg/L) (mg/L) (mg/L) (cfu/100 ml)1
Excellent >7 <3 <30 <=0.1 <=0.1 <=20 80 – 100
Good 7 – 5 3 – 5 30 – 35 0.1 – 0.5 0.1 – 0.3 20 – 2000 60 – 80
Average 5 – 3 5 – 10 35 – 40 0.5 – 2 0.3 – 0.5 2000 – 20000 40 – 60
Poor 3 – 1 10 – 25 40 – 80 2 – 8 0.5 – 3 >20000 20 – 40
Very poor <1 >25 >80 >8 >3 - 0 – 201cfu colony forming units.
Mourhir et al. Environmental Systems Research 2014, 3:21 Page 4 of 12http://www.environmentalsystemsresearch.com/content/3/1/21
As can be seen in Figure 1, both indices showed moreor less correlated results with some sensitivity to waterpollution. The IMBP and MFWQI had a correlationcoefficient of 0.93, demonstrating the sound applic-ability of the index. In spite of this, the MFWQI re-sulted in a more severe assessment compared to theconventional physicochemical index. Indeed, the qual-ity class obtained with the fuzzy index was lower for41% of the sampled sites. In other cases, the evalua-tions of water quality carried out by the two indiceswere comparable.The results of comparison between the MFWQI and
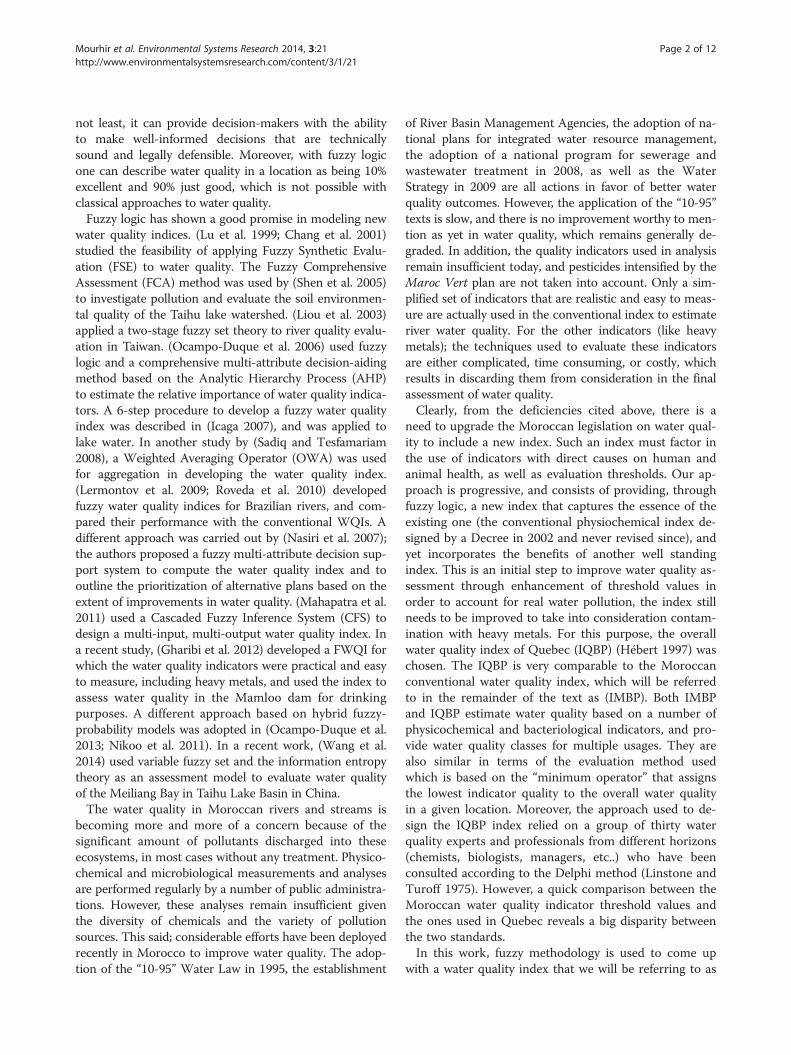
the conventional IMBP for some sampling sites of theZiz-Rhéris basin between 2007 and 2008 are illustratedin Figure 2. The water of Oued Ziz has a good qualityupstream and becomes moderately polluted downstreamnear urban areas, due to urban discharges. The water ofOued Rhéris has a good quality most of the time. Hereagain it can be seen that the quality class obtained withthe fuzzy index was lower for 33% of the sampled sites.This percentage is lower in the basin of Ziz-Rhérissince the unit is less polluted compared to the basinof Bouregreg-Chaouia.
Figure 2 Comparison of IMBP and MFWQI indices for the different sta
By examining the relative distribution of these resultsby quality classes, it is obvious that disparities betweenthe two indices appear throughout all of the quality clas-ses, especially in the lower ones. It can also be noticedin Figures 1 and 2 that, when conventional and fuzzyindices do not produce a similar assessment, the gapbetween the quality classes is usually of a single class.These differences are observed at sites where a single in-dicator is always problematic (fecal coliforms or totalphosphorus). Given the nature of the two indices andquality thresholds used for their calculation, this is quitenormal. Fecal coliforms and total phosphorus are evaluatedmore harshly with the IQBP. For example, if we considerfecal coliforms, the value used in the IQBP to distinguish“poor” water quality from “very poor” quality is 3500 (cfu/100 mL), while the quality criterion used in the Moroccanindex is “poor” when the FC is above 20000 (cfu/100 mL).Furthermore, there is no category for “very poor” qualityfor this indicator in the Moroccan index. It is important tonote that individuals exposed to water contaminated withfecal coliforms have a potential health risk.Unsurprisingly, the proposed fuzzy index revealed
some discrepancies between the Moroccan water quality
tions of the Ziz-Rhéris basin.
Mourhir et al. Environmental Systems Research 2014, 3:21 Page 5 of 12http://www.environmentalsystemsresearch.com/content/3/1/21
index and the other surface water quality standards. Thefuzzy index is more effective in the sense that it is moreaccurate in detecting water pollution because it concili-ates between water quality ranges as prescribed by thetwo water regulatory bodies, namely the Moroccan le-gislation and that of Quebec, which is considered to bestricter.Moreover, the conventional assessment of water quality
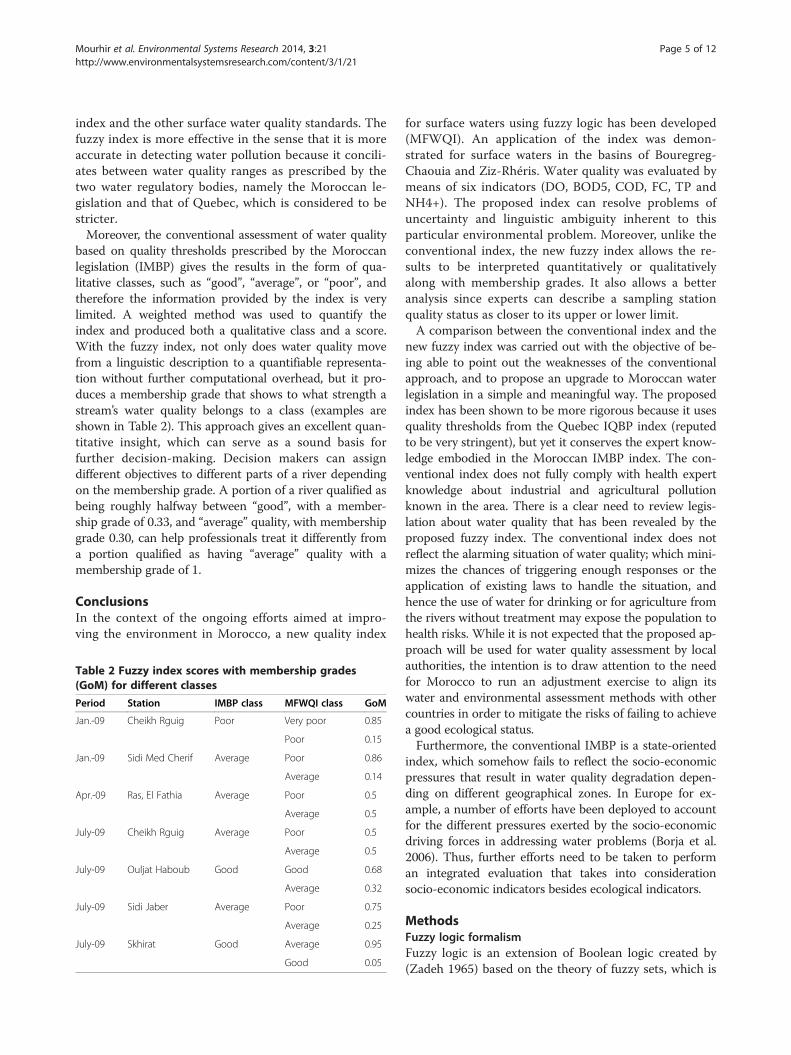
based on quality thresholds prescribed by the Moroccanlegislation (IMBP) gives the results in the form of qua-litative classes, such as “good”, “average”, or “poor”, andtherefore the information provided by the index is verylimited. A weighted method was used to quantify theindex and produced both a qualitative class and a score.With the fuzzy index, not only does water quality movefrom a linguistic description to a quantifiable representa-tion without further computational overhead, but it pro-duces a membership grade that shows to what strength astream’s water quality belongs to a class (examples areshown in Table 2). This approach gives an excellent quan-titative insight, which can serve as a sound basis forfurther decision-making. Decision makers can assigndifferent objectives to different parts of a river dependingon the membership grade. A portion of a river qualified asbeing roughly halfway between “good”, with a member-ship grade of 0.33, and “average” quality, with membershipgrade 0.30, can help professionals treat it differently froma portion qualified as having “average” quality with amembership grade of 1.
ConclusionsIn the context of the ongoing efforts aimed at impro-ving the environment in Morocco, a new quality index
Table 2 Fuzzy index scores with membership grades(GoM) for different classes
Period Station IMBP class MFWQI class GoM
Jan.-09 Cheikh Rguig Poor Very poor 0.85
Poor 0.15
Jan.-09 Sidi Med Cherif Average Poor 0.86
Average 0.14
Apr.-09 Ras, El Fathia Average Poor 0.5
Average 0.5
July-09 Cheikh Rguig Average Poor 0.5
Average 0.5
July-09 Ouljat Haboub Good Good 0.68
Average 0.32
July-09 Sidi Jaber Average Poor 0.75
Average 0.25
July-09 Skhirat Good Average 0.95
Good 0.05
for surface waters using fuzzy logic has been developed(MFWQI). An application of the index was demon-strated for surface waters in the basins of Bouregreg-Chaouia and Ziz-Rhéris. Water quality was evaluated bymeans of six indicators (DO, BOD5, COD, FC, TP andNH4+). The proposed index can resolve problems ofuncertainty and linguistic ambiguity inherent to thisparticular environmental problem. Moreover, unlike theconventional index, the new fuzzy index allows the re-sults to be interpreted quantitatively or qualitativelyalong with membership grades. It also allows a betteranalysis since experts can describe a sampling stationquality status as closer to its upper or lower limit.A comparison between the conventional index and the
new fuzzy index was carried out with the objective of be-ing able to point out the weaknesses of the conventionalapproach, and to propose an upgrade to Moroccan waterlegislation in a simple and meaningful way. The proposedindex has been shown to be more rigorous because it usesquality thresholds from the Quebec IQBP index (reputedto be very stringent), but yet it conserves the expert know-ledge embodied in the Moroccan IMBP index. The con-ventional index does not fully comply with health expertknowledge about industrial and agricultural pollutionknown in the area. There is a clear need to review legis-lation about water quality that has been revealed by theproposed fuzzy index. The conventional index does notreflect the alarming situation of water quality; which mini-mizes the chances of triggering enough responses or theapplication of existing laws to handle the situation, andhence the use of water for drinking or for agriculture fromthe rivers without treatment may expose the population tohealth risks. While it is not expected that the proposed ap-proach will be used for water quality assessment by localauthorities, the intention is to draw attention to the needfor Morocco to run an adjustment exercise to align itswater and environmental assessment methods with othercountries in order to mitigate the risks of failing to achievea good ecological status.Furthermore, the conventional IMBP is a state-oriented
index, which somehow fails to reflect the socio-economicpressures that result in water quality degradation depen-ding on different geographical zones. In Europe for ex-ample, a number of efforts have been deployed to accountfor the different pressures exerted by the socio-economicdriving forces in addressing water problems (Borja et al.2006). Thus, further efforts need to be taken to performan integrated evaluation that takes into considerationsocio-economic indicators besides ecological indicators.
MethodsFuzzy logic formalismFuzzy logic is an extension of Boolean logic created by(Zadeh 1965) based on the theory of fuzzy sets, which is
Mourhir et al. Environmental Systems Research 2014, 3:21 Page 6 of 12http://www.environmentalsystemsresearch.com/content/3/1/21
a generalization of the classical set theory. By allowing acondition to be partly true and partly false at the sametime, fuzzy logic makes it suitable to take into accountany ambiguities or uncertainties. A key concept in fuzzylogic is membership functions.
Membership functionsLet X be the universe of discourse and its elements de-noted by x. A fuzzy set A in the universe X is character-ized by a membership function μA : X → [0, 1]. Thefuzzy set A can be represented by the set of pairs of anelement x ∈ X and its degree of membership defined bya membership function μA(x):
A ¼ x;A xð Þð Þ =x∈ Xf g ð1Þ
A degree of zero means that the value is not in the set,a degree of one means that the value is totally represen-tative of the set, and a degree confined between zeroand one means the value is partially in the set. Theshape of the membership function is often chosen basedon the advice of an expert or by statistical studies. ASigmoid shape, Triangular, Trapezoidal, Gaussian or anyother type can be used. The concept of membershipfunctions discussed above allows the definition of fuzzynatural language systems that make use of linguistic var-iables, where the universe of discourse of a variable isdivided into a number of fuzzy sets with a linguistic de-scription attributed to each one.
Fuzzy operatorsIn order to easily manipulate fuzzy sets, the operators ofthe classical set theory are adapted to the membershipfunctions specific to fuzzy logic, strictly allowing valuesbetween 0 and 1. Typically, the extension of the unionoperator (OR) to fuzzy sets A and B defined over thesame set X is defined as:
μA∪B xð Þ ¼ max μA xð Þ; μB xð Þ½ � ð2Þ
Where μA and μB are the membership functions forA and B respectively. Similarly, the fuzzy intersection(AND) is defined by:
μA∩B xð Þ ¼ min μA xð Þ; μB xð Þ½ � ð3Þ
Fuzzy inference rulesIn fuzzy logic, if-then rules and fuzzy set operators areused to describe the relationships between input vari-ables and output variables of a system. Fuzzy rules are acollection of linguistic statements that describe how afuzzy inference system should make a decision regarding
classifying an input or controlling an output. A fuzzyrule has one or more antecedents, usually connected bylinguistic operators such as “and” or “or”. Rules are al-ways written in the following form:
Ri : IF x is Ai and=or y is Bi THEN z is Ci
Where x and y are the input variables and z is the out-put variable. Ai, Bi and Ci are linguistic values for thevariables x, y and z respectively.
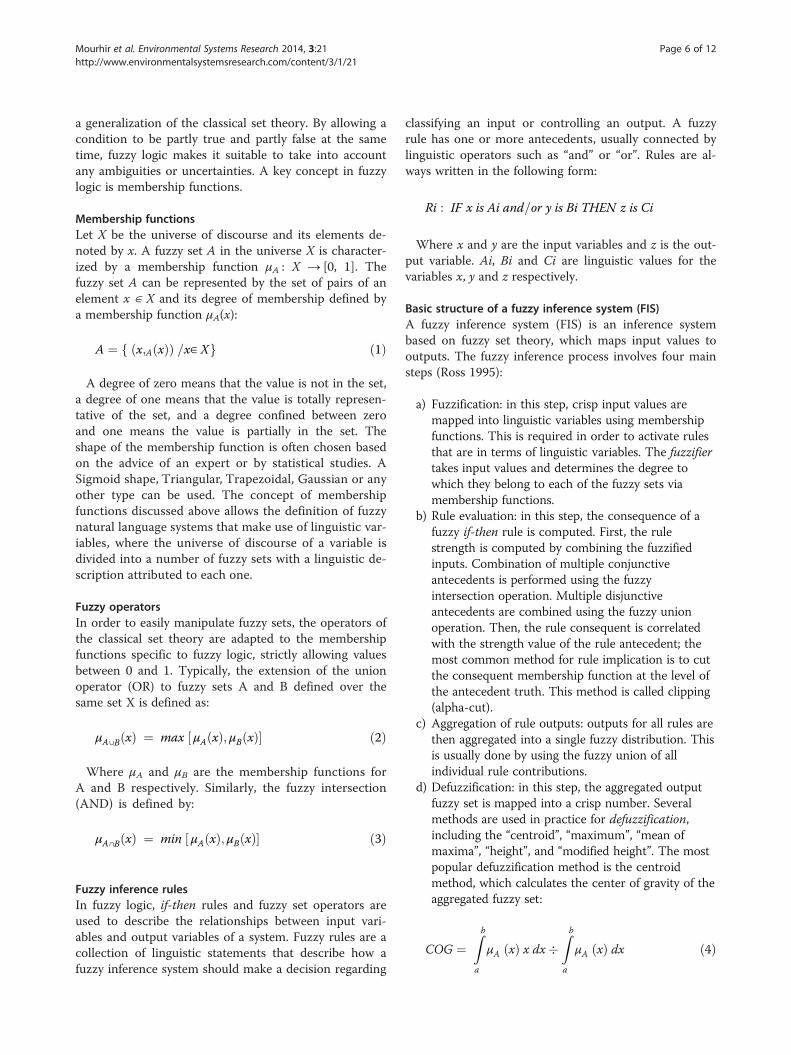
Basic structure of a fuzzy inference system (FIS)A fuzzy inference system (FIS) is an inference systembased on fuzzy set theory, which maps input values tooutputs. The fuzzy inference process involves four mainsteps (Ross 1995):
a) Fuzzification: in this step, crisp input values aremapped into linguistic variables using membershipfunctions. This is required in order to activate rulesthat are in terms of linguistic variables. The fuzzifiertakes input values and determines the degree towhich they belong to each of the fuzzy sets viamembership functions.
b) Rule evaluation: in this step, the consequence of afuzzy if-then rule is computed. First, the rulestrength is computed by combining the fuzzifiedinputs. Combination of multiple conjunctiveantecedents is performed using the fuzzyintersection operation. Multiple disjunctiveantecedents are combined using the fuzzy unionoperation. Then, the rule consequent is correlatedwith the strength value of the rule antecedent; themost common method for rule implication is to cutthe consequent membership function at the level ofthe antecedent truth. This method is called clipping(alpha-cut).
c) Aggregation of rule outputs: outputs for all rules arethen aggregated into a single fuzzy distribution. Thisis usually done by using the fuzzy union of allindividual rule contributions.
d) Defuzzification: in this step, the aggregated outputfuzzy set is mapped into a crisp number. Severalmethods are used in practice for defuzzification,including the “centroid”, “maximum”, “mean ofmaxima”, “height”, and “modified height”. The mostpopular defuzzification method is the centroidmethod, which calculates the center of gravity of theaggregated fuzzy set:
COG ¼Zba
μA xð Þ x dx�Zba
μA xð Þ dx ð4Þ
Mourhir et al. Environmental Systems Research 2014, 3:21 Page 7 of 12http://www.environmentalsystemsresearch.com/content/3/1/21
Development of the Moroccan fuzzy water quality indexThe Moroccan conventional index (IMBP)The assessment of surface water quality in Morocco isperformed using the water quality index IMBP definedby water legislation (Official Bulletin N°. 5062 of 5December 2002). The IMBP suggests recommended waterquality using a number of physicochemical and bacterio-logical indicators, and aggregates them to produce a sin-gle quality class depending on a given usage such as fishlife, irrigation, industrial uses, cooling, or raw water supplyintended for drinking.The IMBP index consists of six indicators: dissolved
oxygen (DO), biological oxygen demand during five days(BOD5), chemical oxygen demand (COD), ammonium(NH4+), fecal coliforms (FC) and total phosphorus (TP).The simplified rating grid of surface waters shown inTable 1 establishes five dominant classes according tothe utilization goals for which the water is intended.Each class is defined by a set of threshold values that thedifferent physicochemical or bacteriological indicators,which are particularly important, must not exceed.The IMBP index applies the concept of the lowest score,
i.e., the “minimum operator” is used to produce the finalindex score. The approach dictates that the water qualityin a sample corresponds to that of the indicator producingthe lowest sub-index as computed for every indicatorusing threshold values determined by Table 1.
IMBP ¼ minimumDO sub‐index; BOD5 sub‐index; COD
sub‐index; NH4þsub‐index; FC sub‐index; TP sub‐index
!
For example, if all the indicators have values corre-sponding to the “excellent” class, except one, which fallsinto the “average” class, the IMBP will assign the waterbody to the “average” class.Preliminary indications show that the “minimum op-
erator” approach is a more useful aggregation methodthan additive and multiplicative techniques. (Smith 1990)showed that most indices based on additive or multipli-cative approaches were insensitive; i.e., they were little in-fluenced by the poor quality associated with one or twodescriptors because of the aggregation method used. An-other advantage of this approach is that the index ensuresthat a certain number of basic indicators are assessedclearly before an overall classification is assigned to agiven water body. The rationale behind the method is thatit is very important to understand and specify the type ofwater pollution and the element that resulted in waterquality alteration, in order to establish a clear diagnosisand identify the water quality problem.Since the IMBP produces only qualitative classes such
as “excellent” or “poor”, a quantification method is adop-ted in order to obtain a quantitative value that can beeasily compared to the crisp scores produced by the
fuzzy index. To quantify the different classes, the valuesof the ranges set by the quality thresholds to evaluatewater quality are transformed into dimensionless num-bers ranging from 0 (for extremely poor water quality)to 100 (for absolutely excellent water quality).The sub-index of a given indicator is elaborated by
weighting, which means the index is obtained by produ-cing a value that is proportional to its real position in aclass range. The formula for calculating the weightedindex (IP) is shown by Eq. 5.
IPpa ¼ li þ ls –lið Þ= bs−bið Þ½ � � bs−pað Þ ð5Þ
Where:
– IPpa: the weighted index for indicator pa– li: the lower index– ls: the upper index– bi: the lower bound– bs: the upper bound– pa: the analyzed indicator value
The following example shows how to calculate theweighted index for BOD5 with value 3.5 mg/l. Asshown in Table 1, the value 3.5 is between 3 and 5;and therefore it belongs to the “good” class. Thus, thelower bound bi is 3, the upper bound bs is 5, thelower index li is 60 and the upper index ls is 80.Hence IP BOD5 is 75.
The Quebec water quality index (IQBP)In the late 1990s, the Quebec Department of Environ-ment developed a bacteriological and physicochemicalwater quality index (IQBP) for representing water qualitythroughout its river network. Based on this index, waterbodies are grouped into five classes according to all thepotential uses.To classify a water body, water quality is examined using
ten indicators, namely: total phosphorus (TP), fecal coli-forms (FC), ammonium (NH4+), nitrates (NO3
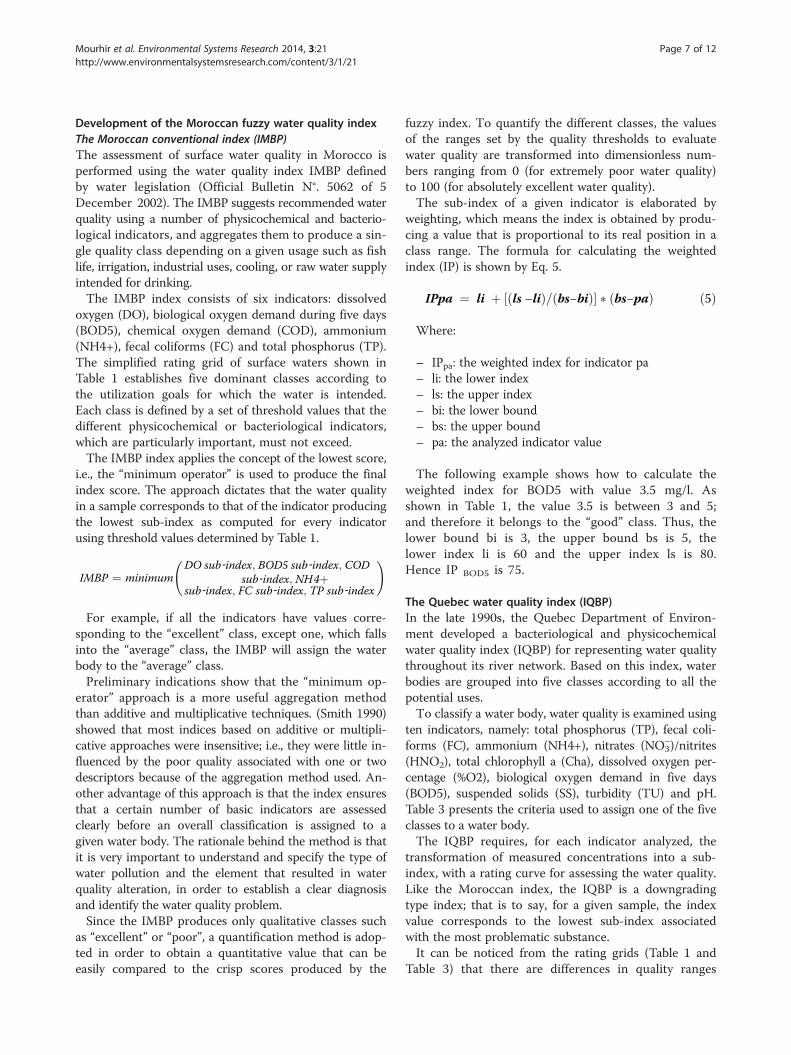
−)/nitrites(HNO2), total chlorophyll a (Cha), dissolved oxygen per-centage (%O2), biological oxygen demand in five days(BOD5), suspended solids (SS), turbidity (TU) and pH.Table 3 presents the criteria used to assign one of the fiveclasses to a water body.The IQBP requires, for each indicator analyzed, the
transformation of measured concentrations into a sub-index, with a rating curve for assessing the water quality.Like the Moroccan index, the IQBP is a downgradingtype index; that is to say, for a given sample, the indexvalue corresponds to the lowest sub-index associatedwith the most problematic substance.It can be noticed from the rating grids (Table 1 and
Table 3) that there are differences in quality ranges
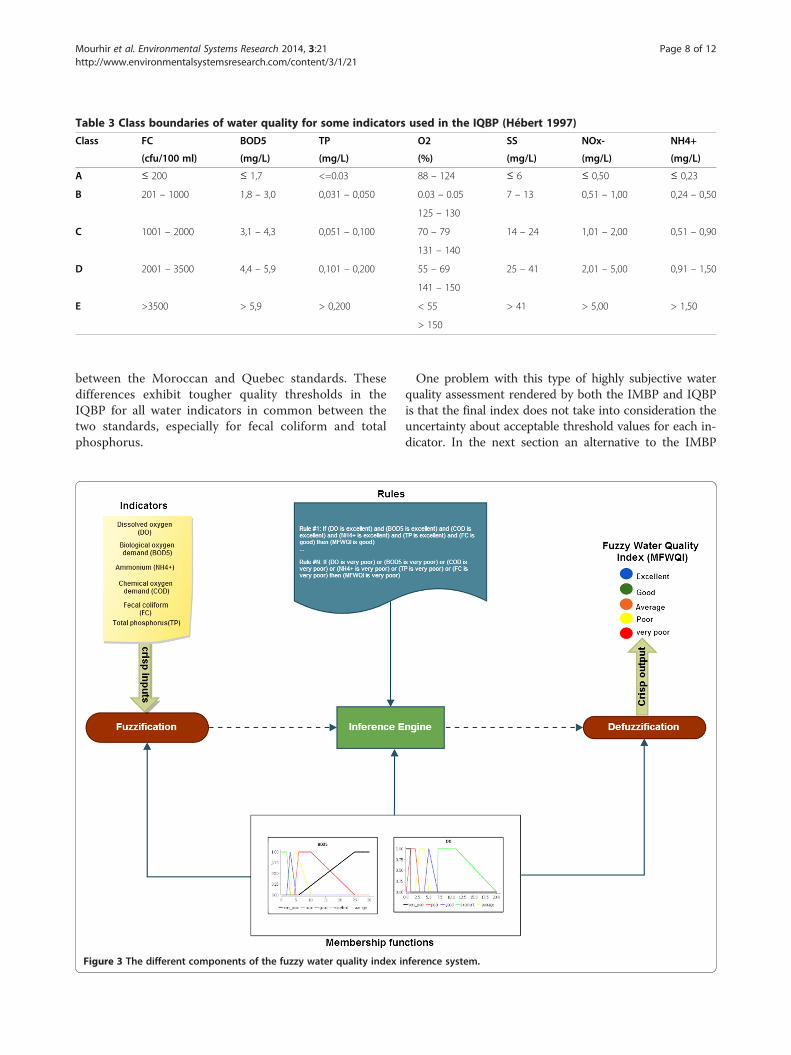
Table 3 Class boundaries of water quality for some indicators used in the IQBP (Hébert 1997)
Class FC BOD5 TP O2 SS NOx- NH4+
(cfu/100 ml) (mg/L) (mg/L) (%) (mg/L) (mg/L) (mg/L)
A ≤ 200 ≤ 1,7 <=0.03 88 – 124 ≤ 6 ≤ 0,50 ≤ 0,23
B 201 – 1000 1,8 – 3,0 0,031 – 0,050 0.03 – 0.05 7 – 13 0,51 – 1,00 0,24 – 0,50
125 – 130
C 1001 – 2000 3,1 – 4,3 0,051 – 0,100 70 – 79 14 – 24 1,01 – 2,00 0,51 – 0,90
131 – 140
D 2001 – 3500 4,4 – 5,9 0,101 – 0,200 55 – 69 25 – 41 2,01 – 5,00 0,91 – 1,50
141 – 150
E >3500 > 5,9 > 0,200 < 55 > 41 > 5,00 > 1,50
> 150
Mourhir et al. Environmental Systems Research 2014, 3:21 Page 8 of 12http://www.environmentalsystemsresearch.com/content/3/1/21
between the Moroccan and Quebec standards. Thesedifferences exhibit tougher quality thresholds in theIQBP for all water indicators in common between thetwo standards, especially for fecal coliform and totalphosphorus.
Figure 3 The different components of the fuzzy water quality index i
One problem with this type of highly subjective waterquality assessment rendered by both the IMBP and IQBPis that the final index does not take into consideration theuncertainty about acceptable threshold values for each in-dicator. In the next section an alternative to the IMBP
nference system.
Mourhir et al. Environmental Systems Research 2014, 3:21 Page 9 of 12http://www.environmentalsystemsresearch.com/content/3/1/21
index based on fuzzy logic is proposed with more rele-vance to the type of uncertainties involved in this parti-cular problem.
Building a fuzzy water quality index for Morocco (MFWQI)In order to combine the benefits from the two standardsdiscussed above, fuzzy methodology is used to propose anew water quality index by conciliating quality thresholdsfrom the Moroccan and Quebec legislations. Membershipfunctions for the different water quality indicators weredeveloped considering boundaries from both water regula-tory bodies. A fuzzy inference system was designed andbuilt to classify water quality with a membership grade.The components of the fuzzy inference system are de-picted in Figure 3.The method used to generate membership functions is
very simple. Having two pieces of intervals about thesame water quality class, these two pieces of informationare fused. It can be concluded that the actual value be-longs to the intersection of these intervals. If I and J re-spectively denote the quality ranges for a given class ofwater quality in the Moroccan standard and the Quebecone, then I ∩ J is considered as the interval where cer-tainty is the highest, corresponding to a degree of mem-bership equal to 1. Then, a linear interpolation is usedfor the remaining points not belonging to the intersec-tion by linking the lower and upper bounds of both Iand J to the intersection interval, which results in a trap-ezoidal shape. In cases where the intersection results ina single point, the shape is triangular.For example, for FC to be considered as “good”, FC
measurements must fall within [201, 1000] and [20,2000] for IQBP and IMBP respectively. For the purposeof our fuzzy index, a trapezoidal membership functionfor the term “good” corresponding to the indicator
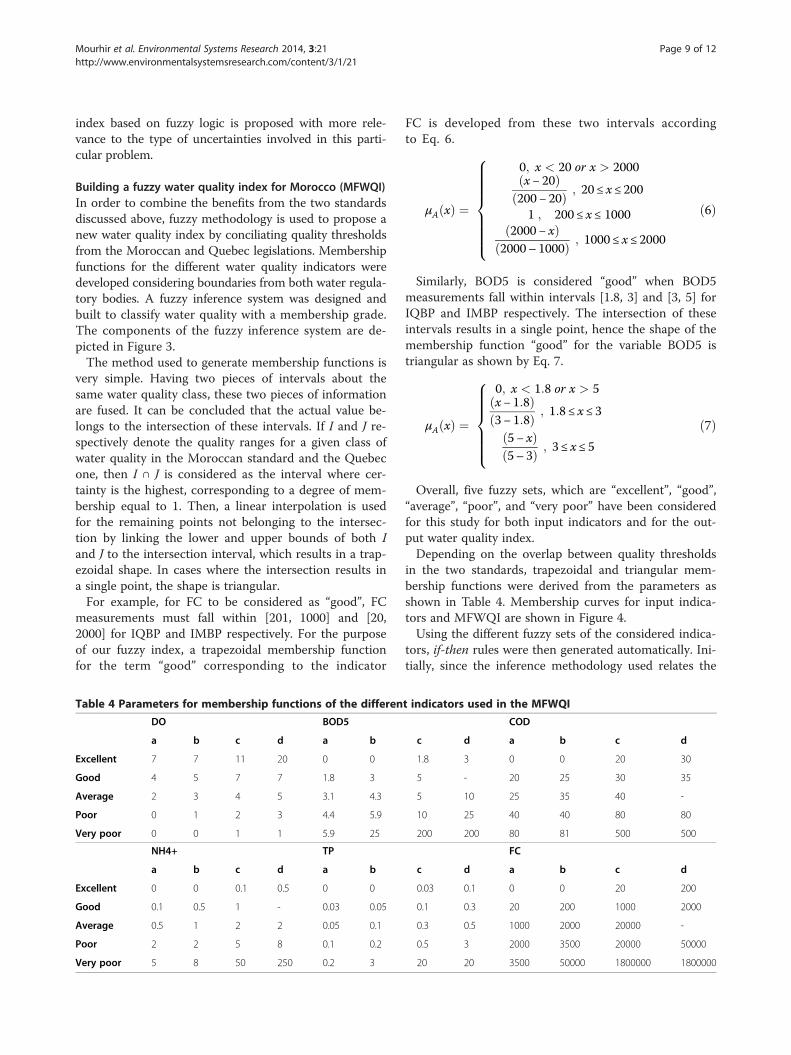
Table 4 Parameters for membership functions of the differen
DO BOD5
a b c d a b
Excellent 7 7 11 20 0 0
Good 4 5 7 7 1.8 3
Average 2 3 4 5 3.1 4.3
Poor 0 1 2 3 4.4 5.9
Very poor 0 0 1 1 5.9 25
NH4+ TP
a b c d a b
Excellent 0 0 0.1 0.5 0 0
Good 0.1 0.5 1 - 0.03 0.05
Average 0.5 1 2 2 0.05 0.1
Poor 2 2 5 8 0.1 0.2
Very poor 5 8 50 250 0.2 3
FC is developed from these two intervals accordingto Eq. 6.
μA xð Þ ¼
0; x < 20 or x > 2000x− 20ð Þ
200− 20ð Þ ; 20 ≤ x ≤ 200
1 ; 200 ≤ x ≤ 10002000− xð Þ
2000– 1000ð Þ ; 1000 ≤ x ≤ 2000
8>>>>>>><>>>>>>>:
ð6Þ
Similarly, BOD5 is considered “good” when BOD5measurements fall within intervals [1.8, 3] and [3, 5] forIQBP and IMBP respectively. The intersection of theseintervals results in a single point, hence the shape of themembership function “good” for the variable BOD5 istriangular as shown by Eq. 7.
μA xð Þ ¼
0; x < 1:8 or x > 5x− 1:8ð Þ3− 1:8ð Þ ; 1:8 ≤ x ≤ 3
5− xð Þ5– 3ð Þ ; 3≤ x≤ 5
8>>>>><>>>>>:
ð7Þ
Overall, five fuzzy sets, which are “excellent”, “good”,“average”, “poor”, and “very poor” have been consideredfor this study for both input indicators and for the out-put water quality index.Depending on the overlap between quality thresholds
in the two standards, trapezoidal and triangular mem-bership functions were derived from the parameters asshown in Table 4. Membership curves for input indica-tors and MFWQI are shown in Figure 4.Using the different fuzzy sets of the considered indica-
tors, if-then rules were then generated automatically. Ini-tially, since the inference methodology used relates the
t indicators used in the MFWQI
COD
c d a b c d
1.8 3 0 0 20 30
5 - 20 25 30 35
5 10 25 35 40 -
10 25 40 40 80 80
200 200 80 81 500 500
FC
c d a b c d
0.03 0.1 0 0 20 200
0.1 0.3 20 200 1000 2000
0.3 0.5 1000 2000 20000 -
0.5 3 2000 3500 20000 50000
20 20 3500 50000 1800000 1800000
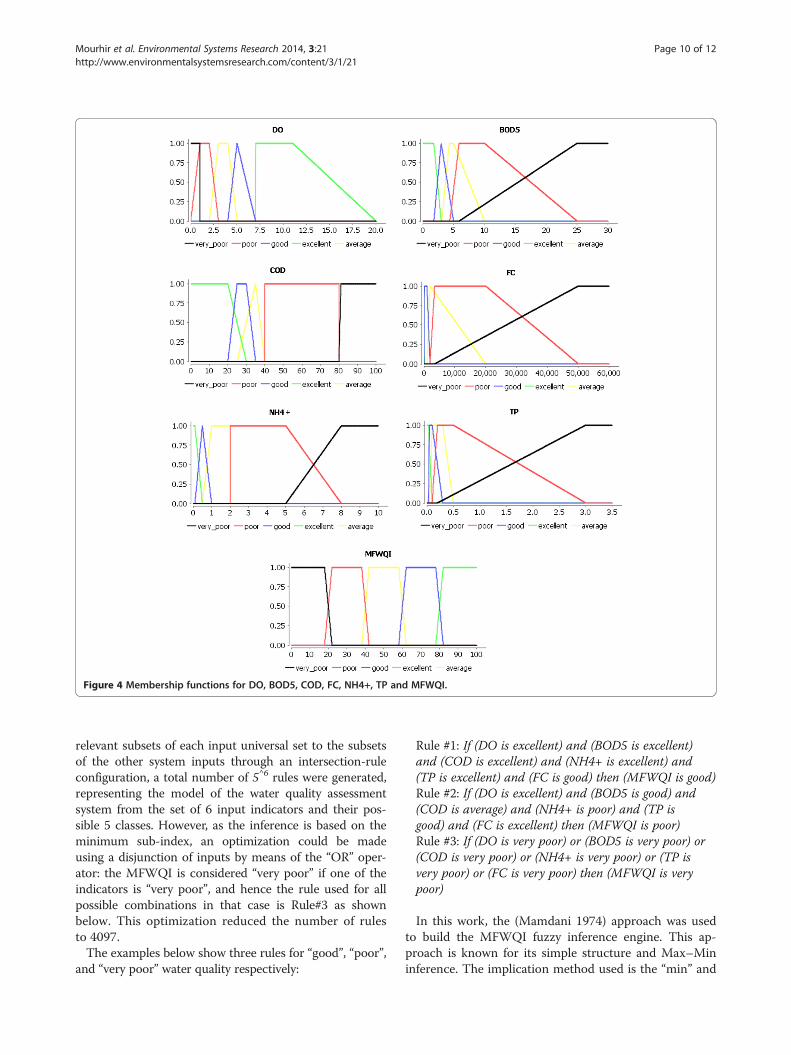
Figure 4 Membership functions for DO, BOD5, COD, FC, NH4+, TP and MFWQI.
Mourhir et al. Environmental Systems Research 2014, 3:21 Page 10 of 12http://www.environmentalsystemsresearch.com/content/3/1/21
relevant subsets of each input universal set to the subsetsof the other system inputs through an intersection-ruleconfiguration, a total number of 5^6 rules were generated,representing the model of the water quality assessmentsystem from the set of 6 input indicators and their pos-sible 5 classes. However, as the inference is based on theminimum sub-index, an optimization could be madeusing a disjunction of inputs by means of the “OR” oper-ator: the MFWQI is considered “very poor” if one of theindicators is “very poor”, and hence the rule used for allpossible combinations in that case is Rule#3 as shownbelow. This optimization reduced the number of rulesto 4097.The examples below show three rules for “good”, “poor”,
and “very poor” water quality respectively:
Rule #1: If (DO is excellent) and (BOD5 is excellent)and (COD is excellent) and (NH4+ is excellent) and(TP is excellent) and (FC is good) then (MFWQI is good)Rule #2: If (DO is excellent) and (BOD5 is good) and(COD is average) and (NH4+ is poor) and (TP isgood) and (FC is excellent) then (MFWQI is poor)Rule #3: If (DO is very poor) or (BOD5 is very poor) or(COD is very poor) or (NH4+ is very poor) or (TP isvery poor) or (FC is very poor) then (MFWQI is verypoor)
In this work, the (Mamdani 1974) approach was usedto build the MFWQI fuzzy inference engine. This ap-proach is known for its simple structure and Max–Mininference. The implication method used is the “min” and
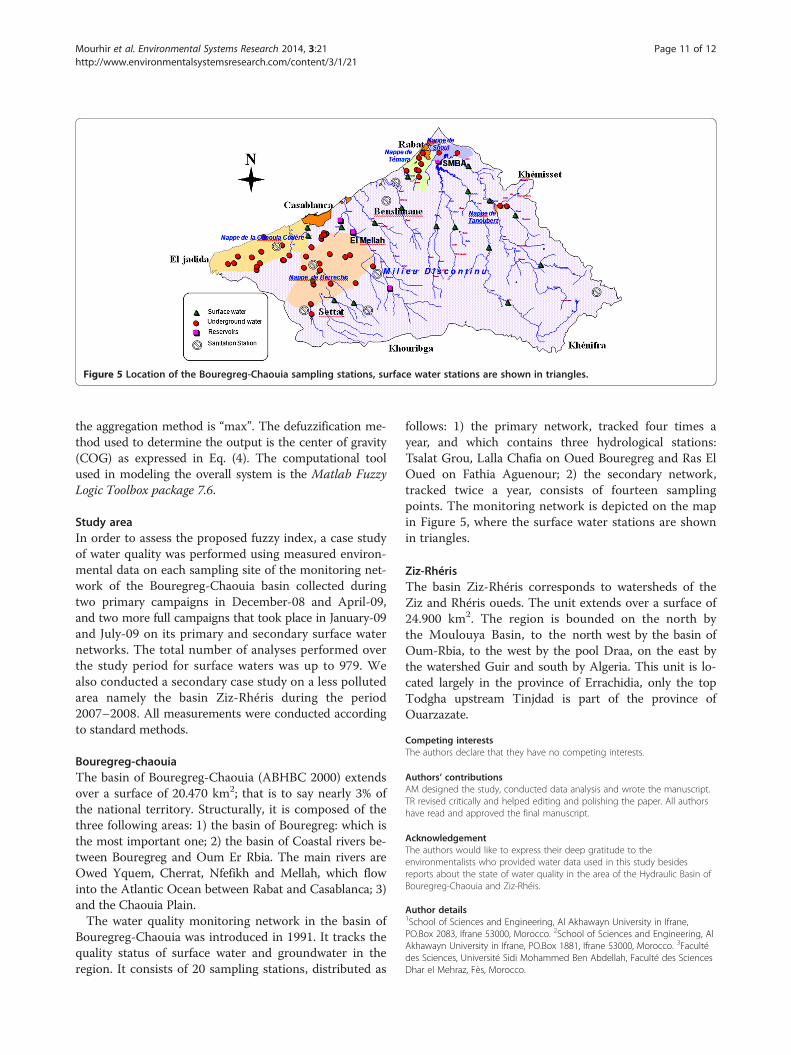
Figure 5 Location of the Bouregreg-Chaouia sampling stations, surface water stations are shown in triangles.
Mourhir et al. Environmental Systems Research 2014, 3:21 Page 11 of 12http://www.environmentalsystemsresearch.com/content/3/1/21
the aggregation method is “max”. The defuzzification me-thod used to determine the output is the center of gravity(COG) as expressed in Eq. (4). The computational toolused in modeling the overall system is the Matlab FuzzyLogic Toolbox package 7.6.
Study areaIn order to assess the proposed fuzzy index, a case studyof water quality was performed using measured environ-mental data on each sampling site of the monitoring net-work of the Bouregreg-Chaouia basin collected duringtwo primary campaigns in December-08 and April-09,and two more full campaigns that took place in January-09and July-09 on its primary and secondary surface waternetworks. The total number of analyses performed overthe study period for surface waters was up to 979. Wealso conducted a secondary case study on a less pollutedarea namely the basin Ziz-Rhéris during the period2007–2008. All measurements were conducted accordingto standard methods.
Bouregreg-chaouiaThe basin of Bouregreg-Chaouia (ABHBC 2000) extendsover a surface of 20.470 km2; that is to say nearly 3% ofthe national territory. Structurally, it is composed of thethree following areas: 1) the basin of Bouregreg: which isthe most important one; 2) the basin of Coastal rivers be-tween Bouregreg and Oum Er Rbia. The main rivers areOwed Yquem, Cherrat, Nfefikh and Mellah, which flowinto the Atlantic Ocean between Rabat and Casablanca; 3)and the Chaouia Plain.The water quality monitoring network in the basin of
Bouregreg-Chaouia was introduced in 1991. It tracks thequality status of surface water and groundwater in theregion. It consists of 20 sampling stations, distributed as
follows: 1) the primary network, tracked four times ayear, and which contains three hydrological stations:Tsalat Grou, Lalla Chafia on Oued Bouregreg and Ras ElOued on Fathia Aguenour; 2) the secondary network,tracked twice a year, consists of fourteen samplingpoints. The monitoring network is depicted on the mapin Figure 5, where the surface water stations are shownin triangles.
Ziz-RhérisThe basin Ziz-Rhéris corresponds to watersheds of theZiz and Rhéris oueds. The unit extends over a surface of24.900 km2. The region is bounded on the north bythe Moulouya Basin, to the north west by the basin ofOum-Rbia, to the west by the pool Draa, on the east bythe watershed Guir and south by Algeria. This unit is lo-cated largely in the province of Errachidia, only the topTodgha upstream Tinjdad is part of the province ofOuarzazate.
Competing interestsThe authors declare that they have no competing interests.
Authors’ contributionsAM designed the study, conducted data analysis and wrote the manuscript.TR revised critically and helped editing and polishing the paper. All authorshave read and approved the final manuscript.
AcknowledgementThe authors would like to express their deep gratitude to theenvironmentalists who provided water data used in this study besidesreports about the state of water quality in the area of the Hydraulic Basin ofBouregreg-Chaouia and Ziz-Rhéis.
Author details1School of Sciences and Engineering, Al Akhawayn University in Ifrane,PO.Box 2083, Ifrane 53000, Morocco. 2School of Sciences and Engineering, AlAkhawayn University in Ifrane, PO.Box 1881, Ifrane 53000, Morocco. 3Facultédes Sciences, Université Sidi Mohammed Ben Abdellah, Faculté des SciencesDhar el Mehraz, Fès, Morocco.
Mourhir et al. Environmental Systems Research 2014, 3:21 Page 12 of 12http://www.environmentalsystemsresearch.com/content/3/1/21
Received: 2 April 2014 Accepted: 29 June 2014Published: 26 July 2014
ReferencesABHBC (2000) Agence du Bassin Hydraulique du Bouregreg et de la Chaouia.,
http://www.abhbc.com/index.php/bassin/la-zone-daction-de-lagence.Accessed 08 July 2012
Borja Á, Galparsoro I, Solaun O, Muxika I, Tello EM, Uriarte A, Valencia V (2006)The European Water Framework Directive and the DPSIR, a methodologicalapproach to assess the risk of failing to achieve good ecological status.Estuar Coast Shelf Sci 66(1–2):84–96
Chang N-B, Chen HW, Ning SK (2001) Identification of river water qualityusing the Fuzzy Synthetic Evaluation approach. J Environ Manage63(3):293–305
Gharibi H, Mahvi AH, Nabizadeh R, Arabalibeik H, Yunesian M, Sowlat MH (2012)A novel approach in water quality assessment based on fuzzy logic.J Environ Manage 112:87–95
Hébert S (1997) Développement d’un indice de la qualité bactériologique etphysico-chimique de l’eau pour les rivières du Québec, Québec. Ministère del’Environnement et de la Faune, Direction des écosystèmes aquatiques,Quebec
Icaga Y (2007) Fuzzy evaluation of water quality classification. Ecol Indic7(3):710–718
Lermontov A, Yokoyama L, Lermontov M, Machado MAS (2009) River qualityanalysis using fuzzy water quality index: Ribeira do Iguape river watershed,Brazil. Ecol Indic 9(6):1188–1197
Linstone HA, Turoff M (1975) The Delphi method: techniques and applications.Addison-Wesley Pub. Co., Advanced Book Program, Boston, USA
Liou S-M, Lo S-L, Hu C-Y (2003) Application of two-stage fuzzy set theory to riverquality evaluation in Taiwan. Water Res 37(6):1406–1416
Lu RS, Lo SL, Hu JY (1999) Analysis of reservoir water quality using fuzzy syntheticevaluation. Stoch Env Res Risk A 13(5):327–336
Mahapatra SS, Nanda SK, Panigrahy BK (2011) A Cascaded Fuzzy InferenceSystem for Indian river water quality prediction. Adv Eng Softw42(10):787–796
Mamdani EH (1974) Application of fuzzy algorithms for control of simpledynamic plant. Proc Inst Elec Eng 121:1585–1588
Nasiri F, Maqsood I, Huang G, Fuller N (2007) Water Quality Index: A FuzzyRiver-Pollution Decision Support Expert System. J Water Resour PlannManag 133(2):95–105, doi:10.1061/(ASCE)0733-9496(2007)133:2(95)
Nikoo M, Kerachian R, Malakpour-Estalaki S, Bashi-Azghadi S, Azimi-GhadikolaeeM (2011) A probabilistic water quality index for river water qualityassessment: a case study. Environ Monit Assess 181(1–4):465–478,doi:10.1007/s10661-010-1842-4
Ocampo-Duque W, Ferré-Huguet N, Domingo JL, Schuhmacher M (2006)Assessing water quality in rivers with fuzzy inference systems: A case study.Environ Int 32(6):733–742
Ocampo-Duque W, Osorio C, Piamba C, Schuhmacher M, Domingo JL (2013)Water quality analysis in rivers with non-parametric probability distributionsand fuzzy inference systems: Application to the Cauca River, Colombia.Environ Int 52:17–28
Ross TJ (1995) Fuzzy Logic with Engineering Applications. McGraw-Hill, New York,USA
Roveda SRMM, Bondança APM, Silva JGS, Roveda JAF, Rosa AH (2010)Development of a water quality index using a fuzzy logic: A case study forthe Sorocaba river. In: 2010 IEEE International Conference on Fuzzy Systems(FUZZ)
Sadiq R, Tesfamariam S (2008) Developing environmental indices using fuzzynumbers ordered weighted averaging (FN-OWA) operators. Stoch EnvironRes Risk Assess 22(4):495–505, 10.1007/s00477-007-0151-0
Shen G, Lu Y, Wang M, Sun Y (2005) Status and fuzzy comprehensive assessmentof combined heavy metal and organo-chlorine pesticide pollution in theTaihu Lake region of China. J Environ Manage 76(4):355–362
Shepard RB (2005) Quantifying Environmental Impact Assessments Using FuzzyLogic. Springer, USA
Silvert W (1997) Ecological impact classification with fuzzy sets. Ecol Model96(1–3):1–10
Silvert W (2000) Fuzzy indices of environmental conditions. Ecol Model130(1–3):111–119
Smith DG (1990) A better water quality indexing system for rivers and streams.Water Res 24(10):1237–1244
Wang Y, Sheng D, Wang D, Ma H, Wu J, Xu F (2014) Variable fuzzy set theory toassess water quality of the meiliang bay in taihu lake basin. Water ResourManag 28(3):867–880
Zadeh LA (1965) Fuzzy sets. Inform Control 8:338–353
doi:10.1186/s40068-014-0021-yCite this article as: Mourhir et al.: River water quality index for Moroccousing a fuzzy inference system. Environmental Systems Research 2014 3:21.
Submit your manuscript to a journal and benefi t from:
7 Convenient online submission
7 Rigorous peer review
7 Immediate publication on acceptance
7 Open access: articles freely available online
7 High visibility within the fi eld
7 Retaining the copyright to your article
Submit your next manuscript at 7 springeropen.com