river humber gas pipeline replacement project · river humber gas pipeline replacement project ......
TRANSCRIPT

7.4
Need Case
River Humber Gas Pipeline Replacement Project
Under Regulation 5(2)(q) of the Infrastructure Planning (Applications: Prescribed Forms and Procedure) Regulations 2009
D O
C U
M E
N T
Application Reference: EN060004
April 2015
River Humber Gas Pipeline Replacement
Project
Need Case
Rev F 26 March 2015
National Grid
National Grid House
Warwick Technology Park
Gallows Hill
Warwick
CV34 6DA

2 of 19
Table of Contents
1.0 Introduction ......................................................................................... 3
2.0 Background ......................................................................................... 5
3.0 The Licence and Legislative Framework ...................................................... 6
4.0 Replacing the Existing River Humber Pipeline ............................................... 8
5.0 Need Identified in the National Policy Statements ......................................... 12
Glossary of Terms ........................................................................................ 15
Appendix A – Geographic View of the National Transmission System .......................... 18
Appendix B – report completed by Associated British Ports, Marine Environmental Research
(ABP Mer 2010) ........................................................................................... 19
3 of 19
1.0 Introduction
1.1 This document, produced by National Grid Gas plc (referred to in this
report as “National Grid”), has been prepared to inform statutory
consultees and other stakeholders of the need to replace the existing
gas pipeline crossing underneath the Humber estuary to ensure National
Grid complies with its licence requirements, in particular its safety
obligations.
1.2 Coverage over the existing River Humber gas pipeline (known as Feeder
09) had been deteriorating between 2009 and 2013. National Grid has
successfully completed remedial works, however, the remedial work is
only considered to be a relatively short term (up to 10 years) solution as
per the report completed by Associated British Ports, Marine
Environmental Research (ABP Mer 2010) (Appendix B).
1.3 The structure of the document is as follows: Section 2 describes, as
background, the structure of the gas market and National Grid’s role;
Section 3 explains the legislative and licence framework which National
Grid operates; and Section 4 describes the issues pertinent to the gas
pipeline replacement project and section 5 discusses the need for this
type of infrastructure as identified in the NPS. Appendix A gives a
glossary of terms and an overview of the gas NTS.
1.4 This document does not cover the strategic options considered, how the
preferred option shall be achieved, nor the costs of the route corridor
associated with any of the options. These aspects are covered
separately in documents and other information regarding the River
Humber Gas Pipeline Replacement Project (the “Project”) and can be
found on the National Grid website at:
https://www.nationalgrid.com/uk/Gas/Pipelines/riverhumberpipeline
Number 9 Feeder Replacement Project - Final Strategic Options
Report; October 2012

4 of 19
Number 9 Feeder Replacement Project – Final Route Corridor
Study; May 2013
1.5 This document is also not concerned with decommissioning of the
existing Feeder No 01 transmission pipeline, which is located above
proposed route of the Project. Feeder No 01 has been decommissioned
and does not form part of this Project. Any works associated with the
existing Feeder No 1, or any removal of the existing Feeder No 09
pipeline, will be assessed and consented separately to this Project.

5 of 19
2.0 Background
2.1 A single gas market serves the whole of Great Britain. In this
competitive, wholesale market shippers and traders trade gas on a
daily basis. Gas is supplied from a variety of sources, including the
UK Continental Shelf, Norway, LNG Imports, European
Interconnectors and storage. Suppliers purchase gas in the
wholesale market and supply to end customers. The NTS transports
bulk supplies of gas from entry terminals to demand centres.
National Grid is the owner and operator of the NTS for Great Britain.
2.2 The development of National Grid’s NTS began in the 1960s.
Incremental changes to the transmission system have subsequently
been made to meet increasing customer demand and to connect new
supply sources and interconnectors1 with other transmission systems.
2.3 The NTS consists of approximately 7600 km of pipelines and 69
compressor units at 22 compressor stations, operating at up to 94
barg. These pipelines connect 18 entry points and 117 offtakes to
distribution networks, transmission-connected demand customers
(e.g. large industrial customers), storage facilities and
interconnectors.
2.4 The forecast peak gas demand in Great Britain is over 570 mcm/d
and occurs during winter months, typically December and January.
The combined capacity of all the Aggregate System Entry Points
connected to and/or using the NTS is greater than this peak demand.
The River Humber Gas Pipeline is a pivotal pipeline to manage the
peak demand.

6 of 19
3.0 The Licence and Legislative Framework
3.1 Transmission of gas is a licensable activity in Great Britain under the
Gas Act. These licences are granted and administered by the Gas and
Electricity Markets Authority (”the Authority”), established by the
Utilities Act 2000.
3.2 Section 9 of the Gas Act states a Gas Transporter has general duties in
the planning and development of their system, which include the duty
to develop and maintain an efficient and economical pipe-line system
for the conveyance of gas.
3.3 National Grid is bound by the terms of its Gas Transporter Licence
(“the Licence”) in respect of the NTS. This contains a number of
Conditions that National Grid must comply with in developing and
operating the network and in conducting its transportation business.
The Licence obligations that are relevant to the planning and
development of the NTS are described below.
3.4 Standard Special Condition A9: Pipeline System Security
Standards - This condition sets out the security standard for the NTS.
It requires that National Grid NTS plan the system to meet the 1-in-20
peak aggregate daily demand, including but not limited to, within day
gas flow variations on that day. The condition states that the 1-in-20
peak demand level should be calculated to include the load reduction
through interruption or for contractual reasons and requires that
historic data from at least the 50 previous years should be used when
identifying the 1-in-20 peak day.
3.5 Special Condition C2: Long Term Development Statement - Under
this obligation, National Grid NTS must publish an annual Long Term
Development Statement for the NTS that sets out the likely use of the
NTS, and the likely developments of the NTS, any other facilities or
pipeline systems that may affect the connection charging and

7 of 19
transportation charging arrangements over the next ten years. National
Grid NTS publishes the Ten Year Statement (TYS) each year in
accordance with this condition and the Uniform Network Code
Transportation Principal Document (UNC TPD) Section O after
consultation with the gas industry through the Transporting Britain’s
Energy process.
3.6 The River Humber pipeline is fundamental to National Grid ensuring it
can meet its Licence Conditions and obligations.

8 of 19
4.0 Replacing the Existing River Humber Pipeline
4.1 The existing River Humber gas pipeline crossing, although a short
section of pipeline, regularly transports between 70mcm/d and
100mcm/d of gas. It is a key pipeline on the NTS. Whilst the recent
Trans-Pennine link has helped direct some of the new supplies in the
Easington area to the west coast, the Humber gas pipeline crossing
remains the highest throughput single pipeline section on the NTS.
4.2 The existing River Humber gas pipeline crossing was laid and
commissioned in 1984 by dredging a channel approximately 30m wide
and 4m deep then pulling the pipe across the estuary. Backfilling of the
trench was via the natural process of tidal flows within the estuary, with
some additional clay backfill close to the northern shore.
4.3 The riverbed in the Humber Estuary is extremely mobile with strong
tidal currents of up to four knots across the existing River Humber gas
pipeline. The estuary handles 20% of the UK’s rainwater runoff via the
River Trent and River Ouse. The pipeline crossing, therefore, requires
close monitoring by means of a comprehensive survey, including depth
of burial and the condition of the riverbed. Annual surveys have been
completed as far back as the 1980s.
4.4 Surveys in 2008 had shown that the depth of the sediment above the
existing pipeline had deteriorated. In view of this, the frequency of the
surveys was subsequently increased.
4.5 In August 2010 National Grid commissioned Associated British Ports,
Marine Environmental Research (ABP Mer) to carry out a detailed
assessment of the condition of the pipeline and review the options
available for remedial work (the “ABP Mer Report”). The ABP Mer
Report is attached at Appendix B.
9 of 19
4.6 The ABP Mer Report found that:
4.6.1 the depths within the main channel where the pipeline is
laid have been shown to vary by several metres over time
and bed levels were up to 4m higher at the time of
construction (section 3.4);
4.6.2 there is an 80-year cycle of morphological change within
the estuary and due to the potential for increased accretion
the situation for the pipeline could improve again by 2040,
but only after several more years of further erosional stress
(section 3.2.1);
4.6.3 to safeguard the structural integrity of the pipeline ongoing
monitoring, maintenance and remedial work would be
required for the next 30 years (section 3.2.3);
4.7 Five options for mitigation measures were analysed, with the below
conclusions:
4.7.1 Do nothing – estimates of the cyclical nature of the
morphology of the river bed returning to sufficiently shallow
levels by 2040 are inherently uncertain, and if the peak of
the cycle has yet to be reached and the channel continues
to extend or deepen this would lead to increased exposure
of the pipe, or sections ‘free-spanning’ or suspended
across the bed;
4.7.2 Rock-dumping – this is a localised method involving
dumping rock on ‘at risk’ sections. National Grid’s
agreement with the Harbour Master also requires that it be
naturally dispersive. While of some benefit, monitoring of
this method at the nearby Feeder 1 pipeline indicate that
protected areas will be ‘outlfanked’ by erosion at non-

10 of 19
protected points, and the type of rock that can be utilised
will disperse under the flow conditions in the channel;
4.7.3 Rock-filled bags – placing bags filled with course gravel-
sized rock has been shown to afford initial short-term
protection (up to five years), but over time the bags
become displaced or break open under natural flow
conditions and is unlikely to be suitable for long-term full-
length protection;
4.7.4 Concrete frond mattresses – this involves laying
mattresses with buoyant fronds attached to slow the flow
near the bed and keep solids suspended for longer, giving
them time to settle out more evenly. It is uncertain how
effective this method would be in a highly dynamic
environment such as this and there is potential for the
fronds and mats to become unsecured or detached.
4.7.5 Rock-filled bags overlaid with concrete frond mattresses –
this combination of the two methods above is designed to
offer the advantage of the protection of the rock-filled bags
should the frond break free from the mattresses. This
option was found to offer the longest term of protection (at
least a 10-year period), together with continual monitoring
and surveys (section 7 of the ABP Mer Report).
4.8 From November 2010 to December 2011 remediation works were
carried out using gravel-filled bags and frond mattresses laid over and
either side of the existing pipeline to protect it from further erosion.
Surveys in January 2012 confirmed the remediation work was proving
to be successful with the frond mattresses encouraging sand and silt to
settle.

11 of 19
4.9 From September 2013 to November 2013 a second smaller
remediation work was undertaken utilising the same technique. This
work was carried out in a specific area to stem further erosion
highlighted over the earlier completed remediation works.
4.10 However, this method of remedial work is only likely to be effective up
until about 2020, per the findings of the ABP Mer Report.
4.11 If, due to the seabed erosion, the pipeline failed and had to be isolated
(valved off) to ensure a pipeline failure did not occur, this would cause
significant constraints in the NTS during peak demand and would
involve the curtailment of supplies as National Grid’s 1-in-20 licence
obligation could not be met.
4.12 Network analysis demonstrates additional transmission infrastructure
will be needed to replace the Humber Estuary pipeline crossing to meet
National Grid’s 1-in-20 licence obligation.
4.13 The unavailability of the River Humber pipeline crossing and the
associated capacity constraints imposed could subject National Grid to
entry buyback costs of hundreds of millions per year. Whilst National
Grid’s exposure under this incentive is limited; the rest would be borne
by the gas shipper community and there would potentially be significant
reputational and other consequences for National Grid. It is also likely
the constraints imposed on the system would require the curtailing of
firm loads during high winter demands (a breach of National Grid’s 1:20
Licence condition).

12 of 19
5.0 Need Identified in the National Policy Statements
5.1 The Overarching NPS for Energy (EN-1) explicitly recognises that the
“UK is highly dependent on natural gas” and that “gas will continue to
play an important part in the UK’s fuel mix for many years to come” (-1
para 3.8.1). As set out above the River Humber Gas Pipeline is a key
pipeline in the NTS for ensuring National Grid can continue to meet its
licence obligations and ensure stable and secure continuity of supply to
the national market.
5.2 It is therefore relevant to the consideration of need to note that EN-1
states that "Great Britain’s gas supply infrastructure must, amongst
other things, be sufficient to:
● meet ‘peak’ demand. This is a much more demanding requirement
than meeting annual demand. Gas market participants may aim to
have some “redundancy” in their supply arrangements, above the
minimum amount to meet peaks, to manage the risk that other capacity
may not be available (for example, if undergoing maintenance);
● allow for a sustained delivery of large volumes of gas, for example,
due to the need to be prepared to meet demand over a particularly cold
winter;" (paragraph 3.8.5)”.
5.3 EN-1 goes on: "Great Britain needs a diverse mix of gas storage and
supply infrastructure (including gas import pipelines and terminals) to
respond effectively in future to the large daily and seasonal changes in
demand, and to provide endurance capacity during a cold winter."
(paragraph 3.8.7)
5.4 NPS for Gas Supply Infrastructure and Gas and Oil Pipelines (EN-4)
also recognises that “The efficient import, storage and transmission of

13 of 19
natural gas and oil products is crucial to meeting our energy needs
during the transition to a low carbon economy. We cannot achieve
national objectives relating to security of supply without enabling
investment in new infrastructure” (paragraph 1.1.1).

14 of 19
6.0 Conclusion
Should the existing River Humber gas pipeline crossing need to be taken
out of service, entry capacity from the Easington area (including
Norwegian imports and current UK storage) would be reduced to less
than 50% of current levels south of the Humber Estuary resulting in the
need to curtail supplies in this location during a significant proportion of
the year. Alternative supplies would be required in the south to alleviate
the north to south capacity constraint imposed. The knock-on effect to
downstream pressures is likely to impact on the ability to maintain
existing connected loads to the south, with the risk of curtailing demand
under winter demand conditions. It is unlikely the ongoing security of the
system could be maintained across winter demand levels without the
curtailment of demand through third party supplies being turned off.
There is therefore a very clear need for the Scheme to be granted
development consent and then to be implemented as soon as possible.

15 of 19
Glossary of Terms
Aggregate System Entry Point - A term used to refer to a gas supply
terminal or group of gas supply terminals for which NTS Entry Capacity is
sold.
Bar - The unit of pressure that is approximately equal to atmospheric pressure
(0.987 standard atmospheres). Where bar is suffixed with the letter g, such as
in barg or mbarg, the pressure being referred to is gauge pressure, i.e. relative
to atmospheric pressure. One millibar (mbarg) equals 0.001 bar.
Compressor Station - An installation that uses gas turbine or electricity
driven compressors to boost pressures in the pipeline system. Used to
increase transmission capacity and move gas through the network.
Cubic Metre (m3) - The unit of volume, expressed under standard conditions
of temperature and pressure, approximately equal to 35.37 cubic feet. One
million cubic metres (mcm) are equal to 106 cubic metres, one billion cubic
metres (bcm) equals 109 cubic metres.
Gas Transporter (GT) - Formerly Public Gas Transporter (PGT). GTs, such
as National Grid, are licensed by the Gas and Electricity Markets Authority to
transport gas to consumers.
Interconnector - A pipeline transporting gas to another country. The Irish
Interconnector transports gas across the Irish Sea to both the Republic of
Ireland and Northern Ireland. The Belgian Interconnector transports gas
between Bacton and Zeebrugge. The Belgian Interconnector is capable of
flowing gas in either direction. The Dutch Interconnector (BBL) transports gas
between Balgzand in the Netherlands and Bacton. It is currently capable of
flowing only from the Netherlands to the UK.

16 of 19
Investment – an investment to overcome a system constraint is the building
of additional infrastructure or modification of existing infrastructure such as a
reinforcement pipeline or modification of a compressor.
Liquefied Natural Gas (LNG) - Gas stored and / or transported in liquid form.
National Transmission System (NTS) - A high-pressure system consisting
of terminals, compressor stations, pipeline systems and offtakes. Designed to
operate at pressures up to 94 barg. NTS pipelines transport gas from
terminals to NTS offtakes.
National Transmission System Offtake - An installation defining the
boundary between NTS and LTS or a very large consumer. The offtake
installation includes equipment for metering, pressure regulation, etc.
NPS – National Policy Statement
Office of Gas and Electricity Markets (Ofgem) - The regulatory agency
responsible for regulating Great Britain’s gas and electricity markets.
Peak Day Demand (1 in 20 Peak Demand) - The 1 in 20 peak day demand
is the level of demand that, in a long series of winters, with connected load
held at the levels appropriate to the winter in question, would be exceeded in
one out of 20 winters, with each winter counted only once.
Shipper or Uniform Network Code (Shipper) User - A company with a
Shipper Licence that is able to buy gas from a producer, sell it to a supplier
and employ a GT to transport gas to consumers.
Supplier - A company with a Supplier’s Licence contracts with a shipper to
buy gas, which is then sold to consumers. A supplier may also be licensed as
a shipper.
TYS - Ten Year Statement

17 of 19
Uniform Network Code (UNC) - The Uniform Network Code replaced the
Network Code and, as well as covering the arrangements within the Network
Code, covers the arrangements between National Grid Transmission and the
Distribution Network Operators.

18 of 19
Appendix A – Geographic View of the National Transmission System
River Humber
Pipeline Location

19 of 19
Appendix B – report completed by Associated British Ports, Marine
Environmental Research (ABP Mer 2010)

Ò¿¬·±²¿´ Ù®·¼ д½
з°»´·²» ͽ±«® ß»³»²¬òÒ±ò ç Ù¿ Ú»»¼»®ôØ«³¾»® Û¬«¿®§
Ü¿¬»æ ß«¹«¬ îðïð
Ю±¶»½¬ λºæ Îñíçîìñï
λ°±®¬ Ò±æ Îòïêëë


з°»´·²» ͽ±«® ß»³»²¬òÒ±ò ç Ù¿ Ú»»¼»®ô Ø«³¾»® Û¬«¿®§
Îñíçîìñï ø·÷ Îòïêëë
Í«³³¿®§
As a consequence of natural processes which have caused deepening of the main channel in the reachbetween North Killingholme and Hull, the No.9 Gas Feeder Pipeline has recently become exposed.Whilst local scour processes could result in sections of the pipeline becoming unsupported (free-spanning), as previously experienced with the No.1 Gas Feeder, this must be considered in the widercontext of morphological changes occurring within the estuary. A detailed assessment, including areview of historic changes in estuary morphology, has therefore been undertaken using a range ofavailable data. Using this approach it has been possible to identify possible cycles of change although itis acknowledged that there is a high degree of uncertainty associated with such processes due to thelimited availability of data relative to the duration of these cycles.
The key morphological feature of direct significance for the stability of the No.1 and No.9 Gas Feederpipelines is the main channel where depths have been shown to vary by several metres over time. Itwould appear that when the pipelines were installed (between 1973 and 1984), bed levels were up to4m higher than at present. Over the past 10 years there has been progressively increased exposure offirst the No.1 Gas Feeder and more recently the No.9 Gas Feeder has become affected. Thisinvestigation provides evidence of an approximately 80-year cycle of morphological change within thestudy area, between North Killingholme and Hull. Based on this assumption, the situation for thepipelines can be expected to improve by 2040 (i.e. over the next 30 years) due to potential forincreased accretion within the main channel over this period, although several years of further erosionalstress are likely before accretion occurs in the vicinity of the pipeline. To safeguard their structuralintegrity, operational pipelines in the vicinity of the No.9 Gas Feeder would therefore require ongoingmaintenance (remedial works) and monitoring for at least the next 30 years.
Potential mitigation measures (remedial works) for the No.9 Gas Feeder have been considered whichwould be required to provide protection to the pipeline and avoid the potential for free-spanning to occurin the future. The use of rock dumping as remedial works for the No.1 Gas Feeder appears to haveresulted in local changes in bed levels within the estuary. Any wider-scale changes (i.e. at the locationof the No.9 Gas Feeder) resulting from the remedial works are sufficiently small that they cannot bedistinguished from natural changes occurring within the estuary. For the No.9 Gas Feeder, arecommended solution would be the use of rock filled bags overlaid with a concrete frond mattresswhich would act to encourage sediment deposition locally, particularly when the study area enters anaccretionary phase of morphological change. It should be noted that any form of protection would berequired along the entire length of the pipeline within the main channel to avoid the subsequent ‘out-flanking’ which would undoubtedly occur if a piecemeal approach was adopted for only newly exposedsections.
Following any future remedial works, ongoing monitoring will still be required in the future although thefrequency will depend on the method used which may be modified over time (increased or reduced)should repeat surveys identify a change in the rate of erosion or even a switch to accretion. It is alsorecommended that surveys of the local areas prepared by ABP (Associated British Ports) are reviewedon a regular basis with particular focus on monitoring key features such as the shallow area currentlydeveloping on Halton Flat and the secondary channel further to the west. These features appear to bedirectly linked to conditions in the vicinity of the pipelines and can therefore be used as indicators ofpotential future change within the main channel.
з°»´·²» ͽ±«® ß»³»²¬òÒ±ò ç Ù¿ Ú»»¼»®ô Ø«³¾»® Û¬«¿®§
Îñíçîìñï ø··÷ Îòïêëë
з°»´·²» ͽ±«® ß»³»²¬òÒ±ò ç Ù¿ Ú»»¼»®ô Ø«³¾»® Û¬«¿®§
ݱ²¬»²¬Ð¿¹»
Summary .................................................................................................................................................. i
1. Introduction.................................................................................................................................1
2. Methodology ...............................................................................................................................22.1 Task 1 - Assessment of Estuary-wide Bathymetric Change.......................................................22.2 Task 2 - Analysis of Detailed Pipeline Surveys ..........................................................................32.3 Task 3 - Review of Conditions at No.1 Gas Feeder ..................................................................32.4 Task 4 - Review of Mitigation Methods.......................................................................................3
3. Assessment of Estuary-wide Bathymetric Change .....................................................................43.1 Data Presentation.......................................................................................................................43.2 General Trends in the Estuary Morphology ................................................................................5
3.2.1 Deep Water Channel....................................................................................................53.2.2 Skitter Sand and Halton Flat ........................................................................................73.2.3 Historic Change............................................................................................................8
3.3 Updated Analysis from No.1 Gas Feeder Study.........................................................................93.4 Updated Analysis from Chart Study in the Vicinity of North Killingholme .................................103.5 Analysis of Morphological Trends Near the No.9 Gas Feeder .................................................10
4. Analysis of Detailed Pipeline Surveys.......................................................................................12
5. Review of Previous Remedial Works........................................................................................135.1 Conditions at No.1 Gas Feeder ................................................................................................135.2 Downstream Effects .................................................................................................................14
6. Review of Mitigation Methods...................................................................................................146.1 ‘Do Nothing’ Option ..................................................................................................................156.2 Rock Dumping..........................................................................................................................156.3 Rock Filled Bags.......................................................................................................................166.4 Concrete ‘Frond’ Mattresses ....................................................................................................166.5 Rock Filled Bags Overlaid with Concrete ‘Frond’ Mattresses...................................................17
7. Conclusions ..............................................................................................................................18
8. Recommendations....................................................................................................................19
9. References ...............................................................................................................................20
з°»´·²» ͽ±«® ß»³»²¬òÒ±ò ç Ù¿ Ú»»¼»®ô Ø«³¾»® Û¬«¿®§
Îñíçîìñï ø···÷ Îòïêëë
Ú·¹«®»
1. Location Diagram
2. Historic Survey Bathymetry for 1940 to 2009
3. Bathymetric Change (Year on Year Levels)
4. Bathymetric Change (Relative to 1999 levels)
5. Temporal bathymetric change of survey data for Saltend Jetties cross-section
6. Temporal bathymetric change of survey data for cross-section 100m northwest of No.9 GasFeeder
7. Temporal bathymetric change of survey data for CS1 cross section
8. Historic Chart Bathymetry for 1851 to 1936
9. Bank to bank cross-section at Alexandra Dock for 1998 to 2009
10. Bank to bank cross-section at Saltend Jetties for 1998 to 2009
11. Bank to bank cross-sections along No.1 Gas Feeder for 1998 to 2009
12. Bank to bank cross-sections at South East Section for 1998 to 2005
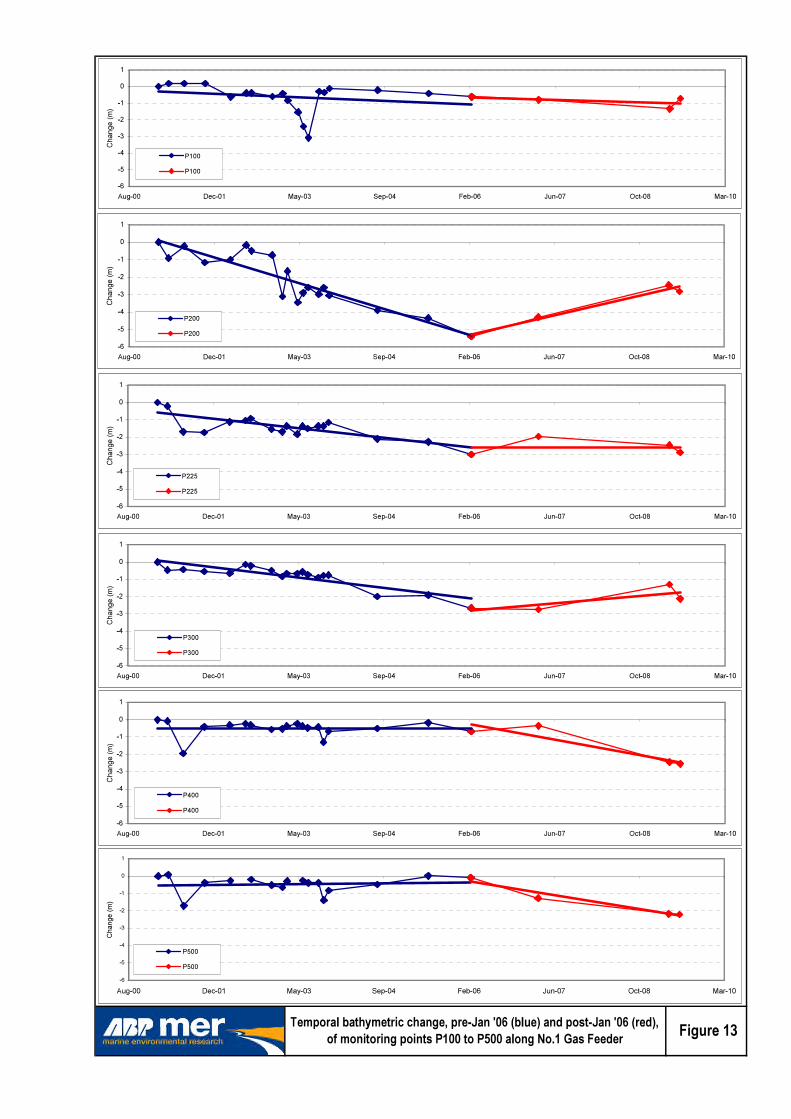
13. Temporal bathymetric change, pre-Jan '06 (blue) and post-Jan '06 (red), of monitoring pointsP100 to P500 along No.1 Gas Feeder
14. Temporal bathymetric change of monitoring points 1 to 4, southeast of No.9 Gas Feeder
15. Temporal bathymetric change, pre-1989 (blue) and post-1989 (red), of monitoring points P9_0to P9_400 along No.9 Gas Feeder
16. Historic variation in location and width of the -12mODN channel, in relation to the exposed No.9Gas Feeder
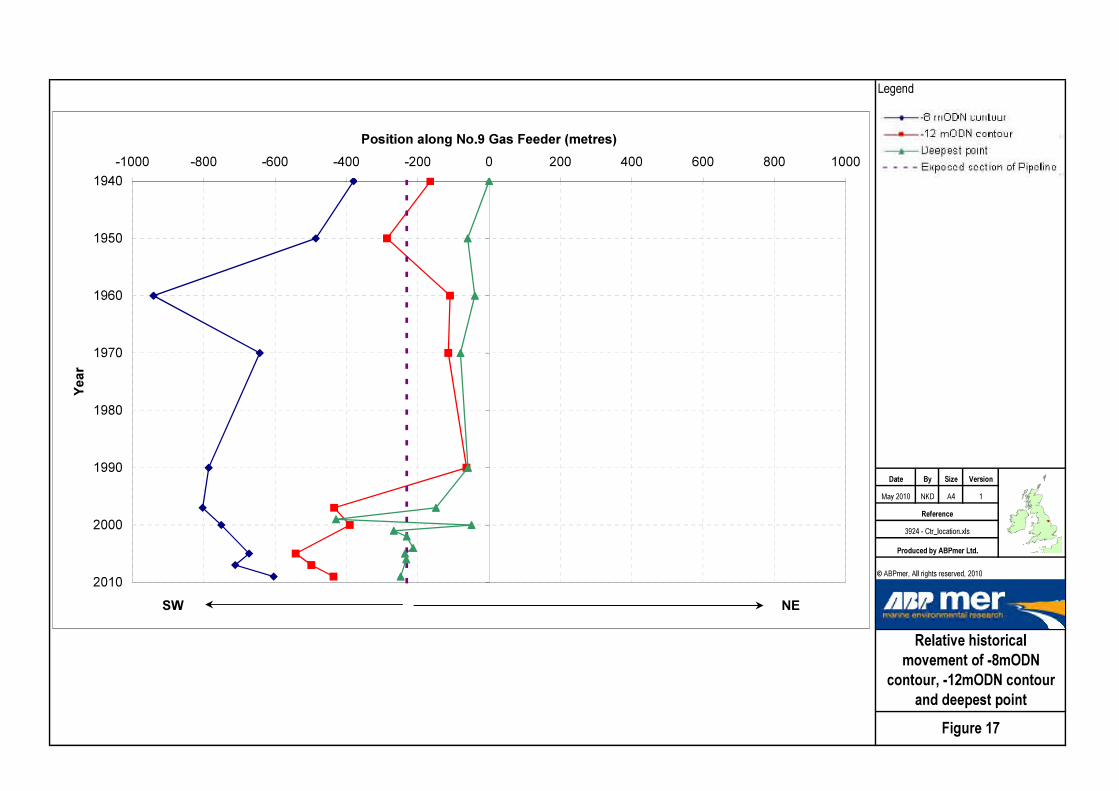
17. Relative historical movement of -8mODN contour, -12mODN contour and deepest point
18. Bathymetric change of No.9 Gas Feeder 'cross pipe' profiles 1976-2009
19. Temporal bathymetric change of the main channel between North Killingholme and Hull

з°»´·²» ͽ±«® ß»³»²¬òÒ±ò ç Ù¿ Ú»»¼»®ô Ø«³¾»® Û¬«¿®§
Îñíçîìñï ï Îòïêëë
ïò ײ¬®±¼«½¬·±²
In the Humber Estuary, three pipelines cross the channel in the area between Paull and SkitterHaven. These pipelines carry gas and condensates and were laid in trenches and back-filledat different times between the mid-1970s and mid-1980s. The pipelines were buried to differentdepths below the surface and to different levels across the estuary section, generallyconforming to the profile of the estuary, with the deepest level below the navigation channelthrough Halton Middle, as it was located at the time of installation.
For a number of years the pipelines remained buried, however, during the late 1990s the upestuary pipeline (No.1 Gas Feeder) became exposed with one section found to be unsupported(free-spanning) within the navigation channel. Remedial works in the form of rock placementover the pipeline in the area of the exposure was therefore undertaken. Subsequent monitoringshowed these remedial works were initially successful although further erosion was identified ateither end of the protection. By about 2003 new areas of exposure and then free-spanning hadbeen identified. Due, in part, to environmental considerations, the previous remedial workswere replaced with rock filled bags. This was also initially successful, but again erosion hassince outflanked these works to such an extent that new areas of free-spanning had occurredby late 2009, causing a significant deflection in the pipeline before it came to rest on thelowered bed. As a result of this movement and the associated concerns relating to thestructural integrity of the pipeline, it has not been in use since.
Recent surveys (EGS, 2010a; EGS, 2010c) have shown that this area of erosion which causedproblems at the No.1 Gas Feeder has extended southwards and is now a concern for the No.9Gas Feeder, the most down estuary of National Grid’s pipelines. The No.9 Gas Feeder is a1.067m diameter concrete coated pipeline that was originally laid in a trench in July 1984,roughly following the bed levels, between Paull and Skitter Haven (see Figure 1 for location).At the deepest section of the estuary a cutter suction dredger was required to cut into the hardclay at three locations along the pipeline.
In late 2009 the No.9 Gas Feeder was showing signs of exposure in the main channel area,which have persisted, as recently identified during the March 2010 survey (EGS, 2010c).National Grid has commissioned ABP Marine Environmental Research Ltd (ABPmer) toundertake a review of the bathymetric changes, both recently and with respect to the longer-term evolution, occurring in this reach of the Humber Estuary between North Killingholme andHull. The aim of this study is to develop a conceptual understanding of the changes (rates,trends or any cycles) that are ongoing or have occurred in the past to assist with the selectionof the most appropriate remedial works for the pipeline. Any recommendations will also need totake account of other estuary users and nature conservation considerations. The followingsection sets out the methodology adopted by ABPmer to achieve these objectives.
з°»´·²» ͽ±«® ß»³»²¬òÒ±ò ç Ù¿ Ú»»¼»®ô Ø«³¾»® Û¬«¿®§
Îñíçîìñï î Îòïêëë
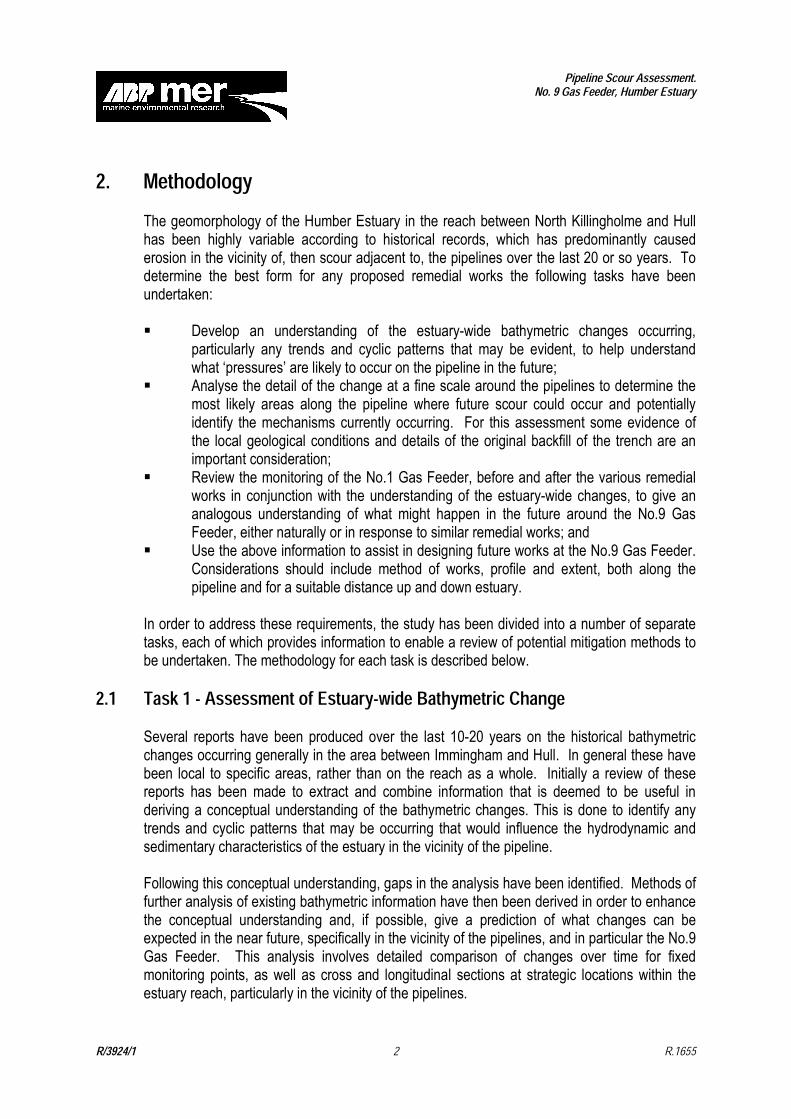
îò Ó»¬¸±¼±´±¹§
The geomorphology of the Humber Estuary in the reach between North Killingholme and Hullhas been highly variable according to historical records, which has predominantly causederosion in the vicinity of, then scour adjacent to, the pipelines over the last 20 or so years. Todetermine the best form for any proposed remedial works the following tasks have beenundertaken:
Develop an understanding of the estuary-wide bathymetric changes occurring,particularly any trends and cyclic patterns that may be evident, to help understandwhat ‘pressures’ are likely to occur on the pipeline in the future;Analyse the detail of the change at a fine scale around the pipelines to determine themost likely areas along the pipeline where future scour could occur and potentiallyidentify the mechanisms currently occurring. For this assessment some evidence ofthe local geological conditions and details of the original backfill of the trench are animportant consideration;Review the monitoring of the No.1 Gas Feeder, before and after the various remedialworks in conjunction with the understanding of the estuary-wide changes, to give ananalogous understanding of what might happen in the future around the No.9 GasFeeder, either naturally or in response to similar remedial works; andUse the above information to assist in designing future works at the No.9 Gas Feeder.Considerations should include method of works, profile and extent, both along thepipeline and for a suitable distance up and down estuary.
In order to address these requirements, the study has been divided into a number of separatetasks, each of which provides information to enable a review of potential mitigation methods tobe undertaken. The methodology for each task is described below.
îòï Ì¿µ ï ó ß»³»²¬ ±º Û¬«¿®§ó©·¼» Þ¿¬¸§³»¬®·½ ݸ¿²¹»
Several reports have been produced over the last 10-20 years on the historical bathymetricchanges occurring generally in the area between Immingham and Hull. In general these havebeen local to specific areas, rather than on the reach as a whole. Initially a review of thesereports has been made to extract and combine information that is deemed to be useful inderiving a conceptual understanding of the bathymetric changes. This is done to identify anytrends and cyclic patterns that may be occurring that would influence the hydrodynamic andsedimentary characteristics of the estuary in the vicinity of the pipeline.
Following this conceptual understanding, gaps in the analysis have been identified. Methods offurther analysis of existing bathymetric information have then been derived in order to enhancethe conceptual understanding and, if possible, give a prediction of what changes can beexpected in the near future, specifically in the vicinity of the pipelines, and in particular the No.9Gas Feeder. This analysis involves detailed comparison of changes over time for fixedmonitoring points, as well as cross and longitudinal sections at strategic locations within theestuary reach, particularly in the vicinity of the pipelines.
з°»´·²» ͽ±«® ß»³»²¬òÒ±ò ç Ù¿ Ú»»¼»®ô Ø«³¾»® Û¬«¿®§
Îñíçîìñï í Îòïêëë
Geographical Information System (GIS) mapping techniques have been used to show thechanges occurring and any special features of importance identified. The main data that havebeen used is a selection of the readily available ABP annual surveys plotted at a scale1:10,000, supplemented by the more detailed, recent swath bathymetry surveys undertaken byEGS International Limited (EGS). The swath bathymetry data was not used directly in thebathymetry comparison due to likely discrepancies with the ABP surveys due to the differenttimes when these would have been undertaken.
îòî Ì¿µ î ó ß²¿´§· ±º Ü»¬¿·´»¼ з°»´·²» Í«®ª»§
Detailed swath bathymetry surveys have been undertaken across the area of the pipelineswithin the main channel section in September 2009 and again in March 2010 (EGS, 2010a and2010c). During the latter survey, sub-bottom profiling was also undertaken using an acousticpinger device along with a magnetometer survey to determine the location and amount ofexposure of the No.9 Gas Feeder. An additional objective of the sub-bottom profile survey wasto try to define the dimensions of the original pipe trench and the material types that were beingeroded. Grab samples collected at specific locations aid in determining the bed characteristicsalong the pipeline and may aid in determining locations that are susceptible to continuingerosion or new erosion in the future.
A discussion of the changes noted between these surveys has been made and, wherepossible, placed into the context of the wider estuary changes, together with appropriateconsideration of the geology/bed characteristics and the review of the monitoring that hasoccurred at the No.1 Gas Feeder (see Section 2.3).
îòí Ì¿µ í ó λª·»© ±º ݱ²¼·¬·±² ¿¬ Ò±òï Ù¿ Ú»»¼»®
As noted above, several phases of remedial work of different types have occurred at the upestuary pipeline (No.1 Gas Feeder) to try to alleviate similar problems to those now beginningto occur at the No.9 Gas Feeder pipeline. The areas of scour on both pipelines are on thesame approximate ‘streamlines’ or flow pathway, depths and hydrodynamic conditions. Theresults of the monitoring of the response of the local bed to the No.1 Gas Feeder have,therefore, been reviewed in order to inform decision-making for any future works associatedwith the No.9 Gas Feeder.
The results of previous reports and subsequent surveys have been used to develop anunderstanding of the scour process that has occurred relative to the remedial worksundertaken, as far as possible, again taking account of the wider estuary changes.
îòì Ì¿µ ì ó λª·»© ±º Ó·¬·¹¿¬·±² Ó»¬¸±¼
The understanding developed from the previous three tasks have been used to assess thelikely implications of a number of identified forms of possible mitigation, in order to determinethe most appropriate method, size and extent, to offer the greatest protection to the pipeline,taking account of the wider variability occurring in the estuary as a whole. The mitigationsmeasures assessed are as follows:

з°»´·²» ͽ±«® ß»³»²¬òÒ±ò ç Ù¿ Ú»»¼»®ô Ø«³¾»® Û¬«¿®§
Îñíçîìñï ì Îòïêëë
Do nothing, to form a baseline against which the potential effectiveness of the differentmeasures can be assessed;Rock dumping to provide protection for the pipe;Placement of rock/cobble filled bags around and over the exposed sections of pipeline;Use of concrete 'frond' mattresses; andUse of rock/cobble filled bags, themselves covered by concrete 'frond' mattresses.
A further alternative would be to replace the pipelines entirely; however, specific analysis of thisoption is beyond the scope of this study. The aim of this analysis is to provide a reasonedargument as to the likely optimum form of mitigation taking account of the methods availableand practicality, whilst also considering other users, such as navigation, within the local area.
íò ß»³»²¬ ±º Û¬«¿®§ó©·¼» Þ¿¬¸§³»¬®·½ ݸ¿²¹»
Analysis of a number of historic bathymetric surveys, dating back to 1851, has beenundertaken as part of a series of previous studies in the area. Where necessary, theseanalyses have been updated with data from recent surveys to investigate the long-term trendsin the estuary morphology. The data from these analyses has been interpreted to assist withfulfilling the specific aims of this study. Figure 1 shows the locations of cross and longitudinalsections and time series monitoring locations that have been extracted from the available datasets.
íòï Ü¿¬¿ Ю»»²¬¿¬·±²
The data extracted directly from the ABP bathymetric data sets and the gridded TIN (TriangularIrregular Network) representation of the data sets is presented in the following forms to providethe basis for the conceptual understanding of the long-term morphological changes for thestudy area:
1. Comparison of the TIN models of the readily available bathymetric data sets for 1940,1950, 1960, 1970, 1990, 1997, 2000, 2005 and for the local area of the No.9 GasFeeder for 2007 and 2009 annual surveys, Figure 2;
2. Comparison of 'year on year' change in erosion and accretion from 1999 through to2009 for the areas of data overlap, Figure 3 and the cumulative change in Figure 4;
3. Bathymetric profile comparisons, showing the change in level relative to ODN(Ordnance Datum Newlyn) for the years noted in ‘1’ above at the profiles labelledSaltend Jetties, 100m north-west of the No.9 Gas Feeder and Cross Section 1, Figures5 to 7;
4. Bathymetric chart comparison for historical data for the years prior to 1940, Figure 8;5. Similar bathymetric profile comparisons, focussing on the period 1998-2009 for the
locations Alexandra Dock, Saltend Jetties, No.1 Gas Feeder pipeline and theSoutheast Section, Figures 9 to 12;
6. Time series plots of local depth changes along the deepest sections of both the No.1and No.9 Gas Feeders and down estuary locations in the area of North Killingholme,Figures 13 to 15;

з°»´·²» ͽ±«® ß»³»²¬òÒ±ò ç Ù¿ Ú»»¼»®ô Ø«³¾»® Û¬«¿®§
Îñíçîìñï ë Îòïêëë
7. Location and width of the 12m below ODN channel on the line of the No.9 Gas Feederpipeline for the period 1940 to 2009 and summary diagrams of change in width ofchannel at depths of 8m and 12m below ODN, Figures 16 and 17;
8. Local cross-sections perpendicular to the No.9 Gas Feeder pipeline, showing thebathymetric change between 1976 and 2009, including the original trench survey in1984, Figure 18; and
9. Longitudinal profile comparison along the main navigation channel between NorthKillingholme and Hull for 1999-2009, Figure 19.
íòî Ù»²»®¿´ Ì®»²¼ ·² ¬¸» Û¬«¿®§ Ó±®°¸±´±¹§
An illustration of the variability in the estuary morphology for the whole reach between NorthKillingholme and Hull through the period of 1940 to 2009 is shown in Figure 2. Whilst the datainterval is not uniform it is sufficient to indicate a number of broadly repeatable characteristicestuary morphological forms, with different periods of cyclicity. The diagram indicates twoimportant trends which are occurring on different timescales:
1. The deep water channel, generally to the north side and with depths always lower thanabout 10m below ODN appears to have a cyclic pattern with a periodicity in excess of70 years, however, the exact timing cannot be established as the length of record istoo short; and
2. The shallower area on the south side, typically less than 8m below ODN, comprisingthe area referred to as Skitter Sand and Halton Flats also appears to have a cyclictrend. Similar trends have been observed elsewhere in relatively shallow sub-tidalareas of the estuary.
The general pattern of change is described in more detail in the following sections.
íòîòï Ü»»° É¿¬»® ݸ¿²²»´
The deep water channel runs around the outside of the bend at Hull where it is narrowest andthen slowly moves and widens to the south bank through Halton Middle. This generalconfiguration is ‘fixed' through time. However, as Figure 2 indicates depths and widths varyover time at different locations. For the most part the deepest water is maintained around theHull waterfront with the absolute maxima generally between King George Dock and SaltendJetties and the shallowest depths where Halton Middle enters Whitebooth Road off NorthKillingholme. Absolute depths, however, have changed by up to about 6m at any particularlocation within the channel since 1940.
In 1940, Figure 2 shows a deep channel (lower than 14m below ODN) extending through thearea of the pipelines. Through to 1970 the southern extent of this channel receded northwardsand depths over the pipelines reduced to below 12m below ODN. Depths at the southern endof Halton Middle were generally of the order of 10m below ODN, or less, whilst depths at Hullstill exceeded 14m below ODN. In 1990 the seaward limit of the deep channel is shown tohave retreated to a position furthest up estuary, based on the bathymetries analysed. Post1990 the main channel is shown to deepen, extend back southwards through the area of the

з°»´·²» ͽ±«® ß»³»²¬òÒ±ò ç Ù¿ Ú»»¼»®ô Ø«³¾»® Û¬«¿®§
Îñíçîìñï ê Îòïêëë
pipelines and widen. This change is most pronounced through the areas of the No.1 and No.9Gas Feeder pipelines, which has led to the erosion and scour issues at both locations.
The sequence of bathymetric plots in Figure 2 shows a general trend of shallowing before 1970to one of deepening after 1990. Unfortunately no complete bathymetric data could be found forthis area for the 20-year period between 1970 and 1990 to help identify the ‘turning point’. It isestimated from the relative changes shown for 1970 and 1990 that the turning point when thenatural variability in depths, particularly around the pipelines, were at their shallowest, couldhave been around 1985. This is important when considering the effect of these naturalchanges on the exposure of the pipes, since the No.1 Gas Feeder was installed in 1973 andthe No.9 Gas Feeder in 1984.
In the 25 years since 1985 significant deepening of the channel through the area of thepipelines has occurred and the present condition is even deeper than the situation in 1940,when the channel was apparently already shallowing. This suggests that if a cyclic pattern oflong-term bathymetric change exists, then the associated period is in excess of 70 years. If it isassumed that this is the case then it is likely that there will be a further 10-20 years of highflows within the channel around the pipelines. This would have the potential to cause furthergeneral erosion and localised scour around the pipes. Whether further deepening actuallyoccurs, and the rate if it does, will be dependant on the local characteristics of the bed material,which appears to be gravel, although it is known that the general surrounding material isboulder clay.
Figures 3 and 4 provide a more detailed analysis of the year on year accretion and erosionpatterns and the cumulative change over approximately the last 10 years. These plots show theconsiderable on-going bed changes throughout the whole reach. On each plot the location ofthe centre of the 2010 exposure along the No.9 Gas Feeder has been indicated. Both plotsshow that in the vicinity of the present exposure, erosion and accretion has almost alternatedyear on year, with the most significant periods of erosion occurring in 2001, 2005 and 2009.Figure 4 clearly shows how the large area of erosion, initially created by the channel eroding onthe north-west to south-east axis into Skitter Sand in 2005 (see Figure 2) has helped cause thesubsequent down estuary erosion in the navigation channel which has passed through the areaof the pipelines and is now impacting upon the No.9 Gas Feeder.
This tends to indicate that whilst the main deep channel appears to change over a long-periodoverall, within this trend, local shorter-term variations in rates of erosion and accretion withinthe channel are influenced by the periodic bathymetric variations occurring at a higher level onSkitter Sand and Halton Flat.
Figures 5 to 7 show cross-sections of the bathymetry of the estuary at three locations: SaltendJetty, just to the north-west of the No.9 Gas Feeder, and at Cross Section 1 (CS1) towardsNorth Killingholme for the period between 1940 and 2009 (only up to 2005 for CS1 due tolimitations of available data). Concentrating on the area of the main channel, all three sectionsclearly indicate the bathymetric trends described above, with minimum depths occurring around1986 to 1990 with the maxima occurring during the last 5 years. At Saltend Jetties themaximum channel depth occurred in 2004 and since then there has been progressive
з°»´·²» ͽ±«® ß»³»²¬òÒ±ò ç Ù¿ Ú»»¼»®ô Ø«³¾»® Û¬«¿®§
Îñíçîìñï é Îòïêëë
shallowing and widening from about 13m below ODN to about 11m below ODN. The 2005profile shows the channel starting to form through Skitter Sand about half way along the profile.
Further down estuary near the No.9 Gas Feeder, Figure 6 shows that over 2m of erosionoccurred on the alignment of the existing exposure between 2004 and 2005 with the channelwidening in 2006, whilst accretion occurred at Saltend. This indicates that the new channelthrough Skitter Sand has diverted flow to the main channel, increasing the erosion downestuary, but causing accretion up estuary. This suggests more flow passes through SkitterSand post 2005 than was previously the case and less through the navigation channel aroundHull bend and over the southern side of the estuary. By 2009 however, there are signs that thisincreased energy through the area of the pipelines is waning allowing accretion on the southernside of the channel. This, however, will force the faster flows to move towards the northernside. At CS1, down estuary, the erosion seen up estuary was not evident in 2005 since thissection is located approximately 2.8km further seawards where the estuary is wider. However,some increased erosion would have been likely, albeit considerably less significant in depthterms compared to the vicinity of the pipelines.
íòîòî ͵·¬¬»® Í¿²¼ ¿²¼ Ø¿´¬±² Ú´¿¬
The shallower area on the southern side of the estuary where bed levels are typically aboveapproximately 8m below ODN is referred to here as Skitter Sand to the north and Halton Flat tothe south. As well as changing in width across the estuary and extent, both up and downestuary, shallow channels are also found to migrate through this feature, as shown in Figure 2,all of which are likely to have a bearing on conditions in the vicinity of the pipeline crossings.
For the period from 1940 to 1970 when the deep water channel has been shown to beshallowing, the width of Halton Flat progressively reduced whilst to the north Skitter Sandincreased in width. During the same period a narrow secondary channel migrated from an initialalignment parallel to the southern shoreline rotating anti-clockwise about a point off SkitterNess, approximately in the middle of Skitter Sand. This channel is a transient feature that is notbelieved to have any direct effect on conditions along the pipelines.
By 1990, along the alignment of the No.9 Gas Feeder, Halton Flat has approximately doubledin width relative to the situation in 1970. For the period from 1990 to 2005 there is shown to befurther progressive increase in the width of Halton Flat combined with a general raising in bedlevels. There is an associated reduction in cross-sectional area for these shallow areas whichwill result in a greater proportion of tidal flow being forced through the deep water channel. As aconsequence of this and the constraint imposed by flood defences on both sides of the HumberEstuary, there is a tendency for the main channel to deepen and widen in an attempt to restorethe cross-sectional area and hence the capacity of the estuary to accommodate the tidal flowsat this section.
There is also a further natural constraint within the Humber Estuary related to the underlyinggeology. Within many areas of the estuary mobile sediments are found with a variable depth,overlying a hard bed composed of consolidated glacial deposits. There may therefore besituations when the estuary bed cannot respond as rapidly as it would like to. It is thought thatthis could be the reason why secondary channels, such as the one through Halton Middle and

з°»´·²» ͽ±«® ß»³»²¬òÒ±ò ç Ù¿ Ú»»¼»®ô Ø«³¾»® Û¬«¿®§
Îñíçîìñï è Îòïêëë
Skitter Sand, periodically develop acting as a ‘pressure release valve’ when the rate of erosionis limited elsewhere.
The progressive growth of the shallow area on Halton Flat, immediately downstream of theNo.9 Gas Feeder, is evident from 1997 onwards and also in the nearest cross-section plot(Figure 6) which clearly shows the largest extent from the most recent survey in 2009. This is aconcern since unless this feature erodes, there is likely to be continued erosion potentialfocussed in the channel along the No.9 Gas Feeder. Erosion here is likely to continue until thesecondary channel, as previously identified, migrates over Halton Flat, lowering levels andredistributing sediment during this process.
Based on the most recent survey of 2009 presented in Figure 2 the secondary channel wouldappear to have widened and deepened since 2005. However, it is not possible to confirmwhether or not this channel will migrate across Halton Flat as described above.
íòîòí Ø·¬±®·½ ݸ¿²¹»
Previous analyses of historic change in morphology for the Humber Estuary have beenundertaken for periods extending as far back as 1851 (ABP Research, 1999a and ABPmer,2004a). The analyses focussed on volumetric changes rather than changes in channelalignment and the work reported in 2004 excluded survey data collected before 1936 due to thehigh degree of uncertainty associated with the use of lead line survey methods (rather thanecho-sounders) used before this date. However, qualitative features of the individual surveyswill be valid and are particularly useful for comparative purposes.
Historical charts for the years 1851, 1875, 1900, 1910, 1925 and 1936 were captured digitally(ABP Research, 1999a) and the data is presented here in Figure 8. Changes in the study areahave been reviewed to establish whether or not a similar situation to the present-daymorphology has been experienced in the past. The review attempted to identify a situationsimilar to the present day with Halton Flat as an accretionary environment alongside adeepening main channel. If found this would support the hypothesis of a long-term cycle andconfirm that erosion of material on Halton Flat and a return to shallower conditions over thepipelines could be possible in the future.
From Figure 8 it can be seen that the historical chart for 1925 shows very similar characteristicsto the 2005 survey (Figure 2) with an accumulation of sediment on Halton Flat together with asecondary channel to the west. The chart includes an additional secondary channel having asimilar alignment further north, opposite Saltend. The secondary channel on Halton Flatappears to widen after 1925 and by 1936 the local accumulation on Halton Flat is no longerpresent. The above observations confirm that material deposited on Halton Flat has been re-eroded in the past and indicates that there may be an 80 year cycle associated with thisprocess. Based on this assumption, the situation for the pipelines can be expected to improveby 2040 (i.e. over the next 30 years) due to potential for increased accretion within the mainchannel over this period. It is therefore suggested that in order to safeguard their structuralintegrity, operational pipelines in the vicinity of the No.9 Gas Feeder will require ongoingmaintenance and monitoring for at least the next 30 years.

з°»´·²» ͽ±«® ß»³»²¬òÒ±ò ç Ù¿ Ú»»¼»®ô Ø«³¾»® Û¬«¿®§
Îñíçîìñï ç Îòïêëë
The existence of an 80 year cycle in morphological change is not unreasonable since theGleissberg cycle related to solar forcing has a period that varies between 72 and 83 years(Hoyt & Schatten, 1997). There is an established link between solar radiation and weatherconditions which in turn has a direct influence on river flows. Within the Humber Estuary riverflow has been considered to be a contributing factor to morphological change (ABP Research,1999b), even at locations further down estuary from the study area. It should be noted thatwhere any such cycles can be linked to morphological change, there is likely to be aconsiderable phase lag due to the timescales associated with morphological response makingit difficult to confirm any such linkage.
íòí Ë°¼¿¬»¼ ß²¿´§· º®±³ Ò±òï Ù¿ Ú»»¼»® ͬ«¼§
The bathymetric analysis for the �Ûª¿´«¿¬·±² ±º ¬¸» ᬻ²¬·¿´ ׳°¿½¬ ±º λ³»¼·¿´ ɱ®µæ Ò±òïÙ¿ Ú»»¼»® з°»´·²» ͬ«¼§� (ABPmer, 2004b) has been updated with additional survey databetween 2004 and 2009. Following this updated analysis, the following observations have beenmade regarding the cross sections and monitoring locations analysed as part of the earlierstudy.
The four cross-section profiles (see Figure 1 for location) show the following (see Figures 9to 12):
ß´»¨¿²¼®¿ ܱ½µæ over the period 1998-2009 Hull Middle gets shallower and thechannel south of Hull Middle gets deeper (at 1000m along the profile the depth is3.74m below ODN in 2004 and 7.12m below ODN in 2009).Í¿´¬»²¼ Ö»¬¬·»æ the plots show a shallowing of the main channel on the eastern sideof the estuary from 2003-2009 (at 2.82km along the profile the depth is 16.2m belowODN in 2003 and 13.93m below ODN in 2009. There is a deepening of the middle ofthe estuary from 3.9m below ODN in 2000 to 7.9m below ODN in 2005 (no data isavailable for this part of the cross-section from 2006 or 2009).Ò±òï Ù¿ Ú»»¼»®æ migration of the main channel towards the south-west has ceasedsince 2003. Since then the channel has continued deepening. The north-east bank isstable throughout the period. Halton Flat widens and shallows from 2004 to 2009 (andprior to 2003). There is a shallow peak in 2003. In 2009 the deepest part of the mainchannel has moved towards the north-east and the south-westerly side of the channelhas also moved towards the north-east.ͱ«¬¸ Û¿¬ Í»½¬·±²æ Halton Flat became 2m shallower from 2002-2004 to 2005 to asimilar depth as in 1998 to 2000. There is a general movement of the main channeltowards to the north-east from 1998 to 2004, but this appears to have stopped in 2005.The north-east bank is stable over the period.
The time series plots for the monitoring points analysed in the original study (see Figure 1 forlocations), situated along No.1 Gas Feeder in the main channel, show a general trend oferosion (deepening of the channel) throughout the period 2001 to 2009 (see Figure 13).However, at three of the locations (Ðîððô Ðîîë ¿²¼ Ðíðð) there is a change in this trend toshallowing from February 2006, before the trend at these locations returns to a deepeningagain from April to June 2009.

з°»´·²» ͽ±«® ß»³»²¬òÒ±ò ç Ù¿ Ú»»¼»®ô Ø«³¾»® Û¬«¿®§
Îñíçîìñï ïð Îòïêëë
íòì Ë°¼¿¬»¼ ß²¿´§· º®±³ ݸ¿®¬ ͬ«¼§ ·² ¬¸» Ê·½·²·¬§ ±º Ò±®¬¸ Õ·´´·²¹¸±´³»
The bathymetric analysis for the �ݸ¿®¬ ͬ«¼§ ·² ¬¸» Ê·½·²·¬§ ±º Ò±®¬¸ Õ·´´·²¹¸±´³»� (ABPmer,2006) has been updated with additional survey data between 1999 and 2005. Following thisupdated analysis, the following observations have been made regarding the cross sections andmonitoring points analysed as part of the original study.
The closest cross-section profile to No.9 Gas Feeder (identified as CS1 in the original studyand the location of which is shown in Figure 1) shows the following (see Figure 7):
A link appears to exist between Halton Flat and the main channel, such that theshallowest level of Halton Flat is linked with deepest channel; whilst the deepest levelof Halton Flat is linked with shallowest channel.The shallowest Halton Flat and deepest channel profile occurs in 1999 (2mshallower/deeper than in 2001/03/04).In 2005 Halton Flat gets shallower and the channel gets deeper again, but bothfeatures have moved towards the north-east. This is particularly true for the mainchannel which is in a more north-easterly position than at any time since 1940.
The time series plots for Monitoring Points 1 to 4 analysed in the original study (see Figure 1for location), situated on or to the north of cross section CS1, show the following (seeFigure 14):
A trend of over 3m deepening is observed at Monitoring Point 1 (towards the easternend of CS1, close to the Lowest Astronomical Tide (LAT) level, approximately 3.9mbelow ODN) over the whole time period from 1940 to 2005. However, this masks aperiod of 2m of accretion from 1997, with a slight drop of about 0.5m between 2001and 2003.A trend of over 1m accretion can be observed at Monitoring Point 2 (on Halton Flat)over the whole time period. Between 1986 and 2000 there was a steeper increase from7.6m below ODN to 5.2m below ODN. From 2000 to 2002 there was a period oferosion from 5.2m below ODN to 6.8m below ODN followed by further accretion.A trend of about 2m accretion is observed at Monitoring Point 3 (on Halton Flat) overthe whole time period. There was a period of erosion from the shallowest point in 1999from 5.9m below ODN to 7m below ODN in 2003, followed by a further period ofaccretion to 6m below ODN in 2005.A flat trend is observed at Monitoring Point 4 (in the centre of CS1, close to the middleof main channel) over the whole time period. However, this masks a period of accretionfrom 14m below ODN in 1936 to 10.5m below ODN in 1940, a period of erosion from9.7m below ODN in 1986 to 12.7m below ODN in 1999 and another period of accretionfrom 12.7m below ODN in 1999 to 10.7m below ODN in 2001.
íòë ß²¿´§· ±º Ó±®°¸±´±¹·½¿´ Ì®»²¼ Ò»¿® ¬¸» Ò±òç Ù¿ Ú»»¼»®
Sections 3.2, 3.3 and 3.4 have discussed the extended analyses of previous studies byincluding recent survey data. These studies, however, are not specifically concerned withconditions at No.9 Gas Feeder. This section details the results of new analyses looking at the
з°»´·²» ͽ±«® ß»³»²¬òÒ±ò ç Ù¿ Ú»»¼»®ô Ø«³¾»® Û¬«¿®§
Îñíçîìñï ïï Îòïêëë
historic trends in bathymetry at the No.9 Gas Feeder. A separate analysis was also undertaken(ABPmer, 2010) to estimate the length of unsupported section of the pipeline that would berequired for vortex induced vibration (VIV) to become a further safety consideration.
The historic bathymetric trends at a series of monitoring points (see Figure 1 for location)located along a 500m section of No.9 Gas Feeder (centred on the exposed section as detailedin the 2009 EGS survey) have been extracted from the survey datasets and these are shown inFigure 15. The results show that due to the south-westerly movement of the main channel (asdiscussed in Section 3.2), the monitoring points to the south-west of the exposed section(points ÐçÁðô ÐçÁïðð and ÐçÁîðð) show a trend of slight erosion between 1940 and 1990.Meanwhile, the point of exposure and the remaining points to the northeast (ÐçÁîëðô ÐçÁíððôand ÐçÁìðð - in addition to ÐçÁëðð, which is not shown in Figure 15) show an accretionarytrend over the same period. Between 1990 and 2009, all points show a steep erosionary trend.
The south-west movement of the main channel is shown in Figure 16, which shows the widthand location of the main channel between the 12m below ODN contour, between 1940 and2009, relative to the exposed section of pipeline, as detailed in the 2009 survey (EGS, 2010b).From this figure it can be seen that the width of the channel decreases between 1940 to aminimum in 1990, whilst remaining (for the most part) approximately 100-200m to the northeastof the exposed section of pipe. From 1997 onwards, the channel widens dramatically (mostlythrough a south-westerly migration of its southwest margin), to span the exposed pipe section.As shown in Figure 2, and discussed in Section 3.1, since 2001 this migration has resulted inthe deepest point of the channel being located at the approximate position of the exposed pipe.
Figure 17 provides a means of visualising long term trends in channel position along the axis ofthe No.9 Gas Feeder. The data on the graph is presented relative to the maximum channeldepth in 1940, hence the ‘Deepest point’ has a ‘Position’ value on the x-axis of zero at the start.At this time the nearest 12m below ODN contour heading towards the southern bank of theestuary is a distance of 170m away whilst the 8m below ODN contour is 390m away. Thesepositions have been identified from survey data for the period up to 2009. The position of thecontour on the opposite side of the channel is not included since it is changes in themorphology of Halton Flat that have been previously linked to changes in depth within the mainchannel. It is not therefore possible to infer how channel widths have varied over time from thisfigure. The separation between the contour lines can be used to provide an indication of howthe channel side slopes have changed over time. The long-term trend in the data shows that,relative to the situation in 1940, the channel has moved to the south-west with relativelyshallow side slopes between 1960 and 1990 which subsequently steepened over the period upto 2005. Since 2005 the south-western slope of the channel has remained fairly constantalthough the channel edge has moved towards the exposed section of the No.9 Gas Feeder. Itis interesting to note that since 2002, the deepest point of the channel has become virtuallyfixed at the alignment of the pipeline. There is insufficient evidence to confirm how the channelposition will change in the future. The change of the 8m below ODN contour position since1997 correlates with the growth of the shallow area on Halton Flat, which appears to besimilarly linked to the start of problems associated with exposure of the pipelines, as noted inSection 3.2.2.

з°»´·²» ͽ±«® ß»³»²¬òÒ±ò ç Ù¿ Ú»»¼»®ô Ø«³¾»® Û¬«¿®§
Îñíçîìñï ïî Îòïêëë
The historic channel morphology has been investigated further and Figure 6 shows a timeseries of ‘along-pipe’ bathymetry profiles. In order to minimise the amount of interpolated datain the profiles, the actual survey data along the track-line closest to the No.9 Gas Feeder (inthis case, the survey track approximately 100m to the north-west of the pipeline, runningapproximately parallel to it) has been used to give the profiles. The change in width andlocation of the main channel, and associated changes to the profile of Halton Flat, can be seenin Figure 6, with the profile of the recent surveys (1997 to 2009) differing from the historicsurveys (1940 to 1990).
An assessment of the changes immediately upstream and downstream of the No.9 Gas Feederhas been carried out and Figure 18 shows a series of ‘cross-pipe’ profiles (at the exposedsection and approximately 250m to the north-east and south-west) perpendicular to theorientation of the pipe (see Figure 1 for location). Included in Figure 18 are data from alocalised survey carried out in 1984, which shows the original trench that was excavated tobury the pipeline when it was installed. From this figure, it can be seen that by 2009, theprogressive deepening of the channel results in a depth at the exposed section of pipeapproximately only 1m shallower than the original trench excavated to bury the pipe.
In the context of the wider estuary, Figure 19 shows a time series of historic bathymetricprofiles along the main channel (see Figure 1 for location), from North Killingholme Haven toHull. This figure shows that the bathymetry at the pipeline has progressively deepened since2000 to reach its deepest point in 2009. In addition, the area of shallower bathymetry that isevident immediately upstream of the pipeline between 2002 and 2006 has also progressivelydeepened, since 2006, such that no such feature exists in the latest survey.
ìò ß²¿´§· ±º Ü»¬¿·´»¼ з°»´·²» Í«®ª»§
Detailed surveys of the estuary bed in the immediate vicinity of both the No.1 and No.9 GasFeeders have been carried out in 2009 and 2010 by EGS. The 2009 survey discovered apreviously unidentified 33.2m long section of exposed pipe along the No.9 Gas Feeder (EGS,2010a), although no free-spanning was identified. The preliminary report of the 2010 survey(EGS, 2010c) has identified that this section of exposed pipe is now 42m in length and, inaddition, two new exposures of 7m and 9m have also been identified. This latter survey alsoshows no free-spanning sections along the No.9 Gas Feeder.
A detailed description of these surveys, as well as a survey covering the Centrica Condensatepipeline (located between the No.1 and No.9 Gas Feeders) can be found in the respectivesurvey reports (EGS, 2010a; EGS, 2010b; and EGS, 2010c).
The increased exposure of No.9 Gas Feeder identified between September 2009 and March2010 corroborates the identified trends in the historic bathymetric change discussed inSection 3. The progressive extension in extent and depth of the main channel across thepipelines appears to be leading to increased exposure of both the No.1 and No.9 Gas Feeders.It is likely that an increase in the exposure of both pipelines will continue as long as the mainchannel keeps extending towards Halton Middle and/or continues to deepen.
з°»´·²» ͽ±«® ß»³»²¬òÒ±ò ç Ù¿ Ú»»¼»®ô Ø«³¾»® Û¬«¿®§
Îñíçîìñï ïí Îòïêëë
ëò λª·»© ±º Ю»ª·±« λ³»¼·¿´ ɱ®µ
The No.1 Gas Feeder is located approximately 500m upstream of the No.9 Feeder and was thefirst to experience problems related to free-spanning sections of the pipeline. A review ofconditions at the No.1 Gas Feeder is therefore provided in this section of the report. Thisincludes an assessment of changes resulting from previous remedial works to help establishthe suitability of similar techniques which might be considered for protection of the No.9 GasFeeder. The potential interaction between remedial works at the No.1 Feeder and changes indownstream morphology along the No.9 Feeder have also been considered.
ëòï ݱ²¼·¬·±² ¿¬ Ò±òï Ù¿ Ú»»¼»®
A series of remedial works has been undertaken in an attempt to address the exposure andsubsequent free-spanning of sections of the No.1 Gas Feeder pipeline. In July/August 2000crushed rock was deposited over a section of the pipeline, whilst in March 2002 diver-placedprotection, in the form of rock filled bags, was put in place over a second section.
Whilst the 2009 survey identifies that the rock dump protection is still working, with the pipelineremaining buried, the rock filled bags have begun to disperse and the pipeline is being exposedagain. Furthermore, the detailed survey carried out in 2009 identified that the pipeline betweenand immediately to the east and west of the remedial works (both rock dump and rock filledbags) was free-spanning a combined length of approximately 163m. The latest survey of March2010 shows that the No.1 Gas Feeder has now become further exposed over the sectionwhere the rock filled bags were placed, with a section to the west having now sagged to thebed.
The re-exposure of the pipeline, caused by the dispersion of the rock filled bags, is evidentfrom comparison of the detailed surveys of 2007 and 2010 (see EGS, 2010c). This interimreport on the 2010 survey further states that the rock filled bags are currently preventing furthersections of free-spanning occurring along a 135m section of exposed pipe. In addition, the levelof the pipeline has sagged throughout this section, compared to the 2009 survey results. Thistends to indicate that the rock dump and rock-filled bags (despite some movement) arecontinuing to prevent free-spanning of the pipeline. However, because these works wereundertaken on a piecemeal basis, the focus of erosional energy has been diverted around theedges of the protection and possibly accentuated this effect leading to new areas of freespanning recorded in the 2009 and 2010 surveys. It is likely therefore that maximum depths atthe location of the No.1 Gas Feeder are deeper than if no remedial works had taken place,although this is not possible to quantify. The surveys, however, tend to indicate that mostadditional scour remains local to the pipeline, although there is some limited evidence tosuggest a small effect could have extended to just down estuary of the No.9 Feeder. Thisadditional effect is considered small compared with the estuary morphological changes thathave occurred.
Prior to construction of the No.1 Feeder pipeline, it is likely that cost considerations dictated thelocation of the pipeline crossing. The cost of trenching and backfilling in the estuary itself wouldhave been significantly greater than on land and it is likely that construction costs would have

з°»´·²» ͽ±«® ß»³»²¬òÒ±ò ç Ù¿ Ú»»¼»®ô Ø«³¾»® Û¬«¿®§
Îñíçîìñï ïì Îòïêëë
been an important consideration. In the Humber Estuary the position of the pipeline crossingsis at a morphological ‘pinch point’ where there is a very narrow width of intertidal along thenorthern shore. As a result the morphology is particularly sensitive to local changes in this area,as indicated by the link between the shallowing depths on Halton Flat and increasing depths inthe main channel. A pipeline crossing further down estuary (near CS1, for example) cantherefore be expected to be less sensitive to such changes.
Without the benefit of historical datasets and analytical techniques, as applied within this study,prior to construction it would have been difficult to establish the morphological trends identified.It was therefore unfortunate that the pipeline was installed at a time when natural bed levels inthe main channel were shallower than they had been in the past or have been ever since.
ëòî ܱ©²¬®»¿³ Ûºº»½¬
Detailed visualisations of the recent bathymetric surveys (EGS, 2010c) covering the No.1 andNo.9 Feeders were reviewed to establish the likelihood of remedial works at the No.1 Feederhave affecting conditions at No.9. Having reviewed this evidence it is noted that the main rockdump over the No.1 Feeder is a prominent feature on the estuary bed that could potentiallyaffect bed levels further downstream.
The main rock dump over the No.1 Feeder has effectively resulted in a raising and ‘fixing’ oflocal bed levels. As a consequence near bed flows are diverted around this ‘obstacle’ whichappears to have resulted in a localised deepening to the west of the rock dump. It is possiblethat the depths in this area are deeper with the rock dump than they would have otherwisebeen as a result of the focussing of energy in the near bed flows. It is not possible to quantifythe magnitude of any increase in depth but the bed morphology appears to have returned to itsnatural state downstream of the No.9 Feeder.
Based on the evidence of the long-term trends in channel depths, a period of continueddeepening has been experienced over recent years which can be attributed to naturalprocesses rather any of the previous remedial works. These remedial works have not thereforeinfluenced the general trend in morphological change or the overall extent of the area affected.However the remedial works appear to have locally modified the magnitude and distribution ofchanges in bed levels, possibly as far down estuary as the No.9 Feeder, due to the scale andeffectiveness (stability) of the previous rock dump. Even so, any wider-scale changes inmorphology due to the remedial works are sufficiently small that they cannot be distinguishedfrom natural changes occurring within the estuary.
êò λª·»© ±º Ó·¬·¹¿¬·±² Ó»¬¸±¼
A number of various potential mitigation methods (remedial works) have been assessed for theNo.9 Gas Feeder, in conjunction with the information that has been obtained from thepreceding tasks. The relative merits and disadvantages of each of these options are discussedfurther in the following sections.

з°»´·²» ͽ±«® ß»³»²¬òÒ±ò ç Ù¿ Ú»»¼»®ô Ø«³¾»® Û¬«¿®§
Îñíçîìñï ïë Îòïêëë
Whatever form of mitigation measures are put in place, a period of continued monitoring isrecommended to ensure that the required level of protection is provided to the full length of theNo.9 Gas Feeder.
êòï �ܱ Ò±¬¸·²¹� Ñ°¬·±²
The historic analysis of the bathymetric datasets suggests that the section of the estuary underconsideration may exhibit a cyclical trend in its morphology with the main channel extendingand deepening towards Halton Middle, before receding back towards the Hull Bend andshallowing during the process. There is, however, only limited data to support the existence ofan approximately 80-year cycle for changes in morphology.
It is possible that such a cycle is currently at its lowest point, since the main channel is currently(based on the 2009 survey) extending further towards Halton Middle and is deeper than in anyof the previous surveys dating back to 1940. The morphology of the main channel maytherefore be expected to switch in the near future, retracting back upstream towards Hull andshallowing in the process, eventually attaining a morphology closer to that observed from the1990 and 1970 surveys (see Figure 2). Based on previously recorded morphological changes,the shallowest depths are not expected to occur again until around 2040.
This is not definitive, however, and if no such cycle exists or, if the peak of the cycle has yet tobe reached, then the main channel may continue to extend and/or deepen, putting furtherpressure on the No.9 Gas Feeder in the process and leading to increased exposure and,potentially, sections of pipe free-spanning.
êòî α½µ Ü«³°·²¹
Detailed surveys of the No.1 Gas Feeder section that was protected by rock dumping inJuly/August 2000 show that the rock is still in place and is still affording protection to thepipeline along this section. Due to the similarities between the streamlines, depths andhydrodynamic conditions found at both No.1 and No.9 Gas Feeders, it is likely that a similarremediation, involving similar sized rock dumped along ‘at risk’ sections of the No.9 GasFeeder, would result in a similar level of protection. Monitoring of the No.1 Gas Feeder,however, indicates that if only the areas of the pipeline at risk are protected then, under presentflow conditions, the works will be ‘outflanked’ and new areas of erosion stress will occur at theends of the protection works. In addition, existing agreements between NG and the HarbourMaster mean that rock placed directly on the bed as a protection measure should be naturallydispersive. ABPmer recently undertook an analysis of the flow regime within the estuary (letterdated 22 March 2010) which concluded that only gravel sized material of 50mm or less wouldnaturally disperse under predicted flow conditions within the main channel.
Any new rock dumping for the No.9 Feeder would therefore need to use material that can bemobilised under normal flow conditions. It is therefore likely that whilst a proportion of thematerial dumped will remain ·²ó·¬«ô filling local scour holes and thus providing a degree ofprotection, in areas exposed to high flows the material will be dispersed and offer no furtherprotection to the pipeline. The use of rock dumping that is naturally dispersive is not thereforerecommended as part of any future remedial works for either the No.1 or No.9 Gas Feeders.

з°»´·²» ͽ±«® ß»³»²¬òÒ±ò ç Ù¿ Ú»»¼»®ô Ø«³¾»® Û¬«¿®§
Îñíçîìñï ïê Îòïêëë
êòí α½µ Ú·´´»¼ Þ¿¹
The detailed surveys of the No.1 Gas Feeder section that was protected by the rock filled bagsin March 2002 showed that some of the bags had become displaced or split since 2007 (nocomparable data prior to this is offered in the EGS survey reports), leading to sections ofpipeline that were initially protected, becoming partially exposed. New free-spanning sectionsover the bed have occurred adjacent to the protected areas to the extent that the pipeline hassagged and is now resting on the bed of the scour hole. This suggests that although the bagsinitially afforded the required protection to the pipeline immediately beneath them, this onlyacted to divert the focus of erosive energy to other sections within the main channel, where noform of remedial works were undertaken.
Due to the similarities between the streamlines, depths and hydrodynamic conditions found atboth No.1 and No.9 Gas Feeders, it is likely that a similar remediation of bags placed along ‘atrisk’ sections of No.9 Gas Feeder will result in a similar level of protection for this location overa similar timescale (e.g. up to 5 years). Furthermore, it is suggested that careful considerationshould be given to protecting the entire length of pipeline beneath the main channel in order toavoid the remediation measures diverting the focus of erosive energy to unprotected sections,causing outflanking, as has been evident with the No.1 Gas Feeder.
As noted in Section 6.2, the bags should contain coarse gravel sized material to ensure that ifthe bags split, the material contained will disperse under the natural estuary processes. Basedon experience at the No.1 Feeder, some bags are likely to split thus frequent surveys would berequired to monitor the condition of this form of protection. The requirement for such anintensive monitoring programme may mean that this option does not represent a cost-effectivesolution, particularly for protection of the pipeline under the whole width of the main channelaffected by the morphological migration shown to occur in the past.
êòì ݱ²½®»¬» �Ú®±²¼� Ó¿¬¬®»»
Concrete ‘frond’ mattresses are designed to slow the flow down near the bed, givingsuspended sediment more time to settle out and, thus, encourage an environment ofdeposition. This is achieved by buoyant fronds attached to a mat and anchored to the bed overa concrete mattress. These have not been used elsewhere within the Humber Estuary but theyhave the potential to encourage more sediment to settle out of suspension and provide aprotective layer of bed material above the pipeline. However, in a highly dynamic environment,such as the Humber Estuary, it is uncertain how effective this system would be in terms of‘trapping’ and retaining sediment. It is therefore recommended that examples of theirperformance in similar environments are requested from the manufacturer.
A potential disadvantage of the use of such mattresses on their own is that should the anchorsystem fail, for whatever reason, the pipeline may suddenly become unprotected. In suchsituations the frond mat could become unsecured or even detached causing a potential hazardto navigation should this occur. Careful consideration of the up and down estuary extent of themattress will be required, particularly with respect to the foundation of the anchors for the matand/or connections to the concrete mattress. A firm connection between the frond mat and the

з°»´·²» ͽ±«® ß»³»²¬òÒ±ò ç Ù¿ Ú»»¼»®ô Ø«³¾»® Û¬«¿®§
Îñíçîìñï ïé Îòïêëë
concrete mattress will therefore be required and protection should be provided for a distance of25 to 30m up and down estuary of the pipeline.
Figure 18 indicates that the current depth of erosion is approximately that of the base of theoriginal construction trench which was cut into boulder clay. This suggests most of the materialthat has been recently removed is the unconsolidated backfill and on this basis, the rate of anyfurther erosion can be expected to slow. Also, depending on the level of exposure at the time ofplacement, it is expected that some additional fill material will be required to provide a transitionbetween levels over the pipeline and the local levels of the estuary bed rather than ‘draping’ themattress over the exposed pipeline. Any abrupt changes in the gradient of the mattress couldotherwise result in the formation of local eddies (turbulent flow) and increase the potential forlocal erosion up or down estuary of the protection.
The use of concrete frond mattresses will still require monitoring but on a less frequent basisthan required for rock filled bags.
êòë α½µ Ú·´´»¼ Þ¿¹ Ѫ»®´¿·¼ ©·¬¸ ݱ²½®»¬» �Ú®±²¼� Ó¿¬¬®»»
The combination of these two types of protective measures has the advantage that shouldextreme conditions result in the ‘frond’ mattresses breaking free from their anchor, then therock filled bags beneath would still offer some residual protection to the pipeline. As discussedin Section 6.4, some form of fill material would in any case be recommended to provide asmooth transition from the existing estuary bed levels and over the pipeline.
A potential advantage of the frond mattresses is that they can be expected to encouragesediment deposition. However, this should not be to such an extent that channel depths aresignificantly reduced thus affecting navigation within the estuary. This can presumably becontrolled by the design of the fronds used in the mattress. The design criteria for themattresses should be agreed with the Harbour Master prior to placement which will need totake account of future vessel drafts planned to operate within the Humber upstream of thepipeline crossing.
Where mattress-type protection systems are installed in the marine environment, the extent ofthe protection provided should be sufficient to avoid erosion where this protection ends. Theuse of frond mattresses could significantly reduce the risk of this occurring by encouraging localsediment accumulation.
As with any of the mitigation methods considered here, monitoring of local changes in theestuary bed will still be required although the frequency of detailed surveys could be reducedduring phases of sustained accretion, possibly reverting to a review of ABP bathymetricsurveys during such periods.
To protect the pipelines based on their current position within the estuary, this option is mostlikely to provide a successful long-term solution to the ongoing problem of local erosion.However, without evidence of how this system will perform in this particular environment, aninitial trial placement is recommended together with an appropriate monitoring programme. Itshould be noted that during any trial, there is the possibility that scour could be diverted around
з°»´·²» ͽ±«® ß»³»²¬òÒ±ò ç Ù¿ Ú»»¼»®ô Ø«³¾»® Û¬«¿®§
Îñíçîìñï ïè Îòïêëë
the edge of the mattress, which would then have to be covered should the trial be successfulcausing accretion over the mattress itself.
éò ݱ²½´«·±²
The deepest point in the cross-estuary profile in the location of the No.9 Gas Feeder has, since2001, been at or very close to the centre of the exposed part of the pipeline (as surveyed in2009).
The recent bathymetry surveys suggest that previous remedial works to the No.1 Gas Feederhave worked to an extent, with rock dumping still affording protection to the pipeline and therock filled bags providing partial protection.
Review of the bathymetric variability in the area shows that the exposure, initially of the No.1Gas Feeder and now No.9 Gas Feeder, is primarily as a result of the progressive naturalextension and deepening of the main channel which has occurred since the 1990’s, which isitself indicative of a cyclical transition in the general morphology of the Humber Estuary.
The remedial works employed for the No.1 Gas Feeder appear to have locally modified themagnitude and distribution of changes in bed levels, possibly as far down estuary as the No.9Feeder, due to the scale and effectiveness (stability) of the previous rock dump. Any wider-scale changes in morphology are sufficiently small that they cannot be distinguished fromnatural changes occurring within the estuary.
There is some limited evidence for an 80 year cycle in local morphological changes. Assumingthis cycle continues, there is some evidence to suggest that it is currently near to its nadir. Inthis case there is the potential that accretion might dominate in the main channel within thestudy area over the next 30 years; although there could be a few years of continued erosionalstress before this occurs.
Since the analysis of available data cannot be expected to predict with a high level of certaintyhow the morphology of this section of the Humber Estuary is likely to evolve in the immediatefuture, it is recommended that an appropriate remediation plan is developed and implementedfor the No.9 Gas Feeder to secure the structural integrity of the pipeline.
A review of possible mitigation methods suggests that, similar to No.1 Gas Feeder, a rockdump remediation will offer protection to the covered pipeline section for at least a 10-yearperiod (if not longer). Rock filled bags have previously been used containing smaller sizematerial and while initially protecting the pipeline, bags have in some cases moved or splitresulting in dispersion of the contents within 5 years, at which point the pipeline is only partiallyprotected. The use of concrete frond mattresses has the potential to encourage an environmentof accretion to develop, however, should they become unsecured this protection may no longerbe provided. A combination of concrete frond mattresses and rock filled bags would providesome secondary protection to the pipeline, should the mattresses fail, and also provide a betterfoundation for the mattress in the first place.
з°»´·²» ͽ±«® ß»³»²¬òÒ±ò ç Ù¿ Ú»»¼»®ô Ø«³¾»® Û¬«¿®§
Îñíçîìñï ïç Îòïêëë
However, it is clear that the erosional energy has been diverted to the ends of the protectedareas, thus transferring the location of erosion to the unprotected areas. This indicates that theprotection methods have worked, where placed, but to provide longer-lasting protection of thepipelines as a whole, any remedial works must cover the whole length of the pipeline below theextent of natural variability of the main channel through Halton Middle.
Whatever remediation measures are put in place, a period of continued monitoring isrecommended to ensure that the required levels of protection are achieved.
èò λ½±³³»²¼¿¬·±²
The following recommendations are made based on the analysis and interpretation undertakenas part of this study:
It is recommended that a remediation plan is developed which can be put in placeshould future monitoring identify a worsening situation. Due to the inherentuncertainties associated with the prediction of morphological changes within estuaries,it is not possible to determine how the morphology within the study area will actuallyevolve in the immediate future although there is some evidence that an accretionaryphase may be about to start, should the cyclic pattern of change continue in the future,however, this is by no means certain;
The combined use of concrete frond mattresses and rock filled bags could be a viableoption with the bags providing secondary protection to the pipeline and improvedfoundation for the mattress. Lessons learnt from the previous remediation works for theNo.1 Gas Feeder indicate that any new remedial works should extend well beyond theextents of current exposure, as the protection works themselves tend to promote localscour at the ends, due to diversion of the flow energy. The bags will also provide asmooth transition in bed slopes to avoid local turbulent flow conditions. This isconsidered the most likely form of remediation to provide a successful long-termsolution to the ongoing problem of local erosion, providing it extends beyond the lengthof the current area of erosion stress. A trial placement is recommended along with anappropriate monitoring programme;
A period of continued monitoring is recommended to ensure that the required levels ofprotection are being achieved following any remediation; and
A review of surveys of the local area, as prepared by ABP, should be undertaken on aregular basis with particular focus on monitoring key features such as the shallow areacurrently developing on Halton Flat and the secondary channel further to the west.These features appear to be directly linked to conditions in the vicinity of the pipelinesand can therefore be used as indicators of potential future change within the mainchannel. Review of the ABP surveys should also test for any signs of ongoing cyclicbehaviour.

з°»´·²» ͽ±«® ß»³»²¬òÒ±ò ç Ù¿ Ú»»¼»®ô Ø«³¾»® Û¬«¿®§
Îñíçîìñï îð Îòïêëë
çò λº»®»²½»
ABP Research, 1999a. Historic Analysis of Humber Morphology. ABP Research & ConsultancyLtd, Research Report No. R.839.
ABP Research, 1999b. Humber Geomorphological Studies - Stage 2. Humber Geo2 SynthesisReport, Annex 5 - Thalweg and Bed Level Analysis. ABP Research & Consultancy Ltd Note.
ABPmer, 2004a. Historical Analysis of Humber Estuary Morphology. ABP MarineEnvironmental Research Ltd, Report No. R.1005.
ABPmer, 2004b. Evaluation of the Potential Impact of Remedial Works: No.1 Gas FeederPipeline, Humber Estuary. ABP Marine Environmental Research Ltd, Report No. R.1082.
ABPmer, 2006. Chart Study in the Vicinity of North Killingholme. ABP Marine EnvironmentalResearch Ltd, Report No. R.1247.
ABPmer, 2010. Pipeline Span VIV Assessment: No.9 Feeder, Humber Estuary. ABPmerMarine Environmental Research Ltd, Technical Note No. R.1644TN (Draft).
EGS, 2010a. Humber Pipeline Crossings. 2009 Survey. EGS International Ltd. January 2010.Ref. 4568a.
EGS, 2010b. Humber Pipeline Crossings. 2009 Survey - Centrica Condensate. EGSInternational Ltd. January 2010. Ref. 4568a_CC.
EGS, 2010c. Humber Interim Surveys (March 2010). Interim Report. EGS International Ltd.March 2010. Ref. 4729.
Hoyt DV & Schatten KH, 1997. The Role of the Sun in Climate Change. Oxford UniversityPress.

Ú·¹«®»

Alexandra Dock
Saltend Jetties
No.1 Gas Feeder
Southeast Section
Cross Section 1
No.9 Gas Feeder
PaullSand
Foul HolmeSand
SkitterSand
Saltend
Paull
Profile 100m upstreamof No. 9 Gas Feeder
432
1
Location Diagram
Date
May 10
By
ND
Size
A4
Version
1
3924 - fig1_location.mxd
Scale
Projection OSGB 1936
© ABPmer, All rights reserved, 2010Data collated from various sources (see Report for details)NOT TO BE USED FOR NAVIGATION
0 0.5 1 1.5 20.25km
Gas Feeder monitoring points
Previous monitoring points
Analysis profiles (1940-2009)
Analysis profile (1940-2005)
Analysis profiles (1998-2009)
Centre of exposed section
Gas Feeder No. 9
Cross-pipe profiles
Main channel profile
Depth contours (2005) mODN
0 m
4 m
8 m
12 m
16 m
Produced by ABPmer Ltd
1:45,000
Figure 1
QA CEB
0 210 420105mInsert Scale: 1:20,000
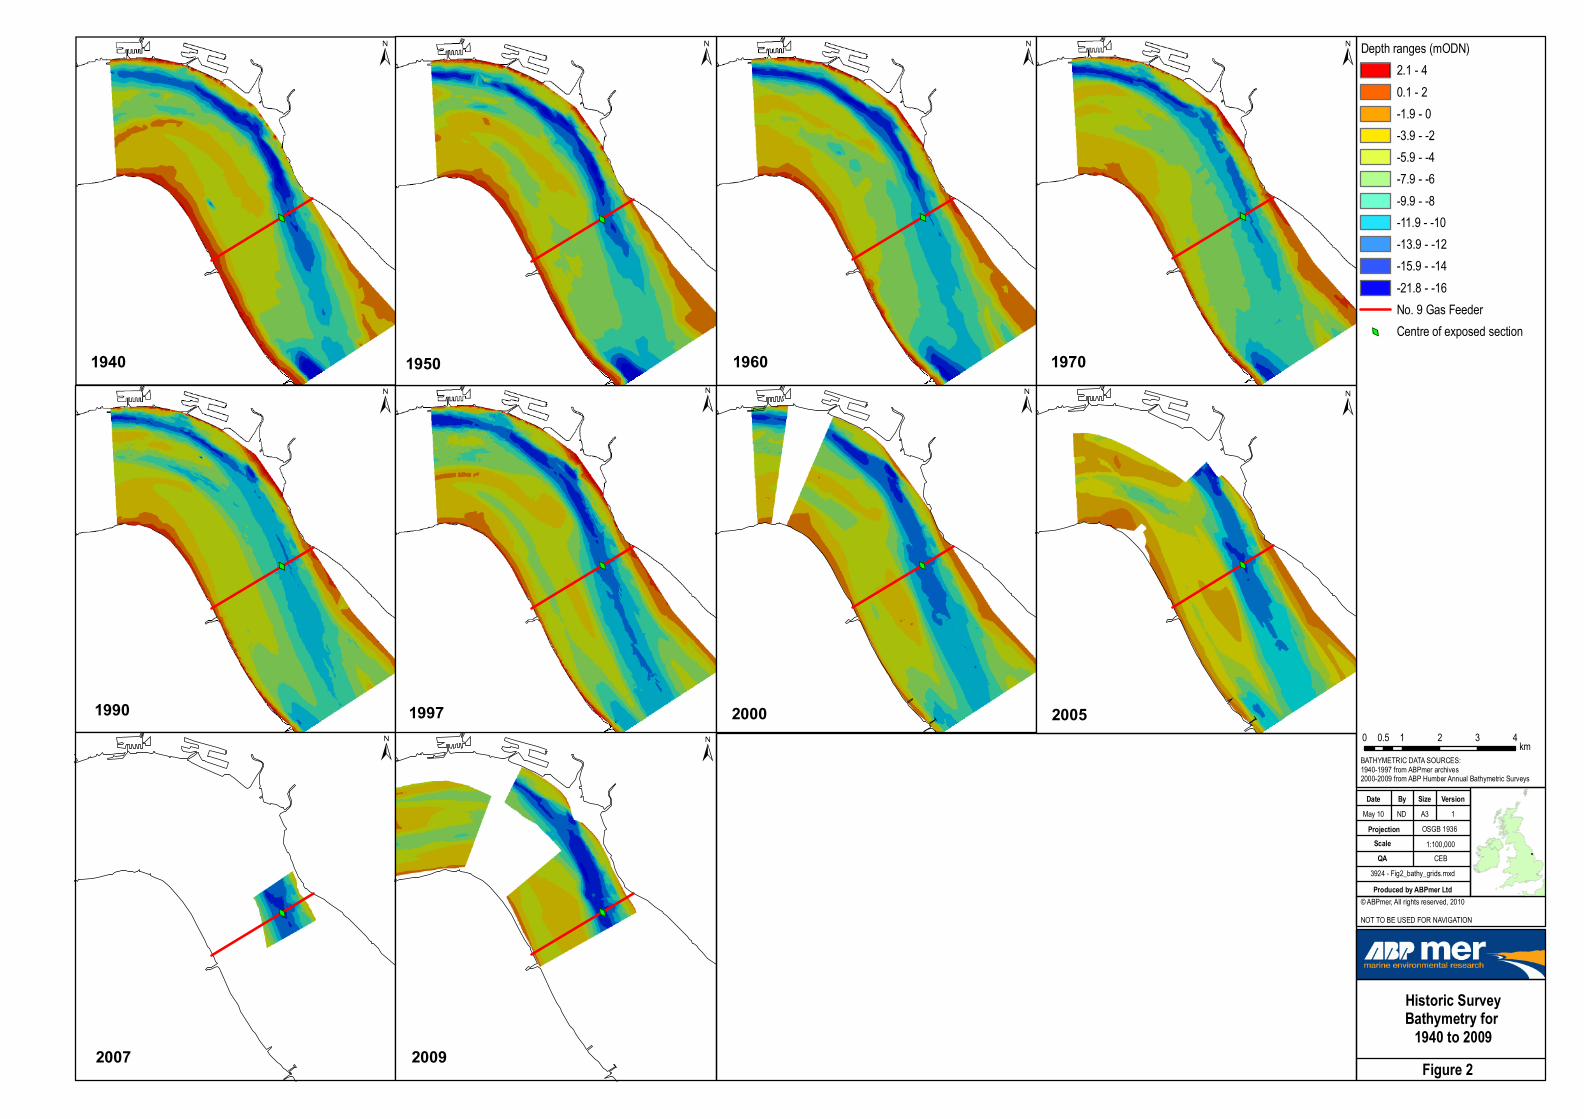
Historic SurveyBathymetry for
1940 to 2009
Date
May 10
By
ND
Size
A3
Version
1
3924 - Fig2_bathy_grids.mxd
Scale
Projection OSGB 1936
© ABPmer, All rights reserved, 2010
NOT TO BE USED FOR NAVIGATION
Produced by ABPmer Ltd
1:100,000
Figure 2
QA CEB
1940 1950 1960 1970
1990 1997 2000 2005
2007 2009
2.1 - 4
0.1 - 2
-1.9 - 0
-3.9 - -2
-5.9 - -4
-7.9 - -6
-9.9 - -8
-11.9 - -10
-13.9 - -12
-15.9 - -14
-21.8 - -16
No. 9 Gas Feeder
Centre of exposed section
Depth ranges (mODN)
0 1 2 3 40.5km
BATHYMETRIC DATA SOURCES:1940-1997 from ABPmer archives2000-2009 from ABP Humber Annual Bathymetric Surveys
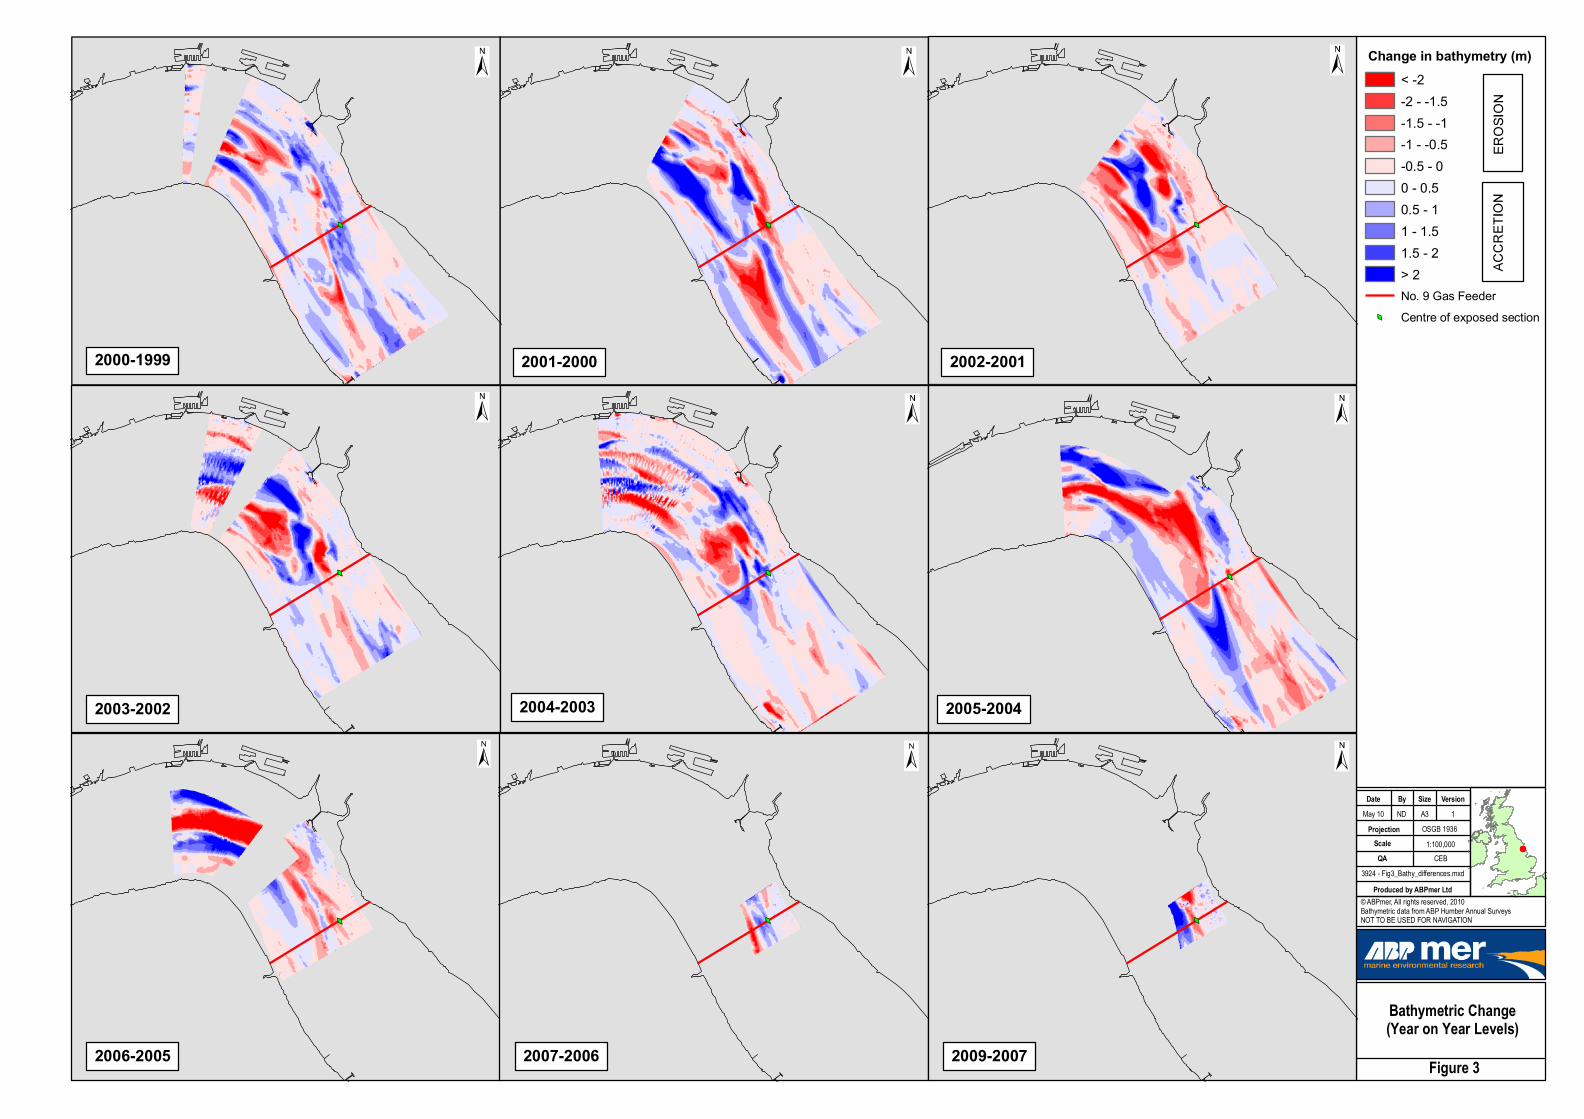
Bathymetric Change(Year on Year Levels)
Date
May 10
By
ND
Size
A3
Version
1
3924 - Fig3_Bathy_differences.mxd
Scale
Projection OSGB 1936
© ABPmer, All rights reserved, 2010Bathymetric data from ABP Humber Annual SurveysNOT TO BE USED FOR NAVIGATION
0 0.8 1.6 2.4 3.20.4km
< -2
-2 - -1.5
-1.5 - -1
-1 - -0.5
-0.5 - 0
0 - 0.5
0.5 - 1
1 - 1.5
1.5 - 2
> 2
No. 9 Gas Feeder
Centre of exposed section
Produced by ABPmer Ltd
1:100,000
Figure 3
QA CEB
2000-1999 2001-2000 2002-2001
2003-2002 2004-2003 2005-2004
2006-2005 2007-2006 2009-2007
Change in bathymetry (m)

Bathymetric Change(Relative to 1999 levels)
Date
May 10
By
ND
Size
A3
Version
1
3924 - Fig4_Bathy_differences.mxd
Scale
Projection OSGB 1936
© ABPmer, All rights reserved, 2010Bathymetric data from ABP Humber Annual SurveysNOT TO BE USED FOR NAVIGATION
0 0.8 1.6 2.4 3.20.4km
< -2
-2 - -1.5
-1.5 - -1
-1 - -0.5
-0.5 - 0
0 - 0.5
0.5 - 1
1 - 1.5
1.5 - 2
> 2
No. 9 Gas Feeder
Centre of exposed section
Produced by ABPmer Ltd
1:100,000
Figure 4
QA CEB
2000-1999 2001-1999 2002-1999
2003-1999 2004-1999 2005-1999
2006-1999 2007-1999 2009-1999
Change in bathymetry (m)
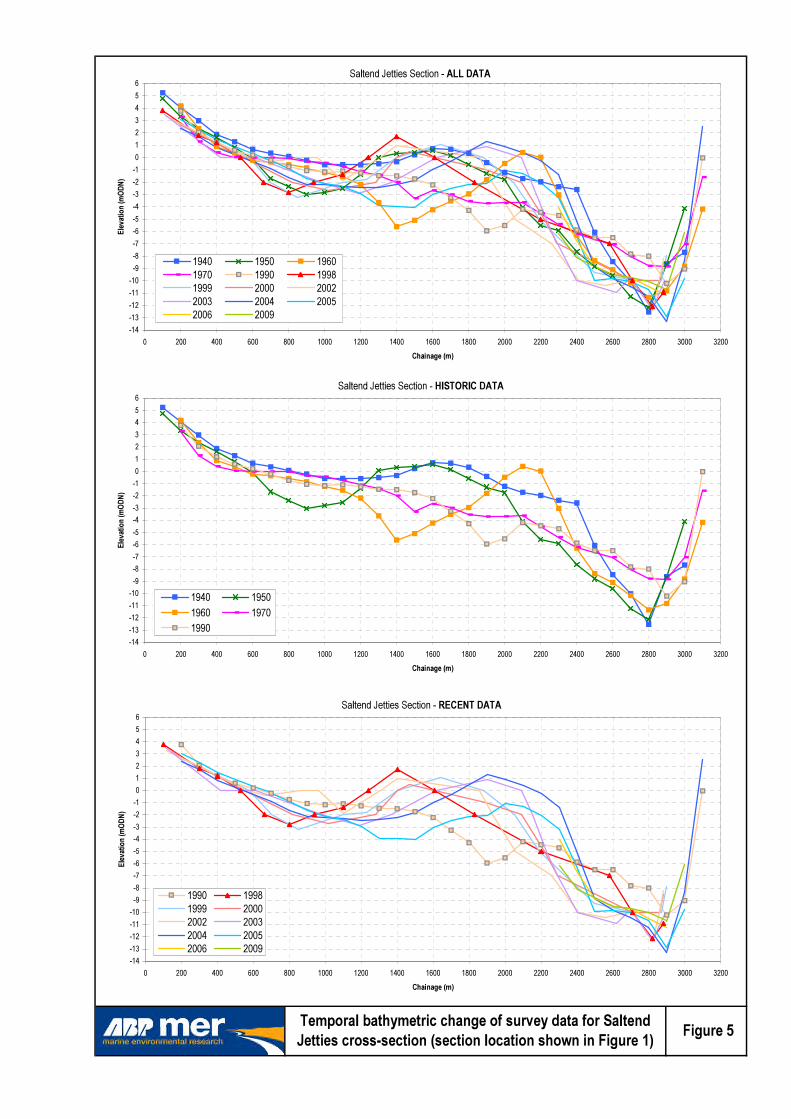


Historic Chart Bathymetryfor 1851 to 1936
Date
Jun 10
By
AMF
Size
A4
Version
1
3924 - fig_historic_bathy.mxd
Scale
Projection OSGB 1936
© ABPmer, All rights reserved, 2010NOT TO BE USED FOR NAVIGATION
Produced by ABPmer Ltd
1:100,000
Figure 8
QA PAN
0 1 2 3 40.5km
Depth ranges (mODN)
> 2
0.1 - 2
-1.9 - 0
-3.9 - -2
-5.9 - -4
-7.9 - -6
-9.9 - -8
-11.9 - -10
-13.9 - -12
-15.9 - -14
< -16
No.9 Gas Feeder Pipeline
Centre of exposed section
UK Coastline
1851
193619251910
19001875