ristics, in such fields as superconductivity, tunneling - hal
TRANSCRIPT
HAL Id: jpa-00244064https://hal.archives-ouvertes.fr/jpa-00244064
Submitted on 1 Jan 1976
HAL is a multi-disciplinary open accessarchive for the deposit and dissemination of sci-entific research documents, whether they are pub-lished or not. The documents may come fromteaching and research institutions in France orabroad, or from public or private research centers.
L’archive ouverte pluridisciplinaire HAL, estdestinée au dépôt et à la diffusion de documentsscientifiques de niveau recherche, publiés ou non,émanant des établissements d’enseignement et derecherche français ou étrangers, des laboratoirespublics ou privés.
Combined use of a lock-in detector and a multichannelanalyser for 1/f noise application to tunneling
spectroscopyA. Léger, B. Delmas, J. Klein, S. De Cheveigne
To cite this version:A. Léger, B. Delmas, J. Klein, S. De Cheveigne. Combined use of a lock-in detector and a multichannelanalyser for 1/f noise application to tunneling spectroscopy. Revue de Physique Appliquee, 1976, 11(2), pp.309-319. <10.1051/rphysap:01976001102030900>. <jpa-00244064>

309
COMBINED USE OF A LOCK-IN DETECTOR AND A MULTICHANNELANALYSER FOR 1/f NOISE
APPLICATION TO TUNNELING SPECTROSCOPY (*)
A. LÉGER, B. DELMAS, J. KLEIN and S. DE CHEVEIGNE
Groupe de Physique des Solides de l’Ecole Normale Supérieure (**),Tour 23, 2, place Jussieu, 75221 Paris Cedex 05, France
(Reçu le 4 août 1975, accepté le 8 octobre 1975)
Résumé. 2014 En spectroscopie par effet tunnel, il est très important d’obtenir un bon rapportsignal sur bruit (S/B), cela a en effet souvent permis la découverte de nouveaux effets. La méthodehabituelle pour obtenir les caractéristiques des jonctions tunnel consiste à leur appliquer une tensionde modulation autour d’une polarisation continue, puis à détecter l’harmonique convenable avecune détection synchrone. On pourrait penser pouvoir augmenter indéfiniment le rapport S/B enaugmentant la constante de temps de l’appareil (ainsi que la durée du balayage), mais l’expériencemontre que cela est illusoire, voire néfaste, au-dessus de quelques secondes. Ceci provient decertaines fluctuations basse fréquence de l’appareillage mais aussi de celles qui sont inhérentes à lacaractéristique de la jonction elle-même et qui échappent au déplacement vers les hautes fréquencesqu’effectue la détection synchrone. Nous proposons d’utiliser un ensemble détection synchrone-analyseur multicanal afin de réaliser la moyenne de plusieurs (n) balayages, effectués rapidement,au lieu de n’en effectuer qu’un seul de longue durée. Nous calculons le rapport S/B lors d’une telleopération, et nous montrons que le résultat dépend complètement de la forme de la densité spec-trale du bruit de caractéristique. Pour le cas d’un spectre en 1/f, on gagne un facteur important(n)par rapport à la méthode traditionnelle, ceci pour un même temps total d’expérience. Nous décri-vons un montage qui permet d’adapter un multicanal commercial au tracé des caractéristiques dejonctions, et nous effectuons des expériences qui illustrent les avantages de la méthode. En conclu-sion, nous insistons sur le fait que cette façon de procéder permet d’améliorer indéfiniment lerapport S/B lorsqu’on augmente le temps d’expérience, et qu’elle peut s’appliquer à de nombreusesautres spectroscopies.
Abstract. 2014 Obtaining a good signal-to-noise ratio (S/N) is of great importance in tunnelingspectroscopy, as it has often led to the discovery of new phenomena. The quantities of interestare the derivatives of the tunnel junction I-V curve ; the usual approach to obtain thesecharacteristics is to apply a modulation voltage around a D. C. bias and to detect the properharmonic with a lock-in detector. In order to improve the S/N ratio, one would think of increasingthe detector time-constant (and total sweep time), but experimentalists know that, above a fewseconds, such an increase is illusive and even misleading. This is because there are low frequencyinstabilities in the equipment, but also because there is noise present in the junction characteristicitself. The combined use of a lock-in detector and a multichannel analyser is proposed, in order toaverage a large number (n) of short sweeps instead of using one single long sweep. The S/N ratiois calculated for such an experiment, and it is found that it depends strongly upon the noise spectraldensity. For a 1/f spectrum a large improvement (n) is obtained with respect to the usual method,for the same total experimental duration. A system for adapting a commercial multichannel to theplotting of junction characteristics is described, and experiments are performed that demonstratethe advantages of this method. In conclusion, it is emphasized that the limit of the possible impro-vement of the S/N ratio in tunneling spectroscopy is removed and that the system can be appliedto many other types of spectroscopy.
REVUE DE PHYSIQUE APPLIQUÉE TOME I1, MARS 1976, PAGE
ClassificationPhysics Abstracts8.348 - 0.660
1. Introduction. - 1.1 THE IMPORTANCE OF A GOODSIGNAL-TO-NOISE RATIO IN TUNNELING SPECTROSCOPY. -
During the last decade, tunnel junctions have beenintensively studied since considerable physical infor-
(*) Work supported, in part, by the D. R. M. E. contractn° 73/683.
(**) Laboratory associated with the C. N. R. S. and the Uni-versity of Paris VII.
mation can be obtained from their electrical characte-ristics, in such fields as superconductivity, tunnelingspectroscopy... [1 ]. Because physical effects are reflectedby small changes in the I(V) curves, the informationthat can be extracted depends largely on the resolutionachieved in the plots. As experimental techniques haveimproved, new effects have been discovered [2].Numerous systems designed to determine the first,
second and third derivatives of the I(Y) curves have
Article published online by EDP Sciences and available at http://dx.doi.org/10.1051/rphysap:01976001102030900
310
been constructed and described in the literature [3, 4,5]. Circuitry capable of resolving relative changes ofthe conductance (03B403C3/03C3) of 10- 5 has been reported [4],but experimentalists in the field, however, knowthat such resolution is illusory because junctions maybe too noisy to allow the ultimate sensitivity of theinstruments to be used.
In this paper, we investigate various aspects of suchnoise and we describe a system which gives a bettersignal to noise ratio (S/N) than conventional methods.It becomes possible to use noisy junctions in which,previously, small physical peaks could not be distin-guished from erratic phenomena.Of course, such a system can be applied to many
fields other than tunneling.In order to extract the signal from noise, it is conven-
tional, in tunneling spectroscopy, to use a lock-indetector. In theory, the S/N ratio increases, in power,as the lock-in time constant z. In practice, experimen-talists know that often, when ’t is increased above 1to 10 s, the S/N ratio is not signifigantly improved.
1.2 NOISE ENCOUNTERED IN TUNNEL JUNCTIONS. -
Two different types of noise are met in tunnel junc-tions :
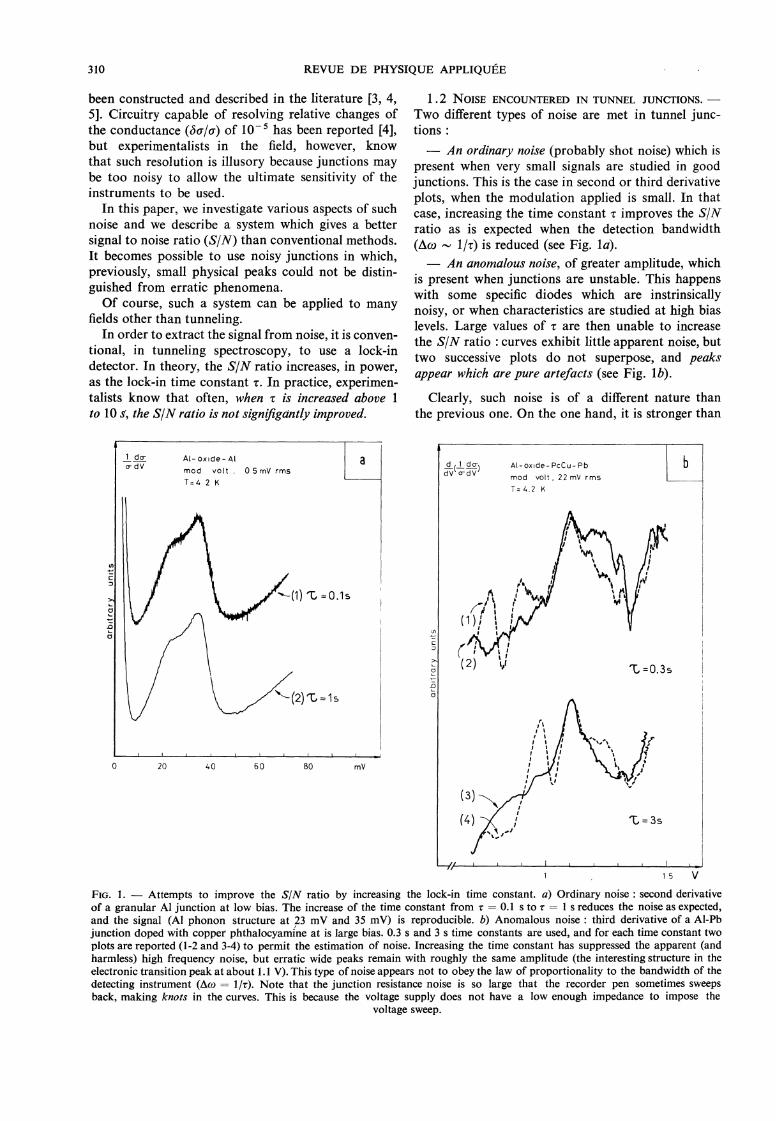
- An ordinary noise (probably shot noise) which ispresent when very small signals are studied in goodjunctions. This is the case in second or third derivativeplots, when the modulation applied is small. In thatcase, increasing the time constant 03C4 improves the S/Nratio as is expected when the detection bandwidth(Aco - 1/r) is reduced (see Fig. la).- An anomalous noise, of greater amplitude, which
is present when junctions are unstable. This happenswith some specific diodes which are instrinsicallynoisy, or when characteristics are studied at high biaslevels. Large values of r are then unable to increasethe S/N ratio : curves exhibit little apparent noise, buttwo successive plots do not superpose, and peaksappear which are pure artefacts (see Fig. lb).
Clearly, such noise is of a different nature thanthe previous one. On the one hand, it is stronger than
FIG. 1. - Attempts to improve the S/N ratio by increasing the lock-in time constant. a) Ordinary noise : second derivativeof a granular Al junction at low bias. The increase of the time constant from z = 0.1 s to z = 1 s reduces the noise as expected,and the signal (Al phonon structure at 23 mV and 35 mV) is reproducible. b) Anomalous noise : third derivative of a Al-Pbjunction doped with copper phthalocyamine at is large bias. 0.3 s and 3 s time constants are used, and for each time constant twoplots are reported (1-2 and 3-4) to permit the estimation of noise. Increasing the time constant has suppressed the apparent (andharmless) high frequency noise, but erratic wide peaks remain with roughly the same amplitude (the interesting structure in theelectronic transition peak at about 1.1 V). This type of noise appears not to obey the law of proportionality to the bandwidth of thedetecting instrument (eco = 1/03C4). Note that the junction resistance noise is so large that the recorder pen sometimes sweepsback, making knots in the curves. This is because the voltage supply does not have a low enough impedance to impose the
voltage sweep.
311
ordinary noise, and on the other hand it violates therule of proportionality to the detection band width.In some cases, the S/N ratio is not even improvedwhen the signal is increased, for instance by increasingthe modulation amplitude. This last point is importantas it will lead us to an explanation of this anomalousnoise.
2. Study of the characteristic noise. - 2 .1 J UNC-TIONS WITH CHARACTERISTIC NOISE. : We shall first
briefly recall the principle of bias modulation used toobtain the derivatives of the I(V) curve of a dipole. Weshall take the experimentally important example of thesecond derivative d 2 Il d V2 . A voltage
is applied to the sample, with V03A9 Vo, and the result-ing current I[V(t)] is studied ; the second derivatived2I/dV2 is obtained from a synchronous detectorlocked at frequency 2 Q. Conventionally [6], the noiseis accounted for in such a measurement by introducinga superimposed noise function n(t) on the signal.A second order development, with respect to
V03A9/Vo, gives :
where :
n(t) is the noise function.A lock-in detector at frequency 2 Q, with a time-
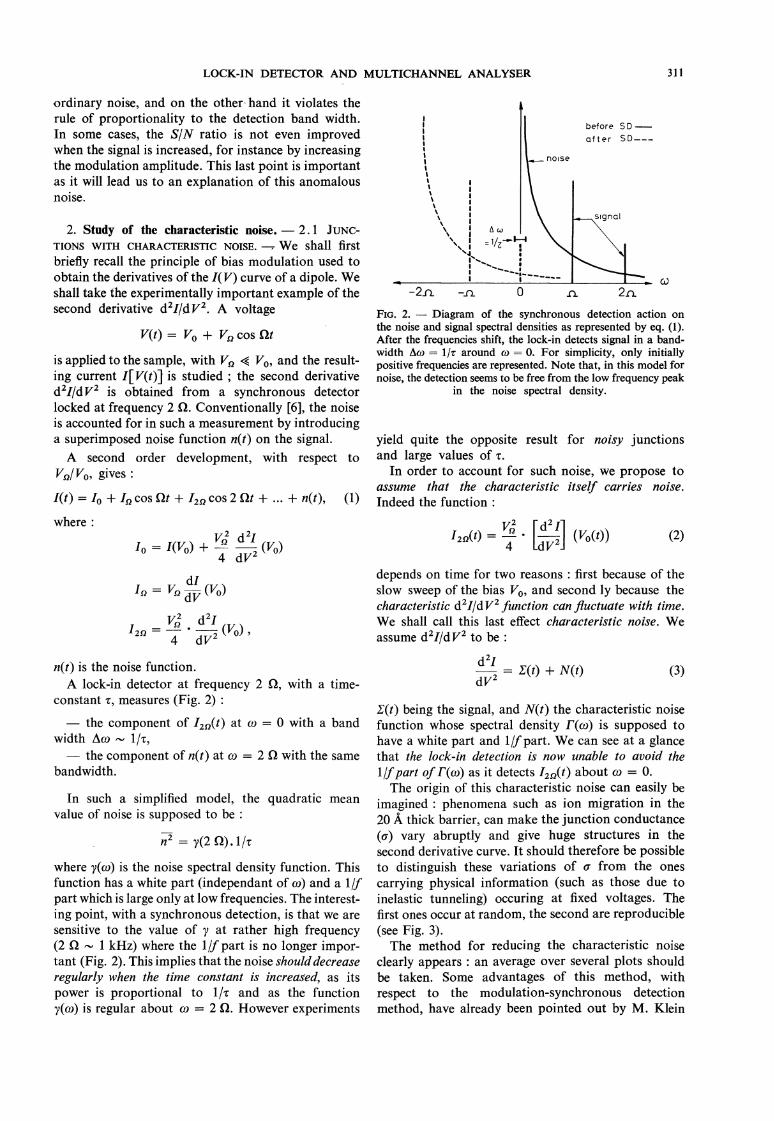
constant r, measures (Fig. 2) :- the component of 12Q(t) at co = 0 with a band
width 039403C9 ~ 1/i,- the component of n(t) at co = 2 Q with the same
bandwidth.
In such a simplified model, the quadratic meanvalue of noise is supposed to be :
where 03B3(03C9) is the noise spectral density function. Thisfunction has a white part (independant of co) and a 1/fpart which is large only at low frequencies. The interest-ing point, with a synchronous detection, is that we aresensitive to the value of y at rather high frequency(2 Sà N 1 kHz) where the 1 jf part is no longer impor-tant (Fig. 2). This implies that the noise should decreaseregularly when the time constant is increased, as its
power is proportional to 1/i and as the function
y(co) is regular about w = 2 Q. However experiments
FIG. 2. - Diagram of the synchronous detection action onthe noise and signal spectral densities as represented by eq. (1).After the frequencies shift, the lock-in detects signal in a band-width 039403C9 = 1/T around 03C9 = 0. For simplicity, only initiallypositive frequencies are represented. Note that, in this model fornoise, the detection seems to be free from the low frequency peak
in the noise spectral density.
yield quite the opposite result for noisy junctionsand large values of i.
In order to account for such noise, we propose toassume that the characteristic itself carries noise.
Indeed the function :
depends on time for two reasons : first because of theslow sweep of the bias Vo, and second ly because thecharacteristic d 2I/dV2 function can fluctuate with time.We shall call this last effect characteristic noise. Weassume d2IId V2 to be :
1(t) being the signal, and N(t) the characteristic noisefunction whose spectral density F(co) is supposed tohave a white part and 1 /f part. We can see at a glancethat the lock-in detection is now unable to avoid the
1/f part of 0393(03C9) as it detects f2g(t) about co = 0.The origin of this characteristic noise can easily be
imagined : phenomena such as ion migration in the20 Á thick barrier, can make the junction conductance(Q) vary abruptly and give huge structures in the
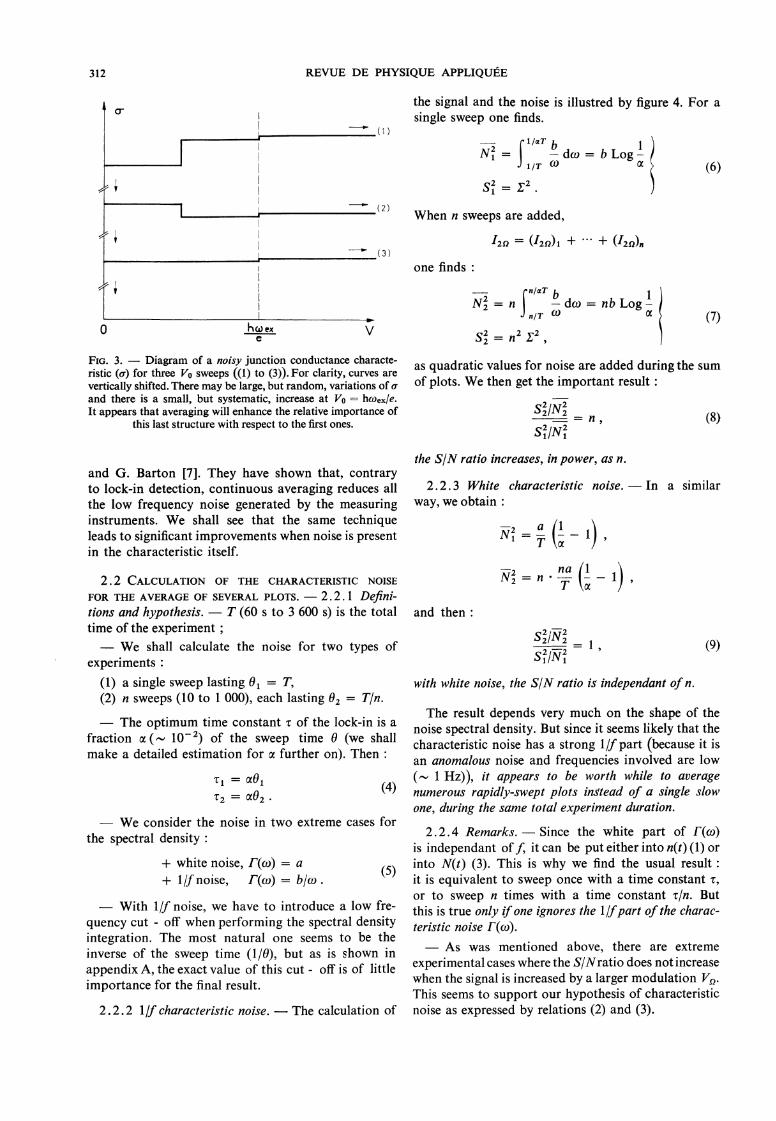
second derivative curve. It should therefore be possibleto distinguish these variations of u from the onescarrying physical information (such as those due toinelastic tunneling) occuring at fixed voltages. Thefirst ones occur at random, the second are reproducible(see Fig. 3).The method for reducing the characteristic noise
clearly appears : an average over several plots shouldbe taken. Some advantages of this method, with
respect to the modulation-synchronous detectionmethod, have already been pointed out by M. Klein
312
FIG. 3. - Diagram of a noisy junction conductance characte-ristic (u) for three Vo sweeps ((1) to (3)). For clarity, curves arevertically shifted. There may be large, but random, variations of Qand there is a small, but systematic, increase at Vo = hcoex/e.It appears that averaging will enhance the relative importance of
this last structure with respect to the first ones.
and G. Barton [7]. They have shown that, contraryto lock-in detection, continuous averaging reduces allthe low frequency noise generated by the measuringinstruments. We shall see that the same techniqueleads to significant improvements when noise is presentin the characteristic itself.
2.2 CALCULATION OF THE CHARACTERISTIC NOISE
FOR THE AVERAGE OF SEVERAL PLOTS. - 2.2.1 Defini-tions and hypothesis. - T (60 s to 3 600 s) is the totaltime of the experiment ;- We shall calculate the noise for two types of
experiments :(1) a single sweep lasting 01 = T,(2) n sweeps (10 to 1 000), each lasting O2 = T/n.- The optimum time constant i of the lock-in is a
fraction 03B1 (~ 10-2) of the sweep time 0 (we shallmake a detailed estimation for a further on). Then :
- We consider the noise in two extreme cases forthe spectral density :
- With 1/f noise, we have to introduce a low fre-quency cut - of’ when performing the spectral densityintegration. The most natural one seems to be theinverse of the sweep time (1/0), but as is shown in
appendix A, the exact value of this cut - off is of littleimportance for the final result.
2.2.2 111 characteristic noise. - The calculation of
the signal and the noise is illustred by figure 4. For asingle sweep one finds.
When n sweeps are added,
one finds :
as quadratic values for noise are added during the sumof plots. We then get the important result :
the SIN ratio increases, in power, as n.
2.2.3 White characteristic noise. - In a similar
way, we obtain :
and then :
with white noise, the S/N ratio is independant of n.
The result depends very much on the shape of thenoise spectral density. But since it seems likely that thecharacteristic noise has a strong 1/f part (because it isan anomalous noise and frequencies involved are low(N 1 Hz)), it appears to be worth while to averagenumerous rapidly-swept plots instead of a single slowone, during the same total experiment duration.
2.2.4 Remarks. - Since the white part of 0393(03C9)is independant of f, it can be put either into n(t) (1) orinto N(t) (3). This is why we find the usual result :it is equivalent to sweep once with a time constant i,or to sweep n times with a time constant z/n. Butthis is true only if one ignores the 1/f part of the charac-teristic noise 0393(03C9).- As was mentioned above, there are extreme
experimental cases where the S/Nratio does not increasewhen the signal is increased by a larger modulation Vn.This seems to support our hypothesis of characteristicnoise as expressed by relations (2) and (3).

313
FIG. 4. - a) Diagram of spectral densities of signal (03A303C9) and characteristic noise (039303C9). The characteristic noise has a 1/f partand a white part. The signal spectrum width is related to the inverse of the time necessary to sweep the sharpest peaks of thecharacteristic (tp). b) Integration of r(w) giving the characteristic noise for two experiments (1 and 2), with a 1/ f spectrum. The lowfrequency cut-offs are assumed to be the inverses of the sweep times (03B81 and 03B82), and the high frequency cut-offs are the inversesof the lock-in time constants (ri and T2). Note that, in this model, because of the low frequency divergence of 0393(03C9) the noise valuesare the same for a short sweep (1) and for a long one (2). On the contrary, an averaging procedure of n sweeps will reduce
the noise as n.
- It can now be explained why the S/N ratio is notimproved when the lock-in time constant is increasedabove a certain value (- 10 s). This value probablycorresponds to the frequency below which the 1/f partof the characteristic noise becomes preponderant.Then, eq. (6) indicates the independance of the SINratio with respect to i (or T).- Instabilities in the equipment, such as modulation
generator fluctuations, variations in the gain of ampli-fiers, etc..., can be treated in a similar way. The mea-sured quantity I2n(t), should be multiplied by (1 + 11(t»where flet) is a noise function with properties analogousto that of N(t). This is the calculation which has beendone by M. Klein and G. Barton [7] whose resultsagree with ours :
0 a lock-in detection at high frequency, does noteliminate all the low frequency noise produced by theequipment [8]0 an averaging method eliminates such noise.
In tunneling spectroscopy, it has been proposed [4]to balance the junction resistance with a passive ele-ment and use a bridge technique to eliminate thegenerator fluctuations. The averaging method appears
to be an alternative solution which works even whenthe junction resistance has large variations with theapplied bias, and moreover eliminates the lock-in
gain fluctuations.
3. System for averaging characteristics. - 3 .1 PRIN-CIPLE. - A system which is able to make thesum of several plots of a junction characteristic is
schematically described in figure 5. Conventional
circuitry [3, 4, 5] is used to obtain the desired characte-ristic Y(V) at the output of the lock-in. The D. C.supply provides recurrent sweeps and the multichannel
FIG. 5. - System making the sum of several plots of a junctioncharacteristic Y(Vo). Conventional bias modulation and harmo-nic detection are used to obtain Y at the lock-in output. Thejunction bias drives the X advance of the multichannel and, ateach step, the Y value is recorded and added to the content of the
corresponding channel.
314
makes the sum of the différent functions Y(V). Thechannel advance is driven by the D. C. voltage mea-sured across the junction ( Vo) and each channel recordsthe corresponding output of the lock-in, Y( Vo), byadding it to its pre-existing content.The main difference between this system and
M. Klein and G. Barton’s one [7], is the address advan-ce process. Here, the physical parameter (bias of thejunction) is measured and drives the x address whereasin their case the x address advance is meant to controlthe variation of the physical parameter. This is of
practical importance in tunneling because, in general, acurrent can be easily injected into a junction, but theresulting bias fluctuates with the junction resistanceand then it cannot be controlled by an external para-meter.
Clearly, this averaging system can be used for manyother spectroscopy experiments.
3.2 CIRCUITRY. - See appendix B.
3.3 OPTIMUM CHOICE OF THE PARAMETERS CONTROL-ING THE S/N RATIO. - As was seen in part 2 theparameters ruling the S/N ratio in an experiment arethe number n of plots to be summed and the lock-intime constant T. Their possible optimisation is now
discussed, assuming a given total experiment time Tand a given requirement for the resolution of peaks inthe characteristics.
3.3.1 Choice of the sweep time. - The SIN ratioincreases with the number n of plots (eq. (8)) ; there-fore the sweep time 0 = T/n should be chosen as
small as possible, but there are limitations :
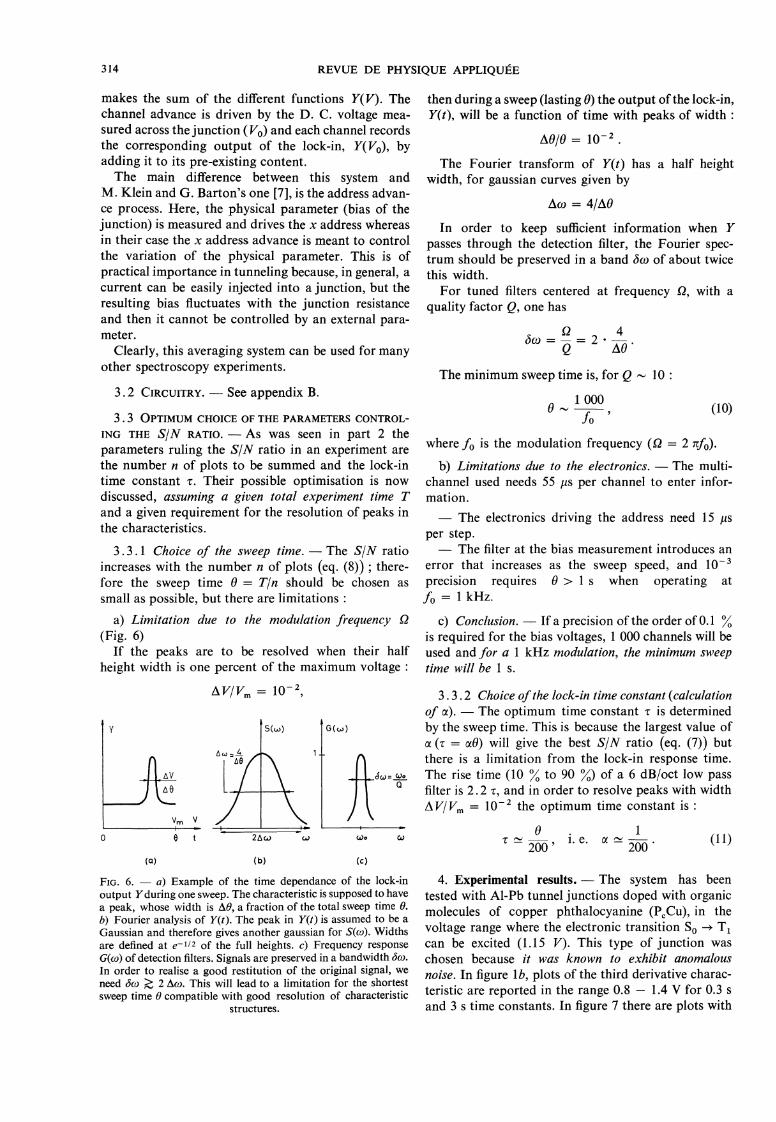
a) Limitation due to the modulation frequency Q(Fig. 6)
If the peaks are to be resolved when their half
height width is one percent of the maximum voltage :
FIG. 6. - a) Example of the time dependance of the lock-inoutput Y during one sweep. The characteristic is supposed to havea peak, whose width is 039403B8, a fraction of the total sweep time 0.b) Fourier analysis of Y(t). The peak in Y(t) is assumed to be aGaussian and therefore gives another gaussian for 8(0). Widthsare defined at e-1/2 of the full heights. c) Frequency responseG(cv) of detection filters. Signals are preserved in a bandwidth àcv.In order to realise a good restitution of the original signal, weneed 03B403C9 2 Am. This will lead to a limitation for the shortestsweep time 0 compatible with good resolution of characteristic
structures.
then during a sweep (lasting 0) the output of the lock-in,Y(t), will be a function of time with peaks of width :
The Fourier transform of Y(t) has a half heightwidth, for gaussian curves given by
In order to keep sufficient information when Y
passes through the detection filter, the Fourier spec-trum should be preserved in a band 03B403C9 of about twicethis width.For tuned filters centered at frequency Q, with a
quality factor Q, one has
The minimum sweep time is, for Q - 10 :
where fo is the modulation frequency (Q = 2 nfo).
b) Limitations due to the electronics. - The multi-channel used needs 55 ,us per channel to enter infor-mation.
- The electronics driving the address need 15 pis
per step.- The filter at the bias measurement introduces an
error that increases as the sweep speed, and 10-3precision requires 0 > 1 s when operating at
fo = 1 kHz.
c) Conclusion. - If a precision of the order of 0.1 %is required for the bias voltages, 1 000 channels will beused and for a 1 kHz modulation, the minimum sweeptime will be 1 s.
3 . 3 . 2 Choice of the lock-in time constant (calculationof a). - The optimum time constant r is determinedby the sweep time. This is because the largest value ofa (r = 03B103B8) will give the best S/N ratio (eq. (7)) butthere is a limitation from the lock-in response time.The rise time (10 % to 90 %) of a 6 dB/oct low passfilter is 2.2 T, and in order to resolve peaks with width0394V/Vm = 10- 2 the optimum time constant is :
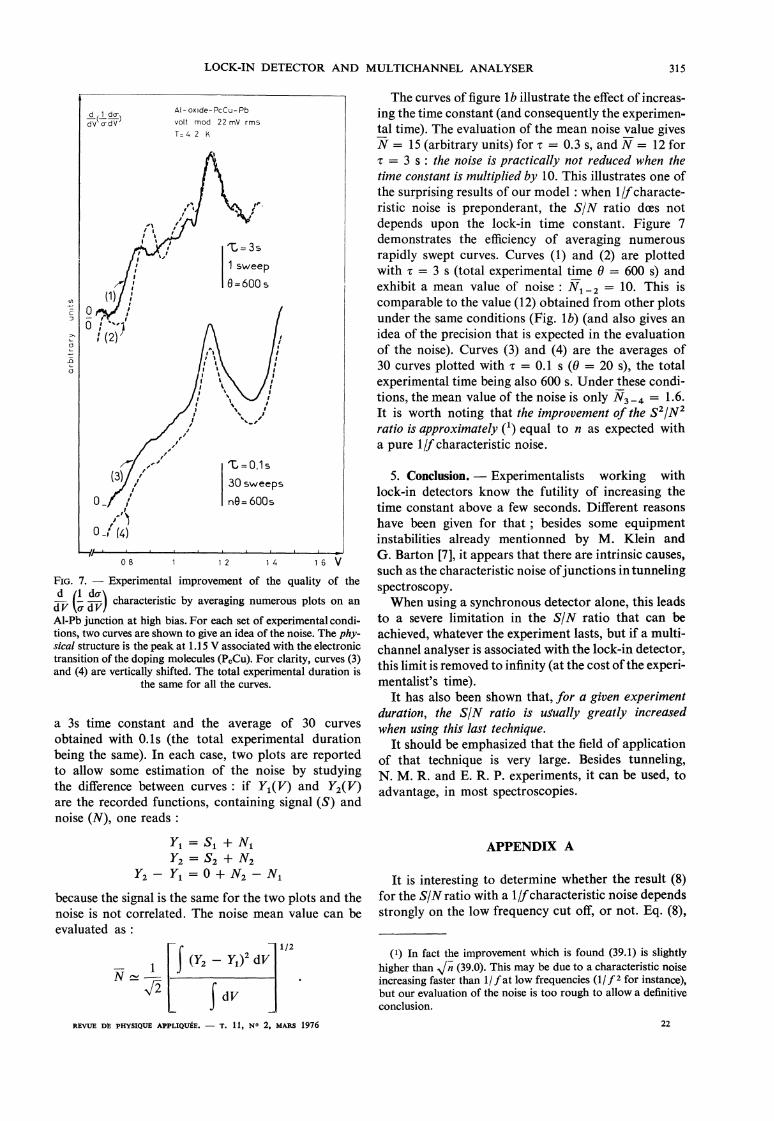
4. Expérimental results. - The system has been
tested with Al-Pb tunnel junctions doped with organicmolecules of copper phthalocyanine (PcCu), in the
voltage range where the electronic transition S0 ~ Tlcan be excited (1.15 V). This type of junction waschosen because it was known to exhibit anomalousnoise. In figure lb, plots of the third derivative charac-teristic are reported in the range 0.8 - 1.4 V for 0.3 sand 3 s time constants. In figure 7 there are plots with
315
FIG. 7. - Experimental improvement of the quality of the
d dV(1 03C3 d V characteristic by averaging numerous plots on anAl-Pb junction at high bias. For each set of experimental condi-tions, two curves are shown to give an idea of the noise. The phy-sical structure is the peak at l.l 5 V associated with the electronictransition of the doping molecules (PcCu). For clarity, curves (3)and (4) are vertically shifted. The total experimental duration is
the same for all the curves.
a 3s time constant and the average of 30 curves
obtained with O.ls (the total experimental durationbeing the same). In each case, two plots are reportedto allow some estimation of the noise by studyingthe difference between curves : if Y1(V) and Y2(V)are the recorded functions, containing signal (S) andnoise (N), one reads :
because the signal is the same for the two plots and thenoise is not correlated. The noise mean value can beevaluated as :
REVUE DE PHYSIQUE APPLIQUÉE. - T. 11, N- 2, MARS 1976
The curves of figure 1 b illustrate the effect of increas-ing the time constant (and consequently the experimen-tal time). The evaluation of the mean noise value givesN = 15 (arbitrary units) for r = 0.3 s, and N = 12 fori = 3 s : the noise is practically not reduced when thetime constant is multiplied by 10. This illustrates one ofthe surprising results of our model : when 1 If characte-ristic noise is preponderant, the S/N ratio does notdepends upon the lock-in time constant. Figure 7
demonstrates the efficiency of averaging numerousrapidly swept curves. Curves (1) and (2) are plottedwith r = 3 s (total experimental time 0 = 600 s) andexhibit a mean value of noise : N1-2 = 10. This is
comparable to the value (12) obtained from other plotsunder the same conditions (Fig. 1 b) (and also gives anidea of the precision that is expected in the evaluationof the noise). Curves (3) and (4) are the averages of30 curves plotted with r = 0.1 s (0 = 20 s), the totalexperimental time being also 600 s. Under these condi-tions, the mean value of the noise is only N3-4 = 1.6.It is worth noting that the improvement of the S2 IN 2ratio is approximately (1) equal to n as expected witha pure Ilf characteristic noise.
5. Conclusion. - Experimentalists working withlock-in detectors know the futility of increasing thetime constant above a few seconds. Different reasonshave been given for that ; besides some equipmentinstabilities already mentionned by M. Klein andG. Barton [7], it appears that there are intrinsic causes,such as the characteristic noise of junctions in tunnelingspectroscopy.When using a synchronous detector alone, this leads
to a severe limitation in the S/N ratio that can beachieved, whatever the experiment lasts, but if a multi-channel analyser is associated with the lock-in detector,this limit is removed to infinity (at the cost of the experi-mentalist’s time).
It has also been shown that, for a given experimentduration, the S/N ratio is usually greatly increasedwhen using this last technique.
It should be emphasized that the field of applicationof that technique is very large. Besides tunneling,N. M. R. and E. R. P. experiments, it can be used, toadvantage, in most spectroscopies.
APPENDIX A
It is interesting to determine whether the result (8)for the SIN ratio with a 1/f characteristic noise dependsstrongly on the low frequency cut off, or not. Eq. (8),
(1) In fact the improvement which is found (39.1) is slightlyhigher than .Jn (39.0). This may be due to a characteristic noiseincreasing faster than 1/ f at low frequencies (1/f2 for instance),but our evaluation of the noise is too rough to allow a definitiveconclusion.

316
was obtained using a cut-off given by the inverse of thesweep time. Another possibility is to assume that thereis some physical time 13 which gives this cut off forthe spectrum (with -G » 03C4).
Calculations are straight forward :
which leads to :
Thus, according to the exact relative value of ’GITand n the S/N improvement (r) may vary from n to1 + n/Log n. For large values of n, these figures areof the same order of magnitude and it appears thatresult (8) is but weakly sensitive to the low frequencycut off
APPENDIX B
Circuitry of the system. - Figure 8 outlines a
system that sums several plots of the conductancelogarithmic derivative
FIG. 8. - Block diagram of circuitry.
The circuitry used to obtain this characteristic atthe output of the lock-in is described in reference [5].The multichannel is a Didac 4 000 of Intertechnique
operating in the Multiscale mode. The arithmetic
register ( Y) capacity is 106 and the X address includes4 000 channels. The Didac 4000, like most multi-
channels, is made to analyse recurrent signals as afunction of time : the advance from one channel to thenext is driven by an internal clock. But in tunneling, theimportant parameter is the D. C. voltage across thejunction and not the time. Moreover, the sweep ofthis voltage is not necessarily linear as a function oftime, or even reproducible (for instance if the junctionresistance changes during the experiment). We there-fore had to build an address advance driven by thebias Vo. A converter was used for purpose, giving avoltage Vx proportional to the channel number and Vois continuously compared with this value V. (Fig. 9)
FIG. 9. - Address advance for the multichannel.
when Vo = Vx, the address is ordered to advance onechannel and a measurement of the lock-in outputsignal Y is performed and stored in the correspondingchannel. Let us examine, in some detail, the D. C.supply and this channel advance system, after which weshall study the detection filters and the groundingproblem.
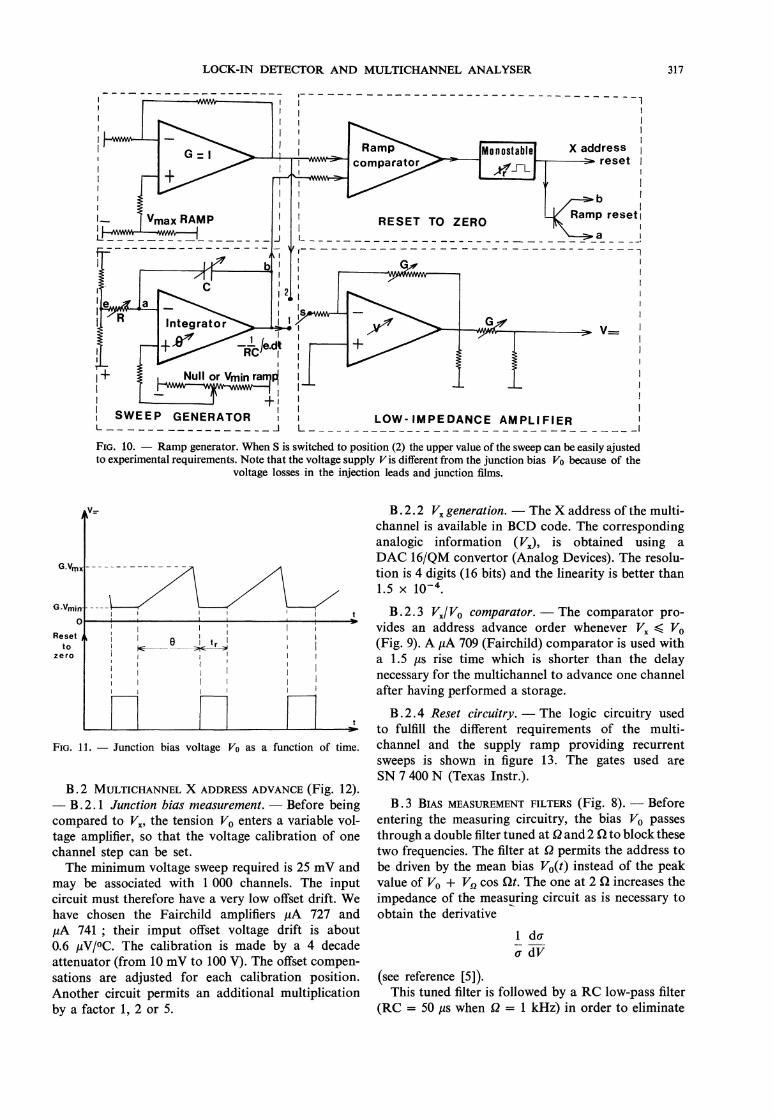
B .1 D. C. SUPPLY (Fig. 10). - The D. C. supplyis made with an operational amplifier working as anintegrator. The sweep time 0 (RC) can vary from0.1 to 500 s. The integrator is followed by a variablevoltage amplifier with a low impedance output. Theupper value of the sweep can be selected from 50 mVto 5 V. The end of the ramp is ordered by a compara-tor : when Vo reaches its upper value a signal resets tozero both the multichannel X address and the ramp.This reset signal is provided by a mono-stable oscil-lator ; therefore a rest time (tir) can be assigned bet-ween two sweeps. tr is variable from 0.1 to 10 s (Fig.11). The minimum value of Yo may be adjusted, from0 to 4/5 of its maximum value, if a partial scanning ofthe junction bias is required.
317
FIG. 10. - Ramp generator. When S is switched to position (2) the upper value of the sweep can be easily ajustedto experimental requirements. Note that the voltage supply V is different from the junction bias Vo because of the
voltage losses in the injection leads and junction films.
FIG. 11. - Junction bias voltage Vo as a function of time.
B. 2 MULTICHANNEL X ADDRESS ADVANCE (Fig. 12).- B. 2.1 Junction bias measurement. - Before beingcompared to Vx, the tension Vo enters a variable vol-tage amplifier, so that the voltage calibration of onechannel step can be set.The minimum voltage sweep required is 25 mV and
may be associated with 1 000 channels. The inputcircuit must therefore have a very low offset drift. Wehave chosen the Fairchild amplifiers MA 727 andMA 741 ; their imput offset voltage drift is about0.6 03BCV/°C. The calibration is made by a 4 decadeattenuator (from 10 mV to 100 V). The offset compen-sations are adjusted for each calibration position.Another circuit permits an additional multiplicationby a factor 1, 2 or 5.
B. 2. 2 YR generation. - The X address of the multi-channel is available in BCD code. The correspondinganalogic information (Vx), is obtained using a
DAC 16/QM convertor (Analog Devices). The resolu-tion is 4 digits (16 bits) and the linearity is better than1.5 x 10-4.
B.2.3 Yx/Yo comparator. - The comparator pro-vides an address advance order whenever Vx Vo(Fig. 9). A MA 709 (Fairchild) comparator is used witha 1.5 03BCs rise time which is shorter than the delaynecessary for the multichannel to advance one channelafter having performed a storage.B.2.4 Reset circuitry. - The logic circuitry used
to fulfill the différent requirements of the multi-channel and the supply ramp providing recurrent
sweeps is shown in figure 13. The gates used are
SN 7 400 N (Texas Instr.).
B. 3 BIAS MEASUREMENT FILTERS (Fig. 8). - Beforeentering the measuring circuitry, the bias Vo passesthrough a double filter tuned at Q and 2 Q to block thesetwo frequencies. The filter at Q permits the address tobe driven by the mean bias Vo(t) instead of the peakvalue of Vo + VD cos 03A9t. The one at 2 Q increases theimpedance of the measuring circuit as is necessary toobtain the derivative
(see reference [5]).This tuned filter is followed by a RC low-pass filter
(RC = 50 ps when Q = 1 kHz) in order to eliminate

318
FIG. 12. - Multichannel address advance.
FIG. 13. - Logic circuitry.
any high frequency picked up by the sample. This RCfilter reduces the measured voltages in a calibrated way( - 2 %) as does our other derivative equipment, whichmakes the resulting plots directly comparable to ourusual ones.
B . 4 GROUNDING PROBLEM (Fig. 8). - The ground-ing problem is of special importance in the electronicsof tunneling as four probe measurements are necessaryfor the D. C. and A. C. voltages, and ground loopsmust be avoided. This prevents the use of the shield
ground for the different circuits. In this equipment,three grounds are used : Po, Pi and P2. The multi-channel and the logic circuits are operating with thechassis-shield (Po). The grounds of the supplies (P1)and measuring circuits (P2) are connected to the
ground Po in a single and commun point. Consequen-tly, there is a multiplication (by 3) of the differentspower supplies (- 12 and + 12 V, - 15 and + 15 V,+ 5 V). When connections are necessary betweenthem (in the logic circuitry), the different points Po, P1,P2 are connected by field effect transistors.

319
B. 5 READING OUT OF RESULTS. - In order to readout the curves stored in the multichannel, the internalconverter is used for X data ; but for Y data, theconverter that is already used in Vx generation, is
preferred because it gives a better resolution
(104 points). The X channel advance is driven by anelectronic clock (SFC 413) working from 1 to 100 chan-nels/s.
References
[1] See for instance : DUKE, C. B., Tunneling in Solids (AcademicPress, N. Y.) 1969.
[2] ROWELL, J. M., CHYNOWETH, A. G. and PHILIPPS, J. C.,Phys. Rev. Lett. 9 (1962) 59.
[3] GAUDEFROY-DEMONBYNES, A., GUYON, E., MARTINET, A. etSANCHEZ, J., Revue Phys. Appl. 1 (1966) 18.
[4] ADLER, J. G., CHEN, T. T. and STRAUS, J., Rev. Sci. Instrum.42 (1971) 362.
[5] KLEIN, J., LÉGER, A., DELMAS, B., DE CHEVEIGNE, S., Rev.Phys. Appl. (ce numéro).
[6] See for instance : ANDREW, E. R., Nuclear Magnetic Reso-nance (Cambridge Univ. Press. N. Y.) 1958 ;
GRIVET, P., BLAQUIÈRE, A., Le bruit de fond (ed. Masson, Paris).[7] KLEIN, M. P. and BARTON, G. W., Rev. Sci. Instrum. 34
(1963) 754.[8] See also : TOWNES, C. H. and SCHAWLOW, A. L., Microwave
Spectroscopy (Mc Graw-Hill, N. Y.) 1955, p. 408.