risked-based development and cmc question-based review: asking the right questions for process...
TRANSCRIPT

Risked-Based Development and CMC Question-Based Review:
Asking the Right Questions for Process Understanding, Control and Filing
Kenneth R. Morris, Ph.D.Department of Industrial and Physical Pharmacy
Purdue University
OPS-SABJuly 20th, 2004

Current vs. QBD Desired State Companies may or may not have
info but it’s not always in the filing
Reviewers must go through cycle of info requests and questions
Companies may or may not have clear scientific rationales for choices but are not always sharing it.
Reviewers must often “piece together” data and observations to discover the rationale for a spec, method, formula, process, etc.
Reviewers are analyzing the data they often must tease out of the company
Companies include needed Companies include needed data with filing and could data with filing and could share it prior to the filingshare it prior to the filing
Companies include the Companies include the data analysis to produce data analysis to produce meaningful summaries and meaningful summaries and scientific rationalesscientific rationales
Reviewers assess the Reviewers assess the rationales and summarized rationales and summarized data presentations as data presentations as satisfactory or notsatisfactory or not

Risk Based Development: a simple concept
1. Use sound scientific principles in the design of the DF and Process
2. Identify the critical attributes (CAs) for the raw materials
3. Identify the process critical control points for the processes (PCCPs)
4. Employ the proper analyses and PAT concepts for process understanding and control
5. Tie it all together with the appropriate informatics to feed the information forward and backwards for QbD and continuous improvement and innovation = reduced risk
Associated regulatory question rationale?

Risked Based Development - RBD
RBD is all about “feeding forward” (after Ali Afnan)
1. Exploring the characteristics of the RMs, and possible variability in RM and processing that are expected to impact on required DF performance
2. Deciding on a DF based on #1 (+ business case) and selection of possible processes
3. Deciding what data are necessary to access the probable success of #2 (1st,principles, lit, DOE)
4. Collect and analyze the data (here comes PAT) Gap analysis - refining models as development
proceeds
5. Continuous improvement

Example: Solid Oral Dosage Forms
Does it work?
Can we make it?

How realistic is RBD? As all good pharm. Scientist/Engineer know:
• A formula without a process is (e.g.) a pile of powder
Even during API characterization, developing a formula implies an expected DF and process or range of choices (e.g., you don’t use compaction aids for lyophiles)
So API characteristics are among the 1st information you need to feed forward
So what’s different about the new GMP? Models, data, and informatics – the process!

Accessing solubility impact at preformulation:Yalkowsky’s Modified Absorption Parameter (QSAR & Combinatorial Science, 22, 247-257 2003)
Relationship to human intestinal fraction absorbed, FA, to the absorption parameter, , of the ‘rule of unity’
Lumen
ow
O
K
]Klog)MP(..[
ow
ow
Dose,max
K
250105010
41

Variability is the Enemy
ProcessRM Input Product
Adapted from Rick Cooley, Eli Lilly, and Jon Clark CDER-FDA
variable
FIXED!!???
You CANNOT have a constant output from a fixed process and variable input - KRM
Adjustable!
Variability

Example: CMC-API Selection Rationale/Process for DF Development How do you know what questions to ask?
What’s the 1st API question you’d want the answer to if designing a DF or in evaluating the appropriateness of the selected API attributes?
The 2nd?, etc…The development scientist and the
regulator are asking many of the same questions.

API and Excipient Selection Rationale
time
1st p
rinci
ples

DF
SOLID LIQUID SEMISOLID INHALED
OTHER CAPSULE TABLET
WET GRAN DRY GRAN DC
PS SHAPE MECH
CYCLE ON DATARISK ASSESSMENT
API
SOLID/CA? LIQUID/CA? SEMISOLID/CA? BIOLOGICAL/CA?
ID CAs

API
SOLID/CA? LIQUID/CA? SEMISOLID/CA? BIOLOGICAL/CA?
CRYSTAL AMORPH
P’MORPH HYDRATE OTHER
CLASSIFI-CATION
STABILITYMICRO-
MERITICS
DECISION TREE, e.g. Q6AOr New

OPT
ID PCCPsRevise
Amount of data needed-DOE?
Data Treatment for Fit?
Response Factor(s)?
Possible PCCPs based on the RMs?
Possible PCCPs from Process Model?
What is the model for the process?
What Processes are viable?
What Process is consistent with the RM CAs based DF?
Process Design/Selection Rationale
From RM CA
selection

An Example: Q6A polymorph decision tree
This is great. If you understand the solid state and no polymorphs are formed, you’re done!
If there are forms, they must be understood, e.g.:
What are the relative stabilities of low energy forms? These are the “right” questions for scientist and regulators

An Example con’t: Q6A polymorph decision tree
We’re OK at first but when considering the product the logical 1st question should be:
Based on what is known about the material AND the process, what if any changes in form would be EXPECTED?
If the answer is none based on the scientific understanding, then a confirmatory test during development should suffice
Otherwise, the next question should be:
Is the observed change the Expected one?
What was the rationale for selecting the processing step responsible for the change?
Then we’re back to the tree

An Example con’t: Q6A polymorph decision tree
Here it might be reasonable to be asked:
Does the performance testing relate to the performance of interest?
If the answer is yes based on the scientific understanding, then we’re back on track
A next question might be: based on the understanding of the form’s behavior what would the expect trend in transformation be?

Does the observed change correspond to an understood and expected transformation?
If not, the system is not as well understood as thought!
An Example con’t: Q6A polymorph decision tree

One Example: Mechanical Properties as a CA, the Hiestand Indices
-The Bonding Index for the survival of strength after decompression:
BI = tensile strength/hardness = σT/H (>0.005)
- The Brittle Fracture Index measures the ability of a material to relieve stress by plastic deformation around a defect:
BFI = tensile strength of a compact with a defect/without = 0.5[(σT/σTo)-1] (<0.20)
-The Strain Index measures the relative strain during decompression after plastic deformation:
SI = Hardness/Reduced Modulus of Elasticity = H/E’Hiestand, E., Rationale for and the Measurement of Tableting Indices, in Pharmaceutical Powder Compaction Technology, G. Alderborn and C. Nystrom, Editors. 1996, Marcel Dekker, Inc.: New York
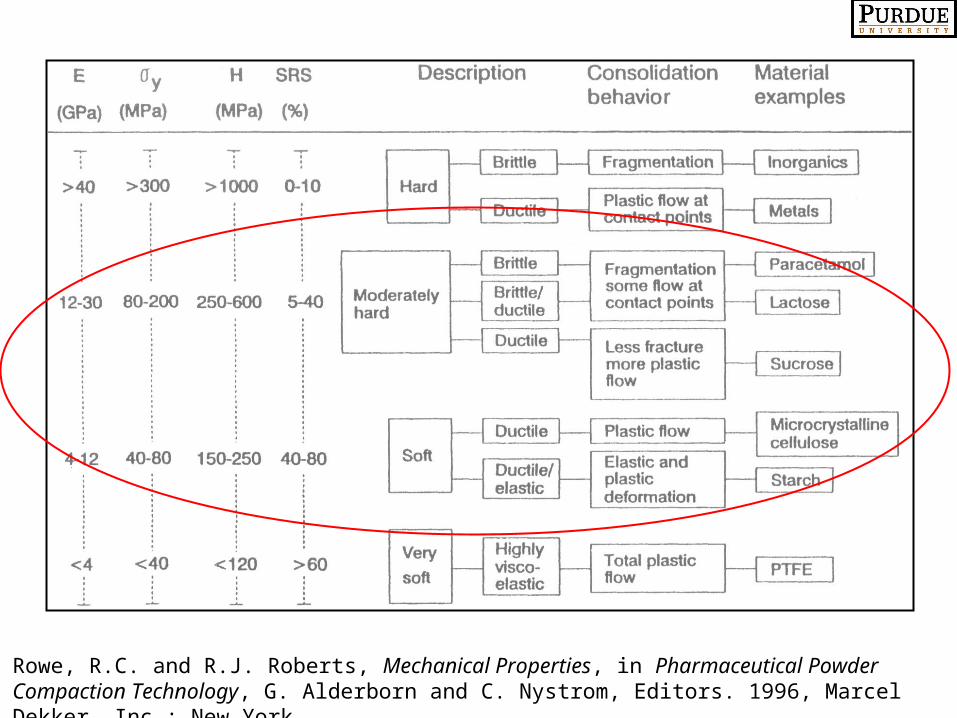
Rowe, R.C. and R.J. Roberts, Mechanical Properties, in Pharmaceutical Powder Compaction Technology, G. Alderborn and C. Nystrom, Editors. 1996, Marcel Dekker, Inc.: New York.

Phenacetin - fracture on Phenacetin - fracture on decompression the importance of BIdecompression the importance of BI
BFI = 0.4 (Moderate)
BI = 0.005 (Low)
SI = 0.013 (Low)
BI = tensile strength/hardness = σT/H (>0.5x10⁻²)
Courtesy of Greg Amidon, Pfizer, Previously Presented at AAPS 2002
or U.of Mich. Solids course
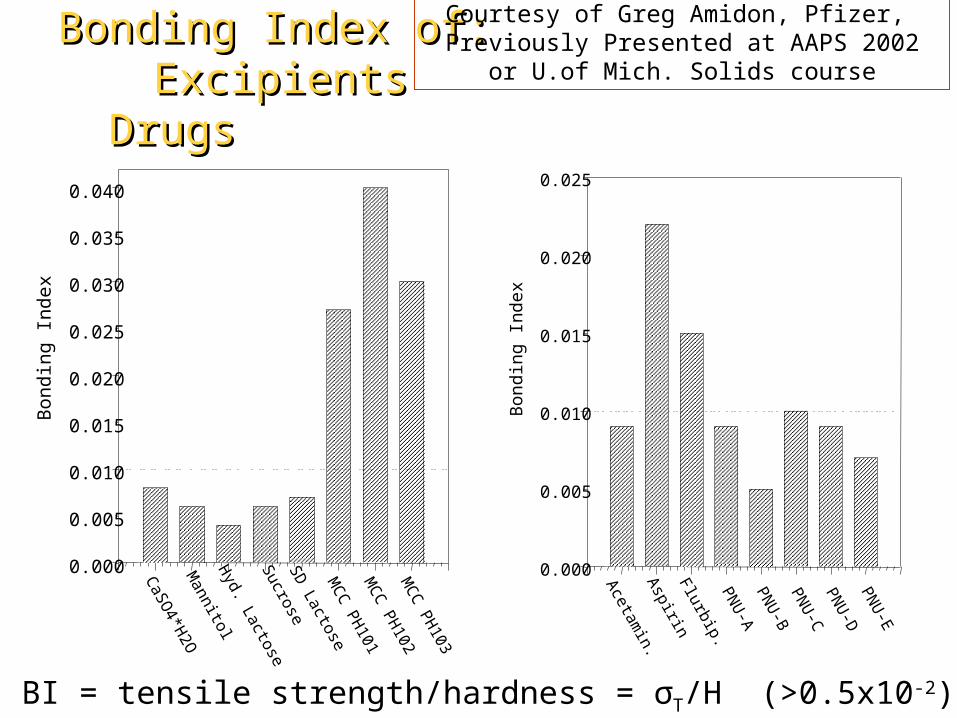
Bonding Index of:Bonding Index of:Excipients DrugsExcipients Drugs
CaS
O4*H
2OM
annitolH
yd. LactoseS
ucroseS
D Lactose
MC
C P
H101
MC
C P
H102
MC
C P
H103
Bon
ding
Ind
ex
0.005
0.015
0.025
0.035
0.000
0.010
0.020
0.030
0.040
Acetam
in.A
spirinFlurbip.P
NU
-AP
NU
-BP
NU
-CP
NU
-DP
NU
-E
Bon
ding
Inde
x
0.005
0.015
0.025
0.000
0.010
0.020
BI = tensile strength/hardness = σT/H (>0.5x10⁻²)
Courtesy of Greg Amidon, Pfizer, Previously Presented at AAPS 2002 or U.of Mich. Solids course

Erythromycin - fracture on ejection Erythromycin - fracture on ejection the importance of the BFIthe importance of the BFI
BFI = 0.7 (High)
BI = 0.03 (High)
SI = 0.04 (High)
BFI = 0.5[(σT/ σTo)-1] (<0.20)
Courtesy of Greg Amidon, Pfizer, Previously Presented at AAPS 2002
or U.of Mich. Solids course

Brittle Brittle Fracture Fracture Index of Index of
Excipients at Excipients at a solid a solid
fraction of 0.9fraction of 0.9
Sorbitol
MC
C, m
edium
MC
C, m
ed, RM
MC
C, coarse
Povidone
Ca S
O4 di-H
2O
Croscarm
ellose
Mannitol
Sucrose
Hydrous Lactose
SD
Lactose
Corn S
tarch
Brit
tle F
ract
ure
Inde
x
0.0
0.1
0.2
0.3
0.4
0.5
0.6
0.7
0.8
0.9
1.0
BFI = tensile strength of a compact with/without a defect = 0.5[(σT/ σTo)-1]
(<0.20)
Courtesy of Greg Amidon, Pfizer, Previously Presented at AAPS 2002
or U.of Mich. Solids course

Effect of the Addition of a Non-brittle Material to a Brittle Drug (Methenamine, Flurbiprofen, Drug X (Pfizer))
Adding only 30% of a non-brittle excipient makes the mixture much less brittle.
% Drug Mixed with Excipient0 20 40 60 80 100
Brit
tle F
ract
ure
Inde
x
0.0
0.2
0.4
0.6
0.8
1.0
Courtesy of Greg Amidon, Pfizer, Previously Presented at AAPS 2002 or U.of Mich.

Empirical Modeling of a Binary MixtureEmpirical Modeling of a Binary Mixture
log(Hmix) = log(HC2/HC1)*(%C2/100) + log(HC1)
Hmix
C1 C2Component
Courtesy of Greg Amidon, Pfizer, Previously Presented at AAPS 2002 or U.of Mich.
Leuenberger and others have 1st principle models to extend the concepts (Powder Technology 111 2000 145–153)

Risk Based Development-CMC questions
1. Use sound scientific principles in the design of the DF and Process
2. Identify the critical attributes (CAs) for the raw materials
3. Identify the process critical control points for the processes (PCCPs)
4. Employ the proper analyses and PAT concepts for process understanding and control
5. Tie it all together with the appropriate informatics to feed the information forward and backwards for QbD and continuous improvement and innovation = reduced risk
1. Were the principles appropriately applied?
2. How were the CAs identified and the formula designed?
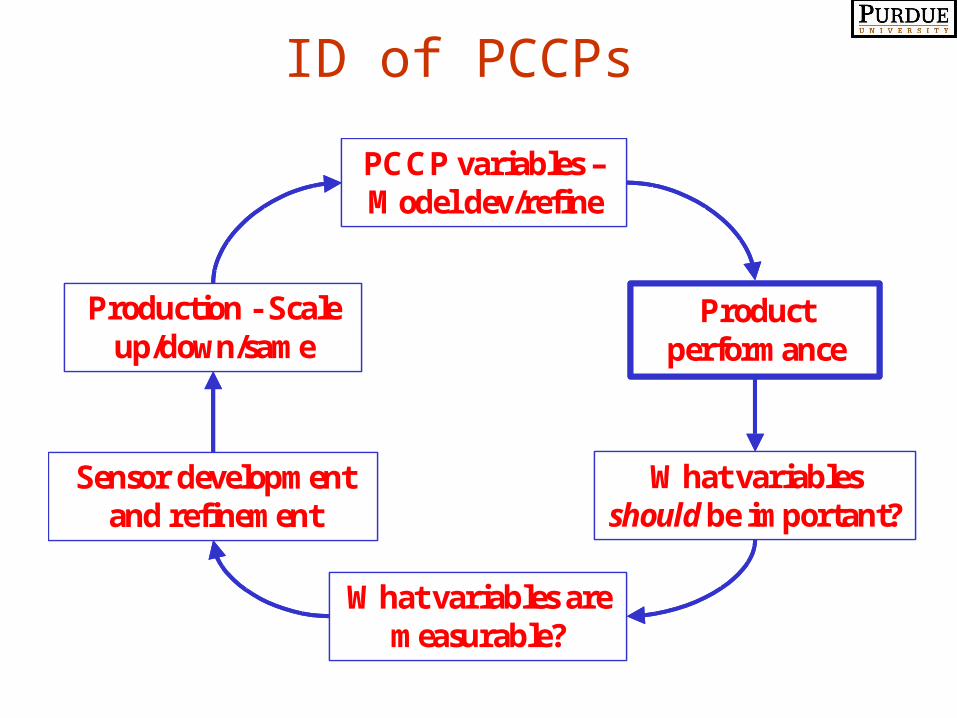
ID of PCCPs
PCCP variables –Model dev/refine
What variables should be important?
Sensor development and refinement
What variables are measurable?
Production - Scale up/down/same
Product performance
PCCP variables –Model dev/refine
What variables should be important?
Sensor development and refinement
What variables are measurable?
Production - Scale up/down/same
Product performance

PCCPs and Scale up with Monitoring
The basic approach is captured as two simple process understanding (i.e. PAT) premises:
1. PCCPs are preserved throughout scale-up► the magnitude of the responses may not scale
directly, but the variables being monitored reflect the “state” of the process
2. Monitoring material properties makes scaling less equipment dependent (as opposed to only monitoring equipment properties)
► equipment differences (scale and type) may have an effect, however, differences in the material should reflect significant changes in the PCCPs

Equipment:Chilsonator IR220 (Fitzpatrick)CDI-NIR; Texture Analyzer
Roll speed: 4 - 12 rpm
VFS Speed: 200 rpm
HFS Speed: 30 rpm
Roll Pressure: 6560
3 point beam bendingE = F l3/ 4 h3b
0.0
0.1
0.2
0.3
0.4
0.5
0.6
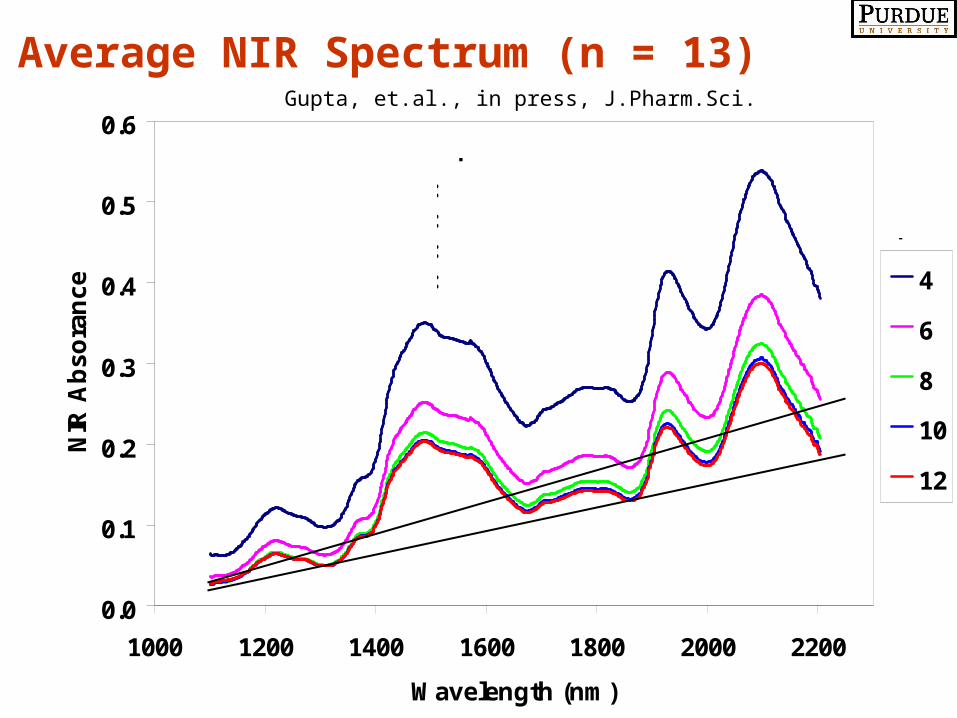
1000 1200 1400 1600 1800 2000 2200
Wavelength (nm)
NIR
Ab
sora
nce
4
6
8
10
12
Roll Speed (rpm)
MCC compacts
VFS Speed: HFS Speed:
Roll Gap: Roll Pressure:
194 - 197 rpm 29 - 30 rpm 0.031 - 0.038" 6551 lb/in
Average NIR Spectrum (n = 13)Gupta, et.al., in press, J.Pharm.Sci.
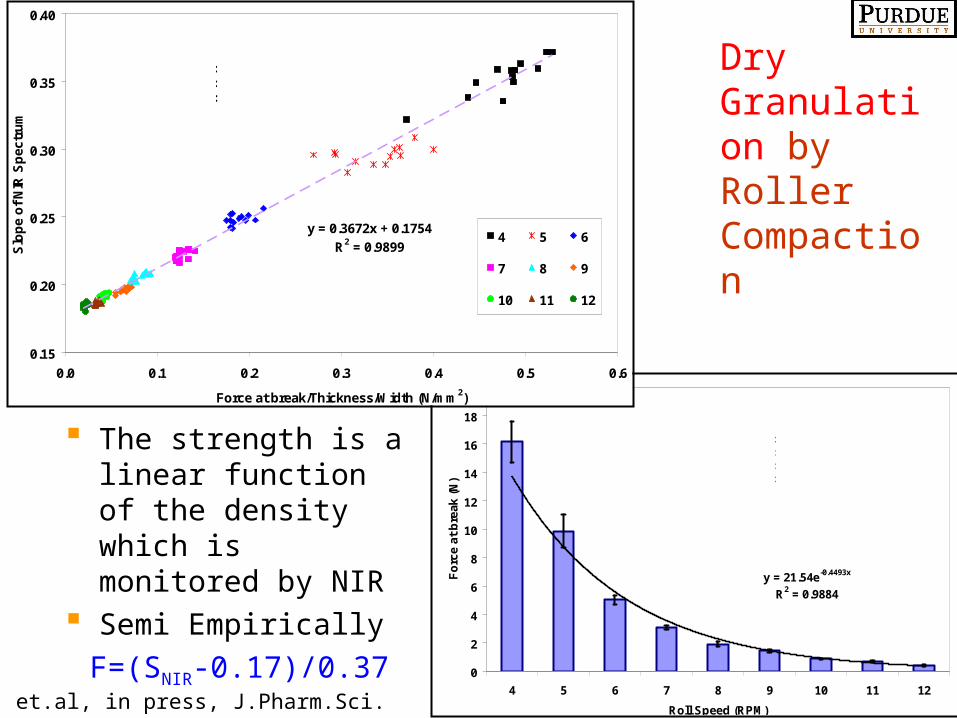
Dry Granulation by Roller Compaction
y = 21.54e-0.4493x
R2 = 0.9884
0
2
4
6
8
10
12
14
16
18
20
4 5 6 7 8 9 10 11 12
Roll Speed (RPM)
Fo
rce
at
bre
ak (
N)
Avicel® PH-200 compacts
VFS Speed: HFS Speed:
Roll Gap: Roll Pressure:
194 - 197 rpm 29 - 30 rpm 0.031 - 0.038" 6551 lb/in
y = 0.3672x + 0.1754
R2 = 0.9899
0.15
0.20
0.25
0.30
0.35
0.40
0.0 0.1 0.2 0.3 0.4 0.5 0.6
Force at break/Thickness/Width (N/mm2)
Slo
pe
of
NIR
Sp
ec
tru
m
4 5 6
7 8 9
10 11 12
Roll Speed (RPM)
Avicel® PH-200 compacts
VFS Speed: HFS Speed:
Roll Pressure:
200 rpm30 rpm 6560 lb/in
The strength is a linear function of the density which is monitored by NIR
Semi Empirically
F=(SNIR-0.17)/0.37
Gupta, et.al, in press, J.Pharm.Sci.

Avicel® PH-200 Milled Compacts
0
200
400
600
800
1000
3 4 5 6 7 8 9 10 11 12 13
Roll Speed (rpm)
Pa
rtic
le S
ize
(m
)
Day1
Day2
Increaing Roll Speed
d90
d50
d10
Avicel® PH-200 Milled Compacts
0
200
400
600
800
1000
1200
2.0 2.5 3.0 3.5 4.0 4.5 5.0 5.5 6.0
1 / Slope NIR Spectrum
Par
ticl
e S
ize
(m
)Day1
Day2
Increaing Roll Speed
d90
d50
d10
The particle sizes of the milled material is also manifest in the slope of the NIR signal (as predicted)
Dry Granulation by Roller Compaction
Gupta, et.al, in press, J.Pharm.Sci.

Real-Time Setup
Similar trends (as seen before) were observed for Thickness, Width, Force at break and Young’s Modulus
Gupta, et.al, in press, J.Pharm.Sci.

0.20
0.24
0.28
0.32
0.36
0.40
0 4 8 12 16 20 24 28 32Time (minutes)
Slo
pe
of
NIR
Sp
ec
tru
m
On-Line Data
Off-Line Data
630
200
10 50
250
840
200
630
150
420
100
1230
200
1030
200
830
200
RollHFSVFS
Speeds
On-line vs. Off-line Slope Data and Post Milling PSGupta, et.al, in press, J.Pharm.Sci.

0.24
0.26
0.28
0.30
0.32
0.00 0.01 0.02 0.03 0.04 0.05
Force/Thickness/Width (N/mm2)
Slo
pe
of
NIR
Sp
ec
tru
m
50/ 8 /25 50/10/25 60/ 8 /25 60/ 6 /35 60/ 8 /35 60/10/35
Red Symbols: No Vacuum .
Blue Symbols: 0.31 Bars Vacuum
FeederSpeed / Roll Speed / Roll Pressure
Scale Up: 10% Tolmetin Compacts
Gupta, et.al, in press, J.Pharm.Sci.
Alexanderwerk’s WP 120 x 40Formulations:100% Avicel® PH200 (MCC), 10% Tolmetin, 30% DiTab®, 60% MCC
8 Compactor settings studied prepared with and without vacuum

1. Use sound scientific principles in the design of the DF and Process
2. Identify the critical attributes (CAs) for the raw materials
3. Identify the process critical control points for the processes (PCCPs)
4. Employ the proper analyses and PAT concepts for process understanding and control
5. Tie it all together with the appropriate informatics to feed the information forward and backwards for QbD and continuous improvement and innovation = reduced risk
1. Were the principles appropriately applied?
2. How were the CAs identified and the formula designed?
3. Ditto for PCCPs
4. What were the bases for the analyses selection?
5. What are the supporting data for all of the above?
6. Product Development History
Risk Based Development-CMC questions

Summary: PAT, GMPs, RBD, PCCP
Asking the right questions at the right time Feeding forward and back between disciplines Designing the product and process against
meaningful metrics (performance, stability etc..)
• MUST start in R&D
• Development of meaningful specs
• Real time monitoring Process understanding for quality and control
• Known functionality (i.e., models) against which data are used to control to the mark

What do you get at each stage? Early development – CMC go/no go decisions with
a higher level of certainty, i.e., reduced risk Late phase development – clear formulation and
process design rationales
• Control strategies based on understanding to reduce the risk
• Facilitation of clear regulatory queries and logical responses
Tech transfer – more realistic processes to transfer (Gerry Migliaccio’s “leg up”)
• Fewer “surprises” (analogous to forward pass)
• Easier approval process and inspections

Acknowledgments
Dr. Gregory Amidon – Pfizer, Kalamazoo
CAMP – Consortium for the advanced manufacturing of pharmaceuticals
Abhay Gupta – graduate student in IPPH at Purdue
The Team - Headed by Jon Clark