risk.03 integrated cost and schedule risk analysis integrated cost and... · integrated cost and...
TRANSCRIPT

(RISK.03)Integrated Cost and Schedule Risk
Analysis: A Draft AACE Recommended Practice
Dr. David T. Hulett

2
Author Biography• David T. Hulett, Hulett & Associates, LLC• Degree:
– Ph.D.
• University:– Stanford University
• Years of Experience:– 20+
• Professional Field:– Project risk analysis and management, project scheduling

• The purpose of integrated analysis of schedule and cost risk to estimate the appropriate level of cost contingency reserve on projects
• The main contribution is to include the impact of schedule risk on cost risk and hence on the need for cost contingency reserves
• Additional benefits include the prioritizing of the risks to cost, some of which are risks to schedule so that cost risk mitigation may be conducted in a cost-effective way.
Purpose

Linkage of Schedule and Cost Risk• Some resources such as labor, rented
equipment and level-of-effort support by the project management team will cost more if they are engaged on the project longer than planned because activities take longer than expected
• Risks to schedule will also be risks to the cost of these resources
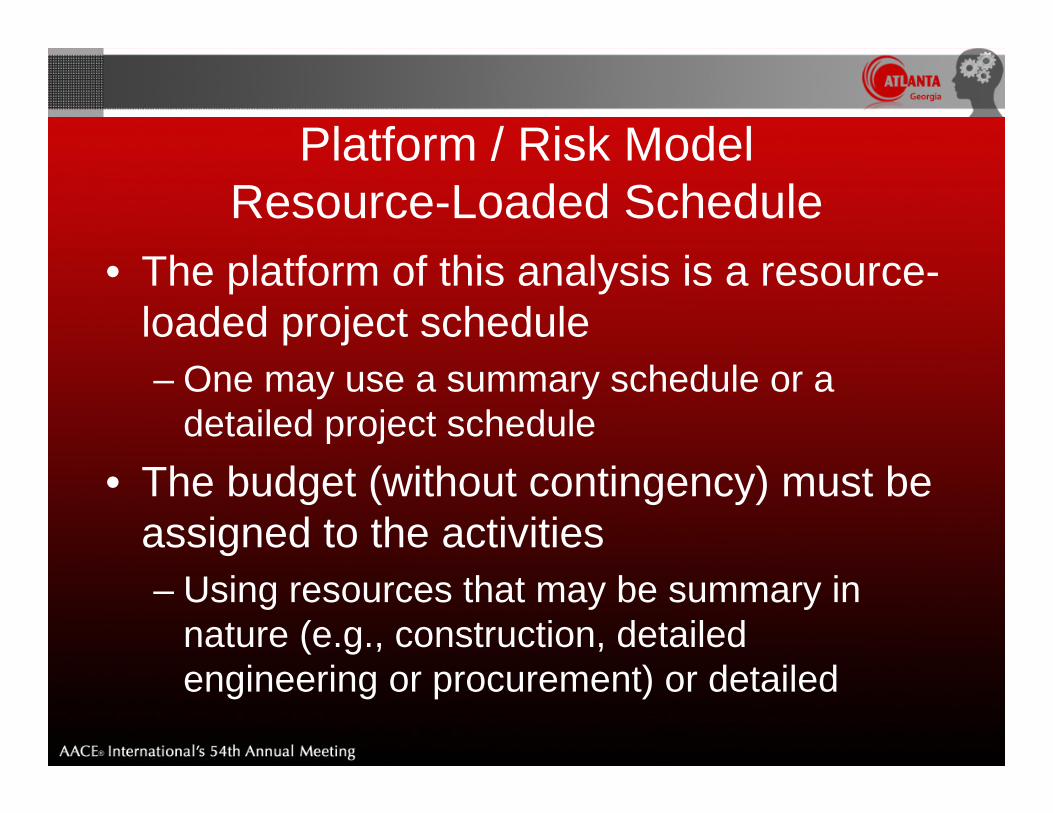
Platform / Risk ModelResource-Loaded Schedule
• The platform of this analysis is a resource-loaded project schedule– One may use a summary schedule or a
detailed project schedule• The budget (without contingency) must be
assigned to the activities – Using resources that may be summary in
nature (e.g., construction, detailed engineering or procurement) or detailed

Monte Carlo Simulation• Monte Carlo simulation is the standard
approach to discovering the impact of multiple risks on the overall project schedule or cost risk
• Simulating a resource-loaded project schedule derives both schedule risk and the cost risk implication in the same simulation
• The results also produce a list of risks that are prioritized through the risk model, for risk mitigation

Inputs• A best-practice project schedule, basically a
schedule following recommended practice CPM scheduling. A schedule of 300 – 1,000 activities can summarize and represent a large project in this strategic analysis
• A contingency-free cost estimate, meaning that line items do not have contingency padding built in and there is no below-the-line contingency included
• Good-quality risk data – usually risks that have been identified during a qualitative risk analysis of the project leading to a list of prioritized risks are characterized by their probability and impact ranges

Outputs• How likely are the project plan’s cost and schedule
targets to be met given the risk that may affect that plan?
• How much contingency of time and cost needs to be provided to meet the risk threshold of the project management or other stakeholders?
• Which risks are most important to the achievement of the project schedule and cost estimate?
• A unique and useful result is the finding of joint time-cost risk result joint probability distribution, often shown as a scatter diagram of time-cost points showing the possibility of meeting both time and cost objectives jointly

Best Practice CPM Schedule 1• All work needed to complete the project must
be represented in the schedule. The schedule should relate to the WBS
• There should not be any “danglers.” This means that each activity needs a predecessor to its start date and a successor from its finish date
Activity 101Predecessor Successor
F-S or S-S F-S or F-F

• The schedule should not rely on date constraints or fixed lags between activities
• The schedule should be recently statused• The schedule should have resources costed and
assigned to activities– Summary resources are OK– The purpose of these resources is to get the costs on
the right activities, not to level resources– Sometimes we create hammocks and apply summary
resources to those
10
Best Practice CPM Schedule 2

Example of Resources Used
11

Risk Data Inputs• Risk events may or may not happen, but if they
do happen they will have a positive or negative impact on the cost or schedule or both– Risk events’ probabilities are < 100%– They have uncertain impacts as well
• Uncertainties include ambiguities such as estimating error and uncertainties such as the level of labor productivity or the price of steel. – These uncertainties are 100% likely to occur but their
impact on the project cost or schedule is uncertain
12

Collecting Risk Data
• The input risk data are usually collected in risk workshops or interviews. – In workshops the people may be influenced
by strong personalities or people in higher positions in the organizations.
– In individual interview sessions, usually protected by promises of confidentiality, people can discuss their concerns and make estimates without feeling the influence of others
13

Risk Drivers (aka Risk Factors)
• The risks’ impacts are specified by 3-point estimates– In Risk Drivers (Risk Factors) the impacts are ranges
of multiplicative factors. The 3-point estimate of impact is converted to a triangular distribution
• Risks are applied to activities– A schedule risk will multiply the duration of the activity
that it is assigned to – For any iteration the software selects an impact at
random from the distribution and uses that factor for that iteration
14

Examples of Three Risk Types
• Schedule duration estimate immaturity is an ambiguity. It has 100% probability of occurring and its impact range is both good and bad
• Construction labor productivity is an uncertainty that, compared to the assumption, could be lower or higher
• The possibility of quality, key personnel unavailability is a risk event– It may or may not occur– In this case its impact is never to the good
15

Uncertainty and Ambiguity Risks Occur 100% of the time
16
Schedule inaccuracy operates 100% of the time (all iterations). On a construction activity of 100 days duration the results are triangularThe construction labor productivity risk would look similar to this figure
95 100 105 110 115 120
Distribution (start of interval)
0
20
40
60
80
100
120
140
160
180
200
220
240
Hits
0% 95
5% 99
10% 100
15% 101
20% 102
25% 103
30% 104
35% 104
40% 105
45% 106
50% 106
55% 107
60% 108
65% 109
70% 109
75% 110
80% 111
85% 113
90% 114
95% 116
100% 120
Cum
ulat
ive
Freq
uenc
y
0010 - Construction : Duration

Risk Events are Described by their Probability and Impact
• If probability is < 100%, the risk will occur in that percentage of iterations, chosen at random
• On an iteration if the risk occurs, a factor chosen at random from its impact range will multiply the duration of the activities to which it is assigned
• If the risk does not occur the multiplicative factor is 100% with no effect on duration
17

Risk Events occur with a Probability < 100%
18
100 102 104 106 108 110
Distribution (start of interval)
0
100
200
300
400
500
600
700
800
900
Hits
0% 100
5% 100
10% 100
15% 100
20% 100
25% 100
30% 101
35% 102
40% 103
45% 103
50% 104
55% 104
60% 105
65% 105
70% 105
75% 106
80% 106
85% 107
90% 107
95% 108
100% 110
Cum
ulat
ive
Freq
uenc
y
0010 - Construction : Duration Here a risk event, the possible unavailability of quality key staff, occurs 70% of the time. Hence, in 30% (900) of the 3,000 iterations the original duration of construction, 100 days, is correct. In 70% (2,100) of the iterations, the duration is longer than 100 days as a triangle

Risk Driver Strategy• Risks are usually higher-level strategic
risks rather than tactical or technical risks• Data about risks is derived from in-depth
interviews• A risk is usually assigned to several
activities• An activity may have several risks
assigned
19

A Construction Activity withThree Risks Assigned
2090 100 110 120 130 140
Distribution (start of interval)
0
10
20
30
40
50
60
70
80
90
100
110
120
130
140
150
160
Hits
0% 90
5% 99
10% 101
15% 103
20% 105
25% 106
30% 108
35% 109
40% 110
45% 111
50% 112
55% 113
60% 114
65% 115
70% 117
75% 118
80% 120
85% 122
90% 124
95% 127
100% 143
Cum
ulat
ive
Freq
uenc
y
0010 - Construction : Duration
The interaction of the three risks produces the expected histogram.In traditional 3-point risk estimating, the analyst and interviewees must approximate the result of three risks on duration. The Risk Driver analysis computes the distribution.

Risk Drivers Avoid the Need to Estimate the Correlation Coefficient
© 2009 Hulett & Associates LLC
21
Activity A Activity B
Activities A and B Correlation is Calculated to be 100%
In the traditional approach to risk analysis, the correlation coefficient has to be estimated.
Risk Drivers model how correlation occurs and the coefficient is a natural result of the model
Risk #1P = 50%, Factors
.95, 1.05, 1.15

Risk Factors Model How Correlation Occurs (2)
© 2009 Hulett & Associates LLC
22
Risk #1P = 50%, Factors
.95, 1.05, 1.15
Activity A Activity B
Activities A and B Correlation is Calculatedto be 48%
Risk #2P = 25%, Factors
.8, .95, 1.05
Risk #3P = 45%, Factors
1.0, 1.1, 1.2
Risk Drivers model correlation as it is caused in the projectbased on the common (Risk # 1) and confounding (Risks # 2 and #3) risks
affecting pairs of activitiesThe correlation coefficient is the result, not the assumption

Integrating Cost and Schedule Risk using Risk Drivers
• The risks to activity durations will affect– Durations and completion dates– Costs of labor-type resources
• For each iteration the cost as well as the finish date is calculated
• Enhanced results include– Scatter diagrams (joint distributions) of time
and cost– Probabilistic cash flows by month
23

Schedule Risk applied to Activity with Labor Resource – Cost/Time Scatter
Risk ID Risk Probability Minimum Most Likely Maximum
1 Labor Productivity may be Uncertain 100% 95% 105% 120%
24
$600,000 $620,000 $640,000 $660,000
Distribution (start of interval)
0
100
200
300
400
500
600
700
Hits
0% $585,000
5% $596,000
10% $600,000
15% $603,000
20% $606,000
25% $609,000
30% $611,000
35% $613,000
40% $615,000
45% $617,000
50% $619,000
55% $621,000
60% $623,000
65% $626,000
70% $628,000
75% $631,000
80% $634,000
85% $638,000
90% $642,000
95% $647,000
100% $660,000Cu
mul
ativ
e Fr
eque
ncy
RP one-pathEntire Plan : Cost
0%
0% 49%
51%
10/08/2012 20/08/2012 30/08/2012 09/09/2012 19/09/2012 29/09/2012 09/10/2012 19/10/2012
Entire Plan: Finish
51%
$590,000
$600,000
$610,000
$620,000
$630,000
$640,000
$650,000
$660,000
Entir
e P
lan:
Cos
t
51%
RP one-path
10/ 09/ 2012
$619,000
Deterministic Point Inside both limits Outside both limits
Schedule Risk

Effect on Cost Risk of Adding Burn Rate Uncertainty
25$580,000 $590,000 $600,000 $610,000 $620,000 $630,000 $640,000 $650,000 $660,000 $670,000 $680,000
0%
10%
20%
30%
40%
50%
60%
70%
80%
90%
100%
Cum
ulat
ive
Prob
abili
ty
Distribution AnalyzerRP one-path - Entire Plan - Cost RP one-path - Entire Plan - Cost
8%
9% 41%
42%
10/08/2012 20/08/2012 30/08/2012 09/09/2012 19/09/2012 29/09/2012 09/10/2012 19/10/2012
Entire Plan: Finish
51%
$580,000
$590,000
$600,000
$610,000
$620,000
$630,000
$640,000
$650,000
$660,000
$670,000
$680,000
Entir
e Pl
an: C
ost
50%
RP one-path
10/ 09/ 2012
$624,453
Deterministic Point Inside both limits Outside both limits
Risk ID RiskDuration Impacts Cost Impacts
Probability Minimum Most Likely Maximum Minimum Most
Likely Maximum
1 Labor Productivity may be Uncertain 100% 95% 105% 120% 95% 100% 110%
Schedule, and Burn Rate Risk
Schedule Risk Alone

Add Uncertainty in Procurement Costs
• Equipment and material costs may be risky but not generally because their activities’ durations are uncertain
• Putting risk factors on material-type resources causes the risk to be applied to the entire cost
26
Schedule Impact Factors Cost Impact Factors
Risk ID Risk Probability Minimum Most Likely Maximum Minimum Most Likely Maximum
1Labor Productivity may be Uncertain 100% 95% 105% 120% 95% 100% 110%
2Suppliers may be busy 100% 100% 100% 100% 90% 105% 120%

Impact on Cost Risk of Adding Risk to Material Resources
27$560,000 $570,000 $580,000 $590,000 $600,000 $610,000 $620,000 $630,000 $640,000 $650,000 $660,000 $670,000 $680,000 $690,000 $700,000 $710,000 $720,000 $730,0000%
10%
20%
30%
40%
50%
60%
70%
80%
90%
100%
Cum
ulat
ive
Prob
abili
ty
Distribution AnalyzerRP one-path - Entire Plan - Cost RP one-path - Entire Plan - Cost RP one-path - Entire Plan - Cost
16%
16% 34%
34%
10/08/2012 20/08/2012 30/08/2012 09/09/2012 19/09/2012 29/09/2012 09/10/2012 19/10/2012 29/10/2012 08/11/2012
Entire Plan: Finish
50%
$560,000
$580,000
$600,000
$620,000
$640,000
$660,000
$680,000
$700,000
$720,000
Entir
e Pl
an: C
ost
50%
RP one-path
23/ 09/ 2012
$640,372
Deterministic Point Inside both limits Outside both limits
Schedule, Burn Rate and Material Risk
Schedule Risk Alone
Schedule, and Burn Rate Risk

Simple Example: Construction Project
28
Cost Resources Risk Factors

We have Created and AssignedEight Risk Factors
29

Basic Cost and Schedule Results
30
21-Dec-12 05-May-14
Distribution (start of interval)
0
100
200
300
400
500
600
700
Hits
0% 19-Dec-12
5% 27-Apr-13
10% 25-May-13
15% 13-Jun-13
20% 03-Jul-13
25% 18-Jul-13
30% 01-Aug-13
35% 14-Aug-13
40% 28-Aug-13
45% 08-Sep-13
50% 20-Sep-13
55% 02-Oct-13
60% 16-Oct-13
65% 29-Oct-13
70% 14-Nov-13
75% 30-Nov-13
80% 16-Dec-13
85% 06-Jan-14
90% 03-Feb-14
95% 23-Mar-14
100% 02-Dec-14
Cum
ulat
ive
Freq
uenc
y
AACEI Integrated Cost-Schedule RiskEntire Plan : Finish Date
P-80 is 16 Dec 2013, a 7-month slip
$600,000 $800,000 $1,000,000
Distribution (start of interval)
0
200
400
600
800
Hits
0% $537,199
5% $619,334
10% $636,168
15% $648,572
20% $658,705
25% $667,247
30% $675,521
35% $683,271
40% $692,139
45% $699,319
50% $706,146
55% $713,313
60% $721,955
65% $730,838
70% $740,066
75% $749,866
80% $760,750
85% $775,498
90% $792,533
95% $819,295
100% $1,008,966
Cum
ulat
ive
Freq
uenc
y
AACEI Integrated Cost-Schedule RiskEntire Plan : Cost
P80 is $760 million, a 22% reserve
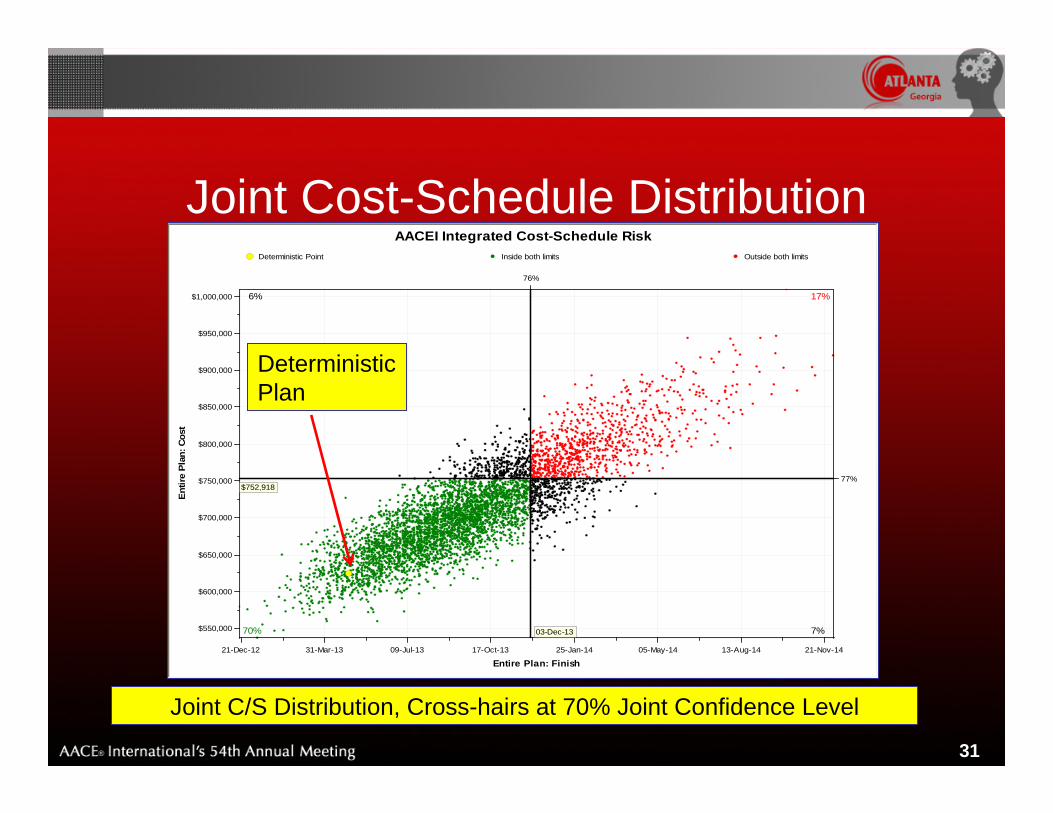
Joint Cost-Schedule Distribution
31
7%
6% 17%
70%
21-Dec-12 31-Mar-13 09-Jul-13 17-Oct-13 25-Jan-14 05-May-14 13-Aug-14 21-Nov-14
Entire Plan: Finish
76%
$550,000
$600,000
$650,000
$700,000
$750,000
$800,000
$850,000
$900,000
$950,000
$1,000,000
Entir
e Pl
an: C
ost
77%
AACEI Integrated Cost-Schedule Risk
03-Dec-13
$752,918
Deterministic Point Inside both limits Outside both limits
Joint C/S Distribution, Cross-hairs at 70% Joint Confidence Level
Deterministic Plan

Probabilistic Cash Flow
32
Deterministic Cost: $624,220
Det
erm
inis
tic F
inis
h: 2
9-Ap
r-13
21-Jan-11 01-May-11 09-Aug-11 17-Nov-11 25-Feb-12 04-Jun-12 12-Sep-12 21-Dec-12 31-Mar-13 09-Jul-13 17-Oct-13 25-Jan-14 05-May-14 13-Aug-14 21-Nov-14
Time
0
200,000
400,000
600,000
800,000
1,000,000
Cum
ulat
ive
Deterministic Plan
P-80

Prioritizing Risks To Cost
33
Risks to Cost in Priority Order at the P‐80P‐80
ALL RISKS IN 760.8NO RISK 624.2Contingency Reserve at P‐80 136.6
Risks Prioritized for Effect on CostActivity Duration Estimates are Inaccurate 39.2Site Conditions / Site Access may Slow Logistics 23.2Key Engineering Personnel may be Unavailable 18.4Cost Estimate is Inaccurate 14.9Capable Management may not be Assigned 13.4Equipment Suppliers may be busy 9.1Design Complexity may Challenge Engineers 3.4Environmental Agency may be Slow 0.1
TOTAL Contingency Accounted For 121.6
Some Interaction Effects are not Captured
Prioritize risk mitigations using this table

QUESTIONS?
David T. Hulett, Ph.D.Hulett & Associates, LLC
Los Angeles, CA(310) 476-7699
34