risk sharing vs risk bearing and shiftingerf.org.eg/wp-content/uploads/2016/09/1042.pdf · ways of...
TRANSCRIPT


RISK SHARING VS RISK BEARING AND SHIFTING: EVIDENCE FROM CONVENTIONAL AND ISLAMIC BANKS
OF MENA REGION USING METAFRONTIER DIRECTIONAL DISTANCE FUNCTIONS
Zouheir Bouchaddakh and Mohamed Mekki Ben Jemaa
Working Paper 1042
September 2016
Send correspondence to: Mohamed Mekki Ben Jemaa University of Dammam, Kingdom of Saudi Arabia [email protected]

First published in 2016 by The Economic Research Forum (ERF) 21 Al-Sad Al-Aaly Street Dokki, Giza Egypt www.erf.org.eg Copyright © The Economic Research Forum, 2016 All rights reserved. No part of this publication may be reproduced in any form or by any electronic or mechanical means, including information storage and retrieval systems, without permission in writing from the publisher. The findings, interpretations and conclusions expressed in this publication are entirely those of the author(s) and should not be attributed to the Economic Research Forum, members of its Board of Trustees, or its donors.

1
Abstract
A large empirical literature has been developed, in the two last decades, to compare performance of Islamic and conventional banks. This paper contributes to this literature using a new methodology allowing a better comparative performance evaluation between Islamic banking and conventional banking in MENA region over the period 2000-2012 and applies a new method based on the Metafrontier Directional Distance function. By adopting this technique, it was possible to consider a multioutput production process with Non-Performing Loans as undesirable output and to assume that bank groups are operating under different technologies. The objective is to assess empirically the effect of Risk-Sharing claimed theoretically by Islamic Finance literature on banking efficiency. It was found that conventional banks in the MENA region seem to be more efficient than Islamic banks even if Non Performing Loans are introduced as a penalizing undesirable output. It was found that there is no significant difference between the two groups of banks in terms of their gap between their own technology and the leading technology among the whole region.
JEL Classification: G21
Key words: Islamic banks, conventional banks, risk sharing, risk bearing.
ملخص ، في العقدین الماضیین، لمقارنة أداء البنوك اإلسالمیة والتقلیدیة. وتسھم ھذه الورقة لھذا األدب باستخدام ةریثك ةتجریبی یاتأدب ھرتظ
-2000منھجیة جدیدة تسمح بتقییم أداء أفضل مقارنة بین المصارف اإلسالمیة والبنوك التقلیدیة في منطقة الشرق األوسط خالل الفترة
فة طنو، 2012 یدة تقوم على وظی جد قة جاه بق طری تاج یبعالاالت یة اإلن كان من الممكن النظر في عمل یة، ھذه التقن د. من خالل تبني
مع القروض غیر المنتظمة كإخراج غیر مرغوب فیھ وأن نفترض أن مجموعة البنك تعمل في ظل التقنیات المختلفة. والھدف المتعددة
البنوك التقلیدیة في منطقة الشرق . وقد تبین أن ىنظرال دب التمویل اإلسالمي على الكفاءة المصرفیةأل تجریبیاأثیر المخاطر تھو تقییم
ط المیة حتى إذا تم إدخال ىھاألوس . وقد تبین أنھإخراج غیر مرغوب فیھالعاملة باعتبارھا غیر القروضأكثر كفاءة من البنوك اإلس
ة بھا والرائدة في مجال التكنولوجیا بین ال یوجد فرق كبیر بین المجموعتین من البنوك من حیث الفجوة ما بین التكنولوجیا الخاص
المنطقة بأسرھا.

2
1. Introduction Modern Banks operate in a competitive environment induced by financial liberalization with both internal and external dimensions. This implies that only well performing banks can survive in these new competitive conditions. Being more frequent with financial liberalization, banking crises are usually marked by many banking bankruptcies. At the same time, we notice the emergence and growth of Islamic banking. Disseminated in more than 70 countries, « about 300 Islamic financial institutions are working efficiently with capital investments worth $500-800 billion. By 2010, the market value of Islamic financial institutions was of $4 trillion »1. This spectacular growth of Islamic Banking could be the sign of higher performance of this new type of financial institutions. It can be only linked to the emergence of Islamic finance as a new market niche.
A large empirical literature developed, in the two last decades, to compare performance of Islamic and conventional banks. This paper contributes to this literature using a new methodology allowing a better comparative performance evaluation between Islamic banking and conventional banking in MENA region. We compare efficiency and effectiveness of operations of both bank-groups. The remainder of the paper is organized as follows. Section II analyses treatment of risk in Islamic and conventional banking activities. Section III briefs empirical literature on relative performance of the two types of banks. Section IV explains the originality of the methodology used and undertakes a comparative study on performance of conventional banks and Islamic banks in MENA region. Section V concludes.
2. Risk Sharing in Islamic Banking Islamic banking is the most practical application of Islamic finance. The latter is finance that is consistent with the principles of Sharia (Islamic law). Then Islamic banks are Sharia compliant institutions obeying Islamic finance principles. Among these principles, the profit and loss sharing paradigm involves a certain distribution of risks that makes Islamic banks distinct from conventional ones.
As a financial intermediary, an Islamic bank ensures the transfer of funds from surplus spending units to spending deficit units by means of an array of financial products and services that do not violate the norms of Islamic ethics. Amongst the most important principles of Islamic finance is the prohibition of interest (called Riba). However, interest constitutes the prime source of revenue to conventional bank in a capitalist system. In order to substitute interest as a source of revenue, the first challenge for Islamic banks was to find out innovative ways of financing which would not involve prohibited Riba. This was the case with alternative products like Murabaha and Ijara. It’s not surprising to find these products as the most used financial products by Islamic banks. The share of these « commercial » products represents about 70% of Islamic banks assets. The « dominance » of such products is often reported in critical terms by outsiders and presented as a proof of the desire to replace interest as a principal source of revenu. Critics say that Islamic banking in practice is not much more than a « mere copy of conventional practices under the banner of Sharia » (Hanif, 2011, p.166).
To evolve away from conventional financial model, Islamic banks should be more compliant to the ethos of Islamic Finance and especially to the profit and loss sharing (PLS) principle. In fact, « »an Islamic banking and financial system exists to provide a variety of religiously acceptable financial services … expected to contribute richly to the … mobilization and investment of savings for economic development in such a way that a just (profitsharing) return is ensured to all parties involved » (Hassan and Lewis 2007, p.8).
1 Ansari and Rehman 2011, p. 45

3
The PLS principle implies that all parties, including the bank, have a real and tangible stake in the outcome of the transaction being undertaken. In that case, risk sharing can take different issues under conventional and Islamic banking models.
The PLS principle implies that risks are assumed equally by all parties in financial transactions. As a financial intermediary, an Islamic bank collects resources from depositors and advances capital to investors. For both sides (surplus spending units and deficit spending units), the relation with the bank is a partnership type of financing and based on risk sharing.
To collect funds from surplus spending units, the bank uses the Mudarabah instrument2. The amount collected is invested in different projects using different modes of financing. Surplus spending units become investors and not simple depositors. They assume the risk of loss of their capital but they are compensated by a higher part of profits.
By accepting to assume the risk of loss of their capital, savors become investors not simple depositors. In that way, they can legitimize, in Islamic view, income generated by money entrusted to the (Islamic) bank. Indeed, Islamic finance does not allow making money from money. Then, surplus spending units should not be simple depositors (as it is the case in conventional banking) but « real » investors who accept to assume the risk relating to their investment before claiming profits (interest).
The risk sharing is a basic principle in Islamic finance. Thus, Muslim jurists developed a legal maxim « al-ghunm bi al-ghurm » or « gaining is bound by accountability ». In other words, if there is no risk assumed, there will be no gain. Profits, in an Islamic financial system, are justified by taking part in the development of business not only financial risk taking. Thus, « unlike the conventional banks’ profits which are derived largely from interest-bearing loans....what legitimizes profit in Islam is risk taking (ghorm), effort (kasb) and responsibility (daman » (Ariff 2013, p.12).
On the other side, Islamic bank contributes to financing deficit spending units. The financing is realized with modes based on the PLS principle such as mudharabah and musharakah3 known as participatory modes.
Using these participatory modes, the bank fructifies funds and shares profits with borrowers of the capital. To justify gain of profits, Islamic bank is committed to take active part in the business and opt for sharing the risks associated with any investment.
Theoretically, Mudharabah and Musharakah are the most desirable forms of Islamic financing. However, in practice, participatory modes give rise to agency problem in the form of moral hazard related to asymmetric information. Particularly, in the case of financing with Mudharabah « the problem of moral hazard arises more acutely despite the control procedures imposed by the bank which also entail additional costs » (Patel, 2013, p.13). Because of asymmetric information, the agent (called Mudharib) is not fully supervised and its level of effort cannot be the subject of contract. Then, the risk of fraudulent behavior of the entrepreneur (Mudharib) is stronger since the latter does not suffer financial losses which are supported exclusively by the bank (Rabb ul Mal).
To a lesser extent, Musharakah model is also confronted to the same agency problem. As argued by Dar and Presley (2000, p.3) « PLS contracts are inherently vulnerable to agency
2 Mudarabah is a contract whereby one side the investor or Rabb ul Mal contributes money and the other side work, being the manager or Mudharib. The Rabb ul Mal bears all losses (except in case of revealed manager negligence), and the Mudharib earns a profit share mutually agreed upon by both parties. 3 Musharakah is based on the profit-loss sharing principle. Profit in such a partnership is shared based on the contractual agreement but the liability of loss is proportionate to the capital contribution.

4
problems as entrepreneurs have disincentives to put in effort and have incentives to report less profit as compared to self-financing owner-manager. »
This explains divergence between theory and practice of Islamic banking. Whereas theoritical models promote financing based on PLS model, as Musharakah and Mudarabah, the practice of Islamic banking reveals a strong preference of trade-based modes of financing such as mark-up (Murabahah4) and leasing (Ijara5) (Rosly 1999, Farook 2007, Archer et. al 2010, Farook et al. 2012). These alternative modes of financing allow Islamic banks to avoid moral hazard problem and to compete with conventional banks.
Although it does not represent the dominant mode of financing, PLS mode is part of the balance sheet of Islamic banks. This fact allows them to have a distinguishing feature from conventional banks in both assets and liabilities sides.
3. Risk Bearing and Shifting in Conventional Banking Unlike Islamic banking activity case where bank and customers share the risk, the case of conventional banking implies a creditor-debtor relationship between the two parties. The risk is beared initially by the bank. The latter can choose to shift the risk to other agents in order to minimize the burden of raising more capital.
The core activity of conventional banks is to collect deposits from savers and to provide loans to borrowers. From this point of view, conventional banks are basically financial intermediaries between last lenders and borrowers. Thus conventional banking activity is based on the debtor-creditor relationship between the bank on one side and savers and borrowers from the other side.
For savers, the commercial bank offers safety and high liquidity in order to compensate lower or lack of remuneration of deposits. « When deposits are insured, depositors are willing to accept a lower promised repayment on their deposits since they bear no risk of default from lending to the bank » (Allen et al., 2014, p.18). So the bank is a debtor and savers taken all together constitute the creditor. Generally, the bank borrows the money for a short term and lends it for a longer term. Thus the bank uses the money loaned to make it more productive without jeopardizing its safety for savers. By so doing the bank bears totally the risks of deposits assumed as money loaned. This acceptance to bear the risk is the price paid voluntarily by the bank to compensate underpayment of deposits.
On the side of borrowers, they are debtors and conventional bank is the creditor who lends money in return for interest. Hence, for the conventional « commercial » bank, money is a commodity and interest is the price of credit and reflects the opportunity cost of money. In his relation with borrowers, the conventional bank gives importance to client’s credit worthiness more than the viability of the project to be financed as in Islamic banking. Thus, instead of sharing the risk of the project, the commercial bank bears the risk of client’s insolvency.
4 Murabahah is a cost-plus sale contract whereby disclosure of cost to the buyer is necessary. Under Murabahah arrangement customer requests to the Islamic Financial Institution (IFI) to purchase an asset for him (customer) and sell on deferred payment. An essential feature of Murabaha is that IFI must purchase the required commodity from supplier first and then sell to customer. Bank charges a certain profit usually linked with Inter Bank Offered Rate (Hanif and Iqbal (2010). 5 Ijara is a rental contract whereby Islamic bank leases an asset for a specific rent and period to the client. Ownership risks of the asset are born by IFI while expenses relating to use the asset are the responsibility of client. The difference between Ijara and sale is that ownership in Ijara remains with lesser while in case of sales it is transferred to purchaser. Ending Ijara in sale of asset is allowed by IFA through a separate contract at completion of term of lease. Contract can be executed prior to purchase and possession of asset. Consumables cannot be leased out. Inter Bank Rate can be used as a benchmark for amount of rentals. At the completion of Ijara term either asset is returned to IFI or purchased by client. Ijara has replaced successfully the facility of leasing under conventional financial system. (Hanif and Iqbal (2010).

5
In sum, conventional banking activity implies that less liquid assets (loans with long maturities) are transformed into more liquid liabilities (deposits with short maturities6). In this activity of transformation, the interest rate plays a crucial role as a price of money. For both sides of bank’s balance sheet, the bank is exposed to interest rate risk. In total, financial intermediation in conventional banking implies completely risk bearing.
Managing this interest rate risk is very important to the bank as a financial intermediary. This influences bank’s profitability because net interest margins constitute the main source of banking revenue.
This implies that the bank must keep eyes on the evolution of interest rates. Every unexpected variation can have huge effects on bank’s profitability. It can also affect bank’s capital position. That’s why the bank must have a prudent management of the risks involved. Among the ways of managing risk, the bank can choose its transfer. The risk transfer relates to shifting a defined amount of exposure to a third party via a derivative or an insurance contract.
As financial intermediaries, banks collect money from surplus spending units and lend it out to deficit spending units. Deposits collected by the banks are generally of short term while loans have long maturities. This mismatch between liquid liabilities and illiquid assets exposes the banks to high liquidity risk. This risk was qualified by Deep and Schaefer (2004) as « liquidity transformation gap » (LT gap). The authors define LT gap as « the difference between liquid liabilities and assets held by a bank, scaled by its total assets. The intuition is that a bank financed in large part by liquid deposits and that holds mostly illiquid loans (and thus a small proportion of liquid assets) performs a significant amount of liquidity transformation and would have a high LT gap value »7.
Banks have to deal with this maturity risk coming from characteristics of their balance sheet. They have to alleviate the maturity gap between assets and liabilities in order to reduce their exposure to funding liquidity risk. In this sense, some authors recommend that banks hold a « buffer » of liquid assets (Acharya et al, 2011, Allen and Gale, 2004, Farhi et al, 2009, and Vives, 2011). However, this proposal has little support in practice because « holding liquid assets is costly, given that they provide lower returns than illiquid assets. Moreover, holding a liquidity buffer may also be inefficient, as it limits banks’ ability to provide liquidity to entrepreneurs and consumers » (Bonfim and Kim, 2013, p.6).
In practice, banks prefer shifting rather than bearing the risks involved by their activity. They use derivatives as instruments of risk-transferring. Thus, interest rate swaps, futures, options and customized agreements are used to alter the balance sheet risk exposure.
The last financial crisis (2007-2008) was the best illustration of risk-transferring by banks. To decrease their exposure to the risk of subprime mortgages, the banks proceeded to their securitization into mortgage-backed securities (MBS) and collateralized debt obligations (CDOs). Due to a higher return, these securities (MBS and CDO) were attractive to investors who were not aware of the risk they are going to bear. This was a determinant factor in the propagation of the crisis to the rest of the financial system.
Generally, banks succeed to restore their financial solvency through securitization. By so doing, they transfer the risk to others. However, the risk originally due to information asymmetries between debtor (client) and creator (bank) is far from being reduced. On the contrary, new information asymmetries are « brought to financial markets because the
6 The high liquidity of deposits, in addition to their safety, is very important to ensure the attractiveness of this banking product in comparison with other investments (Diamond and Dybvig 1983). 7 Deep and Schaefer (2004, p.5)

6
complexity of the instruments and their lack of transparency made it difficult for investors to evaluate securitized assets » (Kirabaeva, 2011, p.13)
4. Empirical Analysis of Conventional and Islamic Banks of MENA Region A large empirical literature developed, in the two last decades, to compare performance of Islamic and conventional banks. Studies on this subject can be classified upon two criteria: The performance indicator used and the arrangement of the sample. The first criterion permits to separate studies using traditional financial ratios (Samad, 1999; Hassan and Bashir, 2003; Bader and al. 2007) to assess banking performance from those who use frontier analysis approaches (parametric and non-parametric) to assess banking performance. The second criterion is relative to the structure of the sample used to compute the score of performance (efficiency). Some studies evaluate efficiency of Islamic and conventional banks separately (e.g. Yudistira 2004, Brown and Skully 2005, Hassan 2005, Weill 2004, Bos and Kool, 2006). Others (e.g. Al-jarrah and Molyneux 2003, Al-Shammari 2003, Hussein 2004, Bader and al. 2007) compare the efficiency of Islamic with conventional banks.
Despite a small tendency of empirical studies to suggest that Islamic banks are more efficient than conventional banks, there is no conclusive evidence in this regard.
To further substantiate on this controversial issue, our study considers the case of banks in MENA region and Iran over the period 2000-2010 and applies a new method. By adopting a bad output technical efficiency, the objective is to assess empirically the effect of Risk-Sharing claimed theoretically by Islamic Finance literature on banking efficiency.
The aim of this work is to derive technical efficiency scores that take into account the risk sharing aspect of the banking activities in the banks. The idea behind this issue is to redefine the type of output produced by banks. Indeed, under standard efficiency analysis where both Islamic and conventional banks are assumed producing a unique homogenous and non-differentiable output.
In this paper, this assumption will be relaxed by taking into consideration a composite and differentiable bundle of output: “good” loans and “bad” loans. This differentiation is claimed by Islamic banks as the core of the difference between Islamic and conventional banking.
Theoretically, the loan selectivity process conducted a priori by Islamic banks has two opposite effects; it permits to the Islamic banks to reduce the risk inherent to the banking activity but also reduces ipso facto loans possibilities and potential banking activity. However, conventional banking tends to take more risk a priori in financing the economy, which is likely to enhance the profitability as long as it exposes the bank to a higher risk of non-solvability.
As a consequence, both conventional and Islamic banks do not operate under the same strategies and do not produce the same output quality. Therefore, any empirical assessment of the gap between conventional and Islamic banks (if there is any) should take into account this trade-off between loans’ granting and risk taking.
Most previous studies on the issues of bank efficiency and productivity change apply either the data envelopment analysis (DEA) or the stochastic frontier approach (SFA) to find the production or cost frontier. Recently, the directional technology distance function (DDF), proposed by Färe et al. (1997), had drawn much attention of empirical researchers. Almost all works, except for Koutsomanoli-Filippaki et al. (2009), adopt the DEA to investigate the efficiency and productivity of firms, and though DEA has several strengths such as being free from specifying a functional form, it is unable to separate the effect of random shocks on the estimated efficiency scores. Conversely, the SFA assumes composed errors that distinguish statistical noise from the technical inefficiency term, while it requires specifying a particular functional form.

7
Following Koutsomanoli-Filippaki et al. (2009), this paper applies the stochastic frontier DDF to investigate bank efficiencies in MENA countries. The advantages of using this DDF are as follows. First, it characterizes the joint production of desirable outputs with undesirable outputs and allows for a bank to increase desirable outputs and concurrently decrease inputs and undesirables. This differs from either the input- or the output-oriented distance function that permits either input savings or output expansion, but not both, and is incapable of handling undesirable outputs.
In the banking industry, non-performing loans may be viewed as an undesirable, by-product jointly produced with various loans. According to Färe and Grosskopf (2005), desirable outputs are said to be null-joint with undesirable outputs, if there are no bad outputs produced, then only zero good output can be produced. Furthermore, undesirables are assumed to be weakly disposed, i.e., the disposal of them needs to consume resources and is not costless. Consequently, the exclusion of undesirables from the model is apt to overestimate the technical efficiency score. Especially, when dealing with banks that are not operating either in the same legislative umbrella or seemingly the same technology.
4.1 Directional technology distance function
Following Cuesta and al. (2005), Koutsomanoli-Filippaki and al. (2009) and more recently Huang, and al. (2015) we assume that banks are producing under K different technologies described by , , : canbeusedbyfirmsingroupktoproduce ,
where stands for the vector of inputs, for the vector of desirable outputs and for the vector of bad outputs. As mentioned above, rather than assuming only output expansion or input contraction, banks are tending to reach more efficient production points by simultaneously expanding outputs and contracting inputs. The directional distance based on these assumptions is called hyperbolic distance. Based on this more realistic assumption the directional technology distance function (DDF) for group k is defined as:
, , ; : , , ∈ (1)
, , ; expands outputs in the direction , and contracts inputs and undesirables in the directions and , respectively, in order to be able to produce on the group frontier. The DDF translates the (x, y, b) vector in the direction g onto the boundary of the technology.
Since (x, y, b) is usually interior to technology , the value of the distance function is non-negative. A firm having a value of , , ; 0 implies that it is already producing at the frontier, while a value of , , ; 0 reveals that the firm’s actual (x, y, b) locates underneath the frontier. Following Koutsomanoli-Filippaki et al. (2009), the directional vector herein is specified as g = (1,1,1), which means that a firm can produce at the efficient frontier if it simultaneously reduces its input quantities and undesirables by β units and increases outputs by β units along with the direction (1,1,1).
In order to transform the DDF in (1) into an empirical form that can be estimated we opt for the translog functional form which is flexible enough to handle both input and output directions. i.e:
, , , , ; (2)
Where TL is the translog functional form, is a set of parameters describing the distance function to be estimated and is a standard error term.

8
β is chosen among the set of inputs and the output arbitrary. We chose in this paper arbitrary as the scaling factor. By making use of the homogeneity properties of the TL8 and by scaling up to (2) we obtain after rearranging terms:
∗, ∗∗, ∗; (3)
Where the exponent ∗ / , ∗∗ and ∗ / .
In equation (3) , , 0 is the distance function separating actual input and
output mix from the optimal mix point lying on the frontier and modeled as a positive random variable.
4.2 Metafrontier directional distance function
Since production technology in the banking industry can be different between conventional and Islamic banks each group is treated aside: a separate stochastic directional distance function is estimated for each group. In order to be able to compare groups’ performance in term of technical efficiency, it is necessary to bring the separate frontiers into a “common ground”. The basic idea behind the metafrontier is to estimate a unique common frontier dominating the set of production frontiers. This metafrontier is considered as the leading production technology. i.e:
, , ; ∗ , , ; (4)
To be able to compare the efficiency of groups of producers operating under different production technologies their efficiency scores are corrected by the distance ratio separating each group specific frontier to the metafrontier. This ratio is called Technological Gap Ratio (TGR hereafter).
, , ;∗ , , ;
(5)
The idea was pioneered by Battese and al. (2004) and O’Donnell and al. (2008) that utilize linear and/or quadratic programming techniques to calculate the unknown parameters of the metafrontier. Even though simulation or bootstrapping methods are recommended to obtain the standard errors of the calculated parameters, their statistical properties are still not known such that no inferences can be made. As the so derived metafrontier is deterministic in essence, it is unable to escape from the influences of the random shocks.
In order to bypass this shortcoming, we opt in the framework of this article for modified version of a new technique proposed by Huang and al. (2015) which consists on the estimation of a stochastic directional metafrontier function.
By making use of the directional distance function in (3), we define a stochastic directional metafrontier ∗ , , such that:
, , ∗ , , ∗ ∗ (6)
Equation (6) implies that all the frontiers of the different groups are enveloped by a stochastic metafrontier ∗ , , ∗. Here again ∗ is a non-negative random variable depicting the (logarithmic) distance between each group specific frontier and the leading technology assessed by the metafrontier. Based on (6) The TGR can be estimated by
∗.
8 Discussion of the homogeneity properties of (2) are above the scope of this article and can be retrieved in Cuesta and al. (2005), Koutsomanoli-Filippaki et al. (2009) among others.

9
Since the true value of the group specific distance functions are not known, they are replaced
by their fitted values . . Since the residuals are derived from different groups so
the fitted values of the distance function are heteroscedastic. The problem can be solved by estimating separate variances for the two sided error term for each group.
5. Estimation and Empirical Results In order to estimate the model established above and to derive technical efficiency scores along with the TGR scores we use Bankscope database to build a non-balanced panel of 318 banks from the MENA region covering 2000-2010. The total number of observations is 1357 distributed over 17 countries of the region. Countries are: Algeria, Bahrain, Egypt, Iraq, Iran, Jordan, Kuwait, Lebanon, Morocco, Oman, Qatar, Saudi Arabia, Sudan, Syria, Tunisia, United Arab Emirates and Yemen. Among the sample, 291 observations are related to Islamic banks while the remaining observations are conventional banks. Conventional banks in this article are standard commercial banks apart from banks specialized in investment or credit or real estate. According to the intermediation approach, two desirable outputs are retained for the estimation purposes which are Loans ( and Other Earning Assets ( . In order to take into account the risk inherent with banking activity, Nonperforming Loans are introduced as a bad output ( . On the other side, we assume that these outputs are produced by a mix of three inputs that are labor ( ) proxied by Personnel Expenses, Capital ( ) proxied by Fixed assets and Deposits and Short term funding9 ( ). All data are in Millions of US Dollar and deflated by the GDP deflator at 2005 prices.
As shown in Table.1 and based on a z-test of mean comparison, Nonperforming loans are significantly higher for conventional banks on the average. Apart Loans, Other Earning Assets and Personnel Expenses, all variables are significantly different for the two types of banks.
As mentioned above, Labor variable proxied by Personnel Expenses is used as a scaling factor for the estimation of both the directional distance functions of each bank type and the metafrontier distance function.
The estimation of the directional distance is based on the following equation:
∑ ∗∗ ∑ ∗∗ ∗∗
∑ ∗ ∑ ∑ ∗ ∗
∑ ∑ ∗∗ ∗
∗ ∗ +∑ ∗∗ ∗
² ∑ (7)
where , and b are as defined earlier, the s are countries dummies in the sample. t stands for the time trend in order to depict any technical change during the sample time span.
All Greek letters are parameters to be estimated.
In a first step Equation (7) is estimated by the ML method for each type of banks separately. The non-negative random term is modeled as half normal which is the most common parametric form used in the literature. Inefficiency terms estimates are derived by making use of the conditional method of Jondrow and al. (1980).
9 Long term funding is excluded in order to emphasis on the fact that the directional distance function should estimate a short term production technology with no inputs hold fixed.

10
The estimation results are present in Table 2 10. Results are compliant with the economic theory suggesting that the TL function should be decreasing and quasi convex in inputs and increasing and quasi concave in outputs for at least 80% of the data points11. To test whether the two groups of banks operate under significantly different technology a LR test was performed to compare Log-likelihoods of pooled model and separated group estimation. LR was equal to 906.06 which reject definitely at less than 1% the assumption of common technology between the two groups of banks.
Recall that technical efficiency scores derived for each group separately cannot be used for inter group comparison purposes since each set of technical efficiency scores are based on separate frontiers.
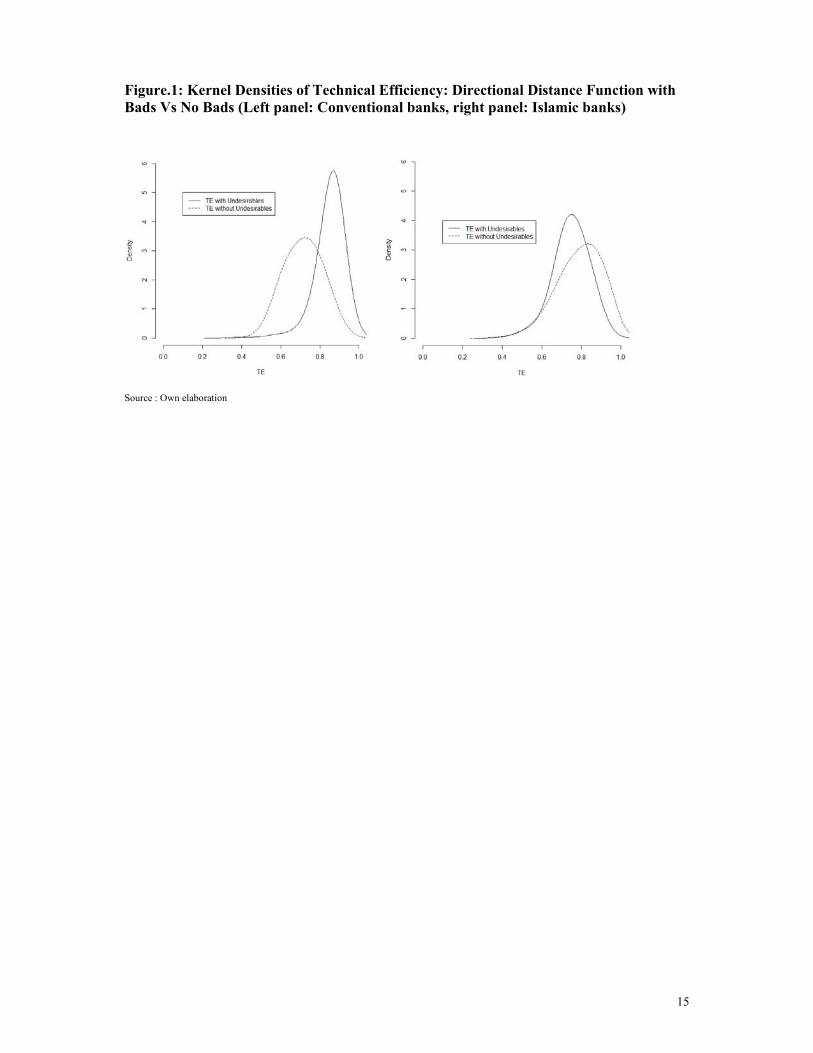
In order to fully understand the impact of the integration of the undesirable output into the model; the directional distance functions for both conventional and Islamic banks are estimated with and without non-performing Loans. As Figure 1 shows, NPLs have a completely different effect on the correction of technical efficiency. Technical efficiency scores derived from the directional distance functions without undesirables are significantly higher for Islamic banks. Whilst conventional banks show efficiency scores with undesirables higher than scores without undesirables. This result suggests two interpretations: the first interpretation is that conventional banks are more efficient in dealing with the risk inherent to NPLs. The second interpretation is that Islamic banks are confronted to a larger operating risk that leads to a failure in operating under the optimal mix of inputs and outputs.
Since weak disposability of outputs is assumed, this result implies that conventional banks in the MENA region are more efficient in holding the optimal mix between desirables and undesirables.
Estimates of the metafrontier directional distance function are in Table.1 (column 4). Note that the problem of heteroscedasticity is handled by allowing to the two-sided error term’s variance to vary with the bank type. The estimation results show that the variance of the Islamic banks is significantly inflated by .018, which is the coefficient of a dummy variable, Isl_V, equal to 1 if the bank is Islamic. This result implies that Islamic banks are operating under a more risky production process since the frontier is more volatile.
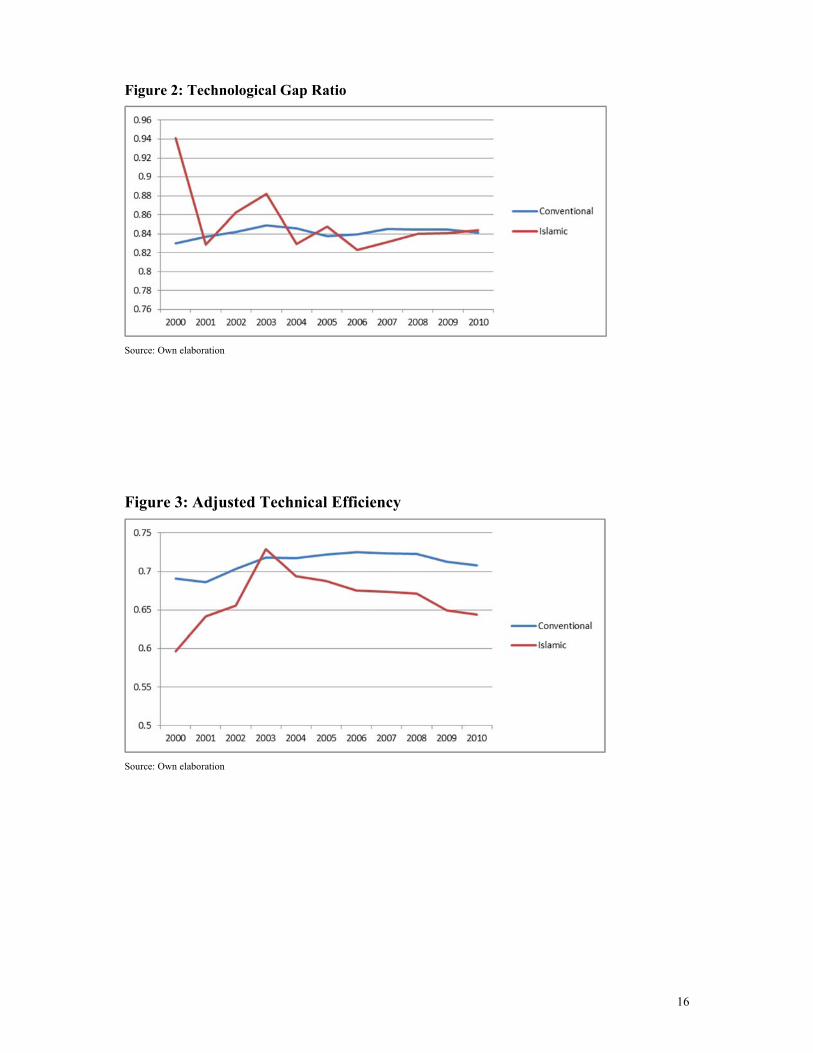
Average technical efficiency scores based on each group directional distance function (7) along with the TGR scores estimated from the metafrontier directional distance for each country are presented in Table.3. It is worth mentioning that average inefficiency scores across countries within the same bank type are comparable since they are gauged against the same frontier. However, for the sake of being practical, our analysis will be based on the last two columns of Table.3 when it comes to the comparison of Efficiency scores between countries and between bank types. It’s worth mentioning that the metafrontier based technical efficiency scores TE* are retrieved by multiplying group technical efficiency by TRG. Average technical inefficiency scores range from 0.68 (Syria) to 0.76 (Saudi Arabia and Oman) for conventional banks. For Islamic banks the Average technical inefficiency scores range from 0.51 (Syria) to 0.75 (Tunisia)12. Based on TGR scores (Figure.2), it’s worth mentioning that, based on t-test there is no significant difference between the overall averages of TGR scores whether banks are conventional or Islamic. When it comes to the comparison between the adjusted scores of technical efficiency, Conventional banks on the average are mastering Islamic banks for all the
10 ∗ is dropped from the estimation for all specification to overcome a serious problem of multicollinearity. This has no impact on the results since quadratic and cross product variable based on ∗ are in the equation and all regularity conditions along with the required flexibility of the function are retrieved. 11 Results are not reported here. 12 Technical efficiency score of Islamic banks in Tunisia should be considered carefully since this score is obtained from a unique bank observed for 5 years.

11
countries of the sample where data on both banks type are available. The exceptions are Jordan and Tunisia where Islamic banks are slightly more technically efficient but the difference in these countries is not significant due to the small number of observations for Islamic banks (12 and 5 observations respectively).
Evolution of Adjusted Technical efficiency scores through time is presented in Figure.3. Except for 2003, the average technical efficiency of conventional banks is significantly larger than scores of Islamic banks (based on t-tests).
6. Concluding Remarks In this paper, the aim was to test the Risk-Sharing principle claimed by Islamic banks and theoretically advocated by some researchers. For the time being, no empirical assessment of bad loan risk efficiency has been conducted to compare the performances of the conventional banks versus Islamic banks. In fine, the aim was the evaluation of two competing banking strategies: reducing loan granting possibilities and reducing bad loans’ risk versus developing loan possibilities and bear more exposure to the risk of bad loans.
The analysis was conducted by making use of the Hyperbolic Directional Distance function estimated separately for Islamic and conventional banks. Since these banks are operating under different technologies, a metafrontier directional distance function was estimated in order to retrieve technological Gap Ratios which permitted to bring the technical efficiency scores for the two groups into a common ground for sake of comparison. Up to our knowledge, no previous research has been tackled on issue based on a stochastic metafontier.
The main conclusion of this article is that conventional banks in the MENA region are more efficient than Islamic banks even if Non Performing Loans are introduced as a penalizing undesirable output. It was found that there was no significant discrepancy between the two groups of banks in terms of their gap between their own technology and the leading technology throw-out the whole region. However, the difference is purely a technical efficiency gap in the sense that conventional banks in the region have the capacity of using the most efficient mix of desirables, undesirables and inputs.

12
References
Acharya, V., H. Shin and T. Yorulmazer (2011), « Crisis Resolution and Bank Liquidity », Review of Financial Studies, 24(6), 2166-2205.
Al-Jarrah, I. and P. Molyneux (2003), « Efficiency in Arabian Banking », paper presented at the International Conference on Financial Development in Arab Countries, Abu Dhabi, UAE.
Allen, F., and D. Gale (2004), « Financial fragility, liquidity and asset prices », Journal of the European Economic Association, 2(6), 1015-1048.
Allen.F, Carletti.E and Marquez.R (2014), « Deposits and Bank Capital Structure », European University Institute.
Al-Shammari, S. (2003), « Structure-conduct-performance and the Efficiency of GCC Banking Markets », Ph.D thesis, University of Wales, Bangor, UK.
Ansari.S and Rehman.K, (2011), « Comparative Financial Performance of existing Islamic Banks and Contemporary Conventional Banks in Pakistan », 2nd International Conference on Economics, Business and Management, IPEDR, 22, pp.45-49.
Archer.S, Abdel Karim.R.A and Sundararajan.V (2010), « Supervisory, regulatory, and capital adequacy implications of profit-sharing investment accounts in Islamic finance », Journal of Islamic Accounting and Business Research, vol. 1(1), pp.10-31.
Ariff.M (2013), « Islamic Banking in Malaysia: Industry at Crossroads », perspectives, vol. 21(4), pp. 12-14.
Bader.M.K, Shamsher.M, Ariff.M and Taufiq.H, (2007), « Cost, revenue, and profit efficiency of Islamic versus conventional banks: International evidence using financial ratios approach », Review of Islamic Economics, Volume 11, number 1, May.
Battese, G.E., Rao, D.S.P., O’Donnell, C.J., 2004. A metafrontier production function for estimation of technical efficiencies and technology gaps for firms operating under different technologies. J. Prod. Anal. 21, 91–103.
Battese.G.E, Rao.D.S.P and O’Donnell.C.J (2004), « A Metafrontier Production Function for Estimation of Technical Efficiencies and Technology Gaps for Firms Operating Under Different Technologies », Journal of Productivity Analysis, 21, 91-103.
Bonfim.D and Kim.M (2013), « Liquidity risk in banking: is there herding?. European Banking Center Discussion Paper no 2012-024.
Bos.J.W.B and Kool.C.J.M (2006), « Bank Efficiency: The Role of Bank Strategy and Local Market Conditions », Journal of Banking and Finance, 30, pp.1953-1974.
Brown.K and. Skully.M (2005), « Islamic Banks: A Cross-Country Study of Cost Efficiency Performance, Accounting, Commerce & Finance”, The Islamic Perspective Journal, 8(1-2), pp.43-79.
Chaffai M.E. (2015) Technical Efficiency and Stability to Shocks: A Comparison between Islamic Banks and Conventional Banks in MENA Region. Presented in the 21th ERF Tunis, 2015.
Cuesta R. A., Zofio J., L., (2005). Hyperbolic efficiency and parametric distance functions : with application to Spanish saving banks. Journal of Productivity Analysis. 24,31-48
Dar.A.H and Presley.J.R (2000), « Lack Of Profit Loss Sharing In Islamic Banking: Management And Control Imbalances », International Journal of Islamic Financial Services Vol. 2 No.2, pp.3-18.

13
Deep.A and Schaefer.G, (2004), « Are banks liquidity transformers? », Harvard University Faculty Research, Working Paper.
Diamond.D.W and Dybvig.P.H, (1983), « Bank runs, deposit insurance, and liquidity », Journal of Political Economy, No 91, pp.401-419.
Färe, R., Grosskopf, S., (2005). Newdirections: efficiency and productivity. Kluwer Academic Publishers, Boston, U.S.A.
Farhi.E, Golosov.M and Tsyvinski.A (2009), « A theory of liquidity and regulation of fi nancial intermediation », Review of Economic Studies, vol. 76(3), pp.973-992.
Farook.M.O (2007), « Partnership, Equity-Financing and Islamic Finance: Whither Profit-Loss Sharing? », Review of Islamic Economics, Vol. 11, Special Issue, pp. 67-88.
Farook.S, Hassan.M.,K. and Clinch.G, (2012), « Profit distribution by Islamic banks: An empirical investigation », The Quarterly Review of Economics and Finance, vol.52, pp.333-347
Hanif.M and Iqbal.A, (2010), « Islamic Financing and Business Framework: A Survey », European Journal of Social Sciences, vol. 15 (4), pp. 475-489.
Hanif.M, (2011), « Differences and Similarities in Islamic and Conventional Banking », International Journal of Business and Social Sciences, Vol. 2, No. 2, avril, pp.166-175.
Hassan, M. K. and Bashir, A. M. (2003), « Determinants of Islamic banking profitability », ERF paper.
Hassan.M.K and Lewis.M.K (2007), « Ends and Means in Islamic Banking and Finance », Review of Islamic Economics, Vol. 11, Special Issue, December, pp.5-27.
Hassan.M.K, (2005) « The Cost, Profit and X-Efficiency of Islamic Banks »: Economic Research Forum 12th Annual Conference, Cairo, Egypt.
Huang Tai-Hsin, Dien-Lin Chiang, Chao-Min Tsai, (2015). “Applying the New Metafrontier Directional Distance Function to Compare Banking Efficiencies in Central and Eastern European Countries” Economic Modelling 44 (2015) 188–199.
Huang, C.J., Huang, T.H., Liu, N.H., (2014). A New Approach to Estimating the Metafrontier Production Function Based on a Stochastic Frontier Framework. Journal of Productivity Analysis 42, 241–254.
Hussein, K. H. (2004), « Banking efficiency in Bahrain: Islamic versus Conventional Banks », Islamic Development Bank, Islamic Research Training Institute, Research Paper, No. 68.
Jondrow J., Lovell C.A.K, Materov I.S, Schmidt P., (1982). On the estimation of technical inefficiency in the stochastic frontier production function model. Journal of Econometrics, 23, 269-274
Kirabaeva.K, (2011), « Adverse Selection and Financial Crises », Bank of Canada Review, 2011, vol. 2010-2011, issue Winter, pp. 11-19
Koutsomanoli-Filippaki, A., Margaritis, D., Staikouras, C., (2009). Efficiency and productivity growth in the banking industry of Central and Eastern Europe. J. Bank. Financ. 33, 57–567.
Patel.A, (2013), « Financement des PME : une place pour les sukuks participatifs ? », Working Paper Université Paris 1 Panthéon-Sorbonne.
Rosly.S (1999), « ’Al-bay’ bithaman ajil financing: Impacts of Islamic banking performance », Thunderbird International Business Review, vol. 41, pp.461–480.

14
Samad.A. (1999), « Relative Performance of Conventional banking vis-à-vis Islamic Bank in Malaysia », IIUM Journal of Economics and Management, vol. 7 (1), pp.1-25.
Vives.X (2011), « Strategic Complementarity, Fragility, and Regulation », CEPR Discussion Paper 8444
Weill.L (2004), « Measuring Cost Efficiency in European Banking: A Comparison of Frontier Techniques », Journal of Productivity Analysis, 21, pp.133–152.
Yudistira, D (2004), « Efficiency in Islamic Banking: An Empirical Analysis of 18 Banks », Islamic Economic Studies, vol.12(1), pp.1-19
15
Figure.1: Kernel Densities of Technical Efficiency: Directional Distance Function with Bads Vs No Bads (Left panel: Conventional banks, right panel: Islamic banks)
Source : Own elaboration
16
Figure 2: Technological Gap Ratio
Source: Own elaboration
Figure 3: Adjusted Technical Efficiency
Source: Own elaboration

17
Table 1: Descriptive Statistics Conventional Islamic Mean sd Mean sd Loans ( 3296 5068 3043 5122 Other Earning Assets ( 2481 3358 1311 3389 Nonperforming Loans (b) 176 312 120 315 Personnel Expenses ( 53 75 55 76 Fixed assets ( ) 70 187 163 189 Deposits and Short term funding ( ) 5243 7098 3961 7169
Table 2: ML Estimation Results Conventional Islamic Pooled Metafrontier intercept 1.451*** 2.054*** -0.589*** 0.791*** y1 -0.175*** -0.228*** 0.269*** 0.144*** y2 -0.349*** -0.41*** 0.19*** -0.147*** b -0.133*** 0.148** 0.021 -0.481*** x2 -0.103* -0.107 -0.23*** 0.073** y1^2 -0.197*** -0.152*** -0.206*** 0.014 y2^2 -0.241*** -0.134*** 0.074*** -0.113*** b^2 -0.016** 0.016 0.072*** -0.079*** y2b -0.013** 0.008 -0.052*** -0.032*** x2^2 0.144*** -0.001 -0.032*** 0.001 x3^2 0.048*** 0.083*** -0.053*** -0.231*** x2x3 0.006 -0.011 -0.173*** 0.074*** y1x2 0.122*** 0.035*** 0.097*** 0.034*** y1x3 -0.071*** -0.004 -0.045*** -0.026** y2x2 -0.116*** -0.019* 0.017 -0.144*** y2x3 0.088*** 0.008 -0.015 0.156*** y2y1 0.216*** 0.147*** 0.027** 0.046*** by1 0.014*** -0.003 -0.062*** -0.013* bx2 -0.009 -0.003 0.006 -0.073*** bx3 0.03** -0.045*** -0.046*** 0.154*** t -0.025** -0.076* 0.09*** -0.029** t^2 0.003** 0.013** 0.025 0.004** SigmaV 0.131*** 0.131*** 0.171*** 0.184*** SigmaU 0.227*** 0.321*** 0.599*** 0.224*** Isl_V - - - 0.018* LogL 410.97 -3.71 -45.41 83.83 Source : own elaboration

18
Table 2: Technical Efficiency and Technological Gap Ratio TE TGR TE* Conventional Islamic Conventional Islamic Conventional Islamic ARE 0.84 0.78 0.83 0.85 0.70 0.66 BHR 0.82 0.83 0.85 0.82 0.69 0.67 DZA 0.89 na 0.84 na 0.74 na EGY 0.85 0.81 0.85 0.87 0.72 0.71 IRN Na 0.80 na 0.82 na 0.66 IRQ 0.87 na 0.81 na 0.71 na JOR 0.86 0.83 0.84 0.87 0.72 0.73 KWT 0.89 0.81 0.82 0.86 0.73 0.70 LBN 0.86 0.95 0.85 0.54 0.72 0.51 MAR 0.78 na 0.86 na 0.67 na OMN 0.89 na 0.85 na 0.76 na QAT 0.84 0.83 0.85 0.84 0.71 0.70 SAU 0.88 0.78 0.87 0.85 0.76 0.66 SDN 0.82 0.75 0.81 0.85 0.67 0.64 SYR 0.82 0.64 0.83 0.80 0.68 0.51 TUN 0.86 0.88 0.85 0.85 0.72 0.75 YEM 0.86 0.82 0.85 0.82 0.73 0.67 Total 0.851 0.798 0.843 0.841 0.716 0.669
Source: Own elaboration