risk reward - parque arauco - el mostradorprice target clp$1500 based on a dcf model and an nav...
TRANSCRIPT

MORGAN STANLEY MÉXICO, CASA DE BOLSA, S.A. DE C.V.+
Nikolaj Lippmann+52 55 5282-6778
MORGAN STANLEY C.T.V.M. S.A.+
Jorel Guilloty+55 11 3048-9620
MORGAN STANLEY & CO. INTERNATIONAL PLC+
Lillian Starke+44 20 7425-9104
Parque Arauco SA ( PAR.SN, NA )
NA / Chile
Stock RatingStock Rating OverweightOverweightIndustry ViewIndustry View NANAPrice targetPrice target Ch$1,500.00Ch$1,500.00Shr price, close (Nov 24, 2015) Ch$1,114.10Mkt cap, curr (mm) Ch$914,56552-Week Range Ch$1,301.00-1,071.00
Fiscal Year Ending 12/14 12/15e 12/16e 12/17e
EBITDA (Ch$ mm)** 85,554 99,278 110,640 139,952Div yld (%) 2.7 2.7 2.6 3.6ModelWare EPS (Ch$)ModelWare EPS (Ch$) 73.2773.27 70.9770.97 80.1380.13 100.32100.32Unless otherwise noted, all m etrics are based on Morgan Stanley ModelWare fram ework** = Based on consensus m ethodologye = Morgan Stanley Research estim ates
Industry ViewNA
Stock RatingOverweight
Price TargetCh$1,500.00
Parque AraucoParque AraucoNovember 25, 2015
Yield and Growth from a Top AndeanMall Operator; Initiate at OW
Initiating coverage of Parque Arauco, a leading mall operator in Chilethat is expanding into Colombia and Peru, at OW with a C$1,500 PT.Our analysis suggests almost a free option on a multiyear externalgrowth story that is being ignored.
Parque Arauco has best-in-class mall operations in Chile and importantgrowth expansions in Peru and Colombia. The company has two of theoldest and best malls in Chile and operates some of the most productive mallsin the region. Portfolio occupancy costs are at ~11.5% in Chile, among thehighest in the region and in line with the best US malls. Productivity is amongthe highest in the region, especially in Chile, the tenant base is diversified, andParque Arauco ranks well on governance. Chile is the region's most maturemall market, and Parque Arauco has the ability to use best practices learned athome in expansion markets
Growth through expansion and higher margins... We forecast GLAgrowing 22% in 2015-17, with margins set to expand by ~200bps as SG&Agets diluted into more operations and malls mature. We expect additionalmargin expansion beyond 2017 driven by consolidation. We forecast ~50%NOI and EBITDA growth in 2015-18, positive cash flow, and a dividend yield of~3%. We expect negative FCFE in 2016-17 due to the growth, but positiveFCFE equivalent to 6% yield in 2018.
...at a reasonable price. We see a 4:1 bull:bear skew and 2:1 base:bear skew.Parque Arauco is trading at an 11% implied cap rate (adjusted fordevelopment and landbank); this is in line with mall operators in Brazil, amarket with much higher risk than Chile, and a 300bp discount to Fibras, towhich the company is akin. At our price target, the stock would trade at ~14x2016e EBITDA, a small premium to the industry that we think is warranted byhigher growth. Parque Arauco carries a heavy load of SG&A that we expect willbe diluted as new malls open up. Parque Arauco is not a REIT but a C-Corp thatpays an effective tax rate of ~25% and thus should not trade in line with mallFibras in Mexico. At our PT, Parque Arauco shares would trade at aconservative 8.5% cap rate, north of mall REITs in Mexico and the US at 7% and5%, respectively. This implies an expected return of 35%.
Where could we be wrong? The expansion outside of the core market carriesrisks. Colombia is a market with little tradition in the rental mall model. Wecould be underestimating the difficulty in transitioning from owning to renting.We could also be too bullish on the Colombian consumer.
Morgan Stanley does and seeks to do business withcompanies covered in Morgan Stanley Research. As a result,investors should be aware that the firm may have a conflictof interest that could affect the objectivity of MorganStanley Research. Investors should consider MorganStanley Research as only a single factor in making theirinvestment decision.For analyst certification and other important disclosures,For analyst certification and other important disclosures,refer to the Disclosure Section, located at the end of thisrefer to the Disclosure Section, located at the end of thisreport.report.+ = An alysts emp loyed by n on -U .S. a ff ilia tes are n o t reg istered w ith F INRA, mayn o t be associated person s o f th e member an d may n o t be su b ject to NASD/NYSErestriction s on commu n ication s w ith a su b ject compan y, pu b lic appearan ces an dtrad in g secu rities h eld by a research an alyst accou n t.
| November 25, 2015Parque Arauco
MORGAN STANLEY RESEARCH
1

Price Target CLP$1500 Based on a DCF model and an NAV analysis. We use a 9.4% WACCin nominal CLP$ derived from a 6.0% pretax cost of debt and a11% cost of equity. For the Ke we assume a beta of 1.0, a risk-freerate of 5% and a risk premium of 6%. For the NAV analysis, weassume a blended 8.5% cap rate for the portfolio and a 11% ROICfor developments using a 9% exit cap rate.
Bull CLP$19008% Terminal Value Cap Rate
Faster than expected lease-up, NOI margins reach Brazilianmall levels. Development assets stabilize in 3 years, hitting 95%occupancy. The NOI margin gap closes to ~90% in-line withBrazilian mall peers, driven by improvements in tenant makeup inPeru and sales improvements in existing Colombian assets.
Base CLP$15009.0% Terminal Value Cap Rate
Steady growth for current assets, developments drivegrowth in Peru and Colombia. Total GLA grows +40% from2014 through 2017, with most of the growth coming from Peruand Colombia. Rents grow at a 1% spread to inflation. EBITDAmargins steadily improve as assets are delivered and stabilized,settling at 71% by 2020, as occupancies etch towards +95% bythen.
Investment ThesisInvestment Thesis
Parque Arauco is a diversified retail real estateowner/operator focused on the Andean regionCurrent revenues come mostly from their homecountry, Chile, yet they have operations in Peruand Colombia.
The company currently has an ambitions US$590mm development program through which theyseek to further their footprint in Peru andColombia and diversify more into smaller conceptssuch as neighborhood centers andstripcenters/outlets. The company also has aUS$183 mm landbank, mostly focused on Peruand Chile.
We believe the growth is warranted, given lowpenetrations levels in Peru and the transition froma tenant-owned to investor-owned rental model inColombia
Assuming a 8.5% weighted average cap rate forthe stabilized properties, we believe that currentvaluations assign zero value to developments andthe landbank.
Key Value DriversKey Value Drivers
Improvements in operating margins, particularly inColombia and Peru
Accelerating consumption in Peru and Chile
Improvements in tenant makeup for malls
Transition in Colombia to a professionally run,rental model
Potential CatalystsPotential Catalysts
Acquisition of partner stakes
Inclusion in MSCI Chile Index
Risks to Achieving Price TargetRisks to Achieving Price Target
Inability to improve operation in Colombia andPeru
Delays in construction or increases in constructioncosts
Oversupply in Peru and Colombia, resulting fromdevelopments, leads to weak rents
Exchange rate volatility
Bear CLP$90010% Terminal Value Cap Rate
Margin expansion never materializes as development leaseup is delayed and growth slows down in the Andean region.NOI margins remain depressed. SG&A/revenues does not improvedriven in part by delays. Developments go 10% over budget, with9% ROIC rather than 11%.
Risk Reward - Parque AraucoRisk Reward - Parque Arauco
Exposure to Top Andean Assets with Growth for Free
Sou rce: Th omson Reu ters, Morgan Stan ley Research
| November 25, 2015Parque Arauco
MORGAN STANLEY RESEARCH
2

Yield from Top Andean Assets, with Growth for FreeYield from Top Andean Assets, with Growth for Free
Yield from top Andean assets, with growth for free. We initiate coverage of Arauco at OW, with a CPL 1,500PT, implying +35% upside. Parque Arauco's retail portfolio is diversified across Andean countries (Chile, Peru,and Colombia) and concepts (malls, strip centers, outlets), with some of the top malls in the region. Thecompany has plans to diversify even further through a US$590 mm development plan. Our bullish view onParque Arauco stands on 3 pillars: development, internal growth, and current yield.
1) Development : Arauco has US$590 mm in capex setto increase its footprint by 40%/50% from 2014 on atotal/owned GLA basis. We believe the growth makessense, given Peru's low level of penetration andColombia's shift from a tenant owned to an investor-owned model. Of key importance, our conservative NAVanalysis, which assumes, a 11% ROIC and a 9% exit caprate, shows that the market completely discountsgrowth. In other words, investors are getting thegrowth for free. We analyze the drivers behind thedevelopment pipeline in the Investor Debate.Investor Debate.
2) Internal Growth: The rest of Arauco's portfolioconsists of newer assets, still to be consolidated. Webelieve the NOI and EBITDA margin expansion story is apotent earnings driver, particularly for Peru andColombia. NOI margins in Peru and Colombia lag Chile,driven by lack of consolidation. G&A margins are highin Colombia, driven by high overhead and a low assetbase, which is to be remedied through the delivery ofParque La Colina, which we expect to be +10% ofArauco's revenue when stabilized. We explore thesemargin expansion opportunities in Investor QuestionInvestor Question#1#1 .
3) Current Yield: +50% of Parque Arauco's currentNOI comes from three stabilized, older assets in Chile,which have ~90% NOI margins : Parque AraucoKennedy, Arauco Maipu and Paseo Arauco Estacion.Fully owned by the company, these assets representbest in class performers, who we expect will continue toextract high rent as a percentage of sales from tenants.We further discuss Parque Arauco's ability to extracthigh rents from sales in Investor Question #2Investor Question #2.
Exhibit 1:Exhibit 1: Current price points to a freedevelopment pipeline
Sou rce: Compan y Docu men ts, Morgan Stan ley Research estimates
Exhibit 2:Exhibit 2: Margins are to improve, driven byconsolidation in Peru and Colombia
Sou rce: Compan y Docu men ts, Morgan Stan ley Research estimates
Exhibit 3:Exhibit 3: +50% of current NOI comes fromthree assets, with ~90% NOI margins
Sou rce: Morgan Stan ley Research , Compan y Docu men ts
| November 25, 2015Parque Arauco
MORGAN STANLEY RESEARCH
3

Development track record shows both success and lessons learned. Arauco's goal for developments is tohave assets stabilize 3-5 years after opening, with NOI yields hitting 11-12%. On that basis the track recordlooks mixed, with Colombian assets in particular lagging. We believe though these lower yields/margins are partof growing pains as the company transitions from being an important mall operator in Chile with a smallnumber of easy to understand assets to a regional player.
We believe margin expansion happens for 3 reasons:
1) NOI margin improvement from maturity ofassets: Malls take time to mature; the most productivemalls are often older malls such as Kennedy and Maipu.We think that maturity will be a continuous driver ofNOI expansion for years, as we have seen in other malldevelopers in the region in recent years.
2) Dilution of SG&A as new GLA becomesoperational: The easy part is simply that you have anew revenue stream but in some cases developmentcan be very labor intensive on several departments of amall operator including finance, legal and commercial.In some cases you actually need less people afterdevelopment.
3) Economies of scale & the Parque Arauco Way:We think that Arauco has grown out of its puberty, so to speak. The company is expanding into new marketsand segments and as such it will eventually see the benefits of standardization. We think management willincreasingly be moving towards a scientific or standardized approach to mall management and that it willultimately result in better economics.
Where could we be wrong? We believe among the bigger risks for Parque Arauco is the inability to improveoperational costs in Colombia and Peru and the risk of cost overruns in development projects. For Chile, webelieve the biggest risk is macroeconomic.
Exhibit 4:Exhibit 4: Select Parque Arauco Recent Development NOI Yields
Opening CAPEX YR 3 NOI 3Q15 LTMProject Country Quarter (USD mn) (LOC mn) (LOC mm) Yield Margin Occ.Arauco Quilicura Chile 2Q13 36 17,433 3,203 18.4% 84% 99%Arauco San Antonio Chile 2Q10 45 24,595 2,141 8.7% 61% 94%Mega Plaza Chimbote Peru 2Q12 26 72 9 12.8% 83% 99%Mega Express Villa El Salvador Peru 2Q12 13 35 5 13.0% 76% 98%Parque Caracoli Colombia 2Q13 100 181,741 13,045 7.2% 70% 88%Parque Arboleda Colombia 4Q10 80 163,116 14,961 9.2% 78% 93%Average 11.5% 75.2% 95.3%
Sou rce: Compan y Docu men ts, Morgan Stan ley Research
Exhibit 5:Exhibit 5: We expect owned GLA toincrease+50% from 2014-17, with NOI marginsimproving as assets become stabilized
Sou rce: Compan y Docu men ts, Morgan Stan ley Research estimates
| November 25, 2015Parque Arauco
MORGAN STANLEY RESEARCH
4
Parque Arauco Valuation & Financial SummaryParque Arauco Valuation & Financial Summary
We derive our CLP 1,500 PT primarily through a combination of DCF and NAV, anchoring our valuation withDDM and FCFE. We perform a DCF analysis and consider operating properties as well as those underdevelopment and those pending to be acquired. For this methodology we use a 9.4% WACC in nominal CLP,which assumes a 11.0% cost of equity (1.1 beta, 5.0% risk free rate, and 6.0% market risk premium) and 6.0%cost of debt. Based on our DCF we derive a terminal cap rate of 9.0%. Based on an NAV analysis we derive CLP1,513/sh . For all valuation methodologies we assume fully diluted shares. DDM assumes a 90% payout ratio inthe terminal years. The dividend is similar to the FFO in those years.
At our price target, Parque Arauco shares would trade at trade at a 8.5% cap rate, higher than Mexican peers dueto the taxable structure. Mexican Fibras are exempt from income tax while PA has an effective tax rate of 25%. At8.5% Parque Arauco would trade 100-350 BP tighter than Brazil, which we regard as fair due to the lowercountry risk, FX risk and cyclical risk in PA. On a P/FFO basis,we think Parque Arauco appear particular attractiveat ~16.5x 2016e and 12.8X ffo FOR 2017. Despite the superior growth and a dividend yield similar to the US (indifferent FX), the stock trades at a discount the US peers at 20.4x and in-line with Brazilian peers at 16.5 P/FFO2016e. While only limited data are available with regard to consensus for FFO, and NOI, our estimates areslightly (mid single digits) ahead of consensus on the revenue and EBITDA level for both 2015 and 2016.
In terms of free cash flow and funding we see the company as having negative FCFF for 2015-2016 and toequity it will remain marginally negative until 2017. Beyond 2017 we see a strong cash flow generation. We seea FFO yield of 7.8 % for 2017 and a FCFE % yield of 6% already in 2018, as investments come down after theinternational expansion.
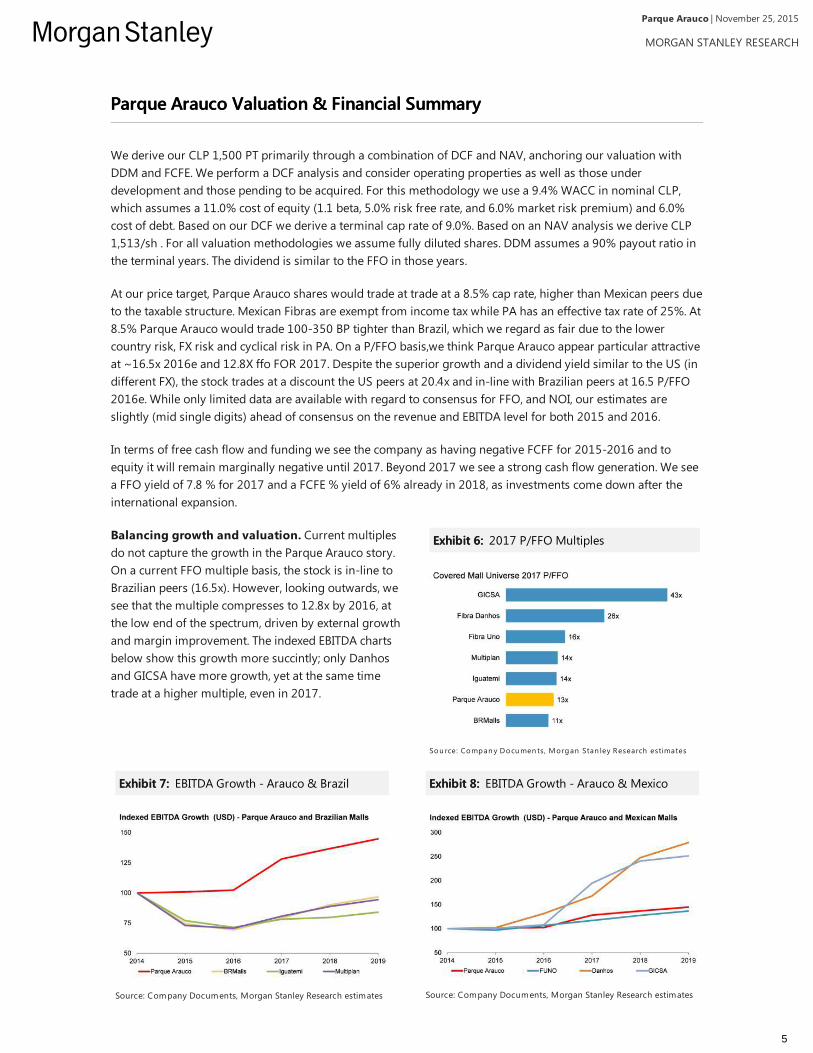
Balancing growth and valuation. Current multiplesdo not capture the growth in the Parque Arauco story.On a current FFO multiple basis, the stock is in-line toBrazilian peers (16.5x). However, looking outwards, wesee that the multiple compresses to 12.8x by 2016, atthe low end of the spectrum, driven by external growthand margin improvement. The indexed EBITDA chartsbelow show this growth more succintly; only Danhosand GICSA have more growth, yet at the same timetrade at a higher multiple, even in 2017.
Exhibit 6:Exhibit 6: 2017 P/FFO Multiples
Sou rce: Compan y Docu men ts, Morgan Stan ley Research estimates
Exhibit 7:Exhibit 7: EBITDA Growth - Arauco & Brazil
Source: Company Documents, Morgan Stanley Research estimates
Exhibit 8:Exhibit 8: EBITDA Growth - Arauco & Mexico
Source: Company Documents, Morgan Stanley Research estimates
| November 25, 2015Parque Arauco
MORGAN STANLEY RESEARCH
5
NAV Analysis Explained
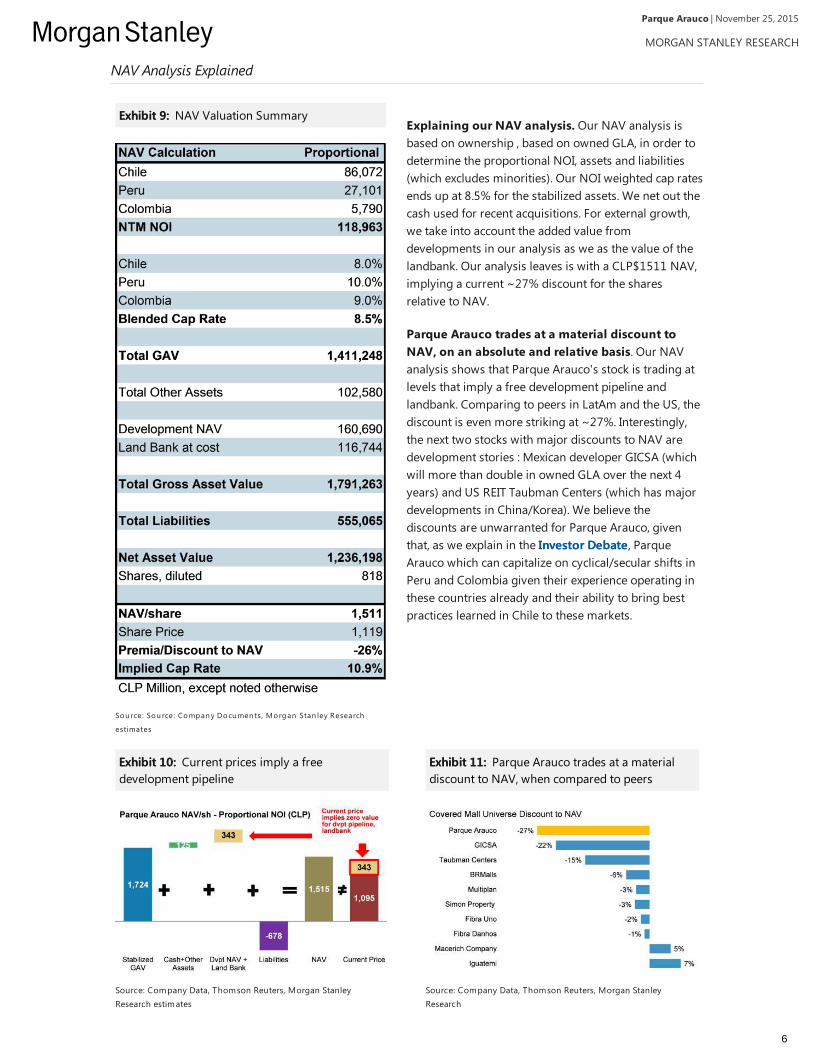
Explaining our NAV analysis. Our NAV analysis isbased on ownership , based on owned GLA, in order todetermine the proportional NOI, assets and liabilities(which excludes minorities). Our NOI weighted cap ratesends up at 8.5% for the stabilized assets. We net out thecash used for recent acquisitions. For external growth,we take into account the added value fromdevelopments in our analysis as we as the value of thelandbank. Our analysis leaves is with a CLP$1511 NAV,implying a current ~27% discount for the sharesrelative to NAV.
Parque Arauco trades at a material discount toNAV, on an absolute and relative basis. Our NAVanalysis shows that Parque Arauco's stock is trading atlevels that imply a free development pipeline andlandbank. Comparing to peers in LatAm and the US, thediscount is even more striking at ~27%. Interestingly,the next two stocks with major discounts to NAV aredevelopment stories : Mexican developer GICSA (whichwill more than double in owned GLA over the next 4years) and US REIT Taubman Centers (which has majordevelopments in China/Korea). We believe thediscounts are unwarranted for Parque Arauco, giventhat, as we explain in the Investor DebateInvestor Debate , ParqueArauco which can capitalize on cyclical/secular shifts inPeru and Colombia given their experience operating inthese countries already and their ability to bring bestpractices learned in Chile to these markets.
Exhibit 9:Exhibit 9: NAV Valuation Summary
Sou rce: Sou rce: Compan y Docu men ts, Morgan Stan ley Research
estimates
Exhibit 10:Exhibit 10: Current prices imply a freedevelopment pipeline
Source: Company Data, Thomson Reuters, Morgan StanleyResearch estimates
Exhibit 11:Exhibit 11: Parque Arauco trades at a materialdiscount to NAV, when compared to peers
Source: Company Data, Thomson Reuters, Morgan StanleyResearch
| November 25, 2015Parque Arauco
MORGAN STANLEY RESEARCH
6

Valuation Summaries and Comparison to Consensus
Exhibit 12:Exhibit 12: Parque Arauco: DCF Valuation Summary
Sou rce: Compan y Docu men ts, Morgan Stan ley Research estimates
Exhibit 13:Exhibit 13: Parque Arauco: FCFE Valuation Summary
Sou rce: Compan y Docu men ts, Morgan Stan ley Research estimates
Exhibit 14:Exhibit 14: Parque Arauco: DDM Valuation Summary
Sou rce: Compan y Docu men ts, Morgan Stan ley Research estimates
Exhibit 15:Exhibit 15: MS vs. Consensus
Sou rce: Compan y Docu men ts, Morgan Stan ley Research
| November 25, 2015Parque Arauco
MORGAN STANLEY RESEARCH
7

Parque Arauco Real Estate ComparablesParque Arauco Real Estate Comparables
Exhibit 16:Exhibit 16: Real Estate Comparables
Note: EV n ets ou t cap ita lized va lu e o f JV. EV/sqm fo r IRSA is ca lcu lated u sin g IRCP En terp rise Valu e. Sou rce: Compan y Data , Th omson O n e, Morgan Stan ley Research estimates. Please n o te th at a ll importan t d isclo su res in clu d in g person al h o ld in gs d isclo su res
an d Morgan Stan ley d isclo su res appear on th e Morgan Stan ley pu b lic w ebsite at w w w .morgan stan ley.com/research d isclo su res.
| November 25, 2015Parque Arauco
MORGAN STANLEY RESEARCH
8

LatAm Economic & Real Estate Cycle: Parque Arauco Markets Are in theLatAm Economic & Real Estate Cycle: Parque Arauco Markets Are in the"Sweet Spot""Sweet Spot"
Exhibit 17:Exhibit 17: We expect flattish rents across the Andean region in USD terms
Sou rce: Morgan Stan ley Research
Exhibit 18:Exhibit 18: Chile, Peru GDP growth is to speedup
MEX
BRA
ARG
Peaking Falling
Rising Bottoming
GDP
PER
COL
CHI
Source: Company Documents, Morgan Stanley Research
Exhibit 19:Exhibit 19: Consumption is healthier in Peru andChile vs peers
MEX
BRA
ARG
Peaking Falling
Rising Bottoming
Consumer
COL
CHI PER
Source: Company Documents, Morgan Stanley Research
Exhibit 20:Exhibit 20: Rates are rising in Andean markets
MEX
BRA
ARG
Peaking Falling
Rising Bottoming
Interest rates
PER
COL
CHI
Source: Company Documents, Morgan Stanley Research
Exhibit 21:Exhibit 21: Andean Rents will grow at inflation
1
MEX
BRA
ARG
Peaking Falling
Rising Bottoming
Rents
PER
COL
CHI
Source: Company Documents, Morgan Stanley Research
| November 25, 2015Parque Arauco
MORGAN STANLEY RESEARCH
9
Investment Debates SummaryInvestment Debates Summary
| November 25, 2015Parque Arauco
MORGAN STANLEY RESEARCH
10

Investor Debate: Does Parque Arauco's Expansion Add Value?Investor Debate: Does Parque Arauco's Expansion Add Value?
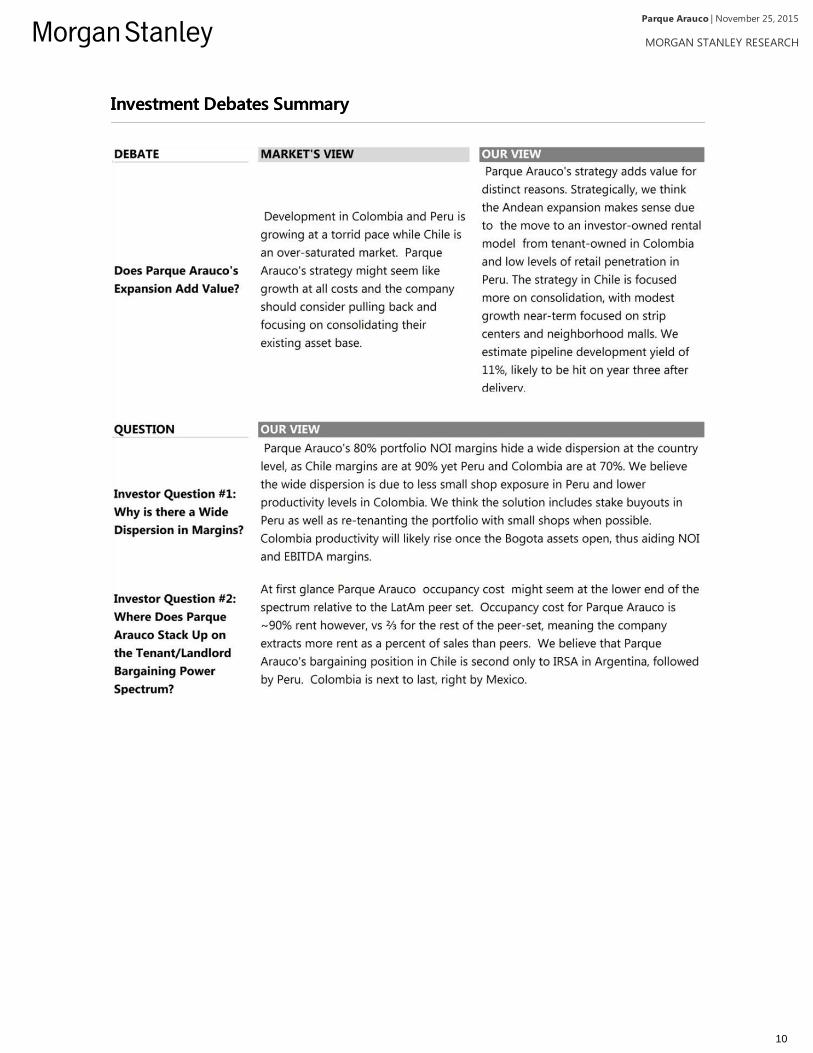
Market view: Development in Colombia and Peru is growing at a torrid pace while Chile is an over-saturated market. Parque Arauco's strategy might seem like growth at all costs and the company shouldconsider pulling back and focusing on consolidating their existing asset base.
Our view: Parque Arauco's strategy adds value for distinct reasons. Strategically, we think the Andeanexpansion makes sense due to the move to an investor-owned rental model from tenant-owned inColombia and low levels of retail penetration in Peru. The strategy in Chile is focused more onconsolidation, with modest growth near-term focused on strip centers and neighborhood malls. Weestimate pipeline development yield of 11%, likely to be hit on year three after delivery.
Growth is warranted. For some, mall GLA growth inthe Andean region might be too much, particularlywhen one considers the overbuilding hangovercurrently being felt in Brazil as a case study. We wouldargue that the growth is warranted for a number ofstructural reasons, particularly as it pertains to Arauco'sdevelopment pipeline: the transition to a investor-owned rental model in Colombia and low-levels of retailpenetration in Peru. Arauco's strategy in Chile is morefocused on consolidation, which we considerappropriate considering where Chile is in market cycle.From a cyclical perspective, GDP growth is expected toremain higher in the Andean region vs the largercountries in the region. Of course not all developers canbe winners, yet we believe that Arauco's experience willprove relevant in such high-growth environments.
Exhibit 22:Exhibit 22: Colombia and Peru are experiencingsome of the largest shopping center growth inLatAm...
Sou rce: Co lliers, Morgan Stan ley Research
Exhibit 23:Exhibit 23: ...at the same time though, both Peruand Colombia are under-retailed, particularlywhen one considers...
Chile
Mexico
Colombia
Brazil
Peru
Argentina
4
6
8
10
0 50 100 150 200 250
Shopping Center GLA (sqm) per 1000 inhabitants
Annual consumption per capita (US$, 000s)
N ote: Figures as of 2014. Source: World Bank, CompanyDocuments, Morgan Stanley Research
Exhibit 24:Exhibit 24: ...the amount of retail sales growththat has taken place there
Source: DANE, INEI, INE, IBGE, ANTAD, Morgan Stanley Research
| November 25, 2015Parque Arauco
MORGAN STANLEY RESEARCH
11

A better outlook (and fundamentals) for the Andean region. Our retail team recently published a reportpointing to a better outlook for the consumer in Peru and Chile (The Last Resort for LatAm Consumer?The Last Resort for LatAm Consumer?)relative to the rest of the region. Among the key metrics they looked at were low consumer credit penetration inPeru , the continuing material wage mass growth in the Andean region vs. peers and the expectation of GDPgrowth in the Andean region outpacing the big three LatAm markets.
We are optimistic on Parque Arauco's pipelineeconomics. Parque Arauco projects target 11-12%ROIC upon stabilization, which occurs 3-5 years afterthe asset has opened. Projects usually are delivered at70% occupancy; after three years occupancy is expectedto have reached 90%. At that point variable rent, whichultimately accounts for 15% of total rent on average,kicks in. Looking at six Parque Arauco developmentsacross the region, we found that the company hasmostly delivered with a bit of a lag on their Colombianassets. The performance for these however is expectedto be slower, given their locations (non-core cities) andthe current low productivity of these markets (monthlysales per sqm in Colombia were US$195 in 2014, vs.US$326 in Chile and US$255 in Peru). We note that forPeru and Chile, Arauco has been more successful andthat the current major project in Colombia (La Colina) isfocused on Bogota, a major market which we would expect to have much higher sales per sqm than currentassets.
Exhibit 25:Exhibit 25: We expect Andean growth tooutpace...
Source: Morgan Stanley Research
Exhibit 26:Exhibit 26: ...growth in the region's big threeeconomies
Source: Morgan Stanley Research
Exhibit 27:Exhibit 27: We believe Parque Araucodevelopments, such as La Colina in Colombia toreach ROIC targets after the third year ofoperation
Sou rce: Morgan Stan ley Research , Compan y Docu men ts
Exhibit 28:Exhibit 28: Select Parque Arauco Recent Development NOI Yields
Opening CAPEX YR 3 NOI 3Q15 LTMProject Country Quarter (USD mn) (LOC mn) (LOC mm) Yield Margin Occ.Arauco Quilicura Chile 2Q13 36 17,433 3,203 18.4% 84% 99%Arauco San Antonio Chile 2Q10 45 24,595 2,141 8.7% 61% 94%Mega Plaza Chimbote Peru 2Q12 26 72 9 12.8% 83% 99%Mega Express Villa El Salvador Peru 2Q12 13 35 5 13.0% 76% 98%Parque Caracoli Colombia 2Q13 100 181,741 13,045 7.2% 70% 88%Parque Arboleda Colombia 4Q10 80 163,116 14,961 9.2% 78% 93%Average 11.5% 75.2% 95.3%
Sou rce: Compan y Docu men ts, Morgan Stan ley Research
| November 25, 2015Parque Arauco
MORGAN STANLEY RESEARCH
12

Analyzing External Growth Drivers by CountryAnalyzing External Growth Drivers by Country
Chile
Still a Chilean company. We expect +50% of Parque Arauco's revenue (by owned GLA) to still be derivedfrom Chile after pipeline delivery. Growth in Chile is limited to 6% of owned GLA, focused on outlets/stripcenters outside of Santiago (60% of the 20k to be developed). We believe this is the right approach consideringthat Chile is in the closing segment of AT Kearney's "Window of Opportunity." This means that a) GLA per capitais high and thus any subsequent development would probably not have as much bang for the buck and b)consumers are more sophisticated, demanding more services and higher quality retailers. We believe that PAhas a distinct advantage given that the Chile portfolio is at least 17 years old (GLA weighted), meaning wellconsolidated, and has been able to attract key international tenants in Parque Arauco Kennedy (~50% of Chileanrental revenues). Case in point, 74% of Kennedy's GLA leased in the past 5 years has been to internationalbrands.
Exhibit 29:Exhibit 29: +50% of revenues will still come fromChile
Source: Company Documents, Morgan Stanley Research estimates
Exhibit 30:Exhibit 30: Growth is focused on assets ex-Santiago
Santiago• Parque Arauco Kennedy• Arauco Maipu• Arauco Estacion• Arauco Quilicura• Arauco Premium Outlet
Buenaventura• Arauco Express (Stripcenters
Chile)• Parque Arauco Kennedy Luxury
DistrictAraucoChillan
Arauco SanAntonio
Arauco Premium OutletCoquimbo
Projects AraucoExpress: Recoleta andCiudad Empresarial
AraucoAntofagasta
Arauco Premium OutletCurauma
Arauco Premium OutletConcepcion
Development ProjectsCurrent Asset
Expansions
Source: Company Documents, Morgan Stanley Research
Exhibit 31:Exhibit 31: Chile is a mature market where consolidation, not necessarily GLA growth, is of importance
Sou rce: AT Kearn ey
| November 25, 2015Parque Arauco
MORGAN STANLEY RESEARCH
13

Peru
Peru: under-retailed from a cyclical and structuralperspective. Peru's mall footprint has seen meaningfulGLA growth since 2012, with GLA expected to be 47%higher by YE15. Interestingly, however, vacancy rateshave declined during this period, showing demand forthe product. Peru is the most under-retailed marketamong the ones under coverage, with 69 sqm per every1,000 inhabitants. At the same time, we believe it's oneof the markets with the most potential given currentlevels of leverage (among the lowest in LatAm),informality (the highest in LatAm) and expectedeconomic growth. Arauco's concepts are mostly focusedon neighborhood/strip center concepts vs. the moreregional mall approach in Chile. We believe howeverthat this is appropriate given current levels of economicdevelopment (consumption per capita is growingquicker vs. peers yet still is lower).
Exhibit 32:Exhibit 32: The Peru portfolio is mostly focusedon smaller concepts including outlets andneighborhood malls
MegaPlaza Barranca
MegaPlaza ChimboteCajamarca
MegaPlaza CañeteMegaPlaza Chincha
MegaPlaza PiscoICA
ParqueLambramani
MegaPlaza ExpressJaen
MegaPlazaLambayeque
Lima• MegaPlaza Norte• MegaPlaza Express Villa Chorrillos• Larcomar• MegaPlaza Express Villa El
Salvador• InOutlet Faucett• Viamix Chorrillos• Viamix Colonial• Outlet Lurin• Viamix Las Malvinas
Other projectsSCP
Development ProjectsCurrent Asset
Expansions
Sou rce: Compan y Docu men ts, Morgan Stan ley Research
Exhibit 33:Exhibit 33: Despite marked growth in recentyears, Peruvian shopping center vacancy rateshave declined
Source: ACCEP
Exhibit 34:Exhibit 34: Peru has the largest informal sector inLatAm, providing upside
Note: As of 2007 Source: World Bank, Morgan Stanley Research
| November 25, 2015Parque Arauco
MORGAN STANLEY RESEARCH
14
Colombia
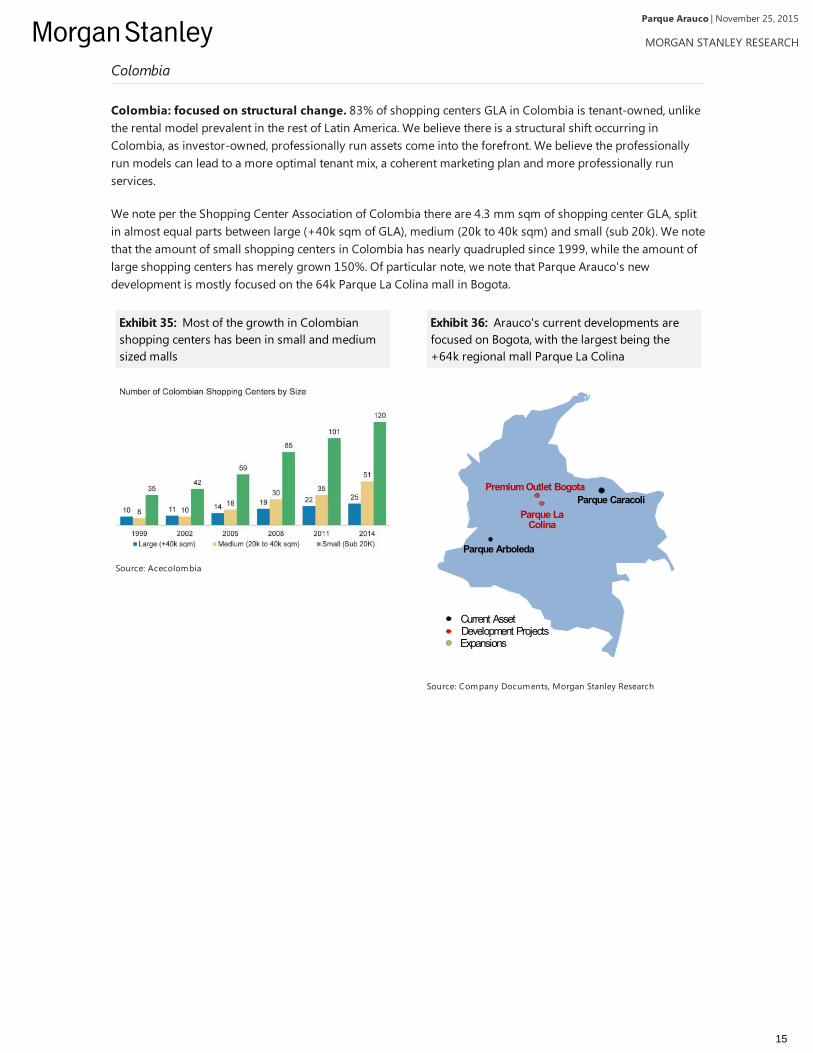
Colombia: focused on structural change. 83% of shopping centers GLA in Colombia is tenant-owned, unlikethe rental model prevalent in the rest of Latin America. We believe there is a structural shift occurring inColombia, as investor-owned, professionally run assets come into the forefront. We believe the professionallyrun models can lead to a more optimal tenant mix, a coherent marketing plan and more professionally runservices.
We note per the Shopping Center Association of Colombia there are 4.3 mm sqm of shopping center GLA, splitin almost equal parts between large (+40k sqm of GLA), medium (20k to 40k sqm) and small (sub 20k). We notethat the amount of small shopping centers in Colombia has nearly quadrupled since 1999, while the amount oflarge shopping centers has merely grown 150%. Of particular note, we note that Parque Arauco's newdevelopment is mostly focused on the 64k Parque La Colina mall in Bogota.
Exhibit 35:Exhibit 35: Most of the growth in Colombianshopping centers has been in small and mediumsized malls
Source: Acecolombia
Exhibit 36:Exhibit 36: Arauco's current developments arefocused on Bogota, with the largest being the+64k regional mall Parque La Colina
Parque Caracoli
Parque Arboleda
Parque LaColina
Premium Outlet Bogota
Development ProjectsCurrent Asset
Expansions
Source: Company Documents, Morgan Stanley Research
| November 25, 2015Parque Arauco
MORGAN STANLEY RESEARCH
15

Investor Question #1: Why Is There a Wide Dispersion in Margins?Investor Question #1: Why Is There a Wide Dispersion in Margins?
Our view: Parque Arauco's 80% portfolio NOI margins hide a wide dispersion at the country level, asChile margins are at 90% yet Peru and Colombia are at 70%. We believe the wide dispersion is due toless small shop exposure in Peru and lower productivity levels in Colombia. We think the solutionincludes stake buyouts in Peru as well as re-tenanting the portfolio with small shops when possible.Colombia productivity will likely rise once the Bogota assets open, thus aiding NOI and EBITDA margins.
Parque Arauco's NOI margins hide a wide dispersion within the portfolio. Parque Arauco's portfolio NOImargin (80%) places it in the middle of the pack when compared to LatAm peers, that is, in-line with Mexico yetlower than Argentina and Brazil. Digging through, however, we note that this is driven by Chile (+90% NOImargin) as Peru and Colombia NOI margins are ~70%.
Chile NOI Margins Explained
Higher NOI margins in Chile the result of aconsolidated portfolio. Driving the higher NOImargins in Chile are the two oldest and biggest assetsin the Chile portfolio - Parque Arauco Kennedy andArauco Maipu - which both have +90% NOI marginsand together account for nearly ⅔ of country NOI. Bothassets are well-consolidated and dominate theirsurrounding trade area. Sales per sqm for Kennedy isthe highest for the whole portfolio (US$481/sqm/month in 2014), while Maipu registers US$338/sqm. We note that the Chile portfolio is 92% owned bythe company.
Exhibit 37:Exhibit 37: Parque Arauco NOI margins aregenerally below Argentina and Brazil...
Source: Company Documents, Morgan Stanley Research
Exhibit 38:Exhibit 38: ...yet closer in-line with Mexico
Source: Company Documents, Morgan Stanley Research
Exhibit 39:Exhibit 39: Parque Arauco's NOI margins have awide dispersion, with Chile materially above Peruand Colombia
Sou rce: Compan y Docu men ts, Morgan Stan ley Research
| November 25, 2015Parque Arauco
MORGAN STANLEY RESEARCH
16

Peru NOI Margins Explained
Low margins in Peru are tied to lower exposure tosmall shops and ownership fragmentation.Peruvian margins (~70%), hide an even widerdispersion, with margins ranging from 57% to 83%.Curiously, the JV assets have better average margins(75%) vs. the fully owned ones (+64%). We believe thatoverall the lower exposure to higher-paying small shoptenants is the reason for the lower margins, as ParqueArauco likely has to bear more of the operating cost. Webelieve that the solution to this issue is optimizing thetenant profile of Peru, increasing exposure to small-shop tenants. We believe Arauco has a comparativeadvantage to peers given that it has been able to attractinternational tenants in Chile. We also believe thatmargins could be further aided in Peru throughownership consolidation as operating costs in Peru is
higher than it should be given that they pay for both Parque Arauco and its JV partner's personnel.
Exhibit 40:Exhibit 40: Parque Arauco`s NOI margins for Chile are high, particularly for the older malls
Sou rce: Compan y Docu men ts, Morgan Stan ley Research
Exhibit 41:Exhibit 41: Peru has less rental revenues comingfrom small tenants relative to Chile andColombia
Sou rce: Compan y Docu men ts, Morgan Stan ley Research
Exhibit 42:Exhibit 42: Peruvian NOI margins show a wide dispersion
Sou rce: Compan y Docu men ts, Morgan Stan ley Research
| November 25, 2015Parque Arauco
MORGAN STANLEY RESEARCH
17

Colombia NOI Margins Explained
Low Colombia margins are tied to lower mall productivity. Colombia's rent as a percentage of sales is thehighest in the portfolio at 12%, 200 and 400 bps higher than Chile and Peru respectively. However, this ratio ishigh not necessarily because of Parque Arauco's better bargaining position, rather because of low productivityin the Colombian portfolio. Monthly sales per sqm in Colombia is 35% and 50% lower than Peru and Chilerespectively on a USD basis. As it pertains to these assets, we don't believe that productivity will dramaticallyincrease in the near term as they are both in second-tier cities in Colombia. As it pertains to the Colombianportfolio, we believe that productivity could increase dramatically in the medium term, thus helping margins,with the opening of the Bogota assets in 2016-17: Arauco Premium Outlet ( 13k sqm ) and Parque La Colina(63.5k sqm). Both assets - which will expand Arauco's portfolio to the more dense, high income capital region -will more than double the size of the Colombia portfolio.
Exhibit 43:Exhibit 43: Colombia rents as a percentage ofsales are higher than Chile and Peru...
Source: Company Documents, Morgan Stanley Research
Exhibit 44:Exhibit 44: ...yet this is due more to lowproductivity
Source: Company Documents, Morgan Stanley Research
Exhibit 45:Exhibit 45: The difference between Colombia NOI and EBITDA margins reflect a current high G&A load
Sou rce: Compan y Docu men ts, Morgan Stan ley Research
| November 25, 2015Parque Arauco
MORGAN STANLEY RESEARCH
18

Colombia's High G&A Load Explained
High Colombian G&A will be reduced with more GLA. Colombia currently has both the lowest EBITDAmargins in the Parque Arauco portfolio at 40% and the widest gap between NOI and EBITDA margins (25%).G&A per sqm is equal to Chile though NOI per sqm is equal to Peru, despite the higher occupancy cost. Webelieve the high G&A load will be ameliorated with the aforementioned opening of the Bogota assets whichshould double the footprint, increase NOI productivity and halve the G&A load , assuming the same corporatebase is used.
Exhibit 46:Exhibit 46: Colombian EBITDA margins are thelowest in the portfolio...
Source: Company Documents, Morgan Stanley Research
Exhibit 47:Exhibit 47: ...while the gap between NOI andEBITDA is the largest
Source: Company Documents, Morgan Stanley Research
Exhibit 48:Exhibit 48: Colombian G&A per sqm is on parwith Chile...
Source: Company Documents, Morgan Stanley Research
Exhibit 49:Exhibit 49: ...yet NOI per sqm is on par with Peru,despite materially higher occupancy costs
Source: Company Documents, Morgan Stanley Research
| November 25, 2015Parque Arauco
MORGAN STANLEY RESEARCH
19

Investor Question #2: Where Does Parque Arauco Stack Up on theInvestor Question #2: Where Does Parque Arauco Stack Up on theTenant/Landlord Bargaining Power Spectrum?Tenant/Landlord Bargaining Power Spectrum?
Our view: At first glance Parque Arauco occupancy cost might seem at the lower end of the spectrumrelative to the LatAm peer set. Occupancy cost for Parque Arauco is ~90% rent however, vs ⅔ for therest of the peer-set, meaning the company extracts more rent as a percent of sales than peers. Webelieve that Parque Arauco's bargaining position in Chile is second only to IRSA in Argentina, followedby Peru. Colombia is next to last, right by Mexico.
Chile second to Argentina in landlord bargaining power. We believe that Parque Arauco's bargainingstrength is second to IRSA's in Argentina. Driving our rationale is Parque Arauco's tenant rent as a percent ofsales (among the highest in the region, as discussed below), Arauco's ability to draw quality tenants (fully +30%of tenants by store count are international) who don't account for a significant part of Parque Arauco's rentalrevenues and Arauco's leverage as one of the top three players in the country (we believe IRSA/Argentina rankshigher in the Bargometer given their higher ownership concentration in Buenos Aires). We note that these threeaspects are true for Arauco's presence in both Peru and Colombia but to lesser degrees, as Peru is still in rapiddevelopment mode and thus not as consolidated as Chile, and Colombia is still transitioning from a tenant-ownership model (83% of mall GLA in Colombia is owned by tenants) to a owner/operator rental model .Another key factor for Arauco's malls, and which also explains our positioning Peru and Chile in front of Brazil isthe fact that landlords have the right to not renew tenant contracts at maturity, unlike Brazil where tenants areallowed to stay as long as they are compliant.
Parque Arauco's occupancy cost is high where it matters: rent as a percent of sales. Occupancy cost is akey metric to look at when analyzing bargaining power, as it represents the leverage a landlord has in extractingpayment (rent+ common area fees) from tenants. At first blush, Parque Arauco's might seem at the lower end ofthe spectrum compared to peers. Yet the occupancy cost for Arauco is not exactly apples to apples as itcompares to peers. Whereas, as a rule of thumb rent usually accounts for ~2/3 of the occupancy cost for thepeer-set, Arauco's portfolio occupancy cost is ~90% rent. Making the adjustment to just show rent, as shown inthe exhibits below, we note that Arauco's rent as a percentage of sales is materially higher than peers, with analmost 200 bps spread for the portfolio relative to Multiplan. We note that occupancy costs for the Colombianassets are particularly high, yet this has more to do with the productivity and age of the assets, rather thansystemically higher occupancy costs for the country. Management expects this 12% figure to eventually settlecloser to 10-11% .
Exhibit 50:Exhibit 50: Who has the upper hand in the tenant-landlord relationship?
Sou rce: Morgan Stan ley Research
| November 25, 2015Parque Arauco
MORGAN STANLEY RESEARCH
20

Low tenant concentration with quality tenants ingood assets can lead to high rents. Parque Arauco'sChile assets, at current exchange rates, has among thehighest rent per sqm in USD, second to US mallsthemselves. We note that on average tenantconcentration for Arauco malls is only higher next to theBrazilian mall peers, meaning that they have morefragmentation - and presumably more bargainingpower - relative to Mexican mall peers. It is interestingto note that despite the fragmentation, there is asignificant amount of international tenants in Araucomalls (~30%, by store count), higher relative toArgentine and Brazilian peers; such tenants can be abenefit to Arauco given their ability to induce foot trafficand thus higher rents from domestic satellite stores.
Exhibit 51:Exhibit 51: Parque Arauco's portfolio occupancycost is misleadingly lower than peers as Arauco'soccupancy cost is almost all rent and peersincludes ⅓ condo fees
Source: Company Documents, Morgan Stanley Research
Exhibit 52:Exhibit 52: Looking at rent as percent of sales, wesee that Parque Arauco is materially higher thanpeers
Source: Company Documents, Morgan Stanley Research
Exhibit 53:Exhibit 53: Parque Arauco's Portfolio (by storecount) has a higher number of internationalstores than IRSA and the Brazilian mallcompanies, more on par with Mexican retail
Sou rce: Compan y Docu men ts, Morgan Stan ley Research
Exhibit 54:Exhibit 54: Arauco's Chilean malls (+60% ofcurrent revenue) have the highest rent per sqm inUSD terms in LatAm
Note: Uses the latest exchange rates; IRSA exchange rate is ARSparallel. Source: Company Documents, Morgan Stanley Research
Exhibit 55:Exhibit 55: Parque Arauco's tenant concentrationis higher than Brazilian peers yet lower than theMexican and American comp set
Source: Company Documents, Morgan Stanley Research
| November 25, 2015Parque Arauco
MORGAN STANLEY RESEARCH
21

Lower tenant concentration yet high ownershipconcentration leads to favorable bargainingdynamics. Parque Arauco's owns 16% and 12% ofshopping center GLA in Peru and Chile, respectively.Their high ownership concentration in these countries,leads us to believe that their bargaining power is strongrelative to tenants. We, however, think that IRSA hasmore bargaining power relative to Arauco in Chile andPeru given that they are the owner of premier malls inArgentina, with a 60% share of the key City of BuenosAires market.
Exhibit 56:Exhibit 56: Parque Arauco has among thehighest ownership concentration in LatAm inboth Peru and Chile, compared to peers
Sou rce: Compan y Docu men ts, Morgan Stan ley Research
| November 25, 2015Parque Arauco
MORGAN STANLEY RESEARCH
22

A Look at the Parque Arauco PortfolioA Look at the Parque Arauco Portfolio
Exhibit 57:Exhibit 57: Parque Arauco Current Portfolio
Sou rce: Compan y Docu men ts, Morgan Stan ley Research
Exhibit 58:Exhibit 58: Parque Arauco Development Pipeline
Sou rce: Compan y Docu men ts, Morgan Stan ley Research
| November 25, 2015Parque Arauco
MORGAN STANLEY RESEARCH
23
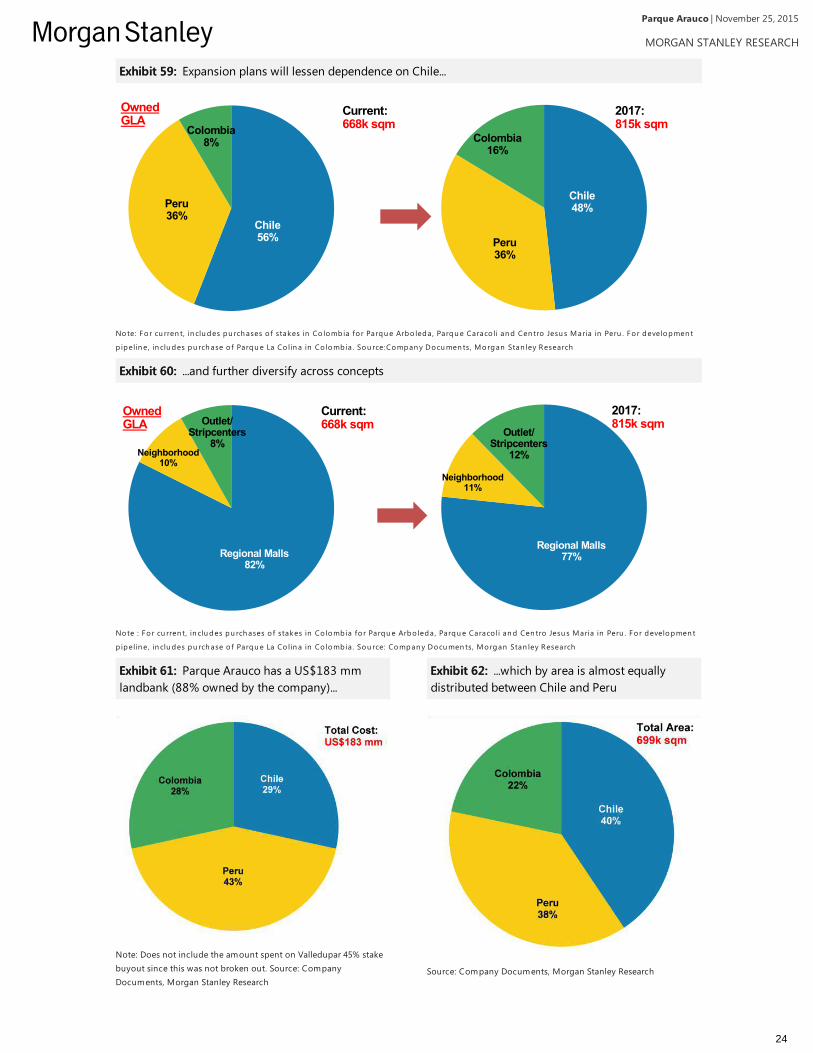
Exhibit 59:Exhibit 59: Expansion plans will lessen dependence on Chile...
Chile56%
Peru36%
Colombia8%
Chile48%
Peru36%
Colombia16%
2017:815k sqm
Current:668k sqm
OwnedGLA
Note: Fo r cu rren t, in clu des pu rch ases o f stakes in Co lomb ia fo r Parqu e Arbo leda, Parqu e Caraco li an d Cen tro Jesu s Maria in Peru . Fo r developmen t
p ipelin e, in clu des pu rch ase o f Parqu e La Co lin a in Co lomb ia . Sou rce:Compan y Docu men ts, Morgan Stan ley Research
Exhibit 60:Exhibit 60: ...and further diversify across concepts
Regional Malls82%
Neighborhood10%
Outlet/Stripcenters
8%
Current:668k sqm
OwnedGLA
Regional Malls77%
Neighborhood11%
Outlet/Stripcenters
12%
2017:815k sqm
Note : Fo r cu rren t, in clu des pu rch ases o f stakes in Co lomb ia fo r Parqu e Arbo leda, Parqu e Caraco li an d Cen tro Jesu s Maria in Peru . Fo r developmen t
p ipelin e, in clu des pu rch ase o f Parqu e La Co lin a in Co lomb ia . Sou rce: Compan y Docu men ts, Morgan Stan ley Research
Exhibit 61:Exhibit 61: Parque Arauco has a US$183 mmlandbank (88% owned by the company)...
Note: Does not include the amount spent on Valledupar 45% stakebuyout since this was not broken out. Source: CompanyDocuments, Morgan Stanley Research
Exhibit 62:Exhibit 62: ...which by area is almost equallydistributed between Chile and Peru
Source: Company Documents, Morgan Stanley Research
| November 25, 2015Parque Arauco
MORGAN STANLEY RESEARCH
24
Parque Arauco Financial SummaryParque Arauco Financial Summary
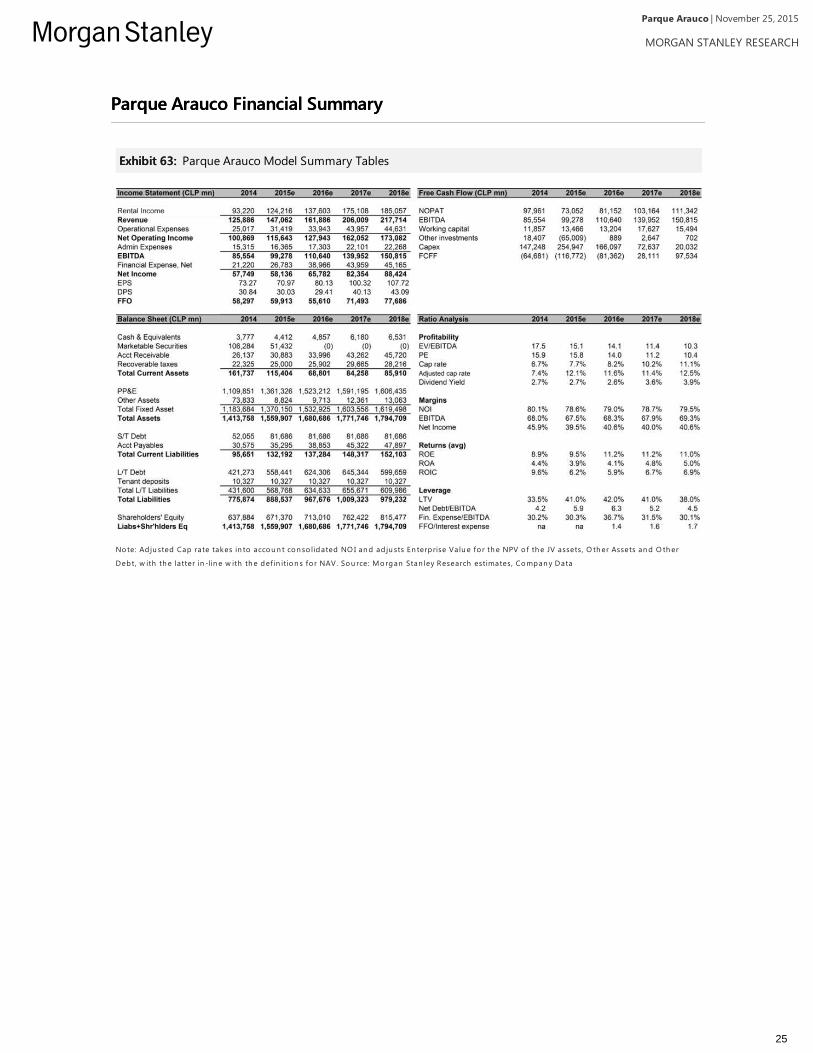
Exhibit 63:Exhibit 63: Parque Arauco Model Summary Tables
Note: Ad ju sted Cap rate takes in to accou n t con so lidated NO I an d ad ju sts En terp rise Valu e fo r th e NPV o f th e JV assets, O th er Assets an d O th er
Debt, w ith th e latter in -lin e w ith th e def in ition s fo r NAV. Sou rce: Morgan Stan ley Research estimates, Compan y Data
| November 25, 2015Parque Arauco
MORGAN STANLEY RESEARCH
25
AppendixAppendix
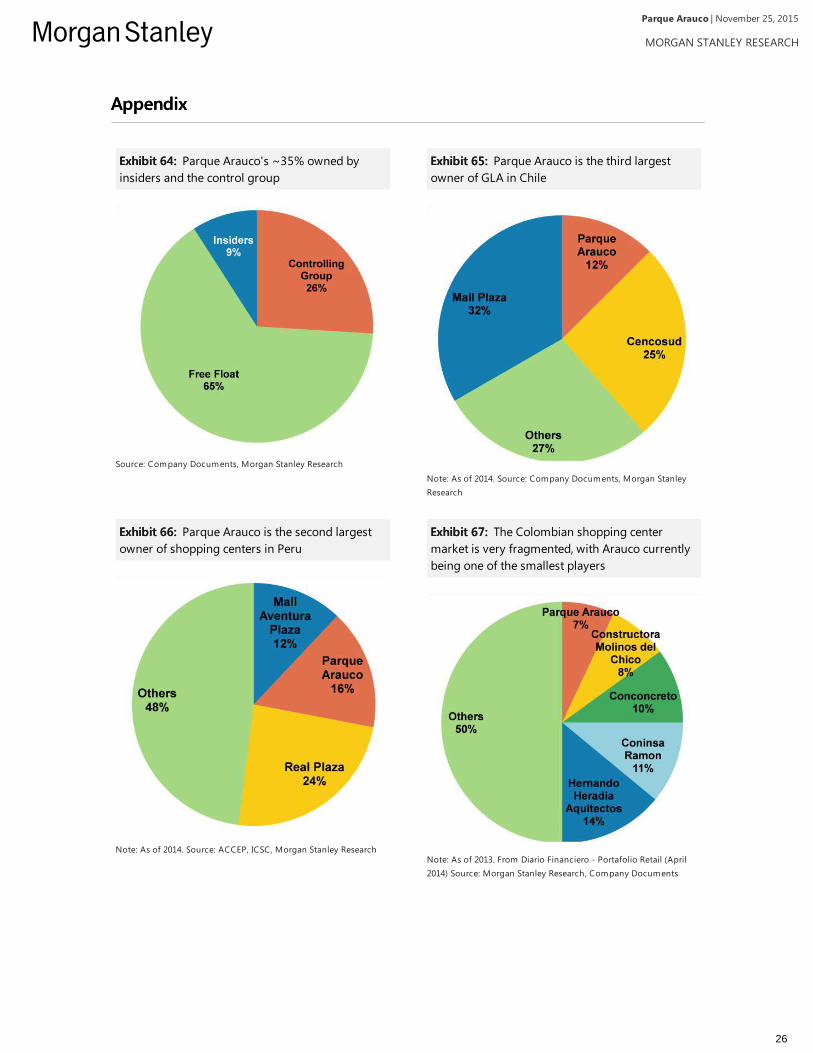
Exhibit 64:Exhibit 64: Parque Arauco's ~35% owned byinsiders and the control group
Source: Company Documents, Morgan Stanley Research
Exhibit 65:Exhibit 65: Parque Arauco is the third largestowner of GLA in Chile
Note: As of 2014. Source: Company Documents, Morgan StanleyResearch
Exhibit 66:Exhibit 66: Parque Arauco is the second largestowner of shopping centers in Peru
Note: As of 2014. Source: ACCEP, ICSC, Morgan Stanley Research
Exhibit 67:Exhibit 67: The Colombian shopping centermarket is very fragmented, with Arauco currentlybeing one of the smallest players
Note: As of 2013. From Diario Financiero - Portafolio Retail (April2014) Source: Morgan Stanley Research, Company Documents
| November 25, 2015Parque Arauco
MORGAN STANLEY RESEARCH
26

Exhibit 68:Exhibit 68: Key Money is not a key element in the Andean region
Sou rce: Morgan Stan ley Research
Exhibit 69:Exhibit 69: General Corporate Governance Scorecard among LatAm commercial property companies
Sou rce: Compan y Data , Morgan Stan ley Research
Exhibit 70:Exhibit 70: Fibras Corporate Governance among LatAm commercial property companies
0
1
2
3
4
5
6
7
8
TERR
A13
MUL
T3
BRM
L3
PARA
UCO
FIBR
AMQ
12
IGTA
3
BRPR
3
IRS
DANH
OS1
3
GIC
SAB
FUNO
11
8) … reports EBITDA and provides transactioncosts?
7) … absence of "golden parachute" to removemanager?
6) … fees to management since IPO less than10% of NOI?
5) … inside ownership > 20%?
4) … fee based on stock performance?
3) … majority of members in technical committeeindependent?
2) … investors can buy >10% of shares withoutapproval?
1) … approval of < 66% of shareholders requiredto remove manager?
Sou rce: Compan y Data , Morgan Stan ley Research
| November 25, 2015Parque Arauco
MORGAN STANLEY RESEARCH
27
Disclosure SectionThe information and opinions in Morgan Stanley Research were prepared by Morgan Stanley & Co. LLC, and/or Morgan Stanley C.T.V.M. S.A., and/orMorgan Stanley Mexico, Casa de Bolsa, S.A. de C.V., and/or Morgan Stanley Canada Limited. As used in this disclosure section, "Morgan Stanley"includes Morgan Stanley & Co. LLC, Morgan Stanley C.T.V.M. S.A., Morgan Stanley Mexico, Casa de Bolsa, S.A. de C.V., Morgan Stanley CanadaLimited and their affiliates as necessary.For important disclosures, stock price charts and equity rating histories regarding companies that are the subject of this report, please see the MorganStanley Research Disclosure Website at www.morganstanley.com/researchdisclosures, or contact your investment representative or Morgan StanleyResearch at 1585 Broadway, (Attention: Research Management), New York, NY, 10036 USA.For valuation methodology and risks associated with any price targets referenced in this research report, please contact the Client Support Team as follows:US/Canada +1 800 303-2495; Hong Kong +852 2848-5999; Latin America +1 718 754-5444 (U.S.); London +44 (0)20-7425-8169; Singapore +65 6834-6860;Sydney +61 (0)2-9770-1505; Tokyo +81 (0)3-6836-9000. Alternatively you may contact your investment representative or Morgan Stanley Research at 1585Broadway, (Attention: Research Management), New York, NY 10036 USA.Analyst CertificationThe following analysts hereby certify that their views about the companies and their securities discussed in this report are accurately expressed and thatthey have not received and will not receive direct or indirect compensation in exchange for expressing specific recommendations or views in this report: JorelGuilloty; Nikolaj Lippmann; Lillian Starke.Unless otherwise stated, the individuals listed on the cover page of this report are research analysts.Global Research Conflict Management PolicyMorgan Stanley Research has been published in accordance with our conflict management policy, which is available atwww.morganstanley.com/institutional/research/conflictpolicies.Important US Regulatory Disclosures on Subject CompaniesAs of October 30, 2015, Morgan Stanley beneficially owned 1% or more of a class of common equity securities of the following companies covered inMorgan Stanley Research: BR Properties, BRMalls Participacoes, Fibra Uno Administracion SA de CV, Iguatemi Empresa de Shopping Centers S.A,Macquarie Mexico Real Estate Management, Multiplan Empreendimentos Imobiliarios, Parque Arauco SA.In the next 3 months, Morgan Stanley expects to receive or intends to seek compensation for investment banking services from BR Properties, BRMallsParticipacoes, Concentradora Fibra Danhos SA de CV, Fibra Uno Administracion SA de CV, Iguatemi Empresa de Shopping Centers S.A, Irsa Inversionesy Representaciones SA, Macquarie Mexico Real Estate Management, Multiplan Empreendimentos Imobiliarios, Parque Arauco SA.Within the last 12 months, Morgan Stanley has received compensation for products and services other than investment banking services from Fibra UnoAdministracion SA de CV, Irsa Inversiones y Representaciones SA, Macquarie Mexico Real Estate Management.Within the last 12 months, Morgan Stanley has provided or is providing investment banking services to, or has an investment banking client relationshipwith, the following company: BR Properties, BRMalls Participacoes, Concentradora Fibra Danhos SA de CV, Fibra Uno Administracion SA de CV, IguatemiEmpresa de Shopping Centers S.A, Irsa Inversiones y Representaciones SA, Macquarie Mexico Real Estate Management, Multiplan EmpreendimentosImobiliarios, Parque Arauco SA.Within the last 12 months, Morgan Stanley has either provided or is providing non-investment banking, securities-related services to and/or in the past hasentered into an agreement to provide services or has a client relationship with the following company: BRMalls Participacoes, Fibra Uno Administracion SAde CV, Irsa Inversiones y Representaciones SA, Macquarie Mexico Real Estate Management.The equity research analysts or strategists principally responsible for the preparation of Morgan Stanley Research have received compensation based uponvarious factors, including quality of research, investor client feedback, stock picking, competitive factors, firm revenues and overall investment bankingrevenues.Morgan Stanley and its affiliates do business that relates to companies/instruments covered in Morgan Stanley Research, including market making,providing liquidity, fund management, commercial banking, extension of credit, investment services and investment banking. Morgan Stanley sells to andbuys from customers the securities/instruments of companies covered in Morgan Stanley Research on a principal basis. Morgan Stanley may have aposition in the debt of the Company or instruments discussed in this report.Certain disclosures listed above are also for compliance with applicable regulations in non-US jurisdictions.STOCK RATINGSMorgan Stanley uses a relative rating system using terms such as Overweight, Equal-weight, Not-Rated or Underweight (see definitions below). MorganStanley does not assign ratings of Buy, Hold or Sell to the stocks we cover. Overweight, Equal-weight, Not-Rated and Underweight are not the equivalent ofbuy, hold and sell. Investors should carefully read the definitions of all ratings used in Morgan Stanley Research. In addition, since Morgan StanleyResearch contains more complete information concerning the analyst's views, investors should carefully read Morgan Stanley Research, in its entirety, andnot infer the contents from the rating alone. In any case, ratings (or research) should not be used or relied upon as investment advice. An investor's decisionto buy or sell a stock should depend on individual circumstances (such as the investor's existing holdings) and other considerations.Global Stock Ratings Distribution(as of October 31, 2015)For disclosure purposes only (in accordance with NASD and NYSE requirements), we include the category headings of Buy, Hold, and Sell alongside ourratings of Overweight, Equal-weight, Not-Rated and Underweight. Morgan Stanley does not assign ratings of Buy, Hold or Sell to the stocks we cover.Overweight, Equal-weight, Not-Rated and Underweight are not the equivalent of buy, hold, and sell but represent recommended relative weightings (seedefinitions below). To satisfy regulatory requirements, we correspond Overweight, our most positive stock rating, with a buy recommendation; we correspondEqual-weight and Not-Rated to hold and Underweight to sell recommendations, respectively.
COVERAGE UNIVERSE INVESTMENT BANKING CLIENTS (IBC)STOCK RATING CATEGORY COUNT % OF TOTAL COUNT % OF TOTAL
IBC% OF RATING
CATEGORYOverweight/Buy 1210 36% 340 43% 28%Equal-weight/Hold 1445 43% 346 44% 24%Not-Rated/Hold 91 3% 9 1% 10%Underweight/Sell 651 19% 95 12% 15%TOTAL 3,397 790
Data include common stock and ADRs currently assigned ratings. Investment Banking Clients are companies from whom Morgan Stanley received
| November 25, 2015Parque Arauco
MORGAN STANLEY RESEARCH
28

investment banking compensation in the last 12 months.Analyst Stock RatingsOverweight (O or Over) - The stock's total return is expected to exceed the total return of the relevant country MSCI Index, on a risk-adjusted basis over thenext 12-18 months.Equal-weight (E or Equal) - The stock's total return is expected to be in line with the total return of the relevant country MSCI Index, on a risk-adjusted basisover the next 12-18 months.Not-Rated (NR) - Currently the analyst does not have adequate conviction about the stock's total return relative to the relevant country MSCI Index on a risk-adjusted basis, over the next 12-18 months.Underweight (U or Under) - The stock's total return is expected to be below the total return of the relevant country MSCI Index, on a risk-adjusted basis, overthe next 12-18 months.Unless otherwise specified, the time frame for price targets included in Morgan Stanley Research is 12 to 18 months.Analyst Industry ViewsAttractive (A): The analyst expects the performance of his or her industry coverage universe over the next 12-18 months to be attractive vs. the relevantbroad market benchmark, as indicated below.In-Line (I): The analyst expects the performance of his or her industry coverage universe over the next 12-18 months to be in line with the relevant broadmarket benchmark, as indicated below.Cautious (C): The analyst views the performance of his or her industry coverage universe over the next 12-18 months with caution vs. the relevant broadmarket benchmark, as indicated below.Benchmarks for each region are as follows: North America - S&P 500; Latin America - relevant MSCI country index or MSCI Latin America Index; Europe -MSCI Europe; Japan - TOPIX; Asia - relevant MSCI country index or MSCI sub-regional index or MSCI AC Asia Pacific ex Japan Index.Important Disclosures for Morgan Stanley Smith Barney LLC CustomersImportant disclosures regarding the relationship between the companies that are the subject of Morgan Stanley Research and Morgan Stanley SmithBarney LLC or Morgan Stanley or any of their affiliates, are available on the Morgan Stanley Wealth Management disclosure website atwww.morganstanley.com/online/researchdisclosures. For Morgan Stanley specific disclosures, you may refer towww.morganstanley.com/researchdisclosures.Each Morgan Stanley Equity Research report is reviewed and approved on behalf of Morgan Stanley Smith Barney LLC. This review and approval isconducted by the same person who reviews the Equity Research report on behalf of Morgan Stanley. This could create a conflict of interest.Other Important DisclosuresMorgan Stanley is not acting as a municipal advisor and the opinions or views contained herein are not intended to be, and do not constitute, advice withinthe meaning of Section 975 of the Dodd-Frank Wall Street Reform and Consumer Protection Act.Morgan Stanley produces an equity research product called a "Tactical Idea." Views contained in a "Tactical Idea" on a particular stock may be contrary tothe recommendations or views expressed in research on the same stock. This may be the result of differing time horizons, methodologies, market events, orother factors. For all research available on a particular stock, please contact your sales representative or go to Matrix athttp://www.morganstanley.com/matrix.Morgan Stanley Research is provided to our clients through our proprietary research portal on Matrix and also distributed electronically by Morgan Stanleyto clients. Certain, but not all, Morgan Stanley Research products are also made available to clients through third-party vendors or redistributed to clientsthrough alternate electronic means as a convenience. For access to all available Morgan Stanley Research, please contact your sales representative or goto Matrix at http://www.morganstanley.com/matrix.Any access and/or use of Morgan Stanley Research is subject to Morgan Stanley's Terms of Use (http://www.morganstanley.com/terms.html). Byaccessing and/or using Morgan Stanley Research, you are indicating that you have read and agree to be bound by our Terms of Use(http://www.morganstanley.com/terms.html). In addition you consent to Morgan Stanley processing your personal data and using cookies in accordancewith our Privacy Policy and our Global Cookies Policy (http://www.morganstanley.com/privacy_pledge.html), including for the purposes of setting yourpreferences and to collect readership data so that we can deliver better and more personalized service and products to you. To find out more informationabout how Morgan Stanley processes personal data, how we use cookies and how to reject cookies see our Privacy Policy and our Global Cookies Policy(http://www.morganstanley.com/privacy_pledge.html).If you do not agree to our Terms of Use and/or if you do not wish to provide your consent to Morgan Stanley processing your personal data or using cookiesplease do not access our research.The recommendations of Jorel Guilloty; Nikolaj Lippmann in this report reflect solely and exclusively the analyst's personal views and have been developedindependently, including from the institution for which the analyst works.Morgan Stanley Research does not provide individually tailored investment advice. Morgan Stanley Research has been prepared without regard to thecircumstances and objectives of those who receive it. Morgan Stanley recommends that investors independently evaluate particular investments andstrategies, and encourages investors to seek the advice of a financial adviser. The appropriateness of an investment or strategy will depend on an investor'scircumstances and objectives. The securities, instruments, or strategies discussed in Morgan Stanley Research may not be suitable for all investors, andcertain investors may not be eligible to purchase or participate in some or all of them. Morgan Stanley Research is not an offer to buy or sell or thesolicitation of an offer to buy or sell any security/instrument or to participate in any particular trading strategy. The value of and income from yourinvestments may vary because of changes in interest rates, foreign exchange rates, default rates, prepayment rates, securities/instruments prices, marketindexes, operational or financial conditions of companies or other factors. There may be time limitations on the exercise of options or other rights insecurities/instruments transactions. Past performance is not necessarily a guide to future performance. Estimates of future performance are based onassumptions that may not be realized. If provided, and unless otherwise stated, the closing price on the cover page is that of the primary exchange for thesubject company's securities/instruments.The fixed income research analysts, strategists or economists principally responsible for the preparation of Morgan Stanley Research have receivedcompensation based upon various factors, including quality, accuracy and value of research, firm profitability or revenues (which include fixed income tradingand capital markets profitability or revenues), client feedback and competitive factors. Fixed Income Research analysts', strategists' or economists'compensation is not linked to investment banking or capital markets transactions performed by Morgan Stanley or the profitability or revenues of particulartrading desks.The "Important US Regulatory Disclosures on Subject Companies" section in Morgan Stanley Research lists all companies mentioned where MorganStanley owns 1% or more of a class of common equity securities of the companies. For all other companies mentioned in Morgan Stanley Research,Morgan Stanley may have an investment of less than 1% in securities/instruments or derivatives of securities/instruments of companies and may trade themin ways different from those discussed in Morgan Stanley Research. Employees of Morgan Stanley not involved in the preparation of Morgan StanleyResearch may have investments in securities/instruments or derivatives of securities/instruments of companies mentioned and may trade them in waysdifferent from those discussed in Morgan Stanley Research. Derivatives may be issued by Morgan Stanley or associated persons.With the exception of information regarding Morgan Stanley, Morgan Stanley Research is based on public information. Morgan Stanley makes every effort touse reliable, comprehensive information, but we make no representation that it is accurate or complete. We have no obligation to tell you when opinions orinformation in Morgan Stanley Research change apart from when we intend to discontinue equity research coverage of a subject company. Facts and viewspresented in Morgan Stanley Research have not been reviewed by, and may not reflect information known to, professionals in other Morgan Stanleybusiness areas, including investment banking personnel.Morgan Stanley Research personnel may participate in company events such as site visits and are generally prohibited from accepting payment by the
| November 25, 2015Parque Arauco
MORGAN STANLEY RESEARCH
29

company of associated expenses unless pre-approved by authorized members of Research management.Morgan Stanley may make investment decisions that are inconsistent with the recommendations or views in this report.To our readers in Taiwan: Information on securities/instruments that trade in Taiwan is distributed by Morgan Stanley Taiwan Limited ("MSTL"). Suchinformation is for your reference only. The reader should independently evaluate the investment risks and is solely responsible for their investment decisions.Morgan Stanley Research may not be distributed to the public media or quoted or used by the public media without the express written consent of MorganStanley. Information on securities/instruments that do not trade in Taiwan is for informational purposes only and is not to be construed as a recommendationor a solicitation to trade in such securities/instruments. MSTL may not execute transactions for clients in these securities/instruments. To our readers inHong Kong: Information is distributed in Hong Kong by and on behalf of, and is attributable to, Morgan Stanley Asia Limited as part of its regulated activitiesin Hong Kong. If you have any queries concerning Morgan Stanley Research, please contact our Hong Kong sales representatives.Morgan Stanley is not incorporated under PRC law and the research in relation to this report is conducted outside the PRC. Morgan Stanley Research doesnot constitute an offer to sell or the solicitation of an offer to buy any securities in the PRC. PRC investors shall have the relevant qualifications to invest insuch securities and shall be responsible for obtaining all relevant approvals, licenses, verifications and/or registrations from the relevant governmentalauthorities themselves.Morgan Stanley Research is disseminated in Brazil by Morgan Stanley C.T.V.M. S.A.; in Mexico by Morgan Stanley México, Casa de Bolsa, S.A. de C.Vwhich is regulated by Comision Nacional Bancaria y de Valores. Paseo de los Tamarindos 90, Torre 1, Col. Bosques de las Lomas Floor 29, 05120 MexicoCity; in Japan by Morgan Stanley MUFG Securities Co., Ltd. and, for Commodities related research reports only, Morgan Stanley Capital Group Japan Co.,Ltd; in Hong Kong by Morgan Stanley Asia Limited (which accepts responsibility for its contents) and by Bank Morgan Stanley AG, Hong Kong Branch; inSingapore by Morgan Stanley Asia (Singapore) Pte. (Registration number 199206298Z) and/or Morgan Stanley Asia (Singapore) Securities Pte Ltd(Registration number 200008434H), regulated by the Monetary Authority of Singapore (which accepts legal responsibility for its contents and should becontacted with respect to any matters arising from, or in connection with, Morgan Stanley Research) and by Bank Morgan Stanley AG, Singapore Branch(Registration number T11FC0207F); in Australia to "wholesale clients" within the meaning of the Australian Corporations Act by Morgan Stanley AustraliaLimited A.B.N. 67 003 734 576, holder of Australian financial services license No. 233742, which accepts responsibility for its contents; in Australia to"wholesale clients" and "retail clients" within the meaning of the Australian Corporations Act by Morgan Stanley Wealth Management Australia Pty Ltd(A.B.N. 19 009 145 555, holder of Australian financial services license No. 240813, which accepts responsibility for its contents; in Korea by MorganStanley & Co International plc, Seoul Branch; in India by Morgan Stanley India Company Private Limited; in Indonesia by PT Morgan Stanley AsiaIndonesia; in Canada by Morgan Stanley Canada Limited, which has approved of and takes responsibility for its contents in Canada; in Germany by MorganStanley Bank AG, Frankfurt am Main and Morgan Stanley Private Wealth Management Limited, Niederlassung Deutschland, regulated by Bundesanstaltfuer Finanzdienstleistungsaufsicht (BaFin); in Spain by Morgan Stanley, S.V., S.A., a Morgan Stanley group company, which is supervised by the SpanishSecurities Markets Commission (CNMV) and states that Morgan Stanley Research has been written and distributed in accordance with the rules of conductapplicable to financial research as established under Spanish regulations; in the US by Morgan Stanley & Co. LLC, which accepts responsibility for itscontents. Morgan Stanley & Co. International plc, authorized by the Prudential Regulatory Authority and regulated by the Financial Conduct Authority andthe Prudential Regulatory Authority, disseminates in the UK research that it has prepared, and approves solely for the purposes of section 21 of theFinancial Services and Markets Act 2000, research which has been prepared by any of its affiliates. RMB Morgan Stanley (Proprietary) Limited is a memberof the JSE Limited and regulated by the Financial Services Board in South Africa. RMB Morgan Stanley (Proprietary) Limited is a joint venture ownedequally by Morgan Stanley International Holdings Inc. and RMB Investment Advisory (Proprietary) Limited, which is wholly owned by FirstRand Limited. Theinformation in Morgan Stanley Research is being disseminated by Morgan Stanley Saudi Arabia, regulated by the Capital Market Authority in the Kingdomof Saudi Arabia , and is directed at Sophisticated investors only.The information in Morgan Stanley Research is being communicated by Morgan Stanley & Co. International plc (DIFC Branch), regulated by the DubaiFinancial Services Authority (the DFSA), and is directed at Professional Clients only, as defined by the DFSA. The financial products or financial services towhich this research relates will only be made available to a customer who we are satisfied meets the regulatory criteria to be a Professional Client.The information in Morgan Stanley Research is being communicated by Morgan Stanley & Co. International plc (QFC Branch), regulated by the QatarFinancial Centre Regulatory Authority (the QFCRA), and is directed at business customers and market counterparties only and is not intended for RetailCustomers as defined by the QFCRA.As required by the Capital Markets Board of Turkey, investment information, comments and recommendations stated here, are not within the scope ofinvestment advisory activity. Investment advisory service is provided exclusively to persons based on their risk and income preferences by the authorizedfirms. Comments and recommendations stated here are general in nature. These opinions may not fit to your financial status, risk and return preferences.For this reason, to make an investment decision by relying solely to this information stated here may not bring about outcomes that fit your expectations.The trademarks and service marks contained in Morgan Stanley Research are the property of their respective owners. Third-party data providers make nowarranties or representations relating to the accuracy, completeness, or timeliness of the data they provide and shall not have liability for any damagesrelating to such data. The Global Industry Classification Standard (GICS) was developed by and is the exclusive property of MSCI and S&P.Morgan Stanley Research, or any portion thereof may not be reprinted, sold or redistributed without the written consent of Morgan Stanley.
INDUSTRY COVERAGE: ANDEAN REAL ESTATE
COMPANY (TICKER) RATING (AS OF) PRICE* (11/24/2015)
Nikolaj LippmannParque Arauco SA (PAR.SN) O (11/24/2015) Ch$1,114.10
Stock Ratings are subject to change. Please see latest research for each company.* Historical prices are not split adjusted.
© 2015 Morgan Stanley
| November 25, 2015Parque Arauco
MORGAN STANLEY RESEARCH
30