risk of poor development in young children in low-income
TRANSCRIPT
Risk of poor development in youngchildren in low-income and middle-income
countries: an estimation and analysis atthe global, regional, and country level
The Harvard community has made thisarticle openly available. Please share howthis access benefits you. Your story matters
Citation Lu, Chunling, Maureen M Black, and Linda M Richter. 2018. “Riskof poor development in young children in low-income and middle-income countries: an estimation and analysis at the global, regional,and country level.” The Lancet. Global health 4 (12): e916-e922.doi:10.1016/S2214-109X(16)30266-2. http://dx.doi.org/10.1016/S2214-109X(16)30266-2.
Published Version doi:10.1016/S2214-109X(16)30266-2
Citable link http://nrs.harvard.edu/urn-3:HUL.InstRepos:37068048
Terms of Use This article was downloaded from Harvard University’s DASHrepository, and is made available under the terms and conditionsapplicable to Other Posted Material, as set forth at http://nrs.harvard.edu/urn-3:HUL.InstRepos:dash.current.terms-of-use#LAA
Risk of poor development in young children in low-income and middle-income countries: an estimation and analysis at the global, regional, and country level
Chunling Lu, Maureen M Black, and Linda M RichterDivision of Global Health Equity, Brigham & Women’s Hospital and Department of Global Health and Social Medicine, Harvard Medical School, Boston, MA, USA (C Lu PhD); Department of Pediatrics, University of Maryland School of Medicine, Baltimore, MD, USA (Prof M M Black PhD); RTI International, Research Park, NC, USA (Prof M M Black PhD); and DST-NRF Centre of Excellence in Human Development, University of the Witwatersrand, Johannesburg, South Africa (Prof L M Richter PhD)
Summary
Background—A 2007 study published in The Lancet estimated that approximately 219 million
children aged younger than 5 years were exposed to stunting or extreme poverty in 2004. We
updated the 2004 estimates with the use of improved data and methods and generated estimates for
2010.
Methods—We used country-level prevalence of stunting in children younger than 5 years based
on the 2006 Growth Standards proposed by WHO and poverty ratios from the World Bank to
estimate children who were either stunted or lived in extreme poverty for 141 low-income and
middle-income countries in 2004 and 2010. To avoid counting the same children twice, we
excluded children jointly exposed to stunting and extreme poverty from children living in extreme
poverty. To examine the robustness of estimates, we also used moderate poverty measures.
Findings—The 2007 study underestimated children at risk of poor development. The estimated
number of children exposed to the two risk factors in low-income and middle-income countries
decreased from 279·1 million (95% CI 250·4 million–307·4 million) in 2004 to 249·4 million
(209·3 million–292·6 million) in 2010; prevalence of children at risk fell from 51% (95% CI 46–
56) to 43% (36–51). The decline occurred in all income groups and regions with south Asia
experiencing the largest drop. Sub-Saharan Africa had the highest prevalence in both years. These
findings were robust to variations in poverty measures.
This is an Open Access article under the CC BY-NC-ND license.
Correspondence to: Dr Chunling Lu, Division of Global Health Equity, Brigham & Women’s Hospital and Department of Global Health and Social Medicine, Harvard Medical School, Boston, MA 02115, USA [email protected].
See Online for appendix
ContributorsCL designed the study, conducted the analysis, and wrote the first draft of the manuscript. MMB and LMR interpreted results, made critical comments, and wrote the paper. All authors reviewed the draft versions and approved the final submission.
Declaration of interestsWe declare no competing interests.
HHS Public AccessAuthor manuscriptLancet Glob Health. Author manuscript; available in PMC 2018 April 03.
Published in final edited form as:Lancet Glob Health. 2016 December ; 4(12): e916–e922. doi:10.1016/S2214-109X(16)30266-2.
Author M
anuscriptA
uthor Manuscript
Author M
anuscriptA
uthor Manuscript
Interpretation—Progress has been made in reducing the number of children exposed to stunting
or poverty between 2004 and 2010, but this is still not enough. Scaling up of effective
interventions targeting the most vulnerable children is urgently needed.
Funding—National Institutes of Health, Bill & Melinda Gates Foundation, Hilton Foundation,
and WHO.
Introduction
Early child development forms the foundation of adult health and wellbeing and is a
necessary component of the Sustainable Development Goals (SDGs). Recognition of the
formative aspect of early childhood has increased emphasis on reducing risks for poor child
development.1 Improvement of measures for global prevalence of children at risk of poor
development is necessary to accurately assess challenges, effectiveness of interventions,
gauge progress, and plan future investment.
Quantification of young children with poor development is challenging because there are, as
yet, no established global standards for measuring child development, nor are there
population-representative data for children’s early skills in low-income and middle-income
countries. Available evidence from low-income and middle-income countries suggests that
children’s early exposure to stunting and poverty is closely associated with deficits in their
subsequent cognitive and social-emotional development, their educational performance,
adulthood income, and risks of chronic diseases.2–10 In the 2007 Lancet Child Development
in Developing Countries Series,2 stunting and poverty were used to estimate the number of
children aged younger than 5 years who were at risk of not fulfilling their developmental
potential, an indicator of poor child development. About 219 million children, 39% of
children younger than 5 years in low-income and middle-income countries in 2004, were
estimated to be exposed to one of these two risk factors.2 The estimated average deficit in
adult annual income, resulting from deficits in schooling associated with stunting or extreme
poverty, was 19·8%.2
Major advances in the availability of data have occurred since 2007 when the 2004 estimates
were made. New data for stunting and poverty have become available with a revised
definition of stunting (WHO)11 and extreme poverty (World Bank),12,13 leading to upward
revised estimates of both.11–13 As a result of improved data availability and use of micro-
level data, we were able to produce better quality data for generating direct measures of
country-level estimates for stunting and poverty. With use of the most updated data and the
new definitions of stunting and extreme poverty, we updated the 2004 estimates and applied
the same methods to produce estimates for 2010—the year that most developing countries
had stunting and poverty data available at the time of this analysis. The exercise allowed us
to examine whether progress has been made over time in reducing the prevalence of young
children at risk of poor development. With available nationally representative household
surveys, we were able to improve estimation for missing data and produce estimates of the
percentage of children younger than 5 years living in extreme poverty or moderate poverty
for a subset of countries. We also did sensitivity tests with the use of various poverty
measures.
Lu et al. Page 2
Lancet Glob Health. Author manuscript; available in PMC 2018 April 03.
Author M
anuscriptA
uthor Manuscript
Author M
anuscriptA
uthor Manuscript
Methods
Definitions and data sources
We followed the strategy used previously2 and measured the number of children aged
younger than 5 years who had been exposed to stunting or extreme poverty. Estimation was
done in 2004 and 2010 at the country, regional, and global levels for 141 low-income and
middle-income countries, including 40 low-income countries, 56 lower-middle-income
countries, and 45 upper-middle-income countries, classified by the World Bank in 201014
(appendix p 1).
Child stunting was defined as height-for-age below −2 SDs from the median of the
international reference population recommended by WHO in 2006.11 We took the definition
of extreme poverty by the World Bank (living on less than US$1·25 per day at 2005
international prices) to measure children living in extreme poverty.15 To test the sensitivity
of estimates, we also expanded our estimation of children at risk by including children living
in moderate poverty (living on less than $2 per day, according to the World Bank15).
Data sources for country-level populations younger than 5 years, stunting prevalence of
children younger than 5 years, and the percentage of the population living in extreme or
moderate poverty are presented in the appendix (p 1). We chose to use estimates of stunting
prevalence and their uncertainties published in The Lancet because these data have the
largest number of countries with available estimates (126 countries in our sample; appendix
p 1) in 2004 and 2010.16 We imputed the stunting prevalence for the remaining 15 countries
(2% of total child populations in the 2 years; appendix p 2).
Data for the percentage of children aged younger than 5 years living in extreme poverty
were not available. We addressed this issue in two ways. First, we used the 2007 assumption
and used population-level poverty ratios produced by the World Bank;2 and second, we
generated child-level poverty ratios using nationally representative population-based surveys
for a subset of countries.
Of the 141 countries analysed, the World Bank had estimates for 109 countries between
2000 and 2012 (median for years with available data: 2006 [IQR 2003–09]) on the
percentage of the total population living below the extreme ($1·25) or moderate ($2) poverty
line; 48 countries had poverty measures in 2004 (49·3% of the total population younger than
5 years) and 42 countries had poverty measures in 2010 (45·3% of the total population
younger than 5 years). For countries without poverty measures in 2004 and 2010, we
estimated poverty as described in the appendix (p 3).
Evidence has shown that children younger than 12 years have the highest poverty rates
among all age groups, especially in low-income countries.17 The assumption that poverty
ratios in children younger than 5 years are the same as those for the total population could
lead to underestimation of children aged younger than 5 years living in poverty. We
estimated country-level percentages of children aged younger than 5 years exposed to
extreme or moderate poverty for a subset of countries using micro-level data such as the
Demographic and Health Surveys18 or the Multiple Indicator Cluster Surveys.19 Estimation
Lu et al. Page 3
Lancet Glob Health. Author manuscript; available in PMC 2018 April 03.
Author M
anuscriptA
uthor Manuscript
Author M
anuscriptA
uthor Manuscript
details are presented in the appendix (p 10). The mean of child-level poverty ratios across
the countries was not significantly different from the mean of population-level poverty ratios
across the same countries, which might be because more than half of the countries in this
subset were in the middle-income group.
Estimation of children at risk of poor development
When we added numbers of children stunted to numbers of children living in poverty, to
avoid counting children exposed to both stunting and extreme poverty twice, we constructed
a dichotomous variable indicating a child exposed to poverty but not stunting using
household surveys in 86 countries and obtained the percentage of children living in poverty
but not stunting with 95% CIs for the 86 countries. Children jointly exposed to stunting and
extreme poverty were excluded from children living in extreme poverty. For the 55 countries
without micro-level data (approximately 23% of the total child population), we replaced
their missing values in the 2 years with the average percentage of children living in poverty
but not stunted by their income groups (appendix, p 13).
With the use of stunting prevalence (with 95% CIs) and the percentage of children living in
extreme or moderate poverty but not stunted (with 95% CIs) for the 141 low-income and
middle-income countries, we generated two sets of estimates with uncertainty levels for the
number and prevalence of children at risk in 2004 and 2010 at the country, regional, and
global levels. For the subset of countries with estimates of child-level poverty ratios, we also
produced two sets of estimates in 2004 and in 2010. We analysed the change in level,
prevalence, and trends of children at risk between 2004 and 2010 and examined the
robustness of results by comparing the estimates derived from various poverty measures.
Role of the funding source
The funders of the study had no role in study design, data collection, data analysis, data
interpretation, or writing of the report. The corresponding author had full access to all the
data in the study and had final responsibility for the decision to submit for publication.
Results
Although our recalculation of the 2004 estimate included fewer countries (141) than were
included in the calculation by Grantham-McGregor and colleagues (156),2 our 2004
estimate of children at risk (279 million) is higher than the Grantham-McGregor and
colleagues’ estimate (219 million), suggesting that improved data availability showed higher
estimates of children with poor development. Our analysis of the driving forces behind the
difference is shown in the appendix (p 21).
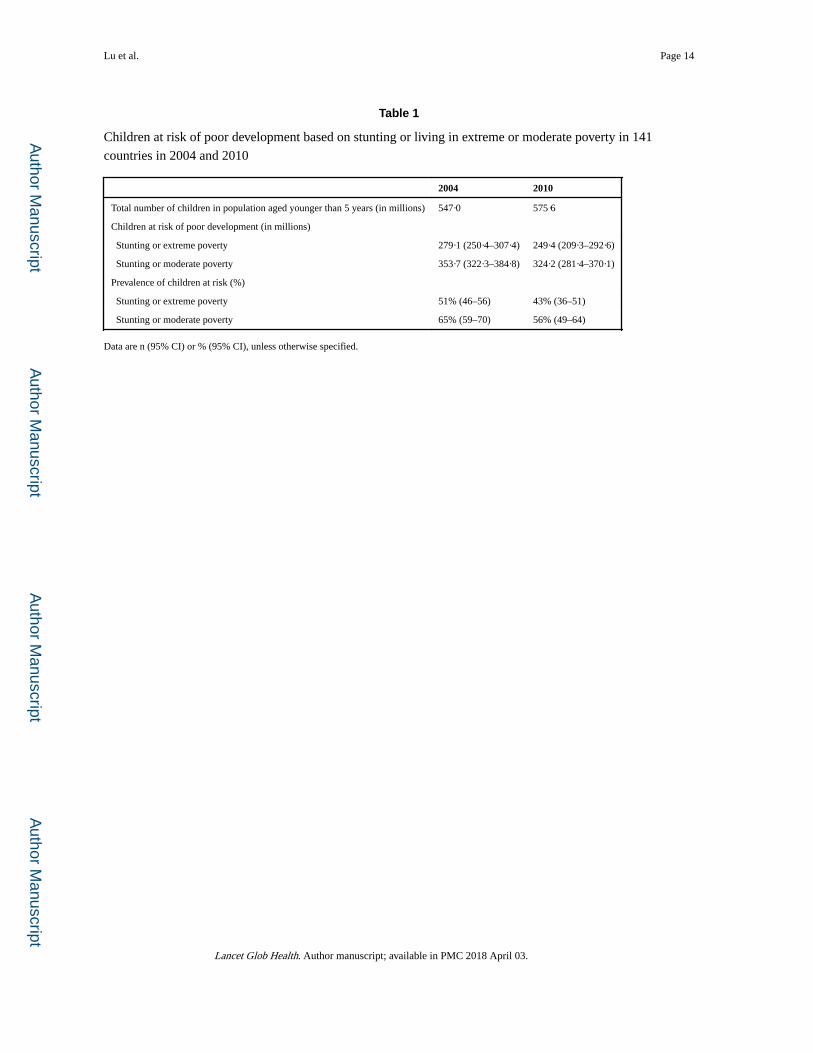
Although the population of children aged younger than 5 years in the 141 low-income and
middle-income countries has risen from 547 million in 2004 to 576 million in 2010; there
was a decline in both the level and prevalence of children at risk of poor development during
this period. When extreme poverty ratios were used, the number of children at risk fell from
279·1 million (95% CI 250·4 million–307·4 million) in 2004 to 249·4 million (209·3
million–292·6 million) in 2010 (table 1). The prevalence of children at risk fell from 51%
(95% CI 46–56) in 2004 to 43% (36–51) in 2010.
Lu et al. Page 4
Lancet Glob Health. Author manuscript; available in PMC 2018 April 03.
Author M
anuscriptA
uthor Manuscript
Author M
anuscriptA
uthor Manuscript
The use of moderate poverty ratios led to a considerable increase in the number and
prevalence of children at risk in both 2004 and 2010 compared to the estimates using
extreme poverty, but a decrease in the number of children at risk from 2004 (353·7 million
[95% CI 322·3 million–384·8 million]) to 2010 (324·2 million [281·4 million–370·1
million]) was still observed. A decrease in prevalence between 2004 and 2010 was also
noted (table 1).
The prevalence of stunting reduced from 190·6 million (35% of child population) in 2004 to
173·7 million (30%) in 2010, and the prevalence of extreme poverty reduced from 174·3
million (32%) in 2004 to 141·8 million (25%) in 2010. In children exposed to both stunting
and extreme poverty, the difference between children at risk and the sum of children stunted
and living in extreme poverty reduced from 85·8 million in 2004 (16%) to 66·1 million in
2010 (12%). The number of children living in extreme poverty but not stunted (calculated
from the difference between number of children living in extreme poverty and number of
children with joint exposure) reduced from 88·5 million (16%) in 2004 to 75·7 million
(13%) in 2010. The number of children stunted but not in poverty increased from 104·8
million (19%) in 2004 to 107·6 million (19%) in 2010.
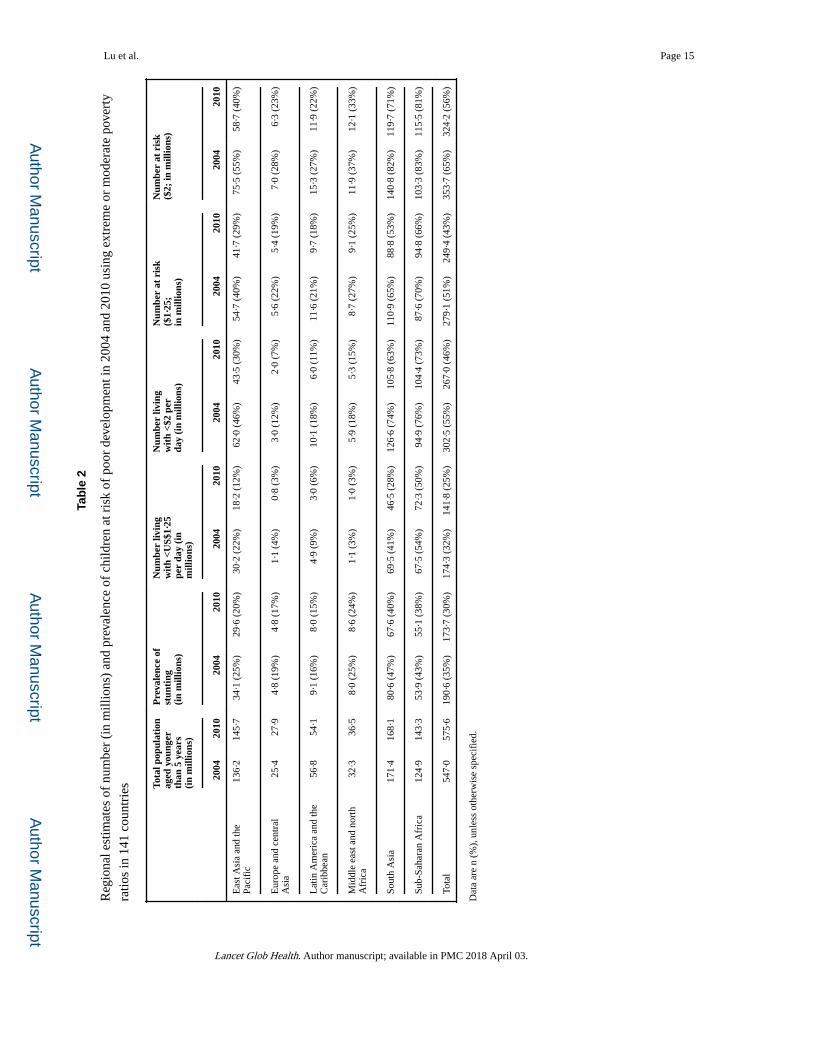
The prevalence of both risk factors declined in all regions during the period. South Asia had
the largest drop in both the number and prevalence of children exposed to stunting or
extreme poverty, followed by east Asia and the Pacific region. Accompanied by about a 16%
increase in the population aged younger than 5 years in the region, sub-Saharan Africa had a
rise in the number of children exposed to stunting and poverty, but the prevalence of the two
risk factors also declined. Sub-Saharan Africa remained the region with the highest
prevalence of children at risk in both years (table 2). The findings were robust when the
moderate poverty measure was used.
With the use of extreme poverty measures, we observed a decrease in number of children at
risk in all three income groups from 2004 to 2010 (figure 1). Lower-middle-income
countries (including China and India) had the largest fall among the three income groups,
from 178·5 million to 151·3 million. Upper-middle-income countries fell from 15·17 million
in 2004 to 13·02 million in 2010, whereas low-income countries had almost no change
(figure 1). China and India are the two countries with the largest populations of children
younger than 5 years and have made substantial progress in reducing poverty in the past
decade. If India and China were excluded from the lower-middle-income countries, almost
no reduction in risk in lower-middle-income countries would be noted during this period
(70·48 million in 2004 vs 70·50 million in 2010; figure 1). In 2004, 31% of children at risk
were from low-income countries, and this increased to 34% in 2010 when extreme poverty
measures were used. The findings were robust when using the moderate poverty measure
(appendix p 22), suggesting that India and China were the leading force for the reduction of
children at risk.
From 2004 to 2010, the prevalence of children at risk of poor development was reduced in
all three income groups; low-income countries had the smallest rate of decline. There was a
striking disparity in the prevalence across income groups. In 2004, when the extreme
poverty measures were applied, the percentage of children at risk was 71% in low-income
Lu et al. Page 5
Lancet Glob Health. Author manuscript; available in PMC 2018 April 03.
Author M
anuscriptA
uthor Manuscript
Author M
anuscriptA
uthor Manuscript
countries, 39% in lower-middle-income countries, and 18% in the upper-middle-income
countries. The large difference in prevalence between country income groups remained
unchanged in 2010. The findings were robust when moderate poverty measures were used
(figure 2).
Country-level percentage change in the prevalence of children at risk between 2004 and
2010 when extreme poverty measures were used is shown in figure 3. Of the 141 countries
assessed, 123 had reductions in prevalence. Among 27 countries with reduction of 20% or
more, 23 were middle-income countries including Vietnam (45%, the largest rate of
decline), China (40%, the second largest rate of decline), and India at margin (by 20%). Six
sub-Saharan countries also declined by more than 20% (Angola, Botswana, Cape Verde,
Congo Brazzaville, Mauritania, and South Africa). Of the 17 countries with no change or an
increase in prevalence of children at risk of poor development, 11 were in sub-Saharan
Africa.
In 2010, 34 countries had a prevalence of children at risk of 60% or higher: 30 from the low-
income group and 28 from sub-Saharan Africa (figure 3). The top ten countries with the
largest number of children at risk in 2010 were India, China, Nigeria, Bangladesh,
Indonesia, Pakistan, Ethiopia, DR Congo, Tanzania, and the Philippines, the same countries
identified in 2004. The sum of children at risk in these ten countries accounted for 64% of
all children at risk in 2010. Country-level estimates of children at risk in 141 countries
between 2004 and 2010 are presented in the appendix (p 22).
Use of child-level poverty ratios yielded higher numbers of children living in poverty and at
risk of poor development than did the population-level poverty ratio. For example, for 68
countries in 2004, the number of children living in extreme poverty was 130 million when
using population-level poverty ratio and 145 million when using the child-level poverty
ratio. The number of children at risk derived from the child-level extreme poverty ratio was
7 million higher than that derived from the population-level extreme poverty ratio (appendix
p 26). The findings were consistent when moderate poverty measures were used.
Discussion
Driven by the decline in both stunting and poverty prevalence in children younger than 5
years between 2004 and 2010, especially in China and India, a noticeable reduction was
observed in both number and prevalence of children at risk of poor development in the 141
low-income and middle-income countries between 2004 and 2010, even though the child
population has increased in this time. The declining trend and regional profile remained
unchanged when the two different poverty measures (extreme and moderate) were used.
Progress, however, was uneven across regions, with sub-Saharan Africa having the smallest
reduction and the highest prevalence of children at risk during this time period. One notable
concern is that disparity in exposure to risk factors between income groups improved little
during this period, with a disproportionate exposure to the risks for poor child development
in low-income countries.
Lu et al. Page 6
Lancet Glob Health. Author manuscript; available in PMC 2018 April 03.
Author M
anuscriptA
uthor Manuscript
Author M
anuscriptA
uthor Manuscript
This study shows encouraging, yet insufficient, progress in reducing risks for poor child
development from 2004 to 2010. In 2010, at least 43% of children aged younger than 5 years
were at risk of not fulfilling their development potential because of exposure to stunting or
extreme poverty; and the prevalence increased to 56% when extreme poverty measures were
replaced with moderate poverty measures. Even in south Asia, a region with the greatest
progress during the period, more than half of the children were exposed to stunting or
extreme poverty in 2010. The evidence clearly indicates that the challenge to improve child
development, and thereby human capital and health, remains large in the next decade. The
pace of reducing stunting and poverty will have to increase substantially for the vulnerable
children, especially in low-income countries.
The present study extended the availability of data in the study by Grantham-McGregor and
colleagues2 and applied updated methods. However, two limitations remain. First, although
poverty and stunting are strongly associated with risks for poor child development, other
risks for poor development exist that are not necessarily associated with poverty and
stunting, such as maternal depression, violence against children, or adverse environmental
conditions. Low maternal schooling affects the amount and quality of cognitive stimulation
provided to young children.20,21 Recent reviews on studies of violence against children
concluded that the prevalence of child maltreatment worldwide is high and puts millions of
children at risk of poor development.22,23 Children exposed to multiple risk factors have a
greater likelihood of poor adult health and wellbeing.24 A pioneering study in the 15
countries with available data on low maternal schooling and child maltreatment showed that
estimates of children at risk in all 15 countries in 2010 increased substantially from 63%
(associated with stunting and extreme poverty) to 75% when low maternal schooling and
child maltreatment were added.25 Because of the insufficient data for these risk factors in
low-income and middle-income countries and in sufficient validation studies of the existing
variables, we were not able to introduce these risk factors into the global estimation. This
limitation highlights the need to develop global standards and broad-scale data to measure
risk and protective factors for early child development. Although we improved the accuracy
and comparability of the estimates across countries and between years with improved data
and methods, estimates could go beyond 2010 as the frequency of macro-level and micro-
level data increases and time to access the data improves.
Elimination of risks in early child development is a formidable challenge and requires a
comprehensive understanding of the state of children’s development. Although exposure to
risk factors is an effective predictor for poor child development, proximal indicators of child
development, such as direct measures of early child development, including intervention
coverage and access to protective factors, would complement our knowledge about risk
factors and shed light on how to effectively reduce risk factors for poor early child
development through interventions.
Future recommendations include continuing to monitor global progress in reducing the
number of children aged younger than 5 years at risk of poor development by addressing the
limitations of the current methods and investing in data and research strategies to develop
standardised indicators for measuring child development. With increased knowledge of
evidence-based interventions on maternal health and early child development,26–30
Lu et al. Page 7
Lancet Glob Health. Author manuscript; available in PMC 2018 April 03.
Author M
anuscriptA
uthor Manuscript
Author M
anuscriptA
uthor Manuscript
immediate actions are needed to scale up effective interventions, such as improving maternal
and child nutrition, targeting the most vulnerable children in sub-Saharan Africa and south
Asia.
Supplementary Material
Refer to Web version on PubMed Central for supplementary material.
Acknowledgments
We thank Zhihui Li for assisting with data analysis, and Jere Behrman, Kenneth Hill, Samuel H Preston, and other members in the writing group for the Lancet Early Childhood Development Series for critical review and comments. This study was funded by the National Institutes of Health, grant number 1K0HD071929-01, the Bill & Melinda Gates Foundation, and the Hilton Foundation.
References
1. Shonkoff J, Richter L, Van Der Gaag J, Bhutta Z. An integrated scientific framework for child survival and early childhood development. Pediatrics. 2012; 129:e460–72. [PubMed: 22218840]
2. Grantham-McGregor S, Cheung YB, Cueto S, Glewwe P, Richter L, Strupp B. Developmental potential in the first 5 years for children in developing countries. Lancet. 2007; 369:60–70. [PubMed: 17208643]
3. Hoddinott J, Maluccio JA, Behrman JR, Flores R, Martorell R. Effect of a nutrition intervention during early childhood on economic productivity in Guatemalan adults. Lancet. 2008; 371:411–16. [PubMed: 18242415]
4. Victora CG, Adair L, Fall C, et al. for the Maternal and Child Undernutrition Study Group. Maternal and child undernutrition: consequences for adult health and human capital. Lancet. 2008; 371:340–57. [PubMed: 18206223]
5. Stein AD, Wang M, Martorell R, et al. Growth patterns in early childhood and final attained stature: data from five birth cohorts from low- and middle-income countries. Am J Hum Biol. 2010; 22:353–59. [PubMed: 19856426]
6. Chang SM, Walker SP, Grantham-McGregor S, Powell CA. Early childhood stunting and later behaviour and school achievement. J Child Psychol Psychiatry. 2002; 43:775–83. [PubMed: 12236612]
7. Adair LS, Fall CH, Osmond C, et al. Associations of linear growth and relative weight gain during early life with adult health and human capital in countries of low and middle income countries: findings from five birth cohort studies. Lancet. 2013; 382:525–34. [PubMed: 23541370]
8. Hoddinott J, Behrman JR, Maluccio JA, et al. Adult consequences of growth failure in early childhood. Am J Clin Nutr. 2013; 98:1170–78. [PubMed: 24004889]
9. Denboba, A., Sayre, RK., Wodon, Q., Elder, L., Rawlings, L., Lombardi, J. Stepping up early childhood development: investing in young children with high returns. Washington, DC: The World Bank; 2014.
10. Gertler P, Heckman J, Pinto R, et al. Labor market returns to an early childhood stimulation intervention in Jamaica. Science. 2014; 1014:998–1001.
11. WHO, Multicentre Growth Reference Study Group. WHO child growth standards: length/height-for-age, weight-for-age, weight-for-length, weight-for-height and body mass index-for-age: methods and development. Geneva: World Health Organization; 2006.
12. Chen S, Ravallion M. The developing world is poorer than we thought, but no less successful in the fight against poverty. Q J Econ. 2010; 125:1577–625.
13. Chen S, Ravallion M. How have the world’s poorest fared since the early 1980s? World Bank Res Obs. 2004; 19:141–70.
Lu et al. Page 8
Lancet Glob Health. Author manuscript; available in PMC 2018 April 03.
Author M
anuscriptA
uthor Manuscript
Author M
anuscriptA
uthor Manuscript
14. World Bank. [accessed Sept 6, 2014] World Bank list of economies. Jan. 2011 http://librarians.acm.org/sites/default/files/Jan%202011%20World%20bank%20list%20of%20Economies.pdf
15. World Bank. [accessed Sept 29, 2014] Poverty headcount ratio at $1·90 a day (2011 PPP) (% of population). http://data.worldbank.org/indicator/SI.POV. DDAY
16. Stevens GA, Finucane MM, Paciorek CJ, et al. Trends in mild, moderate, and severe stunting and underweight, and progress towards MDG 1 in 141 developing countries: a systematic analysis of population representative data. Lancet. 2012; 380:824–34. [PubMed: 22770478]
17. Olinto, P., Beegle, K., Sobrado, C., Uematsu, H. The state of the poor: where are the poor, where is extreme poverty harder to end, and what is the current profile of the world’s poor?. Washington, DC: World Bank; 2013.
18. United States Agency for International Development. [accessed Sept 6, 2014] Demographic and Health Surveys, data. http://www.dhsprogram.com/data/
19. UNICEF. [accessed Oct 8, 2014] Multiple indicator cluster surveys. 2014. http://www.childinfo.org/mics.html
20. Walker SP, Wachs TD, Gardner JM, et al. Child development: risk factors for adverse outcomes in developing countries. Lancet. 2007; 369:145–57. [PubMed: 17223478]
21. Carvalho L. Childhood circumstances and the intergenerational transmission of socioeconomic status. Demography. 2012; 49:913–38. [PubMed: 22753083]
22. Child Protection Monitoring and Evaluation Reference Group. [accessed Sept 6, 2014] Measuring violence against children: inventory and assessment of quantitative studies. 2014. http://www.unicef.org/ecuador/CP_MERG_REPORT.pdf
23. Stoltenborgh M, Bakermans-Kranenburg MJ, Alink Lenneke RA, IJzendoorn MH. The prevalence of child maltreatment across the globe: review of a series of meta-analyses. Child Abuse Rev. 2015; 24.1:37–50.
24. Evans G, Li D, Sepanski WS. Cumulative risks and child development. Psychol Bull. 2013; 139:1342–96. [PubMed: 23566018]
25. Richter, LM., Darmstadt, G., Daelmans, B., et al. with the Paper 3 Working Group, for the Lancet Early Childhood Development Series Steering Committee. Investing in the foundation of sustainable development: pathways to scale up for early childhood development. Lancet. 2016. published online Oct 4. http://dx.doi.org/10.1016/S0140-6736(16)31698-1
26. Engle PL, Fernald LC, Alderman H, et al. Strategies for reducing inequalities and improving developmental outcomes for young children in low-income and middle-income countries. Lancet. 2011; 378:1339–53. [PubMed: 21944378]
27. Bhutta ZA, Das JK, Rizvi A, et al. Evidence-based interventions for improvement of maternal and child nutrition: what can be done and at what cost? Lancet. 2013; 382:452–77. [PubMed: 23746776]
28. Bhutta ZA, Das JK, Rizvi A, et al. Can available interventions end preventable deaths in mothers, newborn babies, and stillbirths, and at what cost? Lancet. 2014; 384:347–70. [PubMed: 24853604]
29. Ruel MT, Alderman H, the Maternal and Child Nutrition Study Group. Nutrition-sensitive interventions and programmes: how can they help to accelerate progress in improving maternal and child nutrition? Lancet. 2013; 382:536–51. [PubMed: 23746780]
30. Lassi ZS, Das JK, Salam RA, Bhutta ZA. Evidence from community level inputs to improve quality of care for maternal and newborn health: interventions and findings. Reprod Health. 2014; 11(suppl 2):S2.
Lu et al. Page 9
Lancet Glob Health. Author manuscript; available in PMC 2018 April 03.
Author M
anuscriptA
uthor Manuscript
Author M
anuscriptA
uthor Manuscript
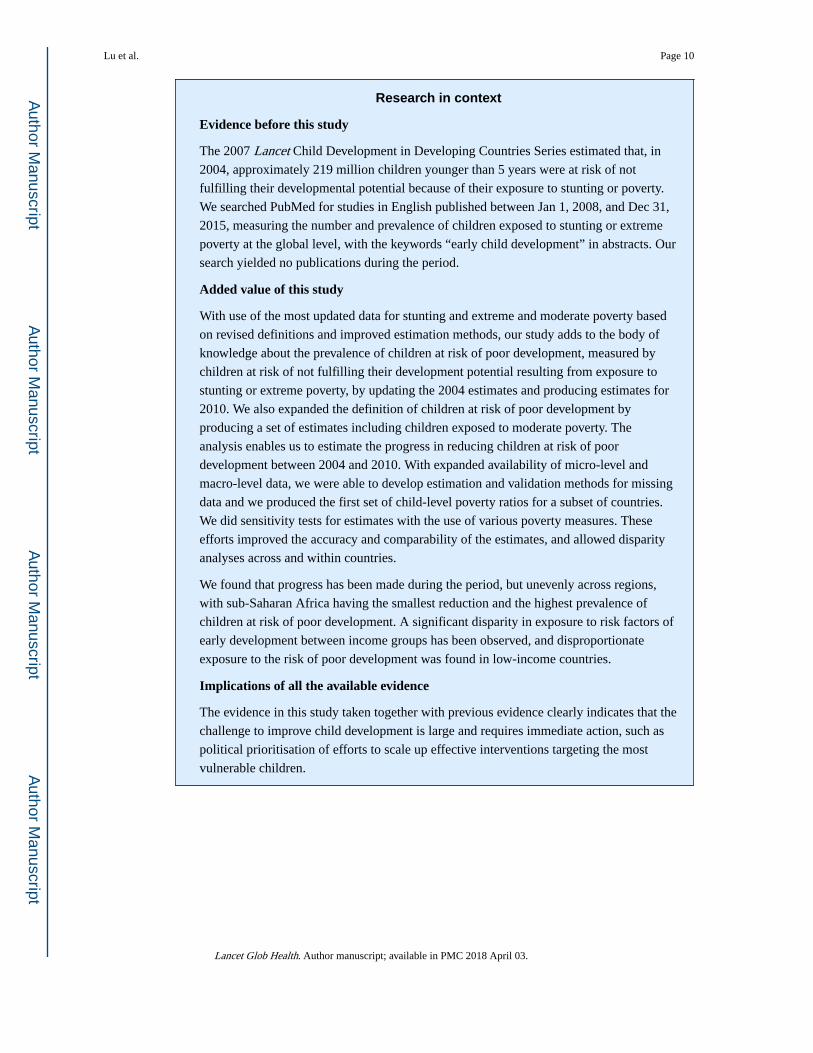
Research in context
Evidence before this study
The 2007 Lancet Child Development in Developing Countries Series estimated that, in
2004, approximately 219 million children younger than 5 years were at risk of not
fulfilling their developmental potential because of their exposure to stunting or poverty.
We searched PubMed for studies in English published between Jan 1, 2008, and Dec 31,
2015, measuring the number and prevalence of children exposed to stunting or extreme
poverty at the global level, with the keywords “early child development” in abstracts. Our
search yielded no publications during the period.
Added value of this study
With use of the most updated data for stunting and extreme and moderate poverty based
on revised definitions and improved estimation methods, our study adds to the body of
knowledge about the prevalence of children at risk of poor development, measured by
children at risk of not fulfilling their development potential resulting from exposure to
stunting or extreme poverty, by updating the 2004 estimates and producing estimates for
2010. We also expanded the definition of children at risk of poor development by
producing a set of estimates including children exposed to moderate poverty. The
analysis enables us to estimate the progress in reducing children at risk of poor
development between 2004 and 2010. With expanded availability of micro-level and
macro-level data, we were able to develop estimation and validation methods for missing
data and we produced the first set of child-level poverty ratios for a subset of countries.
We did sensitivity tests for estimates with the use of various poverty measures. These
efforts improved the accuracy and comparability of the estimates, and allowed disparity
analyses across and within countries.
We found that progress has been made during the period, but unevenly across regions,
with sub-Saharan Africa having the smallest reduction and the highest prevalence of
children at risk of poor development. A significant disparity in exposure to risk factors of
early development between income groups has been observed, and disproportionate
exposure to the risk of poor development was found in low-income countries.
Implications of all the available evidence
The evidence in this study taken together with previous evidence clearly indicates that the
challenge to improve child development is large and requires immediate action, such as
political prioritisation of efforts to scale up effective interventions targeting the most
vulnerable children.
Lu et al. Page 10
Lancet Glob Health. Author manuscript; available in PMC 2018 April 03.
Author M
anuscriptA
uthor Manuscript
Author M
anuscriptA
uthor Manuscript
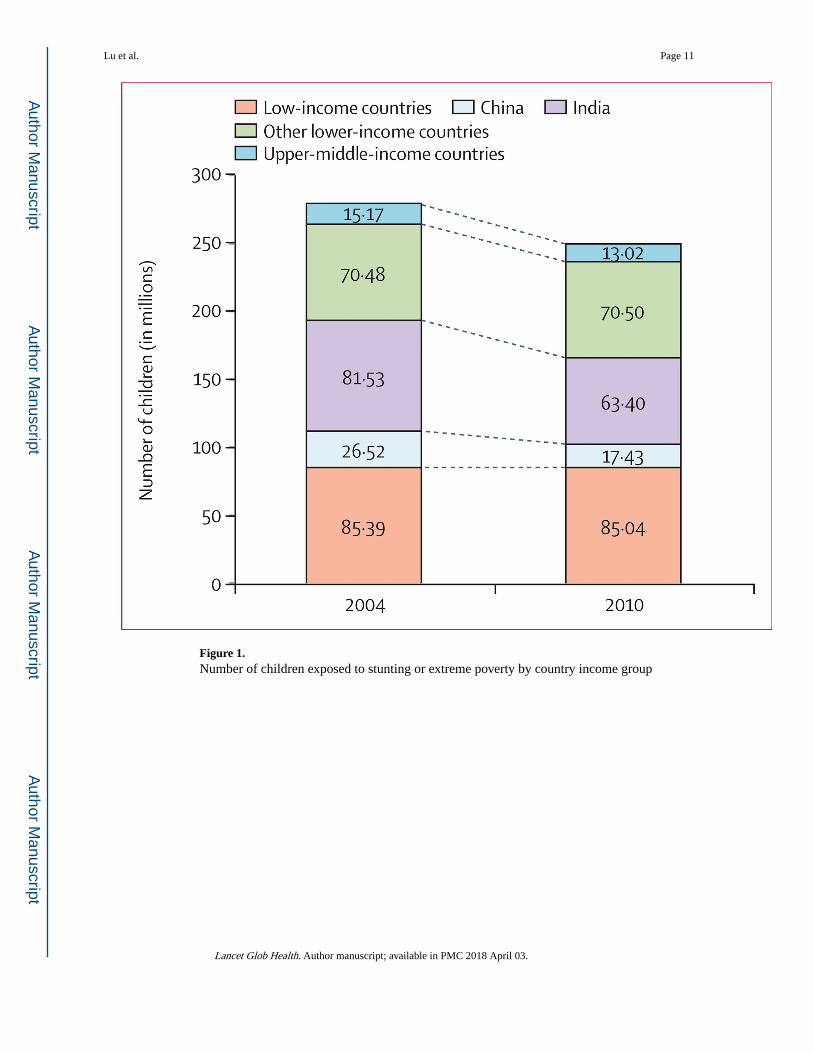
Figure 1. Number of children exposed to stunting or extreme poverty by country income group
Lu et al. Page 11
Lancet Glob Health. Author manuscript; available in PMC 2018 April 03.
Author M
anuscriptA
uthor Manuscript
Author M
anuscriptA
uthor Manuscript
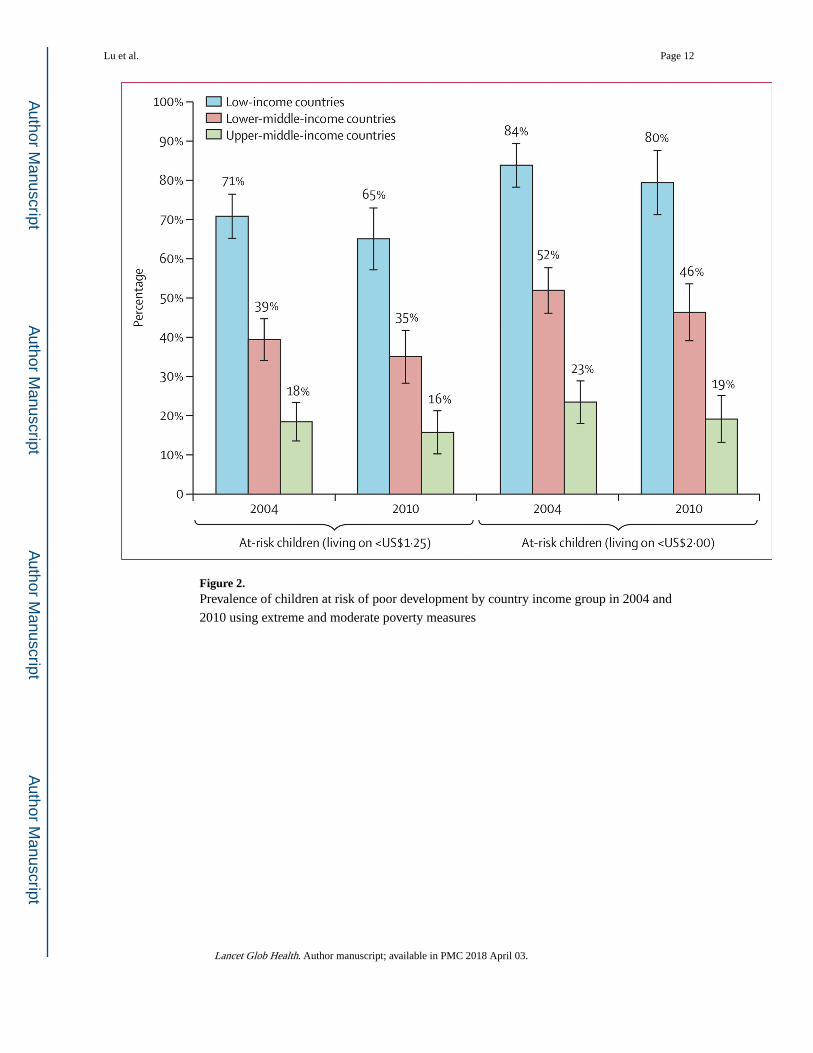
Figure 2. Prevalence of children at risk of poor development by country income group in 2004 and
2010 using extreme and moderate poverty measures
Lu et al. Page 12
Lancet Glob Health. Author manuscript; available in PMC 2018 April 03.
Author M
anuscriptA
uthor Manuscript
Author M
anuscriptA
uthor Manuscript
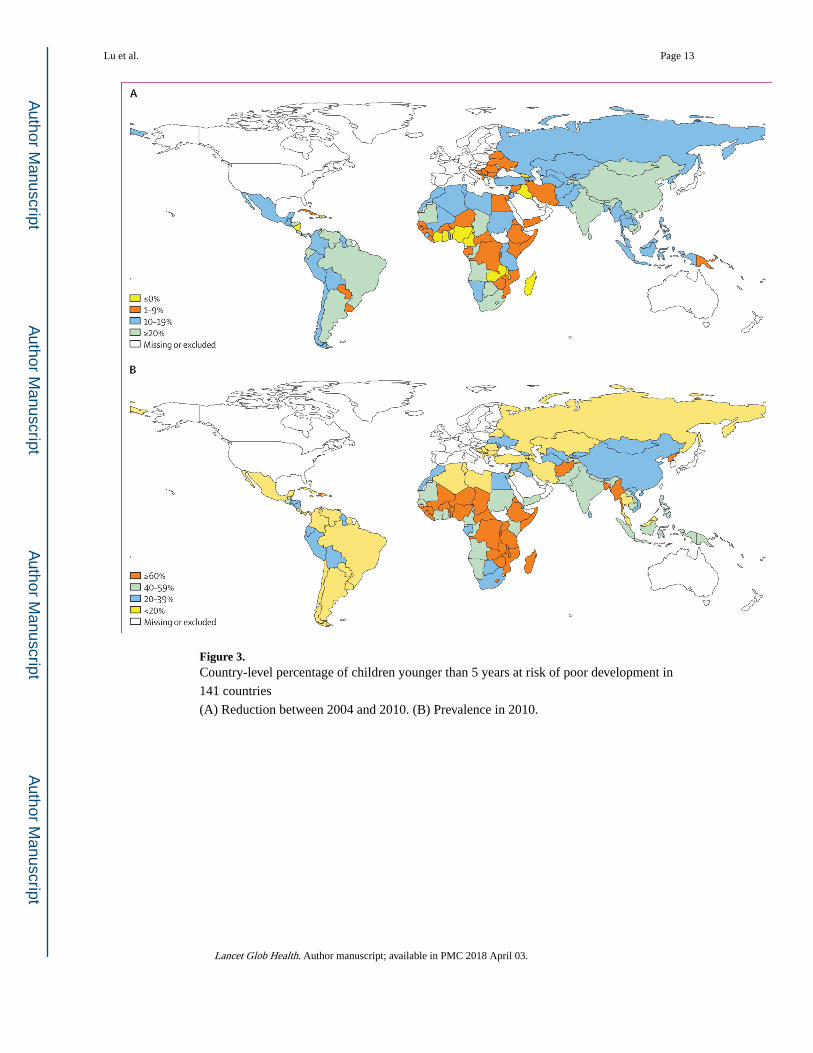
Figure 3. Country-level percentage of children younger than 5 years at risk of poor development in
141 countries
(A) Reduction between 2004 and 2010. (B) Prevalence in 2010.
Lu et al. Page 13
Lancet Glob Health. Author manuscript; available in PMC 2018 April 03.
Author M
anuscriptA
uthor Manuscript
Author M
anuscriptA
uthor Manuscript
Author M
anuscriptA
uthor Manuscript
Author M
anuscriptA
uthor Manuscript
Lu et al. Page 14
Table 1
Children at risk of poor development based on stunting or living in extreme or moderate poverty in 141
countries in 2004 and 2010
2004 2010
Total number of children in population aged younger than 5 years (in millions) 547·0 575·6
Children at risk of poor development (in millions)
Stunting or extreme poverty 279·1 (250·4–307·4) 249·4 (209·3–292·6)
Stunting or moderate poverty 353·7 (322·3–384·8) 324·2 (281·4–370·1)
Prevalence of children at risk (%)
Stunting or extreme poverty 51% (46–56) 43% (36–51)
Stunting or moderate poverty 65% (59–70) 56% (49–64)
Data are n (95% CI) or % (95% CI), unless otherwise specified.
Lancet Glob Health. Author manuscript; available in PMC 2018 April 03.
Author M
anuscriptA
uthor Manuscript
Author M
anuscriptA
uthor Manuscript
Lu et al. Page 15
Tab
le 2
Reg
iona
l est
imat
es o
f nu
mbe
r (i
n m
illio
ns)
and
prev
alen
ce o
f ch
ildre
n at
ris
k of
poo
r de
velo
pmen
t in
2004
and
201
0 us
ing
extr
eme
or m
oder
ate
pove
rty
ratio
s in
141
cou
ntri
es Tota
l pop
ulat
ion
aged
you
nger
than
5 y
ears
(in
mill
ions
)
Pre
vale
nce
ofst
unti
ng(i
n m
illio
ns)
Num
ber
livin
gw
ith
<US$
1·25
per
day
(in
mill
ions
)
Num
ber
livin
gw
ith
<$2
per
day
(in
mill
ions
)
Num
ber
at r
isk
($1·
25;
in m
illio
ns)
Num
ber
at r
isk
($2;
in m
illio
ns)
2004
2010
2004
2010
2004
2010
2004
2010
2004
2010
2004
2010
Eas
t Asi
a an
d th
e Pa
cifi
c13
6·2
145·
734
·1 (
25%
)29
·6 (
20%
)30
·2 (
22%
)18
·2 (
12%
)62
·0 (
46%
)43
·5 (
30%
)54
·7 (
40%
)41
·7 (
29%
)75
·5 (
55%
)58
·7 (
40%
)
Eur
ope
and
cent
ral
Asi
a25
·427
·94·
8 (1
9%)
4·8
(17%
)1·
1 (4
%)
0·8
(3%
)3·
0 (1
2%)
2·0
(7%
)5·
6 (2
2%)
5·4
(19%
)7·
0 (2
8%)
6·3
(23%
)
Lat
in A
mer
ica
and
the
Car
ibbe
an56
·854
·19·
1 (1
6%)
8·0
(15%
)4·
9 (9
%)
3·0
(6%
)10
·1 (
18%
)6·
0 (1
1%)
11·6
(21
%)
9·7
(18%
)15
·3 (
27%
)11
·9 (
22%
)
Mid
dle
east
and
nor
th
Afr
ica
32·3
36·5
8·0
(25%
)8·
6 (2
4%)
1·1
(3%
)1·
0 (3
%)
5·9
(18%
)5·
3 (1
5%)
8·7
(27%
)9·
1 (2
5%)
11·9
(37
%)
12·1
(33
%)
Sout
h A
sia
171·
416
8·1
80·6
(47
%)
67·6
(40
%)
69·5
(41
%)
46·5
(28
%)
126·
6 (7
4%)
105·
8 (6
3%)
110·
9 (6
5%)
88·8
(53
%)
140·
8 (8
2%)
119·
7 (7
1%)
Sub-
Saha
ran
Afr
ica
124·
914
3·3
53·9
(43
%)
55·1
(38
%)
67·5
(54
%)
72·3
(50
%)
94·9
(76
%)
104·
4 (7
3%)
87·6
(70
%)
94·8
(66
%)
103·
3 (8
3%)
115·
5 (8
1%)
Tota
l54
7·0
575·
619
0·6
(35%
)17
3·7
(30%
)17
4·3
(32%
)14
1·8
(25%
)30
2·5
(55%
)26
7·0
(46%
)27
9·1
(51%
)24
9·4
(43%
)35
3·7
(65%
)32
4·2
(56%
)
Dat
a ar
e n
(%),
unl
ess
othe
rwis
e sp
ecif
ied.
Lancet Glob Health. Author manuscript; available in PMC 2018 April 03.