risk of malnutrition and pressure ulcer in a mixed
TRANSCRIPT

Risk of Malnutrition and Pressure Ulcer
in a mixed hospital population. Nutritional risk screening predicting pressure ulcer.
Johanne Alhaug
Supervisors:
Christine Henriksen Anners Lerdal
Master thesis
Department of Nutrition
Faculty of Medicine UNIVERSITY OF OSLO
2016

II
© Johanne Alhaug 2016
Risk of Malnutrition and Pressure Ulcer in a mixed hospital population
Nutritional risk screening predicting pressure ulcer
Johanne Alhaug
http://www.duo.uio.no/
Trykk: Reprosentralen, Universitetet i Oslo

III
Acknowledgement
I am fortunate to have been given the opportunity to make this exciting, enriching, educational
and interesting scientific journey. My gratitude goes to all of you who made this possible!
The Safety in Hospital Study was conducted at Lovisenberg Diaconal Hospital from September
2012 to June 2014. It was funded by Lovisenberg Diaconal University College and Lovisenberg
Diaconal Hospital. I am grateful for the opportunity to be working in a hospital that put priority
in patient safety and making nutritional management a part of safety routines. A special
appreciation to Lovisenberg Diaconal Hospital for trusting my part of the Safety in Hospital
Study and for offering me the research grant.
I will express my special thanks to patients, bachelor students in nursing, ward nurses, steering
committee, project group, expert groups, coordinators, the administration at the medical and
surgical departments, Tove Irene Granheim, at Lovisenberg Diaconal Hospital, and Tove
Elisabeth Mohaugen Børsting, at Lovisenberg Diaconal University College, for making the
Safety in Hospital Study possible. Without all the dedicated colleagues this study would not have
been possible.
I am also grateful to my supervisors Christine Henriksen, at the University of Oslo and Anners
Lerdal at Lovisenberg Diaconal Hospital. Thank you for accepting my request. You have given
me valuable guidance in every process, taken part in enriching discussions, given constructive
feedback and most of all offered me new valuable knowledge! Christine, I admire your positive
and constructive ability to view most issues as an opportunity and not as a problem. Working
with you is inspiring! Anners, you have encouraged me to extend my clinical knowledge and
experience into research. I treasure that! Both of you, thank you so much for all the support and
time you have given me!
A special thanks to Caryl L Gay, at Lovisenberg Diaconal Hospital and University of California,
San Francisco, USA for all your valuable and important contribution with statistics. Your
thorough and experienced guidance in interpretations of study results has led to most valuable
new knowledge. Caryl you are the fastest e-mail responder. Despite the time difference it seems

IV
like you are on call 24-7! Thank you for your patience and support, always with sensible
explanations.
Without my always inspiring leader, Tonje Mellin-Olsen, at Lovisenberg Diaconal Hospital, my
scientific journey would never have started. You have encouraged me every step of the way. I
am grateful for all the support, positive and constructive feedback, thorough proof reading, all
valuable discussions and for being the best boss there is! I am so thankful for being a part of the
clinical nutrition team together with my inspiring colleagues.
Finally, I will express my gratitude to my family and close friends. Thank you for having faith in
me when I had my doubts. I have treasured all the hikes, phone calls, weekends and dinners with
your cheering and participating in valuable discussions. It has been inspiring, instructive and not
to forget fun and very pleasant! Per, thank you for being such a good supporter, believer, proof
reader and chef, when studying was more fun than food. You rescued me from becoming At risk
of malnutrition!
Thank you all for joining my journey!
Oslo, February 2016
Johanne Alhaug

V
Abstract
Background and aim
Malnutrition and pressure ulcer represent significant health problems for hospital inpatients, in
addition to having a considerable impact on local and national health care cost. Sufficient
nutritional status is crucial for proper wound healing, and malnutrition is a prominent risk factor
for pressure ulcer development. Risk of malnutrition can be identified using standardized
screening tools, such as the Nutritional Risk Screening (NRS) 2002. The objective of this study
was to examine the prevalence of risk of malnutrition and pressure ulcer, and whether the NRS
2002 could predict risk of pressure ulcer for hospital inpatients.
Methods
The data was collected as part of a larger cross-sectional study conducted at Lovisenberg
Diaconal Hospital in Oslo, Norway on 10 pre-selected screening days between September 2012
and May 2014. All adult inpatients (≥18 years) admitted to medical or elective orthopedic
surgical wards on the screening days were asked to participate. Patients admitted to Hospice or
an intensive care unit, with cognitive impairment or unable to read Norwegian were excluded.
Second year nursing bachelor students and ward nurses conducted the NRS 2002 initial
screening and skin examinations for pressure ulcer using European Pressure Ulcer Advisory
Panel classification (Stage I-IV). A registered clinical dietician conducted all NRS 2002 final
screenings.
Results
Of the 1082 patients hospitalized on the 10 screening days, 651 (77 %) had complete screening
data and skin examinations and were included in the analysis. The sample included 52% women
and mean age was 62.9 years (SD 17.3). Based on the initial NRS 2002 screening, 52 % of the
sample was at Possible risk of malnutrition. Final screening identified 34 % At risk for
malnutrition. Most (65 %) of the 339 patients identified as Possible risk by initial screening were
identifies as At risk in the final screening.

VI
The skin examinations indicated an 8 % prevalence of pressure ulcer (Stage I-IV).
Patients identified as being at Possible risk by the initial screening or At risk by the final NRS
2002 screening, were more likely to have pressure ulcer (OR=2.58, p=0.011 and 2.55, p=0.008
respectively) than patients at low nutritional risk after controlling for sex, age, hospital
department, and BMI. Among the three initial screening items, the strongest predictors of PU
were Is BMI<20? (OR 2.73, p=0.006) and Ate less past week? (OR=1.91, p=0.046)
Conclusion
This current study confirms that risk of malnutrition and pressure ulcers still are common in a
Norwegian hospital setting. In addition it suggests the significance of nutritional risk screening,
using the NRS 2002, in predicting the presence of pressure ulcer in the studied hospital
population. The prevalence of pressure ulcer was lower and risk of malnutrition higher than
expected prior to the study. The final screening was a slightly stronger predictor of pressure ulcer
compared to the initial NRS 2002 screening. However, given that the initial screening requires
less time from ward personnel, the initial screening is considered to be adequate for identifying
patients at risk of developing pressure ulcer. This could enable more efficient screening routines
to promote optimal implementation, execution and satisfactory patient safety results.

VII
Abbreviations
A.S.P.E.N American Society of Parenteral and Enteral Nutrition
BMI Body mass index
CRP C-reactive protein
EPUAP European Pressure Ulcer Advisory Panel
ESPEN European Society of Clinical Nutrition and Metabolism
HAPU Hospital acquired pressure ulcer
ICU Intensive care unit
IPLOS Individbasert pleie- og omsorgsstatistikk
IRR Inter-rater reliability
LOS Length of stay
MNA Mini Nutritional Assessment
MUST Malnutrition Universal Screening Tool
NPUAP National Pressure Ulcer Advisory Panel
NRS 2002 Nutritional Risk Screening 2002
PEM Protein and energy malnutrition
PU Pressure ulcer
SGA Subjective Global Assessment

VIII
List of Tables and Figures
Table 1: Sample Characteristics by Initial NRS 2002 Screening Status
Table 2: Sample Characteristics by Final NRS 2002 Screening Status
Table 3: Skin Examination Results in Relation to Demographic, Clinical and Nutritional
Factors
Table 4: Multivariate Analysis Predicting Pressure Ulcer with Initial or Final NRS 2002
Screening
Table 5: Multivariate Analysis Predicting Pressure Ulcer from Initial NRS 2002 Screening
Items
Figure 1: Progression of Pressure Ulcer (NPUAP/EPUAP)
Figure 2: Flow Chart of Study Sample
Figure 3: Distribution Risk of Malnutrition in Medical and Surgical Departments Using
NRS 2002 Initial and Final Screening
Figure 4: Total Number of Pressure Ulcer Classified as Stage I-IV

IX
Table of contents
1. Introduction ................................................................................................................................. 1
1.1 Malnutrition .......................................................................................................................... 1
1.1.1 Definition ....................................................................................................................... 1
1.1.2 Biological effects ........................................................................................................... 3
1.1.3 Nutritional risk screening ............................................................................................... 5
1.1.4 Prevalence and risk groups ............................................................................................ 6
1.1.5 Length of stay and health care costs .............................................................................. 7
1.2 Pressure ulcer ........................................................................................................................ 9
1.2.1 Definition ....................................................................................................................... 9
1.2.2 Prevalence and risk groups .......................................................................................... 10
1.2.3 Risk screening and classification ................................................................................. 11
1.2.4 Length of stay and health care cost .............................................................................. 12
1.3 Nutritional risk screening and pressure ulcer ...................................................................... 13
2. Aim ........................................................................................................................................... 14
3. Methods..................................................................................................................................... 15
3.1 Design and Setting .............................................................................................................. 15
3.2 Study population ................................................................................................................. 15
3.3 Data collection .................................................................................................................... 16
3.4 Measures ............................................................................................................................. 16
3.4.1 Nutritional risk screening ............................................................................................. 16
3.4.2 Skin examinations ........................................................................................................ 18
3.4.3 Body mass index .......................................................................................................... 18
3.4.4 Socio-demographic characteristics .............................................................................. 19
3.4.5 Statistics ....................................................................................................................... 19
3.6 Ethics................................................................................................................................... 20
3.7 My contribution to the study ............................................................................................... 21
4. Results ....................................................................................................................................... 22
4.1 Sample characteristics ......................................................................................................... 22
4.2 Nutritional risk screening .................................................................................................... 23

X
4.2.1 Initial nutritional screening .......................................................................................... 25
4.2.2 Final nutritional screening ........................................................................................... 26
4.3 Skin examination ................................................................................................................ 27
4.4 Associations risk of malnutrition and pressure ulcer .......................................................... 27
4.4.1 Multivariate models predicting pressure ulcers ........................................................... 30
5. Discussion ................................................................................................................................. 33
5.1 Nutritional risk screening .................................................................................................... 33
5.2 Skin examination ................................................................................................................ 35
5.3 Nutritional risk screening predicting pressure ulcer ........................................................... 36
5.4 Study design and population ............................................................................................... 39
5.5 Data collection .................................................................................................................... 39
5.6 NRS 2002 screening and skin examination ........................................................................ 40
6. Conclusion ................................................................................................................................ 42
7. Future Perspectives ................................................................................................................... 43
8.References .................................................................................................................................. 45
Appendix ....................................................................................................................................... 50

1
1. Introduction
1.1 Malnutrition
1.1.1 Definition
Malnutrition is a complex condition, and the definition and diagnostic criteria for malnutrition
has been discussed internationally. The American Society of Parenteral and Enteral Nutrition
(A.S.P.E.N.) published in 2012 an approach for universal standardized diagnostic characteristic
recognizing malnutrition (1). The consensus statement describes malnutrition as simply any
nutritional imbalance, focusing on adult malnutrition, covering malnourished and obese adults at
nutritional risk (1).
Malnutrition is defined by the European Society of Clinical Nutrition and Metabolism (ESPEN)
(2) in their Consensus Statement of 2015 (2): “Malnutrition due to starvation, disease or ageing
can be defined as a state resulting from lack of uptake or intake of nutrition leading to altered
body composition (decreased fat free mass) and body cell mass leading to diminished physical
and mental function and impaired clinical outcome from disease”. The intention of the ESPEN
Consensus Statement is “to provide a consensus based on a minimum set of criteria for the
diagnosis of malnutrition to be applied independent of clinical setting and etiology and to unify
international terminology” (2).
Both A.S.P.E.N. and ESPEN guidelines are based on earlier joint efforts to develop an etiology-
based approach for diagnosing adult malnutrition (3). The approach defines adult malnutrition
“in the context of acute illness or injury, chronic diseases or conditions, and starvation-related
malnutrition”(1). In addition it might be useful to include “frailty” as a fourth condition of
malnutrition.
1. Pure chronic starvation without inflammation (e.g. medical conditions like anorexia nervosa).
Malnutrition caused by starvation was brought to attention in the 1960’s, due to famine
catastrophes in Africa (2). The two most common conditions are;

2
a. Kwashiorkor, energy deficiency causing major weight loss due to depletion of fat
reserves (2).
b. Marasmus, protein deficiency causing hypoalbuminia, ascites and peripheral
edema.(2).
Proper nutritional treatment will most likely be beneficial for both conditions.
2. Chronic diseases or conditions that impose sustained inflammation of a mild to moderate
degree (e.g. organ failure, pancreatic cancer, rheumatoid arthritis or sarcopenic obesity).
Proper nutritional treatment will most likely be beneficial.
Disease related malnutrition seen in hospitals is often a combination of the two (1. and 2) (2).
3. Acute disease or injury states with marked inflammatory response (e.g. major infection,
burns, trauma or closed head injury). This can be characterized as an acute response that
triggers a cascade of reactions leading to elevated resting energy expenditure, impaired
utilization of protein, and increased nitrogen excretion (4). This clinical condition has
more recently been characterized as part of the condition of cachexia (5, 6).
Cachexia (Greek: bad condition) can be described as “a multifactorial syndrome
characterized by severe loss of body weight, fat and muscle mass in addition to increased
protein catabolism due to underlying disease(s)” (5). Clinical conditions contributing to
the onset of cachexia are anorexia, metabolic alterations, increased muscle degeneration
and impaired macronutrient metabolism (carbohydrate, protein and lipid) together with
high levels of infection markers, as C-reactive protein (CRP) and loss of body weight (5).
Proper nutritional treatment alone is not sufficient to reverse the sever condition (4).
Individualized nutritional care in combination with proper medical treatment will most
likely be beneficial.
4. Frailty is more often included when describing malnutrition in elderly; a geriatric
syndrome resulting from age-related increasing failures in a number of physiological
processes. This includes normal age related changes and a homeostatic imbalance which
3
results in a reduced ability to manage metabolic stress. The clinical condition does make
a person more vulnerable to disease and injury (6). Fried et al. developed an accepted
definition and a more readily identification of frailty based on physical issues including
unintentional weight loss, exhaustion, weakness, slow gait speed and low physical
activity. Three or more of these physical characteristics must be present to support the
frailty diagnosis. In addition frailty includes assessment of issues like cognitive status,
social support and environmental factors (7).
The terms malnutrition and undernutrition is used interchangeably in the literature. Malnutrition
describes both overnutrition and undernutrition. The ESPEN consensus chose to use malnutrition
when describing deficiencies of macro- and micronutrients in addition to catabolism of protein
and energy stores caused by disease or ageing (2). In this thesis the terms malnutrition and risk of
malnutrition will be used referring to deficiencies.
1.1.2 Biological effects
Inadequate intake of food over time will have a negative impact on metabolic functions, body
composition, physical and psychosocial performance, that together constitute a state of
malnutrition, according to Stratton (8, 9). Malnutrition is a multifactorial and complex condition
with or without acute or chronic disease. Only a few of the processes will be described in this
chapter and they are to a varying degree present in hospitalized patients.
Weight loss is the first visible sign of changing body composition, caused by loss of fat and
muscle mass (8, 10). In states of starvation or semi starvation, due to insufficient energy supply,
the body will reduce its physical and metabolic activity in order to promote energy balance (8,
11, 12). This will lead to muscle weakness and dysfunction, impaired immune reactions, with
increased risk of infection, in addition to reduced capacity of vital organs; heart, lungs,
gastrointestinal tract and skin (8, 9, 13). Inactivity will weaken the skeletal muscles causing
reduced muscle mass and strength in addition to downgrade protein synthesis (14). During
insufficient access of energy and nutrients the body will try to protect the loss of protein mass as
long as possible in order to maintain vital body functions (9). However, prolonged semi

4
starvation or starvation will eventually lead to decreased protein mass including those in vital
organs. The loss of protein mass will have multiple negative impacts (8, 9, 11, 14) and will affect
organ functions like;
• decrease heart volume, reduced cardiac output and increased risk of heart failure
• decreased lung volume/capacity and respiratory muscle strength, reduced breathing
capacity and increasing the risk of chest infections
• gastrointestinal mucosa atrophy increasing mucosa permeability, decreasing nutrient
absorption and allowing transit of undesired microorganisms, increasing the risk of
further nutrient deficiency and infection
• reduced skin thickness and skin capacity as barrier for migrating microorganisms
increasing the risk of infection and wounds
Metabolic stress and disease will additionally increase protein turnover, muscle breakdown and
decreased muscle mass (11).
In the last two decades, adipose tissue has been described as an endogenous organ (15). The
adipose tissue operates as an essential storage of various nutrients and a sensor for nutrient
availability in the body, regulating a large number of body functions (15). Faced with insufficient
supply of energy and nutrients, especially carbohydrates, adipose tissue will provide nutrients for
energy release through excreting hormones for processes like the gluconeogenesis in liver (15).
With a reduced amount of adipose tissue the adipocytes, energy storing fat cells, will signal for a
reduced metabolic activity and favor low energy consuming activity and downgrading the high
cost ones, including immune cell function and response (15). Adipose tissue will release the
peptide like pro-inflammatory hormone leptin. Leptin promotes inflammation by, for one,
activating pro-inflammatory cytokine production (15). Increase cytokine activity is related to
increased thermogenesis and fever, in addition to elevated muscle catabolism and reduced
muscle protein synthesis (14). Interestingly, the increased cytokine activity is also described in
obese people (BMI>30) by accumulation of pro inflammatory immune cells in the abdominal

5
adipose tissue, making obese patients to the same extent susceptible to disease and disease
related malnutrition (15).
1.1.3 Nutritional risk screening
Nutritional risk screening is a rapid and efficient method for detecting patients at risk of
malnutrition with the intention to predict a probable beneficial outcome of nutritional treatment
(16). Several screening tools are provided world-wide, but there is no consensus on a “gold
standard” (17). ESPEN provides guidelines for nutritional risk screening applicable to different
health care setting (18). The screening tools are validated (16, 18) and have been reported to be
sensitive for detecting patients at risk of malnutrition who can benefit from nutritional support in
a hospital, nursing home or home care setting (16, 18-22).
In line with the ESPEN Guidelines, The Norwegian Directorate of Health published in 2009 the
«National Guidelines for Prevention and Treatment of Malnutrition» (23). The national
guidelines recommend nutritional risk screening within 24 hours for all patients admitted to a
health care facility, using validated screening tools. NRS 2002 is recommended for hospital use,
Mini Nutritional Assessment (MNA) for elderly and in nursing homes and Malnutrition
Universal Screening Tool (MUST) in a community setting (23). The recommended nutritional
screening tools include four basic questions: Actual body mass index (BMI), recent weight loss,
recent food intake and disease, in an initial screening or a combination initial and final screening
(23).
ESPEN Guidelines has increased the attention regarding the importance of nutritional risk
screening and assessment (24). A survey among Scandinavian doctors and nurses by Mowé et al
(2006), found health professionals recognizing the importance of detecting and treating
malnutrition. Nevertheless, serious malpractice due to mainly lack of knowledge and defined
responsibility was found in all three countries (24).
The Norwegian National Guidelines for Prevention and Treatment of Malnutrition (2009) (23)
has significantly contributed to the enhanced attention of the severity of malnutrition and the

6
need for identification and targeted treatment, both at a national and local level. Despite this the
prevalence of malnutrition in different health care services is alarmingly high (25, 26). The
detections rate has increased, but it is still low (27-30). Resent research by Mowé et al found
improved nutritional screening and assessment practice in Swedish and Norwegian hospitals
(30). Available national guidelines and increased focus from health care authority is highlighted
(30). Increased focus has led to a rise in implementation of nutritional guidelines, increased
nutritional risk screening rates, assessment and patients receiving nutritional treatment (30).
Nevertheless proper and targeted treatment still is at alarmingly low levels (27, 28).
Nutritional risk screening has been reported to be time and resource consuming, thus often
resulting in it being downgraded in the regular routines (27-29, 31).
1.1.4 Prevalence and risk groups
Malnutrition has an undesirably high prevalence in hospitals world-wide. Although the negative
effects of malnutrition have been widely reported and national guidelines for preventing and
treating malnutrition are implemented, this condition still remains a low priority in most health
care settings (16, 23, 27, 32-34). The prevalence of malnutrition in hospitals, nursing homes and
homecare services varies, depending on patient groups studied and cut-off values determined.
Different nutritional screening tools are designed for different patient groups resulting in wide
span prevalence data for risk of malnutrition. Thus comparison of data might be challenging and
requires awareness (17). Despite this, this thesis will refer to a few international and Norwegian
prevalence data.
The Norwegian Directorate of Health estimates a 10-60 % prevalence of malnutrition in
Norwegian health care settings, including hospitals and nursing homes (23). European estimates
use 20-50% prevalence of malnutrition when referring to hospital patients (16, 23, 35). “The
German hospital study” by Pirlich et al. found a 27 % prevalence of malnutrition in a mixed
hospital population, according to the Subjective Global Assessment (SGA) screening tool (36).
Malnutrition figures varied between groups studies; 43 % for patients 70 years and older, 56 %

7
for geriatric patients, 38 % in the oncology wards and 33 % in the gastroenterology departments.
The main risk factors of malnutrition highlighted in this study were high age, comorbidity,
polypharmacy and malignant diseases.(36).
Recently published Norwegian data indicate a prevalence of 29 % in a mixed hospital population
using the NRS 2002 screening tool (25). The data describe the highest risk of malnutrition in the
department of intensive care (ICU) (74%), oncology (49 %) and pulmonary diseases (43 %).
Patients 80 years and older were identified with a 40 % risk of malnutrition and patients with
infections 51 % (25). Newly published Norwegian data considering malnutrition in a non-
demented elderly in-hospital population (age 70 years or older), found that 45 % were at risk of
malnutrition, according to NRS 2002, with a prevalence range of 20 – 65 % between the
different wards (26).
The above examples of European and Norwegian data indicate the frequency and severity of the
condition risk of malnutrition and the need for proper actions regarding detection and treatment.
All patient groups might be at risk of malnutrition. Particularly vulnerable population groups are
elderly, patients with dementia, patients living alone, handicapped, long term psychiatric
patients, patients with drug abuse, chronic illness like cancer, heart- and lung diseases and
arthritis (23), patient groups often associated with high age, comorbidity, increased need of
medication and malignant diseases.
1.1.5 Length of stay and health care costs
Risk of malnutrition and malnutrition are associated with a number of negative clinical issues
like; reduced immune response, poor wound healing, increased length of stay (LOS), increased
morbidity and mortality (8, 23, 32-34, 36-38). Considering the complex nature of malnutrition,
the condition will most likely result in increased hospitalization and recovery time (25, 34).
Tangvik et al described a 36 % increased LOS for hospitalized patients at risk of malnutrition
compared to patients not at risk (37). “The German hospital study” refer to a 43 % higher LOS
for malnourished patients versus patients not at risk (36). This is probably partially due to

8
impaired body functions when at risk of malnutrition (8) resulting in reduced immune response,
poor wound healing, decreased physical and mental function, morbidity and mortality (8, 23, 32,
33, 36-39).
The condition of malnutrition also represents a considerable cost for the local and national health
budgets, most likely responsible for a 24-60 % higher hospital cost compared to patients not at
risk of malnutrition (16, 23, 35). An increased LOS by 3,3 days for patients at risk of
malnutrition, as found by Tangvik et al, represent a considerable cost. The cost for an extra day
in a Norwegian hospital is roughly calculated to about NOK 40.000 (regjeringen.no). Extended
hospitalization for 3.3 days would sum up to an extra cost of NOK 132.000 for each patient.
Preventing and treating malnutrition could possibly represent an annual saving of 800 million
NOK on the national health care budget (40).

9
1.2 Pressure ulcer
1.2.1 Definition
Pressure ulcer (PU), also referred to as bedsores or decubitus ulcer, has been defined by the
National Pressure Ulcer Advisory Panel (NPUAP) and the European Pressure Ulcer Advisory
Panel (EPUAP) as “localized injury to the skin and/or underlying tissue usually over a bony
prominence, as a result of pressure or pressure in combination with shear” (41). PU is a wound
that most frequently develops on a bony area of the body. The most common areas are heels,
elbows, hips and areas of the lower back (41). PU classifications are presented in a four stage
scaling system, referred to as either “Grade”, “Category” or “Stage”. In this thesis “Stage” is
used to describe the PU categories, which defines the maximum depth of tissue involvement
from Stage I through IV (Figure 1).
Figure 1 Progression of Pressure Ulcer (NPUAP/EPUAP) (41)

10
The literature refer to both PU and HAPU (Hospital Acquired Pressure Ulcer) prevalence. HAPU
is defined as registered PU with on-set and development when in hospital, and not registered at
hospital admission (42). Thus skin examination at a given point in a point prevalence study can
be both a PU and a HAPU. Most frequently the literature refers to the prevalence of PU, but
some have investigated HAPU in particular, excluding patients with registered PU at hospital
admission (42, 43)
The condition of pressure ulcers causes pain, decreased quality of life and increased risk of
infections and morbidity, as well as increased LOS, both in hospital, nursing home and
rehabilitation settings (41, 44).
1.2.2 Prevalence and risk groups
Pressure ulcers represent a significant health problem for patients admitted hospitals or long-term
institutional care. The European Pressure Ulcer Advisory Panel (EPUAP) reported a PU
prevalence of 18 % (variation 8–23 %), based on data from a study of 6000 patients in 25
hospitals in five European countries (45). An often referred 30 years old study, by Allman et al.
(1986), found a 17 % PU prevalence and risk of PU (using the Norton risk assessment form),
with 5 % PU prevalence for hospitalized patients (46). A smaller, multicenter and cross-sectional
Brazilian study found prevalence of 17 % (47). Data from the United Kingdom, United States
and Canada identified PU prevalence between 5 and 32 %, while Japan and China report 1-3 %
prevalence for hospitalized patients (44, 48). There has been limited Norwegian data on PU
prevalence in hospitals. Older Norwegian pilot study data (1994) conducted in a university
hospital’s medical and surgical wards, refers to a PU prevalence of 4 % (49). Research presented
from another Norwegian university hospital reported a 7-14 % PU prevalence, during a time
span of four years (1998-2002) (50). The same university hospital reported a prevalence of 18 %
in 2009 (50) and recent data (2015) indicated a 14 % rate of HAPU, with the highest prevalence
in the intensive care units (42). The study suggested a decreased risk of HAPU when patients’
safety routines and PU prevention guidelines were implemented and monitored as recommended
by The Norwegian Patient Safety Program (42).

11
Comparing PU prevalence data from different countries might be challenging, partly due to
different patient populations, risk factors studied, use of differing PU assessment methods (45)
and cut-off values. Nevertheless, the importance of addressing PU risk and assessment at an
early stage, to prevent and minimize PU development during hospitalization, is emphasized (51).
Under normal conditions all patients are potentially at risk of developing PU. PU might develop
quickly, within a few hours (41, 50-52). Common risk factors have been identified as
immobility, friction and shear, moisture, incontinence, poor nutrition, perfusion, high age, skin
condition and altered level of consciousness (41, 47, 51, 52).
1.2.3 Risk screening and classification
“The Norwegian Patients Safety Program: In Safe Hands 24-7” (2014)(53) was published after a
two year Patient Safety Campaign (2011-1013). PU is one of the first eleven areas of priority.
The present national guidelines mirrors the NPUAP and EPAUP guidelines, which are
internationally accepted (41). The guidelines provide recommendation for risk assessment tools,
classification categories, propose preventive activities and treatment routines in addition to
provide educational programs. The Norwegian Patients Safety Program (53) emphasize PU risk
screening shortly after admission to all health care setting, maximum 8 hours (53). Validated risk
screening tool are recommended (53). Braden scale and Norton scale are the most commonly
used PU risk screening tools (51). Both risk screening tools include evaluation of:
• Reaction to stimuli/Mental condition
• Moisture/Incontinence
• Activity/Physical condition
• Mobility
In addition, the Braden includes nutritional evaluation of dietary intake (actual intake in
percentage of normal intake) (41).

12
The intention of PU risk assessment and classification is to detect patients at risk of developing
PU and classify the maximum depth of a present PU (41). These actions are to be followed by
proper preventive and treatment plans (41). National efforts aimed at reducing PU risk and
providing proper treatment do not yet seem to have resulted in significantly lower PU rates (42,
50). PU screening and risk assessment procedures are often not conducted as recommended,
which suggests that there still are issues to address to achieve optimal performance and patient
safety results (42, 50)Given the severity of PU progression and ensuing complications, it is
crucial with early detection and proper treatment to avoid the debilitating complications that
typically accompanies PU (41, 51, 52).
1.2.4 Length of stay and health care cost
Pressure ulcers (PU) make a significant independent contribution to excess length of
hospitalization (54). Allman et al. (1986) reported incidence of PU being significantly associated
with prolonged hospital stay. Patients in the risk of PU and PU groups had 3,5 and 5 times longer
hospitalization than patients without PU. The two groups were also associated with clinical
conditions including higher age, lower weight, malnutrition, fever, pneumonia, sepsis, anemia
and hypoalbuminemia (46). Fifteen years later Allman et al. describes that development of in-
hospital PU Stage II or more, resulted in a more than doubled amount of days in hospital (30 vs
13 days) and three times higher treatment costs (55).
A larger German study of elderly patients, 75 years and older, indicated an overall longer
hospital stay for PU patients compared to patients without PU (19 vs 10 days) (43). The study
included both patients with PU by admission and those who acquired PU during hospitalization.
The impact of HAPU on excess length of stay was more pronounced. In addition it was indicated
that bedside complication, co-morbidities, social factors and the hospital internal processes of
patients care, all were significant for HAPU and LOS (43).
A larger Australian study also reported 4 days increased LOS for patients developing PU when
hospitalized (54).

13
PU treatment is both invasive and costly, which has shown to have a considerable impact on
national healthcare budgets (44, 54-58). Treatment cost increases with PU severity. In the UK,
the calculated cost is estimated to GBP 1.064 for Stage I to GBP 10.551 for Stage IV (58). The
total national expense, conservatively measured, accounting for 4 % of the UK health care
budget, is estimated to GBP 1.2-1.4 billion annually (58). The Norwegian annual national health
care cost treating PU has been estimated at NOK 700 million in 2008 (50, 57). Norwegian
estimates derive from Helsetilsynet using Dutch estimates of PU treatment costs representing 1
% of the total health care budget (57).
1.3 Nutritional risk screening and pressure ulcer
Guidelines, recommendations and research emphasize the significance of poor nutritional status
for increased PU risk and development (8, 34, 41, 42, 44, 51). Malnutrition is recognized as one
of the major systemic risk factors for poor wound healing and developing PU (4, 8, 59).
Early PU and risk of malnutrition screening represent valuable routines for detecting patients at
risk and initiating proper treatment. Screening has been reported to be time and resource
consuming, which unfortunately often results in them being downgraded in regular routines (27,
44, 50, 58). Nevertheless a targeted identification of patients at risk of malnutrition would
probably be of utmost importance in addressing risk of development and presence of PU (41, 46,
60).

14
2. Aim Nutritional risk screening has been implemented at Lovisenberg Diaconal Hospital using the
NRS 2002 screening tool. The medical department has included NRS 2002 in their admission
procedures. The risk of malnutrition prevalence in the mixed hospital population at Lovisenberg
Diaconal Hospital has not earlier been studied.
The Norwegian Patients Safety Program emphasize PU risk screening shortly after admission to
all health care settings using validated risk screening tools. Skin examinations should be
classified according to NPUAP/EPUAP classification. The prevalence of PU for the mixed
hospital population at Lovisenberg Diaconal Hospital has not been studied earlier.
Sufficient nutritional status has shown to be crucial for proper wound healing. Malnutrition is
regarded as prominent risk factor for delayed healing of wounds and development of PU. The
possible association between risk of malnutrition and PU has not been studied at Lovisenberg
Diaconal Hospital. The value of using NRS 2002 nutritional screening tool in predicting PU in a
mixed hospital population has to our knowledge never been studies earlier.
The primary objective of this thesis, as part of the Safety in Hospital Study, is to describe the risk
of malnutrition and the presence of PU among in-hospital patients at Lovisenberg Diaconal
Hospital. The study population is regarded as a mixed hospital population.
The second objective was to examine whether the nutritional risk screening tool NRS 2002 could
predict PU in the study’s mixed hospital population.
15
3. Methods
3.1 Design and Setting
The data for this analysis were collected as part of a large cross-sectional study: Safety in
Hospital, conducted on 10 pre-selected screening days between September 2012 and May 2014.
The larger study aimed to assess patients’ risk for and prevalence of falls, pressure ulcers,
malnutrition, pain in addition to other symptoms and comorbidities. The hospital’s medical
department treats approximately 7800 patients per year, with pulmonary, cardiovascular, gastro-
intestinal and infectious diseases being the main disease groups for which medical patients are
treated. The orthopedic surgical department performs elective surgery and about 3000 surgical
inpatients are treated annually, including approximately 90 shoulder, 670 hip and 520 knee
arthroplasty replacements and 1700 minor orthopedic, ear/nose/throat and other general
operations.
3.2 Study population
All adult inpatients (≥18 years) admitted to one of the hospital’s medical or orthopedic surgical
wards by 7 AM on 10 pre-scheduled days (4 during the first project year and 6 during the
second) were asked to participate in the study. Patients admitted to Hospice or the intensive care
unit or who were cognitively impaired or unable to read Norwegian were not included. For
patients screened on more than one screening day, only data from the date they first consented
was included in the analysis. In Year 1 of the study (screening days 1-4), only patients who
consented to the study were screened and included in the analysis. However, in Year 2 of the
study (screening days 5-10), the hospital implemented routine screening as part of standard
clinical procedures, and thus, anonymous screenings of all patients were included in the analysis
as part of the hospital’s quality assurance register.
Data from excluded patients were used to compare differences between the included and
excluded groups regarding nutritional risk and abnormal skin exams. If missing data for the

16
variable examined, the patient’s data was not included in the actual comparison. Thus the NRS
2002 and PU comparisons are based on a varying amount of excluded patients.
3.3 Data collection
Second year nursing bachelor students and ward nurses trained in standardized screening, rigor
in research and research ethics conducted the initial NRS 2002 screening and performed the skin
examinations. Prior to each pre-schedules screening day the students and ward nurses were
tutored in the causes, risk factors, consequences of malnutrition and the importance of detecting
risk of malnutrition. Training in practical performance of the initial NRS 2002 screening and
information regarding proper treatment for patients at risk was given. A registered clinical
dietician was responsible for the tutoring and training.
Clinical experience and past evaluations from the nurse team, experiencing difficulties in
performing the final NRS 2002, the registered clinical dietician was made responsible for
conducting all final NRS 2002 screenings.
Specially trained nurses were responsible for PU risk screening and skin examination tutoring
and training for the students.
Data on age and sex were collected from the patients’ medical records. Height and weight were
obtained through the nutritional screening or from the medical record.
3.4 Measures
3.4.1 Nutritional risk screening
An adapted version of the NRS 2002 was used (Attachment 1: NRS 2002 for Lovisenberg
Diaconal Hospital - in Norwegian). In the adapted version the BMI cut-off is 20, where the
original uses 20.5. The NRS 2002 screening tool consists of two parts: Initial screening to be

17
performed on all patients and final screening to be performed when indicated by the initial
screening.
Initial screening
The initial screening consists the following four screening items:
• Is BMI< 20 kg/m2? Later referred to as BMI<20
• Has the patient lost weight within the last 3 months? Later referred to as Weight loss past
3 months
• Has the patient had a reduced dietary intake in the last week? Later referred to as Ate less
past week
• Is the patient severely ill (i.e. intensive care patient)? This item was not used in this
study, due to intensive care patients being excluded.
Each screening items is given an answer Yes or No by the patient, their family member or ward
nurse. If all questions are answered No, the patient is regarded as being at low risk of
malnutrition (Low Risk) and weekly re-screening is recommend. When one or more questions are
answered Yes, the patient is regarded as possible risk of malnutrition (Possible risk). All
screenings at Possible risk are referred to the registered clinical dietician for the final screening.
Final screening
The following factors are evaluated on a 0-3 scale, with 0 indicating “low risk” and 3 “high
risk”:
• nutritional status, based on initial screening data and
• severity of disease, based on disease related increased nutritional requirements.
A total score is determined by summing the two factor scores. Patients 70 years and older have
an additional point added to their total score. Patients with a total score of 3 or more (out of
maximum score of 7) are considered to be at risk of malnutrition.

18
When implementing the NRS 2002 at Lovisenberg Diaconal Hospital, BMI<20 kg/m2 was set as
the cut-off point, a general international consensus for underweight (2, 8, 61). Severity of disease
was scored as determined by NRS 2002. In addition minor elective orthopedic surgery was
assigned a severity disease score of 1 and major elective orthopedic surgery was assigned a score
of 2.
The screening process is illustrated by the following example: Patient admitted for an elective
shoulder operation, age less than 70 years, a BMI above 20, no weight loss the last three months,
but has eaten less the past week (10 %). The patient will be classified as Possible risk of
malnutrition because of a 10 % decreased food intake past week. When conducting the final
screening a food intake between 75-100 % of a normal portion is regarded as a normal variation
(16), given a nutritional score 0. A shoulder operation is regarded as minor elective surgery,
given the severity of disease score 1. The total NRS 2002 score will sum up to 1, and the patient
will be classified as Low risk of malnutrition, according to final NRS 2002.
3.4.2 Skin examinations
The results of all skin examinations were classified according to NPUAP/EPUAP classification
(41), which defines the maximum depth of tissue involvement from Stage I through IV (Figure
1). For the purpose of this study, all abnormal skin exams (Stage I-IV) were considered
indicative of PU.
3.4.3 Body mass index
Body mass index was calculated as the patient’s weight in kilograms divided by their squared
height in meter. Patients were weighted in the morning, to the nearest 0.1 kilogram, wearing thin
clothing, on either a digital portable scale (Soehnle – Melody 2.0) or a wheelchair scale (Vetek
TI-1200). All scales were calibrated prior to each screening day. A portable digital scale (Seca
Alpha – Model 770) was used as the “gold standard” for calibration.

19
Height was measured standing (Kawe height measure – 94112) or in a supine position on a flat
bed, read to the closest 0.5 cm and converted to meters. When height or weight could not be
measured and if the patients provided consent, the most recent values were obtained from the
patient’s medical record.
3.4.4 Socio-demographic characteristics
Data on age and sex were retrieved from the patients’ medical record or the quality assurance
register using the Qlikview softwear (Qlik Technologies, Inc., Radnor, PA).
3.4.5 Statistics
Completed screenings were scanned into a research database. SPSS version 22.0 (IBM Corp,
Armonk, NY) was used for all statistical analyses.
Descriptive statistics (n), frequencies (%) and means with standard deviations (SD), were used to
summarize sample characteristics. Analysis of variance (ANOVA) was used for group
comparison of continuous variables and the t-test for continuous variables between groups. The
chi-square (χ2) test was used for group comparison of categorical variables. Because of the small
sample size of abnormal skin exams the Fisher’s Exact test was used to calculate their
significance to different BMI categories when expected counts were below 5 in any cell. Logistic
regression was used to determine the unique relationships between initial and final screening and
abnormal skin exams, while controlling for the effects of demographics and other clinical
factors. Sex and age group were included in all multivariate models controlling for any influence
they may have.
Sensitivity and specificity was tested for the robustness of our results of the initial and the final
NRS 2002 screening predicting the presence of PU.
Sensitivity = At risk with PU / (At risk with PU + Low risk with PU) x 100

20
Specificity = Low risk without PU/(Low risk without PU + At risk without PU) x 100
A significance level of p<0.05 was used for all analyses.
3.6 Ethics
The study was approved by The Regional Ethical Committee for medical and health-related
research ethics (REK South-East) and the hospital management (Reference # 2012/980A). Study
participants provided written consent to the risk screening and the retrieval of routinely collected
clinical data from their medical records (Appendix 1). During the second year of the study (last 6
screening days), the hospital implemented routine risk screening as part of standard procedures
and anonymized data for patients who did not consent were available for analysis through the
hospital’s quality assurance register. REK South-East and the Oslo University Hospital
Ombudsman were notified and acknowledge use of the anonymized quality assurance data.

21
3.7 My contribution to the study
My involvement in the Safety in Hospital study lasted from spring 2012 to fall 2014. I was
involved in the planning, training, conduction of the study and data regarding nutritional
screening.
• Planning: Evaluating validated nutritional screening tools as a member of the
interdisciplinary team planning the study.
• Tutoring and training: Responsible the tutoring and training of second year nursing bachelor
students and nurses in standardized initial NRS 2002 screening before each pre-scheduled
screening day.
• Initial screening: Participating in the hospital wards on the screening days, coaching students
and nurses conducting the nutritional screening.
• Final screening: Conducted all the final screenings.
• Statistical analyses: Controlled the initial nutritional screening data. Recorded final
nutritional screening data. Statistical analyses were performed with help from the hospital’s
statistician.

22
4. Results
4.1 Sample characteristics
Of the 1082 patients in hospital on the 10 screening days, 843 were eligible for inclusion, 81 of
whom did not consent and 44 were unavailable due to early discharge, operation, or other
examination. Of the 718 patients included in the screenings, 67 were excluded due to incomplete
nutritional screening (n=16), missing BMI (n=18) or missing skin examination (n=33).The final
sample included 651 patients (77 % of the eligible patients), with complete nutritional screening
data and skin examinations (Figure 2).
Sample characteristics for the 651 included in the analyses are summarized in Table 1. A
comparison of the included and excluded patients indicated that the excluded patients were more
likely to be hospitalized on a medical ward (76 vs 55 %, p=0.001) and identified as Possible risk
by the initial NRS 2002 screening (70 vs 52 %, p=0.014) and as At risk by the final screening (59
vs 34 %, p=0.001). Excluded patients were also more than twice as likely as included patients to
have a PU (18 vs 8 %), but this difference was not statistically significant (p=0.108). There were
no age or gender differences between the excluded and included patients.

23
Figure 2. Flow Chart of Study Sample
4.2 Nutritional risk screening
Overall, 34 % of the patients (n=651) were found to be At risk, as determined by NRS 2002 final
screening (Table 2). The medical patients were more likely to be found At risk compared to the
elective orthopedic surgical patients, (44 vs 21 %, p<0.001) (Table 2). Patient age was unrelated
to initial NRS screening status, but was associated with risk of malnutrition as determined by the
final NRS 2002 screening. Figure 3 summarizes the results from the initial and the final
screening for medical and orthopedic surgical departments.
651 patients were included in the analysis
1082 inpatients hospitalized on 10 screening days
843 patients were eligible
• 194 were not eligible • 45 were screened previously
• 44 were unavailable • 81 did not consent (year 1 only)
718 patients were screened
• 33 were missing a skin exam • 34 had incomplete screening

24
Figure 3: Distribution Risk of Malnutrition in Medical and Surgical Departments Using NRS 2002 Initial and Final Screening
Total eligible participant
n=651
MEDICAL
n=358 (55 %)
Low Risk
n=135 (38 %)
SURGICAL
n= 293 (45 %)
Possible Risk
n=223 (62 %)
Low Risk n=177 (60 %)
Possible Risk
n=116 (40 %)
Total Low Risk n=232 (79 %)
Fin
al
scre
en
ing Low Risk
n=55 (47 %) At Risk
n=61 (53 %) At Risk
n=159 (71 %) Low Risk
n=64 (29 %)
Total At Risk n=61 (21 %)
Total At Risk n=159 (44 %)
Total Low Risk n=199 (56 %)
Init
ial
scre
en
ing
Total Low Risk n=431 (66 %)
Total At Risk n=220 (34 %)
Of total sample
n=651

25
4.2.1 Initial nutritional screening
Of the 651 patients who received the initial NRS screening, 48 % were found to be at low risk
for malnutrition. The remaining 52 % were identified as Possible risk, based on at least one
Yes response in the initial screening. The 339 patients at Possible risk were referred for the
final screening (Table 1). Patients identified as being at Possible risk were more likely to be
female, have BMI below 20, and be hospitalized in the medical department. Comparing
medical and elective orthopedic surgical patients, medical patients were more likely to be
found at Possible risk (62 vs 40 %, p=0.001). Women were more likely than men to be at
Possible risk (58 vs 46 %, p=0.002). By definition, 100 % of the patients with BMI <20 (12
%) were found to be at Possible risk, as were 45 % of patients with BMI ≥20. Age was
unrelated to risk of malnutrition based on the initial NRS 2002 screening.
Table 1. Sample Characteristics by Initial NRS 2002 Screening Status
Total Initial Nutritional Screening
(n=651) Low Risk
(n=312) Possible Riska (n=339)
Statistics
p-value
Sex, n (%) Male Female
310 (47.6) 341 (52.4)
168 (54.2) 144 (42.2)
142 (45.8) 197 (57.8)
χ
2(1)=9.31 0.002
Age, years Mean (SD) Range Category, n (%) <70 years ≥70 years
62.9 (17.3) 19 – 100 416 (63.9) 235 (36.1)
63.0 (15.6) 20 – 99 206 (49.5) 106 (45.1)
62.7 (18.7) 19 – 100 210 (50.5) 129 (54.9)
t(643)=0.22c χ
2(1)=1.17
0.824 0.279
Body mass index (BMI) Mean (SD) Range Category n (%) <18.5 18.5-19.9 ≥20
25.8 (5.5) 13.6 – 56.6 49 (7.5) 31 (4.8) 571 (87.7)
27.0 (4.6) 20.0 – 46.4 0 (0) 0 (0) 312 (54.6)
24.7 (6.0) 13.6 – 56.6 49 (100) 31 (100) 259 (45.4)
t(628)=5.46c χ
2(2)=83.9
<0.001 <0.001
Hospital department Surgical n (%) Medical n (%)
293 (45.0) 358 (55.0)
177 (60.4) 135 (37.7)
116 (39.6) 223 (62.3)
χ2(1)=33.3
<0.001
a Patients identified as having possible risk of malnutrition on initial screening were referred for final screening.
b Includes the 313 patients identified as low risk of malnutrition in the initial screening.
c Separate variance t-test with adjusted degrees of freedom due to unequal variances

26
4.2.2 Final nutritional screening
Of the 651 patients included in the final sample, 52 % (62 % of medical patients and 40 % of
surgical patients) were referred for the final screening (Table 2). Medical patients were more
likely than orthopedic surgical patients to be found At risk (44 vs 21 %, p<0.001). Women
were more likely than men to be found at risk of malnutrition (39 % vs 28 %, p=0.002). At
risk was determined for 98 % of the patients with BMI ˂20 and for 25 % with BMI ≥20. Final
screening did show a significant difference (p=0.001) related to age and risk of malnutrition.
For patients 70 years or older, 47 % were found to be At risk, while only 26 % of patients
younger than 70 years were found to be At risk.
Table 2. Sample Characteristics by Final NRS 2002 Screening Status
Total Final Nutritional Screening
(n=651)
Low Riskb (n=431)
At Risk (n=220)
Statistics p-value
Sex, n (%) Male Female
310 (47.6) 341 (52.4)
224 (72.3) 207 (60.7)
86 (27.7) 134 (39.3)
χ
2(1)=9.69 0.002
Age, years Mean (SD) Range Category, n (%) <70 years ≥70 years
62.9 (17.3) 19 – 100 416 (63.9) 235 (36.1)
61.1 (15.9) 19 – 99 307 (73.8) 124 (52.8)
66.3 (19.3) 20 – 100 109 (26.2) 111 (47.2)
t(375)=3.42c
χ
2(1)=29.7
0.001 <0.001
Body mass index (BMI) Mean (SD) Range Category n (%) <18.5 18.5-19.9 ≥20
25.8 (5.5) 13.6 – 56.6 49 (7.5) 31 (4.8) 571 (87.7)
27.2 (5.1) 19.6 – 56.6 0 (0) 2 (6.5) 429 (75.1)
22.9 (5.2) 13.6 – 38.2 49 (100) 29 (93.5) 142 (24.9)
t(649)=10.3 χ
2(2)=165.8
<0.001 <0.001
Hospital department Surgical n (%) Medical n (%)
293 (45.0) 358 (55.0)
232 (79.2) 199 (55.6)
61 (20.8) 159 (44.4)
χ2(1)=40.1 <0.001
a Patients identified as having possible risk of malnutrition on initial screening were referred for final screening.
b Includes the 313 patients identified as low risk of malnutrition in the initial screening.
c Separate variance t-test with adjusted degrees of freedom due to unequal variances

27
4.3 Skin examination
Normal skin condition was observed in 597 (92 %) patients, while 54 (8 %) had PU, using
EPUAP/NPUAP classification system (Figure 1). Stage I PU was found in 29 patients, while
Stage II was observed in 17, Stage III in 5 and Stage IV in 3 patients (Figure 4). As shown in
Table 3, factors associated with prevalence of PU included age ≥70 years (16 vs 4 %,
p<0.001), hospitalized in the medical department (12 vs 4 %, p<0.001) and BMI˂20 (20 vs 7
%, p<0.001), where patients with BMI below 18.5 had the highest prevalence of PU (27 %).
There was no significant gender difference regarding PU prevalence.
Figure 4: Total Number of Pressure Ulcer Classified as Stage I-IV
4.4 Associations risk of malnutrition and pressure ulcer
Patients identified as being at risk of malnutrition, either on the initial (Possible risk) or final
screening (At risk), were more likely to have PU (OR=2.58 and 2.55, respectively) than
patients at low risk. In addition, each of the three initial nutrition screening items was
significantly associated with the skin examination results, with BMI˂20 (p<0.001) and Ate
less past week (p=0.003) being the two strongest predictors of PU (Table 3). Patients with a
BMI˂20 had nearly three times higher prevalence of PU compared to patients with BMI≥20
0
5
10
15
20
25
30
35
Stage I Stage II Stage III Stage IV
Nu
mb
er
Actual pressure ulcer (n=54)

28
(20 vs 7 %, p˂0.001). Having eaten less the past week more than doubled the prevalence of
PU (13 vs 6 %, p<0.003), while weight loss the in past 3 months almost doubled PU
prevalence (12 vs 7 %, p=0.026).
As shown in Table 3, the initial NRS 2002 screening was more sensitive than the final NRS
2002 screening (78 vs 67 %), but less specific (50 vs 66 %), to the presence of PU.

29
Table 3. Skin Examination Results in Relation to Demographic, Clinical, and Nutritional
Factors
Skin Examination Total
(N=651) Normal (n=597) (91.7%)
PU Stage I-IV
(n=54) (8.3%)
Statistics p-value
Demographic Variables Sex, n (%) Male Female
310 (47.6) 341 (52.4)
284 (91.6) 313 (91.8)
26 (8.4) 28 (8.2)
χ
2(1)=0.01
0.935
Age, years Mean (SD) Range Category, n (%) <70 years ≥70 years
62.8 (17.4) 18 - 100
416 (63.9) 235 (36.1)
61.7 (17.2) 18 - 100
399 (95.9%) 198 (84.3)
75.2 (14.8)
30 - 99
17 (4.1) 37 (15.7)
t(650)=5.62 χ
2(1)=26.8
<0.001 <0.001
Clinical Variables Body mass index (BMI) Mean (SD) Range Category, n (%) <18.5 18.5-19.9 ≥20
25.5 (5.5)
13.6 – 56.6
49 (7.5) 31 (4.8)
571 (87.7)
25.7 (5.4)
14.0 – 56.6
36 (73.5) 28 (90.3) 533 (93.3)
23.9 (6.3)
13.6 – 42.7
13 (26.5) 3 (9.7) 38 (6.7)
t(59.5)=1.99
Fisher’s Exact=17.4
0.052a
<0.001
Hospital department, n (%) Surgical Medical
293 (45.0) 358 (55.0)
281 (95.9) 316 (88.3)
12 (4.1)
42 (11.7)
χ2(1)=12.4 <0.001
Nutritional Screening Initial screening, n (%)
Low risk of malnutrition Possible risk
312 (47.9) 339 (52.1)
300 (96.2) 297 (87.6)
12 (3.8)
42 (12.4)
χ2(1)=15.6
<0.001
Final screening, n (%) Low risk of malnutritionb At risk of malnutrition
431 (66.2) 220 (33.8)
413 (95.8) 184 (83.6)
18 (4.2)
36 (16.4)
χ2(1)=28.4
<0.001
Initial screening items, n (%) Body mass index (BMI) <20 ≥20 Weight loss past 3 months? Yes No Ate less past week? Yes No
81 (12.4) 570 (87.6)
191 (29.3)
460 (70.7)
240 (36.9) 411 (63.1)
65 (80.2) 532 (93.3)
168 (88.0) 429 (93.3)
210 (87.5) 387 (94.2)
16 (19.8) 38 (6.7)
23 (12.0) 31 (6.7)
30 (12.5) 24 (5.8)
χ
2(1)=16.0
χ2(1)=4.99
χ2(1)=8.84
<0.001 0.026 0.003
a Separate variance t-test with adjusted degrees of freedom due to unequal variances
b Includes the 312 patients identified as low risk of malnutrition in the initial screening

30
4.4.1 Multivariate models predicting pressure ulcer s
Multivariate models were used to evaluate the usefulness of the initial and final nutritional
screening for identifying patients with PU, while controlling for demographic and other
clinical characteristics. Given the differences between medical and orthopedic surgical
patients with respect to risk of malnutrition and PU prevalence, hospital department was also
included as a covariate. As shown in Table 4, risk of malnutrition as determined by the initial
screening was a significant predictor of PU (OR 2.58, CI:1.24-5.35) even after controlling for
sex, age, hospital department, and BMI. Similar findings were observed for the final
nutritional screening (OR 2.55, CI:1.27-5.13).
To determine which of the three initial NRS 2002 screening items were most useful for
determining PU risk when controlling for demographic and other clinical factors, they were
evaluated in two multivariate models (Table 5). Table 5 presents a multivariate analysis
predicting PU from initial screening items, BMI˂20, Ate less past week and Weight loss last 3
months In Model 1, all three initial screening items were included and both BMI<20 (OR
2.73, CI: 1.33-5.59) and Ate less past week (OR1.91 CI: 1.01-3.59) were significant predictors
of PU. Given the correlation between weight loss in the past 3 months and eating less in the
past week (r=.33, p<0.001), these items were combined into a composite item which was
included with BMI<20 in Model 2. Using this approach, it was determined that patients who
had eaten less the past week or had lost weight the past 3 months had significantly greater risk
of PU than patients who had neither (OR 2.75, CI:1.42-5.22 ), even when controlling for the
known risk factors of older age, hospitalization in the medical department and BMI<20. The
combined item was an even stronger predictor of PU than BMI<20.

31
Table 4. Multivariate Analysis Predicting Pressure Ulcer with Initial and Final NRS 2002
Screening (n=651)
Model Variables Odds Ratio 95% CI P Overall model 1 INITIAL NUTRITION SCREENING χ
2(6)=55.2, p<0.001
Covariates Male sex (ref: female) 1.36 0.73, 2.53 0.329 Age ≥70 (ref: <70) 4.54 2.438.49 <0.001 Medical patient (ref: surgical) 2.05 1.00, 4.18 0.050
BMI (ref: ≥20) <18.5 18.5-19.9
2.71 1.07
1.21, 6.11 0.29, 3.99
0.051 0.016 0.918
At risk of malnutrition based on initial screening (ref: low nutrition risk)
2.58 1.24, 5.35 0.011
2 FINAL NUTRITION SCREENING χ
2(6)=55.2, p<0.001
Covariates included in both models Male sex (ref: female) 1.347 0.72, 2.49 0.358 Age ≥70 (ref: <70) 3.93 2.09, 7.41 <0.001 Medical patient (ref: surgical) 2.067 1.00, 4.22 0.049
BMI (ref: ≥20) <18.5 18.5-19.9
2.30 0.94
0.99, 5.36 0.25, 3.55
0.132 0.053 0.923
At risk of malnutrition based on final screening (ref: low nutrition risk)
2.55 1.27, 5.13 0.008
Note: ref= reference group

32
Table 5. Multivariate Analysis Predicting Pressure Ulcer from Initial NRS 2002 Screening
Items (n=651)
Model
Variables Odds Ratio
95% CI P Overall model
1 ALL 3 INITIAL SCREENING ITEMS
Covariates
χ2(6)=50.5, p<0.001
Male sex (ref: female) 1.41 0.76, 2.62 0.276 Age ≥70 (ref: <70) 4.52 2.43, 8.41 <0.001 Medical patient (ref: surgical) 2.20 1.07, 4.50 0.032
Initial Nutrition Screening Items BMI<20 (ref: ≥20) 2.73 1.33, 5.59 0.006 Weight loss in last 3 months
(ref: no weight loss) 1.03 0.53, 2.00 0.933
Ate less in past week (ref: ate normally)
1.91 1.01, 3.59 0.046
2 COMBINED SCREENING ITEMS
Covariates χ
2(5)=55.7, p<0.001
Male sex (ref: female) 1.42 0.77, 2.65 0.263 Age ≥70 (ref: <70) 4.55 2.44, 8.50 <0.001 Medical patient (ref: surgical) 2.09 1.03, 4.26 0.042
Initial Nutrition Screening Items BMI<20 (ref: ≥20) 2.51 1.23, 5.12 0.011 Weight loss OR ate less (ref:
no weight loss and ate normally)
2.74 1.42, 5.33 0.003
Note: ref= reference group
33
5. Discussion To our knowledge this cross-sectional point prevalence study is the first to show that NRS
2002 predicts PU. The results revealed that both the initial and the final NRS 2002 screening
were significant predictors of PU. The initial screening was more sensitive than the final
screening in correctly identifying patients with actual PU. And the initial screening was less
specific to the presence of PU than the final screening by not rejecting patients with no actual
PU. Moreover the initial NRS 2002 screening did identify nearly half of all the patients as
being at low risk of PU, which allows PU preventive procedures to be focused on those who
most need them.
5.1 Nutritional risk screening
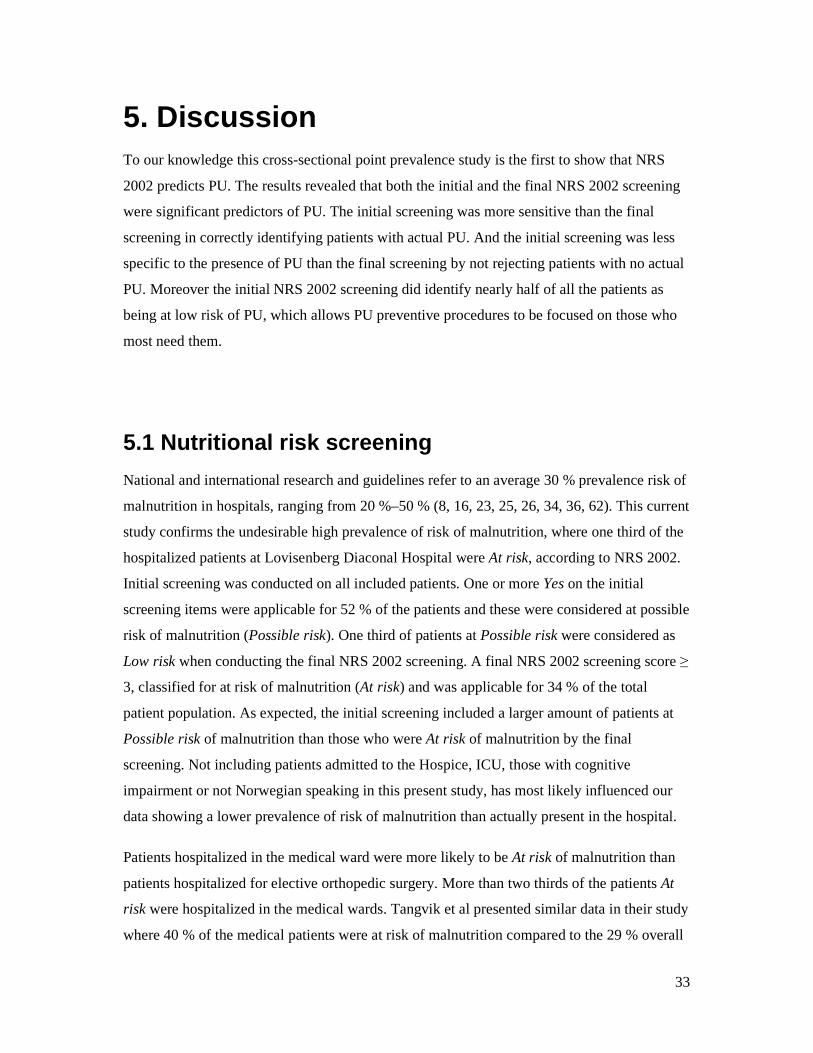
National and international research and guidelines refer to an average 30 % prevalence risk of
malnutrition in hospitals, ranging from 20 %–50 % (8, 16, 23, 25, 26, 34, 36, 62). This current
study confirms the undesirable high prevalence of risk of malnutrition, where one third of the
hospitalized patients at Lovisenberg Diaconal Hospital were At risk, according to NRS 2002.
Initial screening was conducted on all included patients. One or more Yes on the initial
screening items were applicable for 52 % of the patients and these were considered at possible
risk of malnutrition (Possible risk). One third of patients at Possible risk were considered as
Low risk when conducting the final NRS 2002 screening. A final NRS 2002 screening score ≥
3, classified for at risk of malnutrition (At risk) and was applicable for 34 % of the total
patient population. As expected, the initial screening included a larger amount of patients at
Possible risk of malnutrition than those who were At risk of malnutrition by the final
screening. Not including patients admitted to the Hospice, ICU, those with cognitive
impairment or not Norwegian speaking in this present study, has most likely influenced our
data showing a lower prevalence of risk of malnutrition than actually present in the hospital.
Patients hospitalized in the medical ward were more likely to be At risk of malnutrition than
patients hospitalized for elective orthopedic surgery. More than two thirds of the patients At
risk were hospitalized in the medical wards. Tangvik et al presented similar data in their study
where 40 % of the medical patients were at risk of malnutrition compared to the 29 % overall

34
risk (25). Patients hospitalized in the medical wards are often in an emergency situation
influenced by disease requiring acute medical treatment (8). The state of acute disease will
make a patient more vulnerable to nutritional impairment, metabolic stress and disease related
malnutrition compared to an elective admitted patient (33, 36). When admitted for elective
orthopedic surgery, the patients are likely to be less affected by acute illness, as shown by
their lower severity of disease and risk of malnutrition when screened. However, considering
the metabolic stress following surgery, a catabolic state prior to surgery will make elective
orthopedic surgery patient as vulnerable to impaired nutritional status and outcome (63).
Data from the present study showed that risk of malnutrition increases with age. Half of the
patients 70 years or older were found to be At risk, while one out of four patients younger
than 70 were At risk. New data from Tangvik and Eide confirmed this by showing increased
risk of malnutrition in the hospitalized elderly population (25, 26). Increased risk of
malnutrition in elderly has been described earlier (8, 32, 36, 64-66). Elderly are particularly
vulnerable to disease, metabolic stress and injury (7, 22, 66, 67). This is accounted for in the
final NRS 2002 screening by adding an extra point to the total NRS 2002 score for patients 70
years and older (16). Risk of malnutrition and malnutrition are associated with a number of
negative clinical conditions, which will have a negative impact on the patient’s recovery and
health status (8, 23, 32-34, 36-38). Early detection of risk of malnutrition for initiation of
proper treatment is particular important for the elderly as age is regarded as a risk factor for
malnutrition.
The current study revealed an unexpected high overall risk of malnutrition, even when not
including particularly vulnerable patient groups. This might be due to an increased threshold
for hospital admission and/or higher patient morbidity by admittance. From the hospital’s
quality assurance register it was possible to perform sub-analysis and compare the study
population to excluded groups of patients. The analysis showed excluded patients to be more
likely identified as At risk by the final NRS 2002 screening. This supports the assumption of
an actual higher risk of malnutrition prevalence than shown in the studied hospital population.
Data from the current study indicate that risk of malnutrition is common in medical and
elective orthopedic surgery wards, thus nutritional screening and assessment must be
performed for all patients admitted.
35
5.2 Skin examination
Skin examination was conducted for all eligible patients and abnormal skin examinations
classified according to EPUAP classification system. Following international and national
guidelines it was considered appropriate to regard all abnormal skin exams as PU Stage I-IV
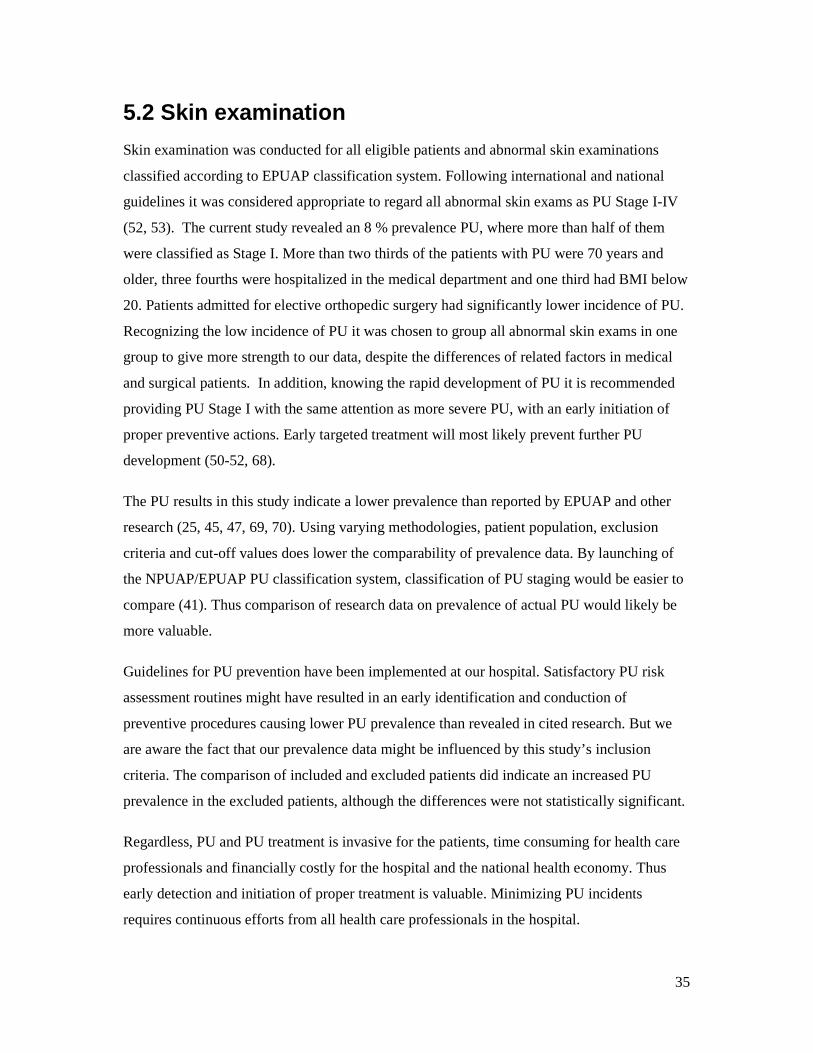
(52, 53). The current study revealed an 8 % prevalence PU, where more than half of them
were classified as Stage I. More than two thirds of the patients with PU were 70 years and
older, three fourths were hospitalized in the medical department and one third had BMI below
20. Patients admitted for elective orthopedic surgery had significantly lower incidence of PU.
Recognizing the low incidence of PU it was chosen to group all abnormal skin exams in one
group to give more strength to our data, despite the differences of related factors in medical
and surgical patients. In addition, knowing the rapid development of PU it is recommended
providing PU Stage I with the same attention as more severe PU, with an early initiation of
proper preventive actions. Early targeted treatment will most likely prevent further PU
development (50-52, 68).
The PU results in this study indicate a lower prevalence than reported by EPUAP and other
research (25, 45, 47, 69, 70). Using varying methodologies, patient population, exclusion
criteria and cut-off values does lower the comparability of prevalence data. By launching of
the NPUAP/EPUAP PU classification system, classification of PU staging would be easier to
compare (41). Thus comparison of research data on prevalence of actual PU would likely be
more valuable.
Guidelines for PU prevention have been implemented at our hospital. Satisfactory PU risk
assessment routines might have resulted in an early identification and conduction of
preventive procedures causing lower PU prevalence than revealed in cited research. But we
are aware the fact that our prevalence data might be influenced by this study’s inclusion
criteria. The comparison of included and excluded patients did indicate an increased PU
prevalence in the excluded patients, although the differences were not statistically significant.
Regardless, PU and PU treatment is invasive for the patients, time consuming for health care
professionals and financially costly for the hospital and the national health economy. Thus
early detection and initiation of proper treatment is valuable. Minimizing PU incidents
requires continuous efforts from all health care professionals in the hospital.

36
5.3 Nutritional risk screening predicting pressure ulcer
This study found an association between risk of malnutrition and presence of PU. It shows
that both the initial and the final NRS 2002 screening were significant predictors of PU, even
after controlling for age, sex, BMI and hospital department. When a patient is admitted to the
hospital it is likely that factors like age, sex and department are known. Thus adding
nutritional risk screening may be a useful indicator of PU beyond the already known risk
factors.
In the multivariate analysis of factors related to PU (Table 4, Model 1), the three initial NRS
2002 screening items are evaluated individually. BMI <20 and Ate less past week were
significant risk factors, but Weight loss past 3 months was not. The reason might be due to
multicollinearity amongst the initial screening items, which can result in reduced significance
when the correlated items are included in the same model. However, a combination of the
nutritional items, Weight loss past 3 months OR Ate less past week, (Table 5, Model 2) proved
useful for predicting PU (OR=2.7, CI 1.42,5.33), even after controlling for the effects of age
≥70 years, being a medical patients and having BMI <20. The initial nutritional screening
items will identify patients with possible risk of malnutrition despite a normal BMI. Given
this, the combination of decreased intake past week and/or weight loss the past 3 months
seems to be useful for identifying patients with increased risk of PU, due to possible risk of
malnutrition, regardless of the patient’s BMI and other known risk factors.
The fact that the initial NRS 2002 screening is useful for predicting PU suggests that
nutritional screening can contribute to the identification of patients at risk for future PU.
Although the final NRS 2002 screening was also predictive of PU, use of the initial screening
will allow for a less time and resource consuming screening procedure, resulting in more
rapid and targeted assessment and treatment.
The initial NRS 2002 screening was more sensitive, but less specific to the presence of PU
than the final NRS 2002 screening. The disadvantage of using the less specific initial NRS
2002 screening as an indicator of PU risk is that many of the patients identified as being at
risk will not develop PU. Nonetheless, given the negative impact of PU on both patients and
health care costs, it would likely be an acceptable trade-off to initiate PU preventive

37
procedures for some patients who may not need them than to fail to provide such preventive
measures to some of those who do.
The value of SGA, MNA, and MUST in predicting PU in elderly and hospital population has
been described recently (47). Malnourished patients (determined by SGA) had a higher
prevalence of PU. For older patients, with an average age of 85 years, MNA score >8 was
found to be more sensitive than SGA in predicting PU development. Using MUST in a
hospital setting, including older age, BMI<18,5, reduced food intake in the past week and
unintentional weight loss in the past 3 months were strongly related to manifestation of PU
(71).
A closer look at the individual initial NRS 2002 screening items might give guidance to their
value in predicting PU.
Patients with BMI ˂20 from the current study had a significantly higher incidence of PU
versus patients with BMI >20, OR 2.7. Low BMI was a consistently strong predictor of PU in
the current analyses. Our findings were similar to other studies where low BMI has been
reported to have a negative impact on a large number of health aspects (2). BMI ˂18.5 alone
is established by ESPEN guidelines as one diagnostic criterion for malnutrition (2). Using
NRS 2002, this criterion will place all patients with BMI ˂18.5 in the At risk group, as
determined by the final NRS 2002 screening. BMI ˂18.5 was also recently found to be a
strong predictor of PU (71). Therefore low BMI as a risk factor requires close attention in all
health care facilities.
Weight loss past 3 months applied to almost half the patients with PU. Recent weight loss
leaves the body in a catabolic stage, which has a negative impact on the healing process (72).
Disease related weight loss is common, as about 70% of hospitalized patients are discharged
with a lower body weight than at admission (8). Thus, health care professionals are strongly
encouraged to limit in-hospital weight loss due to its negative impact on health aspects such
as increased risk of poor healing, additional infections, malnutrition and longer hospitalization
(8). Weight loss is recommended for some obese patients, prior to elective orthopedic surgery.
With the purpose to reduce risk of poor wound healing and PU, it might be suggested to cease
weight loss before surgery to stimulate a preoperative anabolic stage (63).

38
Eating less past week was applicable to 60 % of patients with PU. This indicates that the
patients most likely were in a catabolic stage when screened, a common situation when
admitted to hospital. Decreased dietary intake has shown to be inversely related to patient’
recovery, both for medical and elective orthopedic surgery patients (8, 63) and should be
addressed for immediate proper nutritional care. A decrease in nutritional status will most
likely decrease the healing process and increase length of stay. Longer hospitalization due to
PU and/or malnutrition has an indisputable negative impact on the patient and ward
personnel, as well as local and national health care budgets (4, 36, 38, 47, 71).
National guidelines for screening of risk of malnutrition and PU in addition to clinical
assessment guidelines for targeted identification and treatment are provided for all health care
settings (23, 53). National efforts aimed at reducing risk of malnutrition and PU do not yet
seem to have resulted in a desirable improvement in prevalence of risk of malnutrition and PU
(27-29, 42, 50). However, resent research has shown promising improvement in nutritional
screening and assessment practice in Swedish and Norwegian hospitals (30). Available
national guidelines and increased focus from health care authority, have led to a rise in
implementation of nutritional guidelines, increased screening rates including assessment of
patients energy intake and needs, and patients receiving nutritional treatment (30) .
The Council of Europe (32) and The National Directorate of Health (23) has pointed out five
common issues that might delay implementation and execution of proper nutritional care and
support for hospitalized patients:
• lack of clearly defined responsibilities
• lack of sufficient education
• lack of influence of the patients
• lack of co-operation among all staff groups
• lack of involvement from the hospital management (32)
The above issues would most likely be applicable for ensuring proper hospital support for all
diseases, including PU care. Solving these barriers will require a collaborative effort of all
health care staff involved in the nutritional and PU care and support.

39
5.4 Study design and population
The Safety in Hospital Study is a cross-sectional point prevalence study. Knowing the
possibility of a single point prevalence not showing a representative patients population, the
point prevalence was repeated at 10 pre-scheduled days over a two years period. The study
design allowed nutritional screening and PU examination in a larger hospital population,
including medical and surgical patients. The analysis reflects the risk of malnutrition and
incidents of PU for 77 % of the eligible patients. In this thesis the aim was to describe the
prevalence of PU and risk of malnutrition for the hospital population at Lovisenberg Diaconal
Hospital, consisting of medical and elective orthopedic surgical patients.
The inclusion criteria allowed data from 651 patients to be analyzed. By excluding
cognitively impaired and non-Norwegian speaking patients, in addition to patients admitted to
ICU and Hospice, we recognize the effects this will have on our analysis. Taking this into
account, the results most likely refer to a healthier group of patients and should only be used
for generalizing in the included patient groups.
5.5 Data collection
Second year nursing bachelor student and ward nurses conducted the initial NRS 2002
screening and all skin examinations. Nutritional screening has not been included in the regular
bachelor nursing program as PU risk screening and skin examination have. The tutoring and
training prior to the screening days was considered as well-functioning and sufficient
educational program for students and nurses. Making the registered clinical dietician
responsible for all final screenings, was regarded as limiting sources of error providing a more
consistent assessment of screening result. Any misinterpretations would likely apply to all
screening.
The rating of inter-rater reliability (IRR) of NRS 2002 screening and PU classification was
not included in this present study. Considering the relatively large number of raters involved
it is possible that the reliability of our data has been affected. But the invariability of
supervising specially trained nurses and registered clinical dietician was considered to reduce
misinterpretations.

40
Kondrup et al do refer to a strong IRR between health care professionals conducting NRS
2002 screenings, indicating little disagreement on a patient’s risk of malnutrition status (16).
A Norwegian study found a good IRR between nurses and bachelor nursing students
conducting the initial NRS 2002 screening, but only fair IRR on the final screening. The need
of extensive training in order to achieve reliable screening results was indicated (73). The
latter could support our clinical experience and nurses’ response on the difficulties in
conducting the full NRS 2002 screening. Making ward personnel responsible for conducting
the initial screening while specially trained nurses perform the final screening might be
necessary in order to ensure satisfactory screening results.
Specially train nurses were responsible for the training in PU risk screening and assisted in
preforming all skin examinations. Kottner et al found a strong IRR for nurses classifying PU
stages, with somewhat higher disagreement on classifying Stage I PU (74). The European
Reliability Study by Beekman et al, found a low IRR for nurses classifying PU (75). A
stronger reliability was reported for specially trained nurses, indicating the need of creating
high quality educational programs on how to differentiate various PU stages (75).
Involving nursing bachelor students enabled the conduction of this larger cross-sectional point
prevalence study in the hospital, normally not feasible on a hectic hospital ward. The students
tutorial program and study participation, may have given them an improved awareness,
knowledge in research, research methods, the clinical aspects of malnutrition and PU in
addition to an overall better clinical practice (76, 77).
5.6 NRS 2002 screening and skin examination
Following national recommendations (23), the NRS 2002 was used in this study for
nutritional risk screening of all patients. The screening tool is validated (16, 18) and has
shown to be sensitive for detecting patients at risk of malnutrition who can benefit from
nutritional support in a hospital settings (16, 18-22).
When implementing NRS 2002 at Lovisenberg Diaconal Hospital, BMI <20 was chosen as
cut-off for risk of malnutrition, instead of BMI <20.5 (moderate degree of malnutrition) as in

41
the original version. In our analysis only 18 patients had a BMI between 20-20.49, where one
third were found to be at Low risk and two thirds at Possible risk of malnutrition in the initial
screening, thus referred for a final screening. In the final screening half of the patients with
BMI 20-20.49 were found to be at Low risk and half At risk of malnutrition. These results do
not seem to have a misleading impact on our final analysis.
To our knowledge the original BMI<20.5 was based on a trial of the positive physiological
effects of nutritional support and steroids to patients with chronic obstructive pulmonary
disease using BMI <90 % of normal (⸗ BMI<20.5) as an inclusion criterion (18, 78). The
ESPEN expert group considered other studies showing positive effects of nutritional support
for patients with moderate degree of malnutrition and mild degree of severity of disease (18).
For this reason the BMI < 20.5 cut-off was chosen in the original NRS 2002.
NRS 2002 screening tool was never intended to be used for classification of nutritional status,
but designed to identify patients at nutritional risk who could benefit from nutritional
treatment (16, 18). Using a wide range screening tool, including only the initial screening
items, the risk of diagnosing more patients at risk of malnutrition than those at actual risk has
to be considered. Nevertheless, misclassification of hospital patients for being at risk of
malnutrition when not would be of less concern than not identifying the patients that are at
risk.
Skin examination of actual PU using the EPUAP classification system will most likely to a
less extent allow individual interpretation of PU categories and give room for
misclassification. However research has shown that classification of nonblanchable erythema,
Stage I PU, often is misclassified, especially on the heal area, (79-81). To distinguish a blister
from a nonblanchable erythema has proven to be the most challenging compared to
classification of Stage II-IV PU (79, 81). Knowing the importance of an accurate
identification of Stage I PU in preventing further PU development, proper educational
programs and repeated tutoring and training of ward staff seems to be crucial (77, 79, 81).

42
6. Conclusion This current study confirms that risk of malnutrition and PU still are common in a Norwegian
hospital setting. In addition it suggests the significance of nutritional risk screening, using the
NRS 2002, in predicting the presence of PU for medical and elective orthopedic surgical
patients. The prevalence of PU was lower and risk of malnutrition higher than expected prior
to the study. Both the initial and the final NRS 2002 screening were significant predictors of
PU. The initial NRS 2002 screening items proved to significantly predict PU, with BMI<20
and Ate less past week being the two strongest predictors. However, a combination of Ate less
past week OR Weight loss past 3 months was strongly associated with PU results.
Because of the significance of the initial NRS 2002 screening in predicting PU it might be
considered adequate for detecting patients at risk of malnutrition and PU. The initial screening
is thought easier, less time consuming and rapid. Futhermore, it enables more efficient
screening routines which could promote optimal implementation, execution and satisfactory
patient safety results.

43
7. Future Perspectives Malnutrition and PU represent a significant health problem for patients admitted to hospitals.
National guidelines point out the importance of risk screening, assessment and initiation of
targeted treatment in order to prevent development of malnutrition and PU.
In the current study national guidelines were followed screening patients for risk of
malnutrition and classification of PU. The analysis identified the predictive value of NRS
2002 in predicting actual PU in our hospital population. This study suggests that the initial
NRS 2002 screening items can be useful for an early detection of patients at risk for
malnutrition and PU.
The importance of risk of malnutrition and PU screening, risk assessment and preventive
procedures still need to have excessive priority for proper reinforcement in the hospital. A
regular audit using the actual study design, could encourage the continuous quality assurance
efforts needed.
At present, there is no standardized method for collecting nutrition screening data in
Norwegian hospitals. This hampers implementation and use of national screening guidelines.
In the future, electronic availability of validated screening tools will enable nutritional
screening to be conducted and documented as determined by The Norwegian Directorate of
Health (23), thus enabling national data collection.
By January 2016 The Norwegian Directorate of Health introduced nutritional variables in the
national statistics of health and human services through IPLOS (Individbasert pleie- og
omsorgsstatistikk), implementing electronic registration of the variables. Electronic data
collection will enable national statistics on nutrition related measures; nutritional screening
variables, the amounts patients at risk of malnutrition, documentation of initiated targeted
nutritional treatment and treatment evaluation. Publication of the first national data will be
available 2017. As of today the IPLOS registry only applies for the national community
health services (nursing homes and homecare services). However, it is a valuable tool that
should be considered for national electronic hospital data collection. In the meantime,
simplifying screening routines will most likely be helpful for increasing screening rates and
identification of hospitalized patients at risk of malnutrition and PU.

44
Further research aimed at rapid identification and targeted treatment for best patient outcome
will be of significance and beneficial for patients, health care services and national health care
economy.
Lovisenberg Diaconal Hospital has made an effort to simplify screening for risk of
malnutrition, risk of PU and risk of falls, by including crucial screening items from each
screening tool into one screening tool. This is made available in the electronic medical record.
The initial NRS 2002 screening items, Is the BMI<20 kg/m2 ?, Has the patient lost weight
within the last 3 months? and Has the patient had a reduced dietary intake in the last week?
are included. Future research using this simplified screening tool, studying the effect on
screening rates and identification of patients at risk will be needed.
The significance of rapid risk identification for targeted initiation of treatment and patient
outcome has not yet been studied at Lovisenberg Diaconal Hospital. Research aiming at this
will be valuable to ensure patient safety in hospital.
Do the best
You can until
You know better.
Then, when
You know better
Do better.
Maya Angelou

45
8.References 1. White JV, Guenter P, Jensen G, Malone A, Schofield M. Consensus Statement of the Academy
of Nutrition and Dietetics/American Society for Parenteral and Enteral Nutrition:
Characteristics Recommended for the Identification and Documentation of Adult
Malnutrition (Undernutrition). Journal of the Academy of Nutrition and Dietetics.
2012;112(5):730-8.
2. Cederholm T, Bosaeus I, Barazzoni R, Bauer J, Van Gossum A, Klek S, et al. Diagnostic criteria
for malnutrition - An ESPEN Consensus Statement. Clin Nutr. 2015;34(3):335-40.
3. Jensen GL, Mirtallo J, Compher C, Dhaliwal R, Forbes A, Figueredo Grijalba R, et al. Adult
starvation and disease-related malnutrition: A proposal for etiology-based diagnosis in the
clinical practice setting from the international consensus guideline committee. Journal of Parenteral and Enteral Nutrition. 2010;34(2):156-9.
4. Litchford MD, Dorner B, Posthauer ME. Malnutrition as a Precursor of Pressure Ulcers.
Advances in wound care. 2014;3(1):54-63.
5. Muscaritoli M, Anker SD, Argilés J, Aversa Z, Bauer JM, Biolo G, et al. Consensus definition of
sarcopenia, cachexia and pre-cachexia: Joint document elaborated by Special Interest Groups
(SIG) “cachexia-anorexia in chronic wasting diseases” and “nutrition in geriatrics”. Clinical
Nutrition. 2010;29(2):154-9.
6. Cruz-Jentoft AJ, Baeyens JP, Bauer J, uuml, rgen M, Boirie Y, et al. Sarcopenia: European
consensus on definition and diagnosis. Age and Ageing. 2010;39(4):412-23.
7. Fried LP, Tangen CM, Walston J, Newman AB, Hirsch C, Gottdiener J, et al. Frailty in older adults: evidence for a phenotype. The journals of gerontology Series A, Biological sciences
and medical sciences. 2001;56(3):M146.
8. Stratton RJ, Green CJ, Elia M. Disease-related malnutrition : an evidence-based approach to
treatment. Wallingford: CABI; 2003.
9. Gandy J, British Dietetic A. Manual of dietetic practice. 5th ed. ed. Chichester: Wiley
Blackwell; 2014.
10. Muller MJ, Enderle J, Pourhassan M, Braun W, Eggeling B, Lagerpusch M, et al. Metabolic
adaptation to caloric restriction and subsequent refeeding: the Minnesota Starvation
Experiment revisited. Am J Clin Nutr. 2015;102(4):807-19.
11. Weijs PJ, Cynober L, DeLegge M, Kreymann G, Wernerman J, Wolfe RR. Proteins and amino acids are fundamental to optimal nutrition support in critically ill patients. Critical care
(London, England). 2014;18(6):591.
12. Müller MJ, Enderle J, Pourhassan M, Braun W, Eggeling B, Lagerpusch M, et al. Metabolic
adaptation to caloric restriction and subsequent refeeding: the Minnesota Starvation
Experiment revisited. The American journal of clinical nutrition. 2015;102(4):807.
13. Soeters PB, Schols AMWJ. Advances in understanding and assessing malnutrition. Current
opinion in clinical nutrition and metabolic care. 2009;12(5):487.
14. Jeejeebhoy K. Malnutrition, fatigue, frailty, vulnerability, sarcopenia and cachexia: overlap of
clinical features. Curr Opin Clin Nutr Metab Care2012. p. 213-9. 15. Wensveen F, Valentic S, Sestan M, Wensveen T, Polic B. Interactions between adipose tissue
and the immune system in health and malnutrition. Semin Immunol2015. p. 322-33.
16. Kondrup J, Allison SP, Elia M, Vellas B, Plauth M. ESPEN Guidelines for Nutrition Screening
2002. Clinical Nutrition. 2003;22(4):415-21.
17. van Bokhorst-de van der Schueren MA, Guaitoli PR, Jansma EP, de Vet HC. Nutrition
screening tools: does one size fit all? A systematic review of screening tools for the hospital
setting. Clin Nutr. 2014;33(1):39-58.

46
18. Kondrup J, Rasmussen HH, Hamberg O, Stanga Z, Ad Hoc EWG. Nutritional risk screening (
NRS 2002): a new method based on an analysis of controlled clinical trials. Clin Nutr.
2003;22(3):321-36.
19. Elia M, Zellipour L, Stratton RJ. To screen or not to screen for adult malnutrition? Clinical
Nutrition. 2005;24(6):867-84.
20. Kyle UG, Kossovsky MP, Karsegard VL, Pichard C. Comparison of tools for nutritional
assessment and screening at hospital admission: a population study. Clin Nutr.
2006;25(3):409-17.
21. Raslan M, Gonzalez MC, Gonçalves Dias MC, Nascimento M, Castro M, Marques P, et al.
Comparison of nutritional risk screening tools for predicting clinical outcomes in hospitalized
patients. Nutrition. 2010;26(7):721-6.
22. Ozkalkanli M, Ozkalkanli D, Katircioglu K, Savaci S. Comparison of Tools for Nutrition
Assessment and Screening for Predicting the Development of Complications in Orthopedic
Surgery. Nutr Clin Pract. 2009;24(2):274-80.
23. Guttormsen AB, Helsedirektoratet Avdeling e. Nasjonale faglige retningslinjer for forebygging
og behandling av underernæring. Oslo: Helsedirektoratet, Avdeling ernæring; 2009.
24. Mowe M, Bosaeus I, Rasmussen HH, Kondrup J, Unosson M, Irtun Ø. Nutritional routines and
attitudes among doctors and nurses in Scandinavia: A questionnaire based survey. Clinical
Nutrition. 2006;25(3):524-32.
25. Tangvik RJ, Tell GS, Guttormsen AB, Eisman JA, Henriksen A, Nilsen RM, et al. Nutritional risk
profile in a university hospital population. Clin Nutr. 2014.
26. Eide HK, Benth JS, Sortland K, Halvorsen K, Almendingen K. Prevalence of nutritional risk in the non-demented hospitalised elderly: a cross-sectional study from Norway using stratified
sampling. Helene Kjøllesdal Eide (2015) Nutritional risk and care in elderly hospitalized
patients Doctoral thesis http://urnnbno/URN:NBN:no-51715. 2015.
27. Eide HK. Nutritional risk and care in elderly hospitalized patients: A mixed methods research
approach. 2015.
28. Tangvik RJ, Guttormsen AB, Tell GS, Ranhoff AH. Implementation of nutritional guidelines in a
university hospital monitored by repeated point prevalence surveys. Eur J Clin Nutr.
2012;66(3):388-93.
29. Juul H, Frich JC. Screening for undernutrition in hospitals. What hinders and promotes nurses’ use of a screening tool for nutritional risk? Kartlegging av underernaering i sykehus - Hva
hemmer og fremmer sykepleieres bruk av screeningverktöy for identifisering av
ernaeringsmessig risiko? 2013;3(2).
30. Mowé M. HOSPITAL NUTRITION: IMPROVED ROUTINES AND PRACTICE IN NORWAY AND
SWEDEN 10 YEARS AFTER. ESPEN poster 2015.31. Geiker NRW, Hørup Larsen SM,
Stender S, Astrup A. Poor performance of mandatory nutritional screening of in-hospital
patients. Clinical Nutrition.31(6):862-7.
32. Beck AM, Balkn UN, FÜRst P, Hasunen K, Jones L, Keller U, et al. Food and nutritional care in
hospitals: how to prevent undernutrition–report and guidelines from the Council of Europe. Clinical Nutrition. 2001;20(5):455-60.
33. Ray S, Laur C, Golubic R. Malnutrition in healthcare institutions: A review of the prevalence of
under-nutrition in hospitals and care homes since 1994 in England. Clinical Nutrition.
2013;33(5):829-35.
34. Correia MI, Hegazi RA, Higashiguchi T, Michel JP, Reddy BR, Tappenden KA, et al. Evidence-
based recommendations for addressing malnutrition in health care: an updated strategy
from the feedM.E. Global Study Group. Journal of the American Medical Directors
Association. 2014;15(8):544-50.
35. Rasmussen HH, Holst M, Kondrup J. Measuring nutritional risk in hospitals. Clin Epidemiol.
2010;2:209-16.

47
36. Pirlich M, Schutz T, Norman K, Gastell S, Lubke HJ, Bischoff SC, et al. The German hospital
malnutrition study. Clin Nutr. 2006;25(4):563-72.
37. Tangvik RJ, Tell GS, Eisman JA, Guttormsen AB, Henriksen A, Nilsen RM, et al. The nutritional
strategy: four questions predict morbidity, mortality and health care costs. Clin Nutr.
2014;33(4):634-41.
38. Lim SL, Ong KCB, Chan YH, Loke WC, Ferguson M, Daniels L. Malnutrition and its impact on
cost of hospitalization, length of stay, readmission and 3-year mortality. Clinical Nutrition.
2011;31(3):345-50.
39. Hiesmayr M, Schindler K, Pernicka E, Schuh C, Schoeniger-Hekele A, Bauer P, et al. Decreased
food intake is a risk factor for mortality in hospitalised patients: The NutritionDay survey
2006. Clinical Nutrition.28(5):484-91.
40. Hanne J. Forebygging og behandling av underernæring Potensial for kostnadsbesparelser?
2010.
41. European Pressure Ulcer Advisory P. Prevention and treatment of pressure ulcers : clinical
practice guideline. Washington, DC: National Pressure Ulcer Advisory Panel; 2009.
42. Bredesen IM, Bjøro K, Gunningberg L, Hofoss D. Patient and organisational variables
associated with pressure ulcer prevalence in hospital settings: A multilevel analysis. BMJ
Open. 2015;5(8).
43. Theisen S, Drabik A, Stock S. Pressure ulcers in older hospitalised patients and its impact on
length of stay: a retrospective observational study. Journal of clinical nursing. 2012;21(3-
4):380-7.
44. Hisashige A, Ohura T. Cost-effectiveness of nutritional intervention on healing of pressure ulcers. Clinical Nutrition. 2012;31(6):868-74.
45. Vanderwee K, Clark M, Dealey C, Gunningberg L, Defloor T. Pressure ulcer prevalence in
Europe: a pilot study. Journal of Evaluation in Clinical Practice. 2007;13(2):227-35.
46. Allman RM. Pressure Sores Amond Hospitalized Patients. Annals of Internal Medicine.
1986;105:337-42.
47. Brito PA, de Vasconcelos Generoso S, Correia MI. Prevalence of pressure ulcers in hospitals in
Brazil and association with nutritional status--a multicenter, cross-sectional study. Nutrition.
2013;29(4):646-9.
48. Jiang Q, Li, X., Qu, X., Liu, Y., Zhang, L., Su, C., … Wang, J. . The incidence, risk factors and characteristics of pressure ulcers in hospitalized patients in China. International Journal of
Clinical and Experimental Pathology,. 2014;7(5):2587–94.
49. Enehaug IH HJ. Quality assurance--study of the prevalence of pressure sores in Haukeland
Hospital, Bergen, Norway. Vård i Norden 1994;14(1):21-3.
50. Bjøro K, Ribu L. Pilotstudie av trykksårprevalens i et norsk sykehus. Sykepleien forskning.
2009.
51. Berlowitz DR. Prevention of pressure ulcers. UpToDate. 2014.
52. Stechmiller JK, Cowan L, Whitney JD, Phillips L, Aslam R, Barbul A, et al. Guidelines for the
prevention of pressure ulcers. Wound Repair and Regeneration. 2008;16(2):151-68.
53. http://www.pasientsikkerhetsprogrammet.no/no/I+trygge+hender/In+English TNPSPISH, Trykksår. PITHFa. Forebygging av trykksår. April 2015 ed2015.
54. Graves N, Birrell F, Whitby M. Effect of pressure ulcers on length of hospital stay. Infection
control and hospital epidemiology. 2005;26(3):293-7.
55. Allman RM, Goode PS, Burst N, Bartolucci AA, Thomas DR. Pressure Ulcers, Hospital
Complications, and Disease Severity: Impact on Hospital Costs and Length of Stay. Advances
in Skin & Wound Care. 1999;12(1):22-30.
56. Silva AJ, Pereira SM, Rodrigues A, Rocha AP, Varela J, Gomes LM, et al. [Economic cost of
treating pressure ulcers: a theoretical approach]. Revista da Escola de Enfermagem da U S P.
2013;47(4):971-6.

48
57. Severens JL, Habraken JM, Duivenvoorden S, Frederiks CM. The cost of illness of pressure
ulcers in The Netherlands. Adv Skin Wound Care. 2002;15(2):72-7.
58. Bennett G, Dealey C, Posnett J. The cost of pressure ulcers in the UK. Age Ageing.
2004;33(3):230-5.
59. Roberts S, Chaboyer W, Leveritt M, Banks M, Desbrow B. Nutritional intakes of patients at
risk of pressure ulcers in the clinical setting. Nutrition. 2014;30(7-8):841-6.
60. Posthauer ME, Banks M, Dorner B, Schols JM. The role of nutrition for pressure ulcer
management: national pressure ulcer advisory panel, European pressure ulcer advisory
panel, and pan pacific pressure injury alliance white paper. Adv Skin Wound Care.
2015;28(4):175-88; quiz 89-90.
61. Mueller C, Compher C, Ellen DM. A.S.P.E.N. Clinical Guidelines Nutrition Screening,
Assessment, and Intervention in Adults. J Parenter Enter Nutr. 2011;35(1):16-24.
62. Vanderwee K, Clays E, Bocquaert I, Gobert M, Folens B, Defloor T. Malnutrition and
associated factors in elderly hospital patients: a Belgian cross-sectional, multi-centre study.
CLINICAL NUTRITION. 2010.
63. Lui M, Jones CA, Westby MD. Effect of non-surgical, non-pharmacological weight loss
interventions in patients who are obese prior to hip and knee arthroplasty surgery: a rapid
review.(Research)(Clinical report). Systematic Reviews. 2015;4:121.
64. Drescher T, Singler K, Ulrich A, Koller M, Keller U, Christ-Crain M, et al. Comparison of two
malnutrition risk screening methods (MNA and NRS 2002) and their association with markers
of protein malnutrition in geriatric hospitalized patients. Eur J Clin Nutr. 2010;64(8):887-93.
65. Holst M, Yifter-Lindgren E, Surowiak M, Nielsen K, Mowe M, Carlsson M, et al. Nutritional screening and risk factors in elderly hospitalized patients: association to clinical outcome?
Scand J Caring Sci. 2013;27(4):953-61.
66. Persson MD, Brismar KE, Katzarski KS, Nordenström J, Cederholm TE. Nutritional Status Using
Mini Nutritional Assessment and Subjective Global Assessment Predict Mortality in Geriatric
Patients. Journal of the American Geriatrics Society. 2002;50(12):1996-2002.
67. Martins CP, Correia JR, do Amaral TF. Undernutrition risk screening and length of stay of
hospitalized elderly. J Nutr Elder. 2005;25(2):5-21.
68. Banks M, Graves N, Bauer J, Ash S, Banks M. Cost effectiveness of nutrition support in the
prevention of pressure ulcer in hospitals. European Journal of Clinical Nutrition. 2013;67(1):42-6.
69. Bjøro K. Pilotstudie av trykksårprevalens i et norsk sykehus.
70. Hengstermann S, Fischer A, Steinhagen-Thiessen E, Schulz RJ. Nutrition status and pressure
ulcer: what we need for nutrition screening. JPEN J Parenter Enteral Nutr. 2007;31(4):288-94.
71. Tsaousi G, Stavrou G, Ioannidis A, Salonikidis S, Kotzampassi K. Pressure ulcers and
malnutrition: results from a snapshot sampling in a university hospital. Medical principles and
practice : international journal of the Kuwait University, Health Science Centre.
2015;24(1):11-6.
72. Molnar JA, Underdown MJ, Clark WA. Nutrition and Chronic Wounds. Advances in wound
care. 2014:140822074829003. 73. Ribu L, Trollebø E, Alstad E, Bratlie S, Husby GH, Landfald G, et al. Er det samsvar i
registreringene når sykepleiere og studenter screener pasienter for ernæringsstatus?
Sykepleien Forskning. 2010;5(2):120-8.
74. Kottner J, Halfens R, Dassen T. An interrater reliability study of the assessment of pressure
ulcer risk using the Braden scale and the classification of pressure ulcers in a home care
setting. International journal of nursing studies. 2009;46(10):1307-12.
75. Beeckman D, Schoonhoven L, Fletcher J, Furtado K, Gunningberg L, Heyman H, et al. EPUAP
classification system for pressure ulcers: European reliability study. Journal of Advanced
Nursing. 2007;60(6):682-91.

49
76. Westergren A, Edfors E, Hedin G, Hagell P. Improving nursing students research knowledge
through participation in a study about nutrition, its associated factors and assessment.
Journal of Nursing Education and Practice. 2013;3(8):50-8.
77. Kottner J, Halfens R, Dassen T. An interrater reliability study of the assessment of pressure
ulcer risk using the Braden scale and the classification of pressure ulcers in a home care
setting. International journal of nursing studies. 2009;46(10):1307-12.
78. Schols AM, Soeters PB, Mostert R, Pluymers RJ, Wouters EF. Physiologic effects of nutritional
support and anabolic steroids in patients with chronic obstructive pulmonary disease. A
placebo-controlled randomized trial. American journal of respiratory and critical care
medicine. 1995;152(4 Pt 1):1268.
79. Vanderwee K, Grypdonck MHF, De Bacquer D, Defloor T. The reliability of two observation
methods of nonblanchable erythema, Grade 1 pressure ulcer. Applied Nursing Research.
2006;19(3):156-62.
80. Bååth C, Hall-lord Ml, Idvall E, Wiberg-hedman K, Wilde Larsson B. Interrater reliability using
Modified Norton Scale, Pressure Ulcer Card, Short Form-Mini Nutritional Assessment by
registered and enrolled nurses in clinical practice. Journal of clinical nursing. 2008;17(5):618-
26.
81. Defloor T, Schoonhoven L. Inter-rater reliability of the EPUAP pressure ulcer classification
system using photographs. Journal of clinical nursing. 2004;13(8):952-9.

50
Appendix Appendix 1: Letter of Consent
Appendix 2: NRS 2002, initial screening in Norwegian
51
Forespørsel om deltakelse i forskningsprosjektet
Symptomer, samsykdommer og risiko hos pasienter innlagt på sykehus
Bakgrunn og hensikt
Dette er en forespørsel til deg om å delta i en forskningsstudie for å undersøke forekomsten av
symptomer og risiko for fall, trykksår og underernæring hos pasienter som er innlagt på sykehus og i
hvilken grad dette har sammenheng med samsykdommer og symptomer. Deltakelse er frivillig.
Lovisenberg Diakonale Sykehus er ansvarlige for gjennomføringen av studien. For å få et så riktig
bilde av situasjonen som mulig er det viktig at også de som ikke har symptomer eller risiko deltar.
Hva innebærer studien?
Du blir bedt om å fylle ut et kort spørreskjema. I tillegg vil du bli intervjuet av sykepleierstudenter og
ansatte om temaene smerter, fall, trykksår og ernæringsstatus, samt faktorer som er relatert til deres
forekomst. Det vil ta om lag 15 minutter å svare på disse spørsmålene. Vi ber også om tillatelse til
innhente opplysninger fra din journal om behandling og resultater av undersøkelser du har
gjennomgått.
Mulige fordeler og ulemper
For pasienter hvor det avdekkes betydelig risiko for fall, trykksår og underernæring, vil det i
samarbeid med pasienten bli iverksatt forebyggende tiltak. Vi forventer at noen av spørsmålene vil
oppleves som lite relevante for flere av pasientene.
Hva skjer med informasjonen om deg?
Informasjonen som registreres om deg skal kun brukes slik som beskrevet i hensikten med studien.
Opplysninger som registreres er data fra spørreskjemaene samt data fra din journal som omhandler
din aktuelle sykdom, behandling, helsetilstand og eventuelle komplikasjoner. Alle opplysningene vil
bli behandlet uten navn og fødselsnummer eller andre direkte gjenkjennende opplysninger. En kode
knytter deg til dine opplysninger gjennom en navneliste.
Det er kun autorisert personell knyttet til prosjektet som har adgang til navnelisten og som kan finne
tilbake til deg og alle har taushetsplikt. Når studien avsluttes 31. desember 2015 vil navnelisten
slettes og informasjonen om deg anonymiseres. Resulter fra studien vil bli publisert i vitenskapelige
artikler og kan bli brukt i master- og doktorgradsavhandlinger. Det vil ikke være mulig å identifisere
deg i resultatene av studien når disse publiseres. Lovisenberg Diakonale Sykehus ved
administrerende direktør er databehandlingsansvarlig.
Frivillig deltakelse
Det er frivillig å delta i studien. Du kan når som helst og uten å oppgi noen grunn trekke ditt
samtykke til å delta i studien. Dette vil ikke få konsekvenser for din videre behandling. Dersom du
ønsker å delta, undertegner du samtykkeerklæringen på siste side. Om du nå sier ja til å delta, kan du
senere trekke tilbake ditt samtykke uten at det påvirker din øvrige behandling. Dersom du senere
ønsker å trekke deg eller har spørsmål til studien, kan du kontakte prosjektkoordinator Tove Irene
Granheim, tlf. 2322 6291. Ansvarlig for studien er professor Anners Lerdal.
Appendix 1: Letter of Consent
52
Rett til innsyn og sletting av opplysninger om deg
Hvis du sier ja til å delta i studien, har du rett til å få innsyn i hvilke opplysninger som er registrert om
deg. Du har videre rett til å få korrigert eventuelle feil i de opplysningene vi har registrert. Dersom du
trekker deg fra studien, kan du kreve å få slettet innsamlede opplysninger, med mindre
opplysningene allerede er inngått i analyser eller brukt i vitenskapelige publikasjoner.
Finansiering
Studien er finansiert gjennom forskningsmidler fra Lovisenberg Diakonale Sykehus og fra Lovisenberg
Diakonale Høgskole.
Forsikring
Vanlig forsikring ved sykehusinnleggelse
Samtykke til deltakelse i studien
Jeg er villig til å delta i studien
(Signatur fra studiedeltager og dato) Jeg bekrefter å ha gitt informasjon om studien (Signatur og dato)
Navnelapp pasient:

53
Pasientsikkerhetsstudien ”RISIKO FOR PASIENTER PÅ SYKEHUS- en studie av symptomer, samsykdommer og risiko hos pasienter innlagt på medisinske og kirurgiske sykehusavdelinger”.
MÅLING AV ERNÆRINGSSTATUS Nutrition risk screening 2002
Høyde ________ cm
Vekt ________ kg
Veid på sykehusvekt nr. ___________ Har pasienten BMI under 20?
Nei
Ja Har pasienten hatt vekttap siste 3 md?
Nei
Ja
_________ antall kg Har pasienten spist mindre siste uke?
Nei Ja
Har spist 50-75 % av vanlig porsjon
Har spist 25-50 % av vanlig porsjon
Har spist 0-25 % av vanlig porsjon Er pasienten intensivpasient?
Nei
Ja Er noen av spørsmålene over besvart med ja så taes kopi av dette skjemaet og legges til ernæringsfysiolog for sekundærscreening. Skal pasienten sekundærscreenes?
Nei
Ja
Appendix 2: NRS 2002 Initial screening