risk management tool for the control of …tools.fstools.org/poultryrmtool/documents/userguide.pdf1...
TRANSCRIPT

1
Risk Management Tool for the Control of Campylobacter and Salmonella spp. in
Chicken Meat
(Version 1.0)
User Guide
OVERVIEW ................................................................................................................................................. 3
GLOSSARY .................................................................................................................................................. 4
STEP 1: REGISTER YOUR ACCOUNT .................................................................................................. 5
STEP 2: LOGIN ........................................................................................................................................... 6
STEP 3: NAVIGATE USING THE MAIN TOOLBAR ........................................................................... 7
HOME ......................................................................................................................................................... 7 PROCESS FLOW LIST ................................................................................................................................... 7 DOCUMENTS ............................................................................................................................................... 7 USER GUIDE ............................................................................................................................................... 7 TUTORIAL ................................................................................................................................................... 7 SEND COMMENTS ....................................................................................................................................... 7 LOGIN/LOGOUT .......................................................................................................................................... 7
STEP 4: LOAD AN EXISTING PROCESS FLOW OR CREATE A NEW PROCESS FLOW .. 9
STEP 5: NAVIGATE USING THE PROCESS FLOW TOOL BAR .....................................................10
STEP 6: EDIT THE PROCESS FLOW NAME AND DESCRIPTION .................................................11
STEP 7: EDIT THE PROCESS FLOW MODEL FOR ONE OR BOTH PATHOGENS ....................12
A NOTE ABOUT NUMERICAL VALUES .......................................................................................................13 INITIAL CONTAMINATION ..........................................................................................................................14 CONSUMER PRACTICES..............................................................................................................................17 DOSE RESPONSE ........................................................................................................................................19
Default Models .....................................................................................................................................19 Custom Models ....................................................................................................................................20
ADDING A STAGE ......................................................................................................................................22 List of Process Types ...........................................................................................................................24 Deleting a Stage ...................................................................................................................................27
ADDING AN INTERVENTION .......................................................................................................................28 Deleting an Intervention ......................................................................................................................29
ADDING A PATH ........................................................................................................................................30
STEP 8: REVIEW THE PROCESS FLOW MODEL FOR ONE OR BOTH PATHOGENS .............32
STEP 9: RUN THE MODELS AND REVIEW RESULTS .....................................................................34

2
APPENDIX A: FACTORS AFFECTING COUNT CONVERSIONS IN DETERMINING
MICROBIAL CONTAMINATION OF POULTRY CARCASSES .......................................................36
CONVERSION OF CFU / G TO CFU / CARCASS ...............................................................................................36 CONVERSION OF CFU / ML TO CFU / CARCASS ............................................................................................37 REFERENCES ..............................................................................................................................................38
APPENDIX B: TECHNICAL DESCRIPTION (INCLUDING GLOSSARY) ......................................39
PARAMETERS .............................................................................................................................................39 ASSUMPTIONS ...........................................................................................................................................41 INITIAL CONCENTRATION AND PREVALENCE PARAMETERS ......................................................................42 SEQUENTIAL PROCESSES ...........................................................................................................................43
No Significant Change .........................................................................................................................43 Increase (growth) .................................................................................................................................43 Increase (addition –within flock) .........................................................................................................43 Decrease ..............................................................................................................................................44 Cross-contamination ............................................................................................................................45 Within flock prevalence increase .........................................................................................................45 Within flock prevalence decrease.........................................................................................................46 Between flock prevalence increase ......................................................................................................46 Between flock prevalence decrease ......................................................................................................46
DOSE RESPONSE ........................................................................................................................................47 CONSUMER PRACTICES..............................................................................................................................48
Cross contamination ............................................................................................................................48 Consumer cooking ...............................................................................................................................48 Consumer Practices Algorithm ............................................................................................................48
RESIDUAL RISK .........................................................................................................................................51

3
Overview
This web site provides access to a risk management simulation tool based on the
Codex Guidelines for the Control of Campylobacter and Salmonella in Chicken Meat
available at:
http://www.codexalimentarius.net/download/standards/11780/CXG_078e.pdf.
The tool can model the complete production-to-consumption process flow described
in the Guidelines. These models are referred to as process flows. Users may
investigate one or both pathogens and determine which steps to include in the process flow.
The tool is designed to compute the residual risk between a baseline process flow
and a process flow applying selected interventions as outlined in the Guidelines. The
residual risk measure may be used to evaluate the overall effectiveness of the applied interventions.
Users define the process flow in terms of stages that change the concentration
and/or prevalence of broiler carcasses as they move through the process flow.
These stages are parameterized by a mix of fixed values and distributions (e.g. a
growth stage may result in an increase in concentration characterized by a Normal
distribution of 2 log10 with a standard deviation of 0.4). The tool uses Monte Carlo
simulation to calculate the net effect of the entire process flow and to calculate the residual risk measure.
Users should be familiar with poultry processing and statistics in general, as well as
Monte Carlo simulation and the Guidelines in particular. Reviewing the Guidelines
before continuing with this document is strongly recommended. Links to several
additional background documents are also provided on the tool’s web site for
reference, including a tutorial illustrating the creation of a process flow.
Please also review the disclaimer and privacy policy provided on the web site.
There are several steps required to use the tool and build process flow scenarios.
Step 1: Register your account
Step 2: Login
Step 3: Navigate using the main tool bar
Step 4: Load an existing process flow or create a new process flow
Step 5: Navigate using the process flow tool bar
Step 6: Edit the process flow name and description
Step 7: Edit the process flow model for one or both pathogens
Step 8: Review the process flow model for one or both pathogens
Step 9: Run the models and review results
4
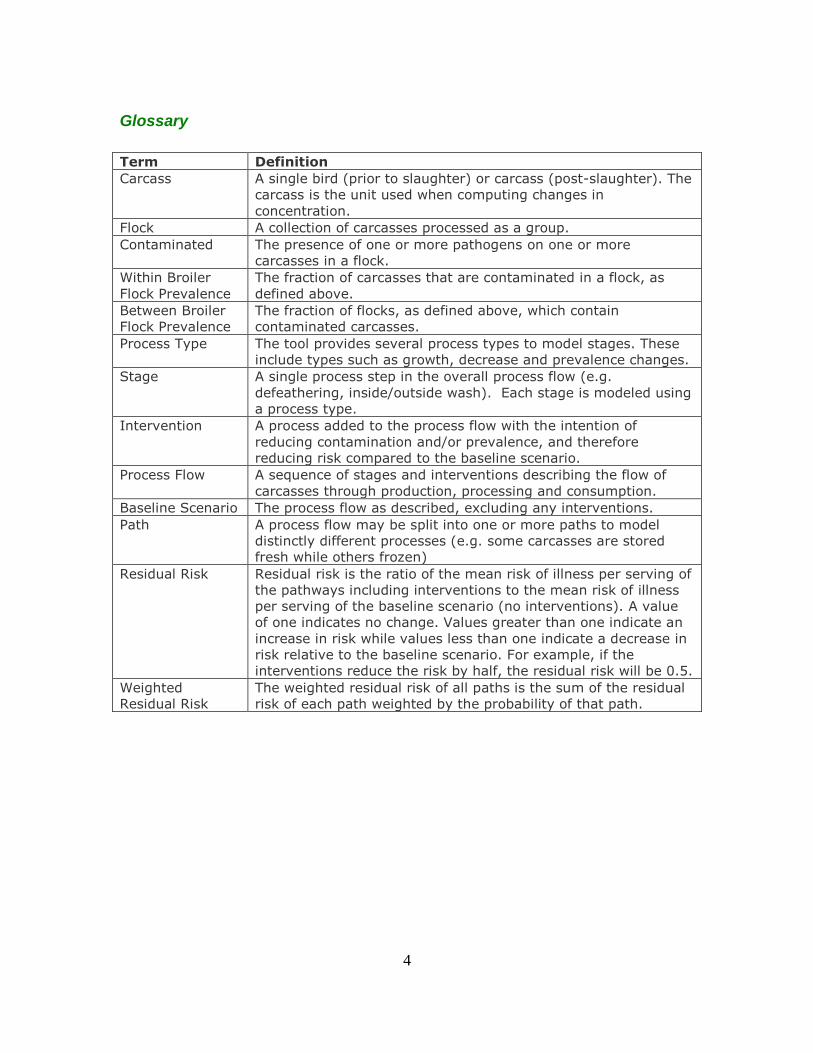
Glossary
Term Definition
Carcass A single bird (prior to slaughter) or carcass (post-slaughter). The
carcass is the unit used when computing changes in
concentration.
Flock A collection of carcasses processed as a group.
Contaminated The presence of one or more pathogens on one or more
carcasses in a flock.
Within Broiler
Flock Prevalence
The fraction of carcasses that are contaminated in a flock, as
defined above.
Between Broiler
Flock Prevalence
The fraction of flocks, as defined above, which contain
contaminated carcasses.
Process Type The tool provides several process types to model stages. These
include types such as growth, decrease and prevalence changes.
Stage A single process step in the overall process flow (e.g.
defeathering, inside/outside wash). Each stage is modeled using
a process type.
Intervention A process added to the process flow with the intention of
reducing contamination and/or prevalence, and therefore
reducing risk compared to the baseline scenario.
Process Flow A sequence of stages and interventions describing the flow of
carcasses through production, processing and consumption.
Baseline Scenario The process flow as described, excluding any interventions.
Path A process flow may be split into one or more paths to model
distinctly different processes (e.g. some carcasses are stored
fresh while others frozen)
Residual Risk Residual risk is the ratio of the mean risk of illness per serving of
the pathways including interventions to the mean risk of illness
per serving of the baseline scenario (no interventions). A value
of one indicates no change. Values greater than one indicate an
increase in risk while values less than one indicate a decrease in
risk relative to the baseline scenario. For example, if the
interventions reduce the risk by half, the residual risk will be 0.5.
Weighted
Residual Risk
The weighted residual risk of all paths is the sum of the residual
risk of each path weighted by the probability of that path.

5
Step 1: Register your account
Before using the tool, each user must create an account. This account will allow
users to maintain a private workspace for their process flow models, and store them
for subsequent use.
The registration page may be accessed from the home page.
To create an account, fill in the email address, password and confirmation textboxes for the account, and then click the “Register” button.
To simplify verification of the password, click the “show” link beside the “Password”
label. If “show” is clicked, the password is no longer hidden and the “show” link is replaced by a “hide” link. Clicking the “hide” link hides the password again.
If the account already exists, the user will receive a warning message with a link to
the password reminder page. In this case, use the password reminder page to have the application send a reminder email with the account password.
The password reminder feature only works if a valid email address was entered when registering.
6
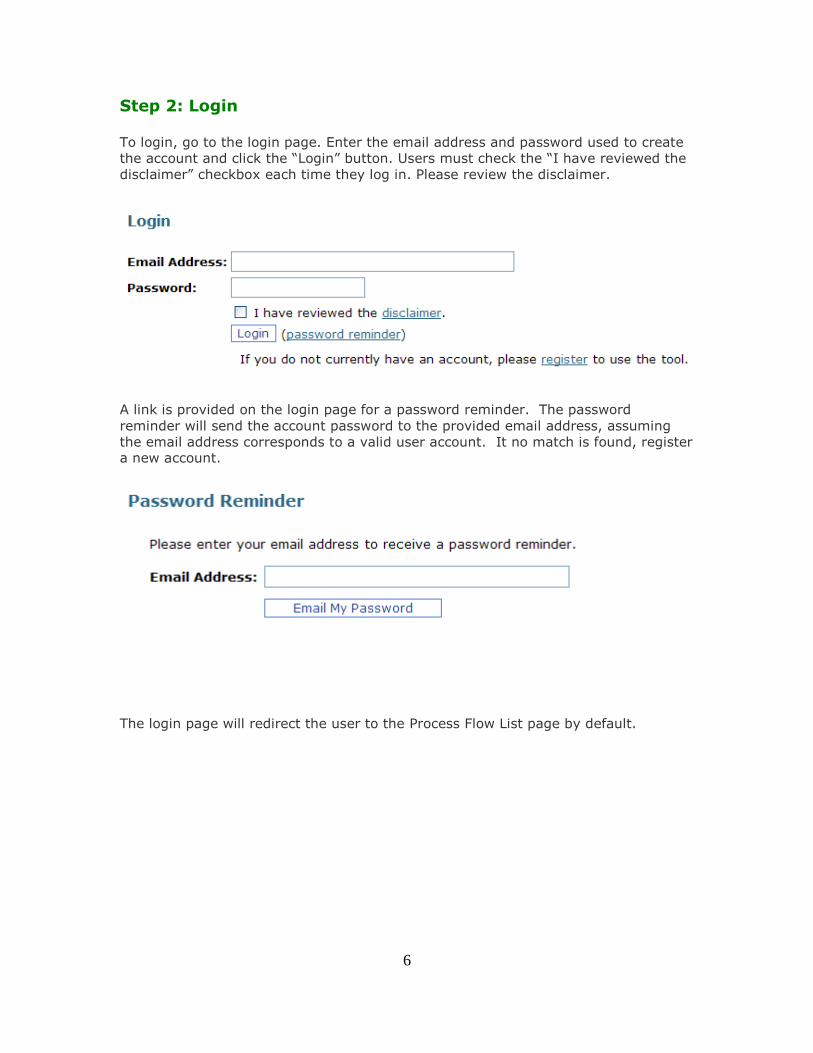
Step 2: Login
To login, go to the login page. Enter the email address and password used to create
the account and click the “Login” button. Users must check the “I have reviewed the
disclaimer” checkbox each time they log in. Please review the disclaimer.
A link is provided on the login page for a password reminder. The password
reminder will send the account password to the provided email address, assuming
the email address corresponds to a valid user account. It no match is found, register a new account.
The login page will redirect the user to the Process Flow List page by default.

7
Step 3: Navigate using the main toolbar
The main toolbar at the top of the web page provides quick links to the following site features:
Home
Process Flow List
Documents
User Guide
Tutorial
Send Comments Login/Logout
Home
This link opens the home page for the application.
Process Flow List
This link opens the list of process flows for the current account.
Documents
This link opens a new window with links to supporting documents, including the
Guidelines.
User Guide
This link opens a new window with a PDF copy of the current user guide.
Tutorial
This link opens a new window with a PDF copy of the current tutorial.
Send Comments
This link opens a form with which to send comments on the application.
Login/Logout
When the user is logged in, clicking on this link will logout the current account. When
the user is not logged in, it provides a link to the login page.

8
When logged in, the email address of the current account is displayed to the right of this link, or below the toolbar as in the above example.

9
Step 4: Load an existing process flow or create a new
process flow
From the Process Flow List page, the user may choose to view/edit, copy or delete
an existing process flow, or create a new process flow.
Each of the user’s existing process flows will be listed alphabetically in the table.
Click on the View/Edit link to view/edit the process flow, the Copy link to make a copy, or the Delete link to delete the flow.
When first accessing this page after creating an account, the list will be empty and
the user must click on New Flow to create a new process flow.
Clicking the Copy link creates a copy of the selected Process Flow and then opens the edit page for the new Process Flow.
If the Delete link is clicked, the user will be prompted to confirm or cancel the deletion.
Deletion is irreversible.

10
Step 5: Navigate using the process flow tool bar
When viewing or editing a Process Flow, the Process Flow toolbar is added to the top of the page.
Using this toolbar, the user can access the following forms for the current process flow:
Name and Description
Campylobacter Model
Campylobacter Results
Salmonella Model Salmonella Results
These forms are described in more detail in the subsequent sections.

11
Step 6: Edit the process flow name and description
When the user opens a process flow or clicks on the Name and Description link in the process flow toolbar, the Name and Description form is presented.
On this page, the user may update the Process Flow name and description.
Click “Save Changes” to save the changes. Click “Save And Close” to save the
changes and return to the process flow list page. Click on “Close” to return to the process flow list page without saving.
A user may also return to the process list page without saving by clicking on the Process Flow List link in the main toolbar.

12
Step 7: Edit the process flow model for one or both pathogens
In this application, models for Campylobacter and Salmonella are constructed and
run separately. Users may choose to implement models for one or both pathogens
in each process flow.
Users assemble a process flow model using a flowchart style of interface. When a new model is first opened, the user will see the following form:
The nodes Initial Contamination (IC), Dose Response (DR), Consumer Practices (CP)
and Path 0 (P0) are included by default and cannot be deleted. However, Initial
Contamination, Dose Response, and Consumer Practices may be edited. In addition,
users may add stages, interventions and paths to complete the process flow model. Each model requires at least one path and this is represented by Path 0 (P0).
PLEASE NOTE: The user must review and modify the Initial Contamination
and Consumer Practices node to set the values based on their data. While the
user may edit the Dose Response model, it is expected that most users will use the default provided.

13
A Note about Numerical Values
The user will be required to enter many parameter values in the model. Numerical
parameter values may be entered in either decimal notation (e.g. 3) or scientific notation (e.g. 2E-2).
14
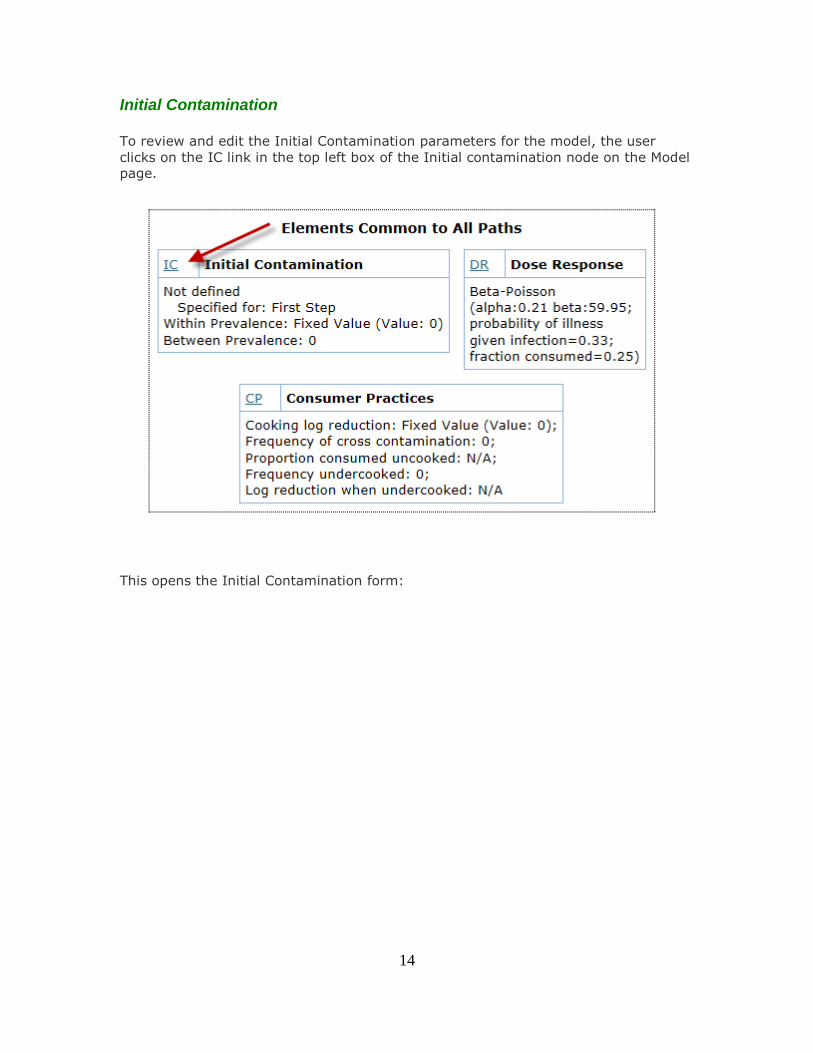
Initial Contamination
To review and edit the Initial Contamination parameters for the model, the user
clicks on the IC link in the top left box of the Initial contamination node on the Model page.
This opens the Initial Contamination form:

15
Please note that when a process flow is created, the initial concentration is set to 0
log10 cfu/carcass, and the initial prevalence values are set to 0. The user must assign appropriate values for the new model based on their data or research.
Prevalence is specified as a value between 0 and 1. Please note that the prevalence
is for the broiler flock (i.e. during processing). For example, if the step “Manage
grandparent flocks” was included in the model, the user would enter prevalence
values here that would be observed in the broiler flock due to management techniques and not in the grandparent flock itself.
This also applies to concentration, which is specified in log10 cfu/carcass in the broiler
flock. While the user may elect to define their process flow starting from the very
first stage (e.g. Manage Grandparent Flocks), the user should carefully select the
point at which the process flow starts modeling concentration (and prevalence) based on available data and research (e.g. after defeathering).

16
Note that the concentration is per carcass and not per gram or per milliliter. Please
refer to Appendix A for a discussion of converting from cfu/g and cfu/ml to
cfu/carcass.
When defining the initial concentration values, the user may select from the following
distributions:
Beta PERT
Cumulative
Fixed Value (no distribution)
Normal
Triangular Uniform
When changing the distribution, allow the page to reload before modifying the
parameter values as each distribution has different parameter requirements. In
particular, review the on screen instructions for specifying the Cumulative Empirical distribution.
Note that the parameters are on the log10 scale when selecting the appropriate
distribution. To aid in properly parameterizing the distributions, users may click on
the Show Chart button for all distributions except Fixed Value. Please note that this
does not save changes.
Caution should be exercised when using the Normal distribution. Some combinations
of mean and standard deviation may result in the simulation generating values
outside the specified range for parameters. If the mean +/- four standard deviations
falls outside the range for the parameter, a warning message will be displayed.
Users may elect to ignore the message, but are strongly encouraged to adjust the parameters or select a bounded distribution such as the Beta PERT instead.
While the user may note the step at which the initial concentration is first applied in
the “Specified for” textbox, the user determines which stages modify concentration
by selecting appropriate process types (see the Add a Stage section). This textbox is
provided for notation only and the user must exercise caution that changes to concentration are not applied before intended.
The user may also specify within flock prevalence as a distribution. In this case,
however, the Normal distribution is not an option as prevalence must be bounded
between 0 and 1.
Between lot prevalence may only be specified as a fixed value.
The Save Changes and Save And Close buttons will both save changes. The Save
and Close and Close buttons will return the user to the model page. The Close button does not save changes.

17
Consumer Practices
Consumer practice models the in-kitchen practices in consumer homes. It allows the
user to define an expected log reduction resulting from cooking.
The user may optional specify parameters for cross contamination and undercooking as well.
To edit the consumer practices parameters for the model, the user clicks on the CP link in the top left box of the Consumer Practices node.
This will open the consumer practices form, as shown on the next two screenshots:

18
The user should first specify a standard log10 reduction from consumer cooking.
Optionally, the user may include cross contamination by specifying the expected
frequency of cross contamination events and the proportion of pathogens consumed
uncooked (as a fraction of the total count available on the carcass). To exclude cross contamination, the user must leave or set the frequency to 0.
As well, the user may also include undercooking by specifying a frequency at which
carcasses are undercooked and the reduced cooking log reduction experiences by
those carcasses. To exclude undercooking, the user must leave or set the frequency
to 0.
Frequencies are specified as fixed values between 0 and 1, while the proportion and cooking log reductions may be specified as distributions or fixed values.
By default, all values on this page are set to 0 for new process flows and the user must define appropriate parameter values based on their data and research.
It is important for the user to remember to save changes for these modifications to
take effect. The Save Changes and Save And Close buttons will both save changes.
The Save and Close and Close buttons will return the user to the model page. The Close button does not save changes.
19
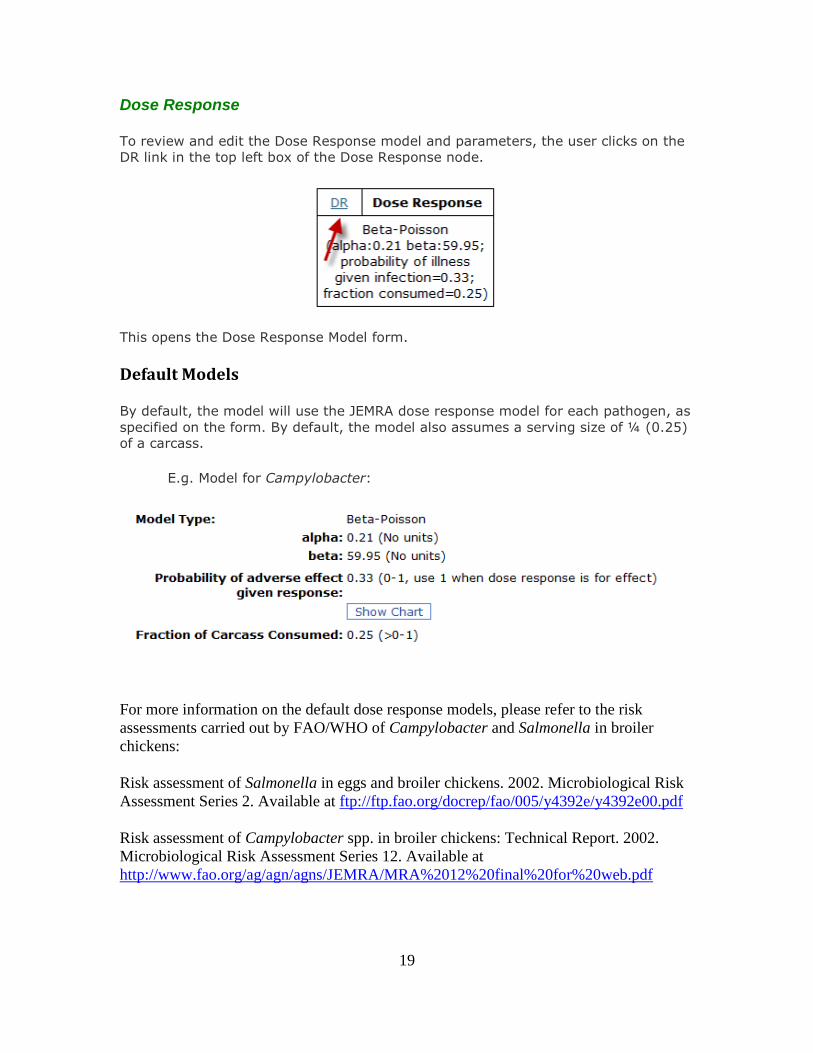
Dose Response
To review and edit the Dose Response model and parameters, the user clicks on the
DR link in the top left box of the Dose Response node.
This opens the Dose Response Model form.
Default Models
By default, the model will use the JEMRA dose response model for each pathogen, as
specified on the form. By default, the model also assumes a serving size of ¼ (0.25) of a carcass.
E.g. Model for Campylobacter:
For more information on the default dose response models, please refer to the risk
assessments carried out by FAO/WHO of Campylobacter and Salmonella in broiler
chickens:
Risk assessment of Salmonella in eggs and broiler chickens. 2002. Microbiological Risk
Assessment Series 2. Available at ftp://ftp.fao.org/docrep/fao/005/y4392e/y4392e00.pdf
Risk assessment of Campylobacter spp. in broiler chickens: Technical Report. 2002.
Microbiological Risk Assessment Series 12. Available at
http://www.fao.org/ag/agn/agns/JEMRA/MRA%2012%20final%20for%20web.pdf
20
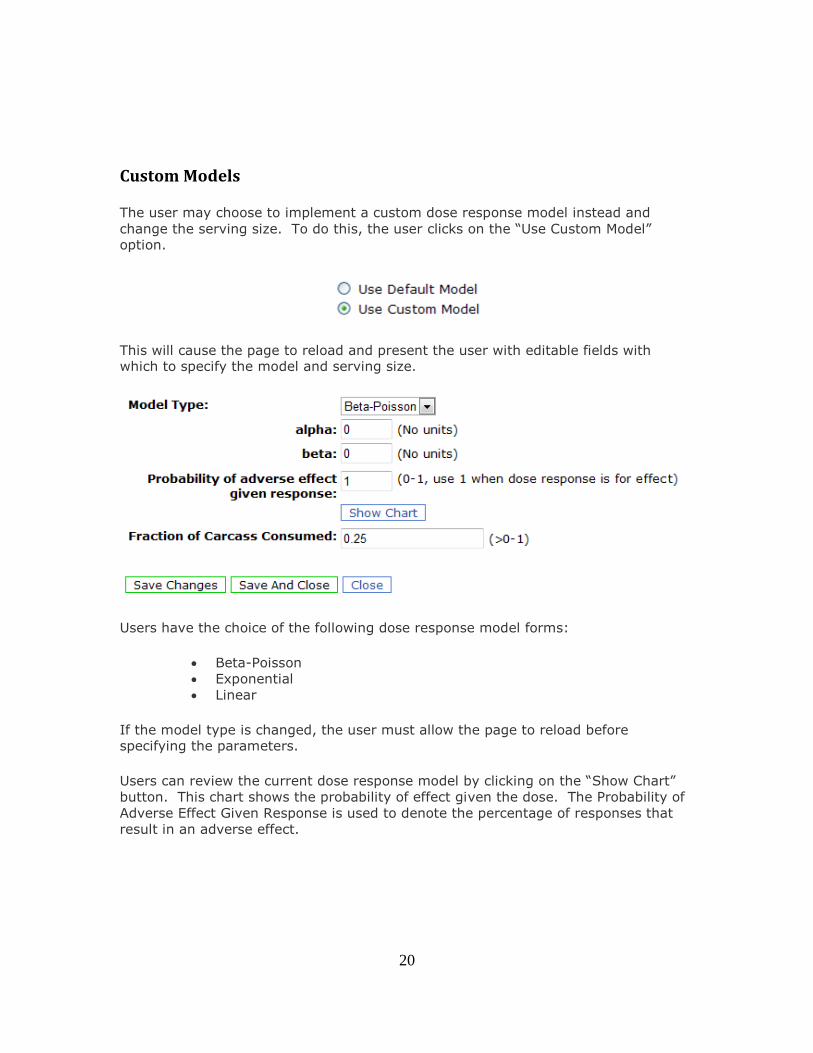
Custom Models
The user may choose to implement a custom dose response model instead and
change the serving size. To do this, the user clicks on the “Use Custom Model” option.
This will cause the page to reload and present the user with editable fields with which to specify the model and serving size.
Users have the choice of the following dose response model forms:
Beta-Poisson
Exponential
Linear
If the model type is changed, the user must allow the page to reload before specifying the parameters.
Users can review the current dose response model by clicking on the “Show Chart”
button. This chart shows the probability of effect given the dose. The Probability of
Adverse Effect Given Response is used to denote the percentage of responses that
result in an adverse effect.

21
The user can at any time revert back to the default model by clicking on the “Use Default Model” radio button.
It is important for the user to remember to save changes for these modifications to
take effect. The Save Changes and Save And Close buttons will both save changes.
The Save and Close and Close buttons will return the user to the model page. The Close button does not save changes.

22
Adding a Stage
Once the fixed elements of the model are reviewed and revised, the user then
constructs the process flow model itself by adding stages, interventions and paths.
When the process flow model is first opened, no stages are provided. To add a stage, the user clicks on the Insert Stage link below the Initial Path node.
This will open a new page where the user must select the type of stage to add and confirm the addition.
The default is a user defined custom stage. However, the user may select from a list
of predefined stages based on the guidelines. Please note that these stages, at
present, do not have any associated parameters and are included primarily to allow
the user to construct a flow based on the terms and sequence described in the
Guidelines.

23
When the user clicks Continue, the stage is added to the model and the Stage Edit form is opened.
This form has several important elements.

24
Path-Sequence
The Path-Sequence shows the current path number for the stage, and the sequence
of this stage in that path.
Step Type
Step Type corresponds to the step number from the guidelines and is included for cross referencing.
Stage Name
Users may change the stage name to better describe the stage.
Process Type
Users must select the process type for this stage. There are nine process types:
No significant change
Increase (growth)
Increase (addition – within flock)
Decrease
Cross-contamination (within flock)
Within Flock Prevalence Decrease
Between Flock Prevalence Decrease
Within Flock Prevalence Increase Between Flock Prevalence Increase
By default, No significant change is selected.
Each process type has its own parameter requirements. Users may find it necessary
to create two stages in sequence to completely characterize a process step. For
example, a washing step might require both a decrease and cross-contamination
process. The user needs to decide the sequence in which the two processes would
occur. The order selected may have implications for the net prevalence and concentration values at the end of both processes.
List of Process Types
No significant change
This process type will not change concentration or prevalence values. It is
used primarily to indicate the user has considered the stage and determined
that it results in no significant change.
Increase (growth)
25
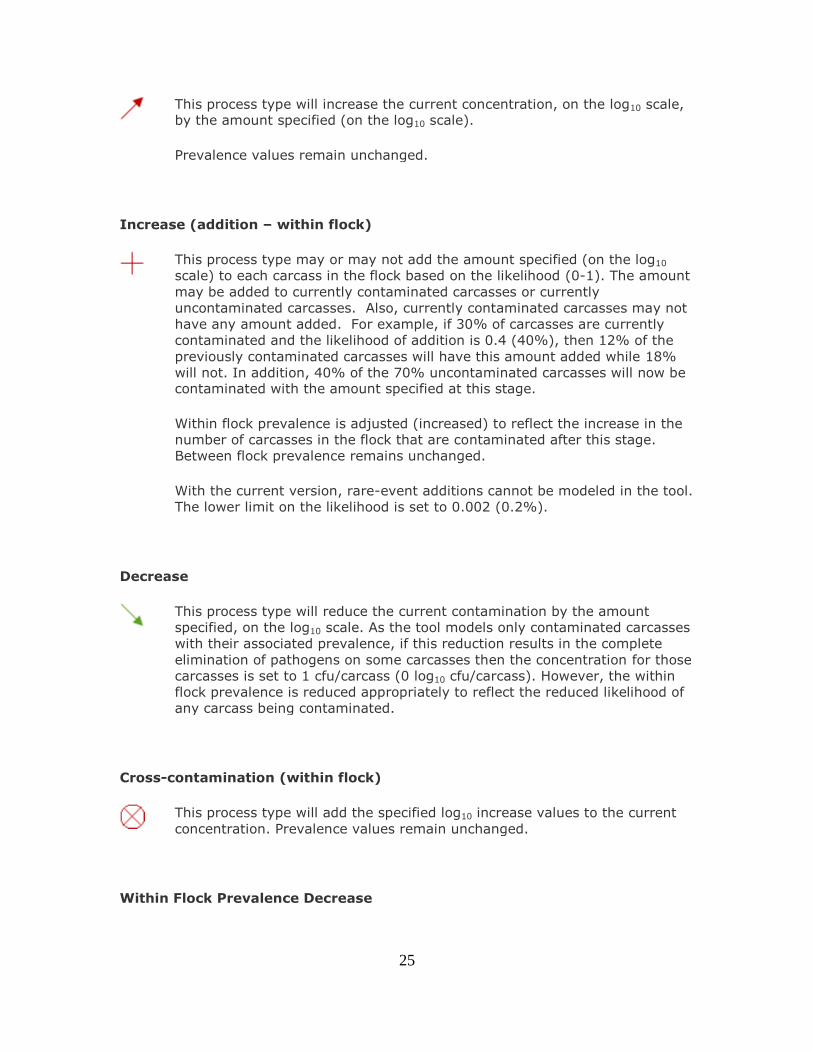
This process type will increase the current concentration, on the log10 scale, by the amount specified (on the log10 scale).
Prevalence values remain unchanged.
Increase (addition – within flock)
This process type may or may not add the amount specified (on the log10
scale) to each carcass in the flock based on the likelihood (0-1). The amount
may be added to currently contaminated carcasses or currently
uncontaminated carcasses. Also, currently contaminated carcasses may not
have any amount added. For example, if 30% of carcasses are currently
contaminated and the likelihood of addition is 0.4 (40%), then 12% of the
previously contaminated carcasses will have this amount added while 18%
will not. In addition, 40% of the 70% uncontaminated carcasses will now be contaminated with the amount specified at this stage.
Within flock prevalence is adjusted (increased) to reflect the increase in the
number of carcasses in the flock that are contaminated after this stage.
Between flock prevalence remains unchanged.
With the current version, rare-event additions cannot be modeled in the tool.
The lower limit on the likelihood is set to 0.002 (0.2%).
Decrease
This process type will reduce the current contamination by the amount
specified, on the log10 scale. As the tool models only contaminated carcasses
with their associated prevalence, if this reduction results in the complete
elimination of pathogens on some carcasses then the concentration for those
carcasses is set to 1 cfu/carcass (0 log10 cfu/carcass). However, the within
flock prevalence is reduced appropriately to reflect the reduced likelihood of
any carcass being contaminated.
Cross-contamination (within flock)
This process type will add the specified log10 increase values to the current
concentration. Prevalence values remain unchanged.
Within Flock Prevalence Decrease

26
This process type reduces the within flock prevalence by the amount
specified. For example, a value of 0.2 will result in a 20% reduction in within
flock prevalence.
Between flock prevalence and concentration are not modified.
Between Flock Prevalence Decrease
This process type reduces the between flock prevalence by the amount
specified. For example, a value of 0.2 will result in a 20% reduction in between flock prevalence.
Within flock prevalence and concentration are not modified.
Within Flock Prevalence Increase
This process type increases the within flock prevalence by the amount
specified. For example, a value of 0.2 will result in a 20% increase in within flock prevalence.
Between flock prevalence and concentration are not modified.
Between Flock Prevalence Increase
This process type increases the between flock prevalence by the amount
specified. For example, a value of 0.2 will result in a 20% increase in
between flock prevalence.
Within flock prevalence and concentration are not modified.
As with other forms, if the user changes the process type or the distribution for the
current process type, the page must reload before the parameter values are
modified. For example, if the user selects Increase (growth), the following will appear:
27
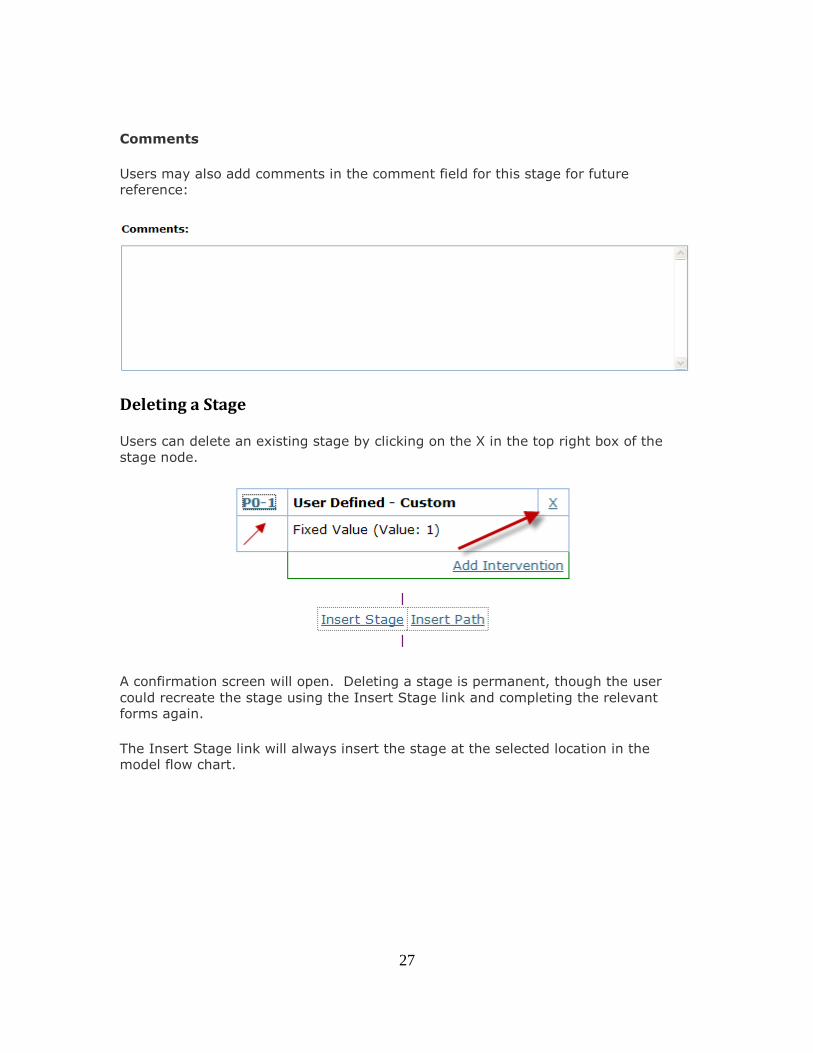
Comments
Users may also add comments in the comment field for this stage for future reference:
Deleting a Stage
Users can delete an existing stage by clicking on the X in the top right box of the
stage node.
A confirmation screen will open. Deleting a stage is permanent, though the user
could recreate the stage using the Insert Stage link and completing the relevant forms again.
The Insert Stage link will always insert the stage at the selected location in the model flow chart.

28
Adding an Intervention
This simulation model is designed to compute the residual risk between a baseline
scenario and a scenario including interventions. The user should therefore specify at
least one intervention in the model. An intervention is defined for specific stages in
the process flow model. The user indicates whether the intervention is applied
before, after or replaces the stage. Only one “replaces” intervention type can be applied to each stage.
To add an intervention, the user clicks on the Add Intervention link in an existing stage node.
This will open the Add Intervention form:
This page functions in the same way as the Add Stage form, but the list of available
intervention type is limited to either just Custom or a list of known interventions for that stage. For most stages, only custom is available.
If the user clicks on continue, the intervention is added and the edit intervention
form opens. As with stages, the user must define the process type and parameters for the intervention.
Intervention Name
29
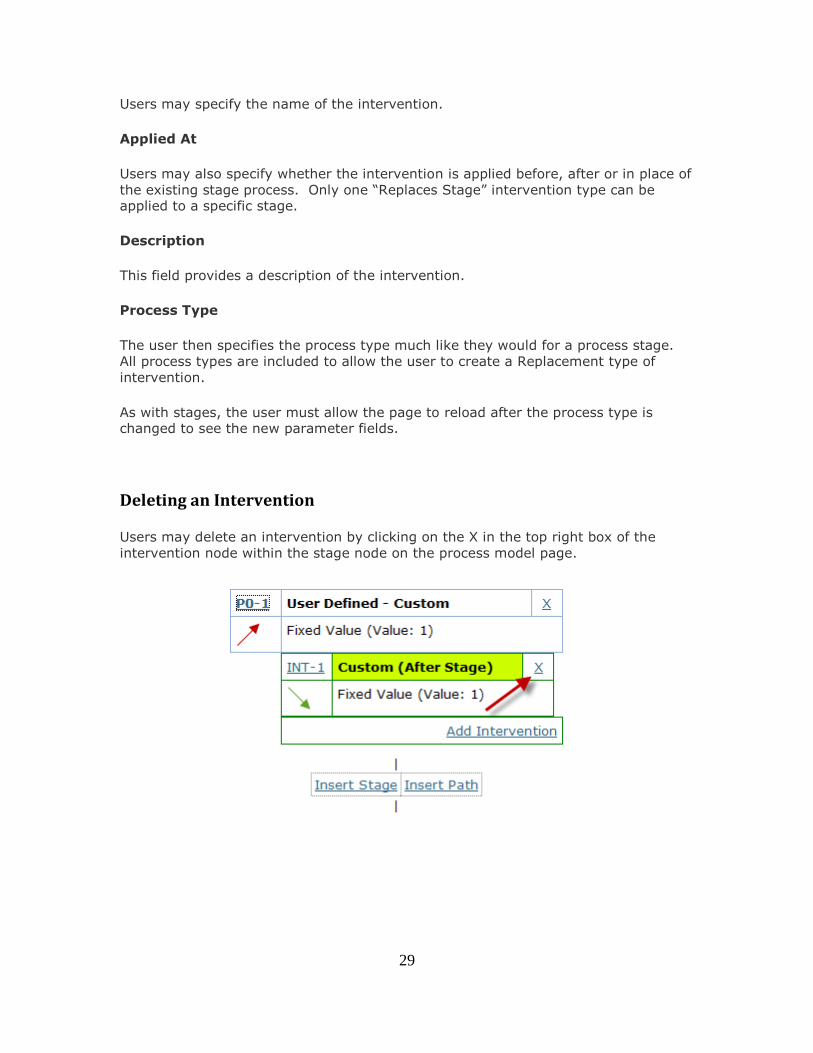
Users may specify the name of the intervention.
Applied At
Users may also specify whether the intervention is applied before, after or in place of
the existing stage process. Only one “Replaces Stage” intervention type can be applied to a specific stage.
Description
This field provides a description of the intervention.
Process Type
The user then specifies the process type much like they would for a process stage.
All process types are included to allow the user to create a Replacement type of
intervention.
As with stages, the user must allow the page to reload after the process type is changed to see the new parameter fields.
Deleting an Intervention
Users may delete an intervention by clicking on the X in the top right box of the
intervention node within the stage node on the process model page.
30
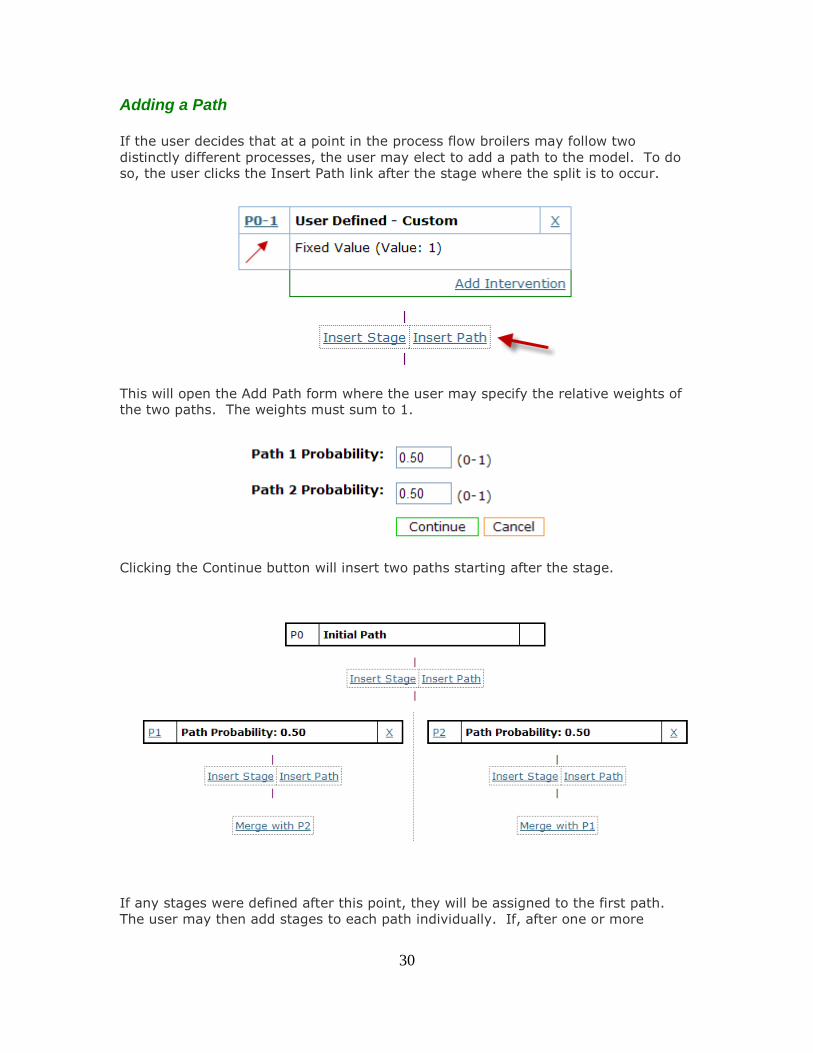
Adding a Path
If the user decides that at a point in the process flow broilers may follow two
distinctly different processes, the user may elect to add a path to the model. To do so, the user clicks the Insert Path link after the stage where the split is to occur.
This will open the Add Path form where the user may specify the relative weights of the two paths. The weights must sum to 1.
Clicking the Continue button will insert two paths starting after the stage.
If any stages were defined after this point, they will be assigned to the first path.
The user may then add stages to each path individually. If, after one or more

31
stages, the process converges again, the user may click on one of the Merge With links to merge the two paths together.
32
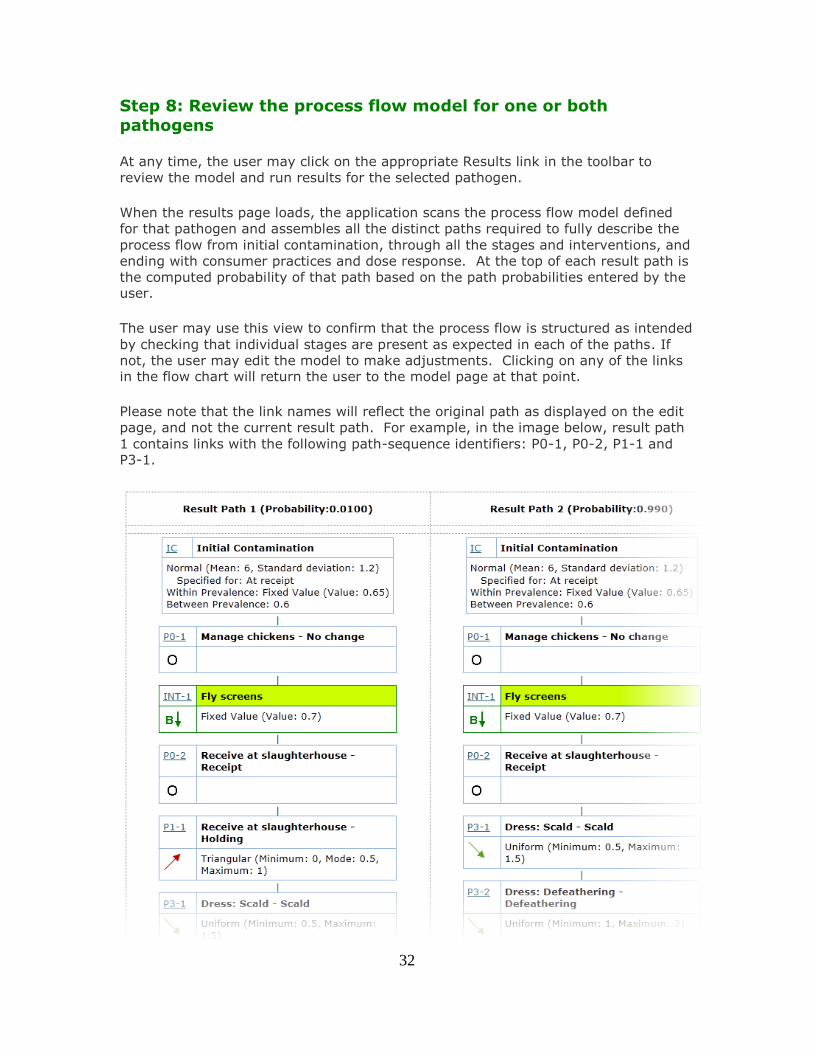
Step 8: Review the process flow model for one or both
pathogens
At any time, the user may click on the appropriate Results link in the toolbar to
review the model and run results for the selected pathogen.
When the results page loads, the application scans the process flow model defined
for that pathogen and assembles all the distinct paths required to fully describe the
process flow from initial contamination, through all the stages and interventions, and
ending with consumer practices and dose response. At the top of each result path is
the computed probability of that path based on the path probabilities entered by the user.
The user may use this view to confirm that the process flow is structured as intended
by checking that individual stages are present as expected in each of the paths. If
not, the user may edit the model to make adjustments. Clicking on any of the links in the flow chart will return the user to the model page at that point.
Please note that the link names will reflect the original path as displayed on the edit
page, and not the current result path. For example, in the image below, result path
1 contains links with the following path-sequence identifiers: P0-1, P0-2, P1-1 and P3-1.

33
The user can choose to hide any stages with a process type of No Significant Change by clearing the checkbox and clicking Reload Paths.
If the user has not used paths, then only one path will be present on this page.
When the user is satisfied with the application’s interpretation of the model, the user
may click the Run Model button.

34
Step 9: Run the models and review results
When the user clicks on the Run Model button, the results page reloads and includes
the computed values for mean between flock prevalence, mean within flock
prevalence, log10 of the arithmetic mean carcass concentration, and residual risk.
Each of the flowchart boxes will now include the results for each stage:
In addition, before the first stage, a chart is included showing the change in these
values over the path:
Finally, residual risk results are included at the bottom of the page along with the weighted residual risk of the combined pathways:

35
Residual risk is the ratio of the mean risk of illness per serving of the pathways
including interventions to the mean risk of illness per serving of the baseline scenario
(no interventions). If no interventions are included, it will have a value of 1, meaning no change. If the interventions reduce the risk by half, the residual risk will be 0.5.
The weighted residual risk of all paths is the sum of the residual risk of each path weighted by the probability of that path.
The risk for a scenario is determined by computing the final concentration
distribution and within flock prevalence values for that scenario. These are passed to
the consumer practices and dose response models to determine a risk value which is further adjusted by the between lot prevalence.
36
Appendix A: Factors Affecting Count Conversions in
Determining Microbial Contamination of Poultry Carcasses
Conversion of cfu / g to cfu / carcass
The need to make this conversion stems from the fact that the decision-support tool
requires microbial counts to be expressed as cfu / carcass. However, some
countries prefer to sample carcasses by macerating portions of neck skin, which
yields cfu / g. In contrast, counts obtained from rinse-sampling of whole carcasses
are usually expressed as cfu / mL of rinse fluid and are more readily converted to cfu
/ carcass (see below).
It is known that microbial contamination of carcasses is unevenly distributed over
internal and external surfaces, and several studies have compared counts obtained
from different sampling sites on individual carcasses. Unfortunately, no publication
has been found that compares counts from neck skin with those from other sites,
although it is recognised that neck skin is likely to be more heavily contaminated
because carcasses are suspended from the processing line by their legs and drain
down into the neck region.
Conversion of cfu / g requires the following manipulations. Firstly, it can be
assumed from previous experience that 1 g of skin is equivalent to an area of
10 cm2. Then, it is necessary to calculate the total surface area of the carcass, as
described by Thomas (1978). This is given by the equation:
A = 637 + 0.87 w
where A is the total surface area in cm2 and w is the carcass weight in grams. Thus,
the weight of neck skin taken (or skin from another region) will be known and
therefore cfu / g is easily converted to cfu / carcass by multiplying by A/10. The
equation differs from that described by Schmidt-Nielson (1984) which does not take
account of the carcass cavity.
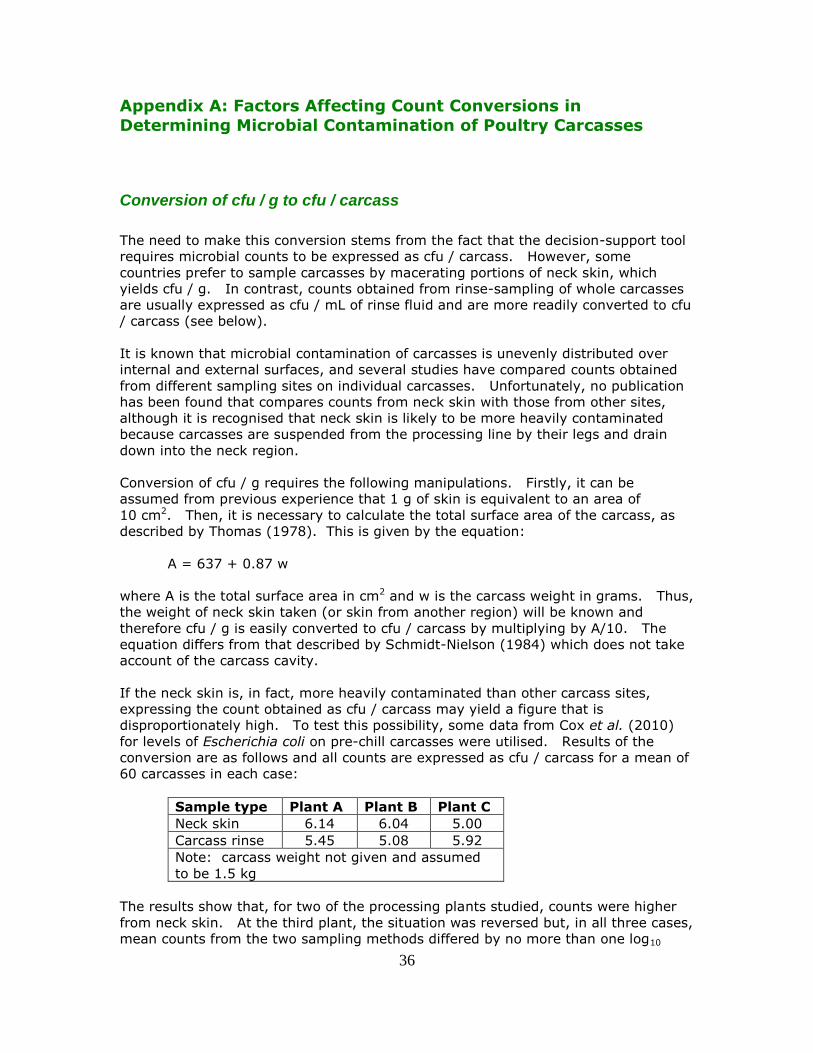
If the neck skin is, in fact, more heavily contaminated than other carcass sites,
expressing the count obtained as cfu / carcass may yield a figure that is
disproportionately high. To test this possibility, some data from Cox et al. (2010)
for levels of Escherichia coli on pre-chill carcasses were utilised. Results of the
conversion are as follows and all counts are expressed as cfu / carcass for a mean of
60 carcasses in each case:
Sample type Plant A Plant B Plant C
Neck skin 6.14 6.04 5.00
Carcass rinse 5.45 5.08 5.92
Note: carcass weight not given and assumed
to be 1.5 kg
The results show that, for two of the processing plants studied, counts were higher
from neck skin. At the third plant, the situation was reversed but, in all three cases,
mean counts from the two sampling methods differed by no more than one log10
37
unit, and less in two cases.
It is concluded that taking skin samples and converting cfu / g to cfu / carcass yields
counts for the latter with the right order of magnitude and does not appear to
require any correction factor (which would equal the quotient of mean carcass
contamination and neck skin contamination). Moreover, when the impact of a
processing intervention is being determined, it is reasonable to assume that the
same sampling method will have been used before and after the intervention has
been applied.
Conversion of cfu / mL to cfu / carcass
Rinse sampling is a common sampling method for collecting microbial data.
However, rinse sampling only removes a portion of the microbes on the carcass. An
estimate of the total number of microbes on a carcass requires that counts obtained
from rinse sampling are scaled up.
Few studies have focused on the proportion of microbes removed by carcass rinsing.
Lillard (1988) estimated approximately 14.1% of Enterobacteriaceae and 10.0% of
aerobic bacteria are removed using a 100 mL rinse volume. Jorgensen et al.,
(2002) show limited data for rinse sampling with a 300 mL volume. While no
estimates of the removal rate are provided in that study, fitting an exponential decay
function to their summary data suggests a removal rate of roughly 34% per minute
of agitation.
To estimate carcass levels from rinse data, the following equation can be used:
where cfu / mL is obtained by either direct plating or from most probable number
estimates of the number of cells in the rinsate, rinse volume is the volume of rinsate
in mL originally added to the rinse bag, and recovery rate is the efficiency by which
the rinse volume used can remove bacteria from the carcass.
Estimating bacterial removal rates for rinse sampling usually requires sampling the
same carcass multiple times. The counts thus obtained are fitted to an exponential
decay model to determine the recovery rate.
To estimate the recovery rate for a 400 mL rinse volume, the following data were
used. In one study, 300 chicken carcass rinse samples were collected at a single
facility (unpublished). During the study, rinse sampling was performed with either a
100 or 400 mL rinsate volume. Summary statistics and simple tests of equivalence
did not demonstrate the notion of equivalence and suggest that rinse sampling with
the 400 mL rinsate volume removed a higher proportion of bacteria.
To estimate the 400 mL recovery rate parameter using the data from this study, a
stochastic model was developed that describes the process of rinsing a carcass and
sampling the rinsate to obtain a count of the number of bacteria present. The
model uses Bayesian inference, information from previous studies, and the available
bacteria / carcass = cfu / mL x rinse volume
recovery rate

38
data to determine the effect of rinse volume on the proportion of bacteria removed
through rinsing (Williams et al., 2010). This study found a 70% removal efficiency,
0.7 recovery rate, suggesting that 400 mL is superior to 100 mL.
References
Cox N A, Richardson L J, Cason J A Buhr R J, Vizzier-Thaxton Y, Smith D P, Fedorka-
Cray P J, Romanenghi C P, Pereira L V B and Doyle M P (2010). Comparison of
neck skin excision and whole carcass rinse sampling methods for
microbiological evaluation of broiler carcasses before and after immersion
chilling. J. Food Prot. (in press).
Jorgensen F, Bailey R, Williams S, Henderson P, Wareing D R A, Bolton F J, Frost J A,
Ward L and Humprey T J (2002). Prevalence and numbers of Salmonella and
Campylobacter spp. on raw, whole chickens in relation to sampling methods.
Int. J. Food Microbiol., 76: 151 – 164.
Lillard H S (1988). Comparison of sampling methods and implications for bacterial
decontamination of poultry carcasses by rinsing. J. Food Prot. 51: 405 – 408.
Schmidt-Nielson K (1984). Scaling: why is animal size so important?
http://en.wikipedia.org/wiki/Allometry.
Thomas N L (1978). Observations of the relationship between the surface area and
weight of eviscerated carcasses of chickens, ducks and turkeys. J. Food
Technol. 13: 81 – 86.
Williams M S, Ebel E D, Golden N J, Berrang M E, Bailey J S, Hartnett E (2010).
Estimating removal rates of bacteria from poultry carcasses using two whole-
carcass rinse volumes. Int. J. Food Microbiol. 139: 1140 – 1146.
39
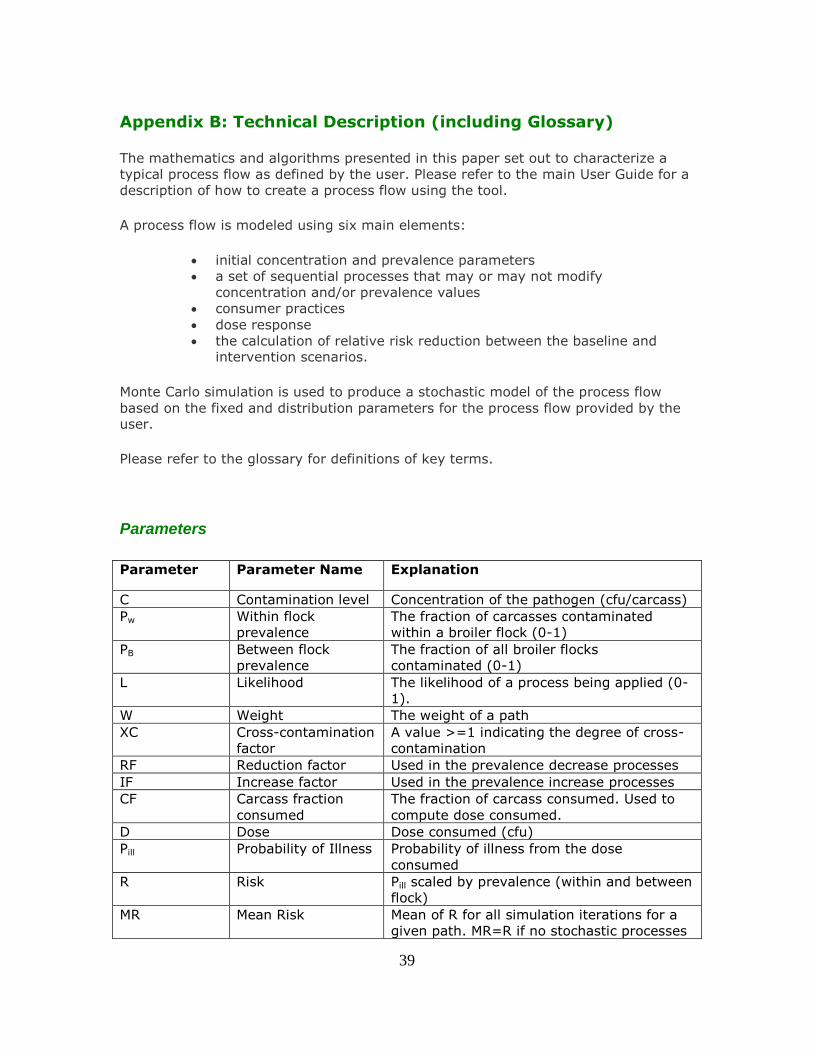
Appendix B: Technical Description (including Glossary)
The mathematics and algorithms presented in this paper set out to characterize a
typical process flow as defined by the user. Please refer to the main User Guide for a
description of how to create a process flow using the tool.
A process flow is modeled using six main elements:
initial concentration and prevalence parameters
a set of sequential processes that may or may not modify
concentration and/or prevalence values
consumer practices
dose response
the calculation of relative risk reduction between the baseline and intervention scenarios.
Monte Carlo simulation is used to produce a stochastic model of the process flow
based on the fixed and distribution parameters for the process flow provided by the user.
Please refer to the glossary for definitions of key terms.
Parameters
Parameter Parameter Name Explanation
C Contamination level Concentration of the pathogen (cfu/carcass)
Pw Within flock
prevalence
The fraction of carcasses contaminated
within a broiler flock (0-1)
PB Between flock
prevalence
The fraction of all broiler flocks
contaminated (0-1)
L Likelihood The likelihood of a process being applied (0-
1).
W Weight The weight of a path
XC Cross-contamination
factor
A value >=1 indicating the degree of cross-
contamination
RF Reduction factor Used in the prevalence decrease processes
IF Increase factor Used in the prevalence increase processes
CF Carcass fraction
consumed
The fraction of carcass consumed. Used to
compute dose consumed.
D Dose Dose consumed (cfu)
Pill Probability of Illness Probability of illness from the dose
consumed
R Risk Pill scaled by prevalence (within and between
flock)
MR Mean Risk Mean of R for all simulation iterations for a
given path. MR=R if no stochastic processes
40
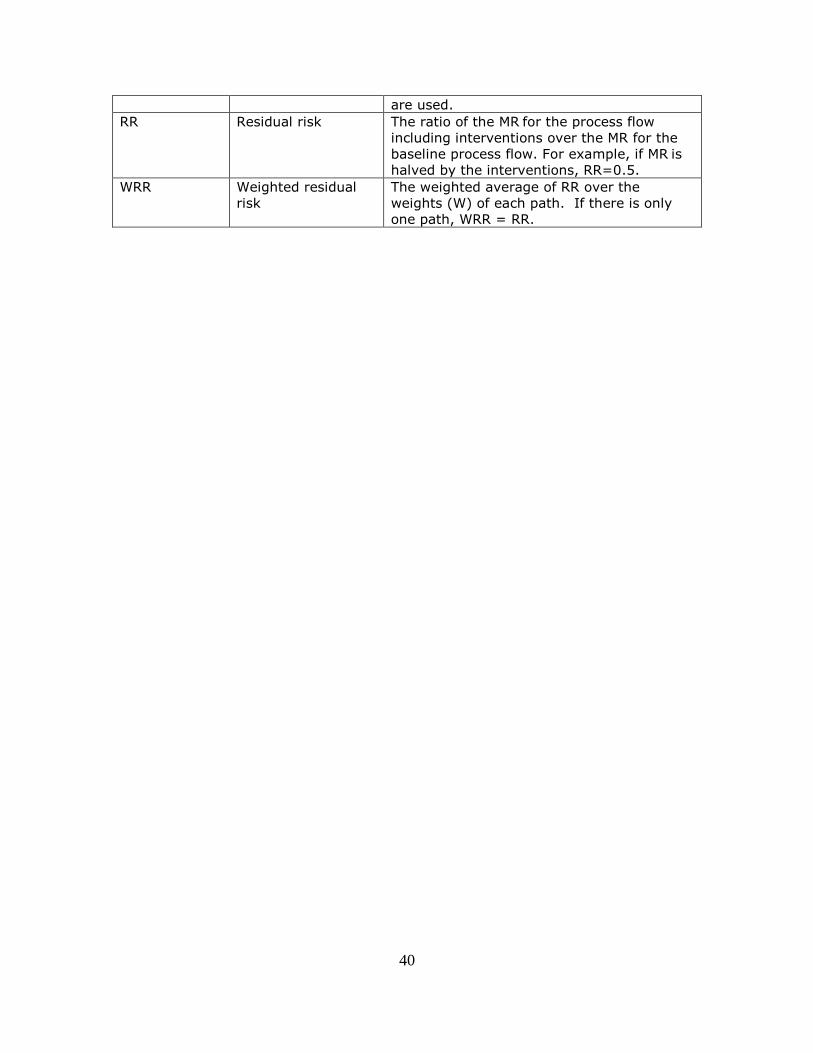
are used.
RR Residual risk The ratio of the MR for the process flow
including interventions over the MR for the
baseline process flow. For example, if MR is
halved by the interventions, RR=0.5.
WRR Weighted residual
risk
The weighted average of RR over the
weights (W) of each path. If there is only
one path, WRR = RR.

41
Assumptions
The following assumptions are made in the tool:
1. The tool models the flow of a single representative flock through the entire
process.
2. While some early stages may be modelled using prevalence only, a
concentration value is required to compute the residual risk.
3. Concentration values are provided as cfu/carcass or the log equivalent. Please
see Appendix A on converting data from cfu/g and cfu/ml to cfu/carcass.
4. As concentrations are stored as cfu/carcass during calculations, all values are
rounded to the nearest integer at the end of each stage.
5. The tool models positive only carcasses. Any process which eliminates most
contamination is handled by adjusting the within flock prevalence down. As
such, the minimum concentration reported will be 0 log10 cfu/carcass, or 1
cfu/carcass.
6. Cross-contamination and addition processes may occur within a flock but not
between flocks.
7. Prevalence and concentration values entered are for the broiler flock, not
necessary the current flock. For example, if a process model begins at step 5,
Manage parent flocks, any prevalence and concentration values refer to the
downstream broiler flock and not to the parent flocks.
8. Likelihood is used to indicate a process may or may not happen as part of the
entire process flow. It is not intended to model two or more alternate process
flow options. In the current tool, likelihood is only available for the addition
process type. All other situations in which flocks may follow two or more
processes should be implemented using paths. See the main user guide for more details on adding paths.
A note on paths
If the process flow uses paths, then the tool computes the path weight based on the
weight values provided by the user and any previous paths. For example, if the
process flow has one path, the weight is 1. If the process flow has two paths, the
weights would be as entered. E.g. 0.01 and 0.99. If the first path was further split
into two paths with weights 0.4 and 0.6, then the process flow would now have three
paths with weights of 0.01x0.4, 0.01x0.6 and 0.99 respectively.
The process flow then models all stages on each path as required and combines the results in the weighted residual risk.

42
Initial Concentration and Prevalence Parameters
Initial Concentration
Initial concentration is entered in units of log cfu/carcass. The user may select one of
the following distributions for initial concentration: Beta PERT, Cumulative Empirical, Fixed, Normal, Triangular, Uniform.
Initial Within Broiler Flock Prevalence
The user enters a value between 0 and 1 for within broiler flock prevalence using one
of the following distributions: Beta PERT, Cumulative Empirical, Fixed, Triangular,
Uniform. Normal is not available for parameters requiring fixed boundaries.
Please note that the prevalence is for the broiler flock. For example, if the step
“Manage grandparent flocks” was included in the model, the user would enter
prevalence values here that would be observed in the broiler flock due to
management techniques implemented at the grandparent flock level and not the
prevalence values in the grandparent flock.
Initial Between Broiler Flock Prevalence
The user enters a fixed value between 0 and 1 for between broiler flock prevalence.
Please note that the prevalence is for the broiler flock. For example, if the step
“Manage grandparent flocks” was included in the model, the user would enter
prevalence values here that would be observed in the broiler flock due to
management techniques implemented at the grandparent flock level and not the
prevalence values in the grandparent flock.
43
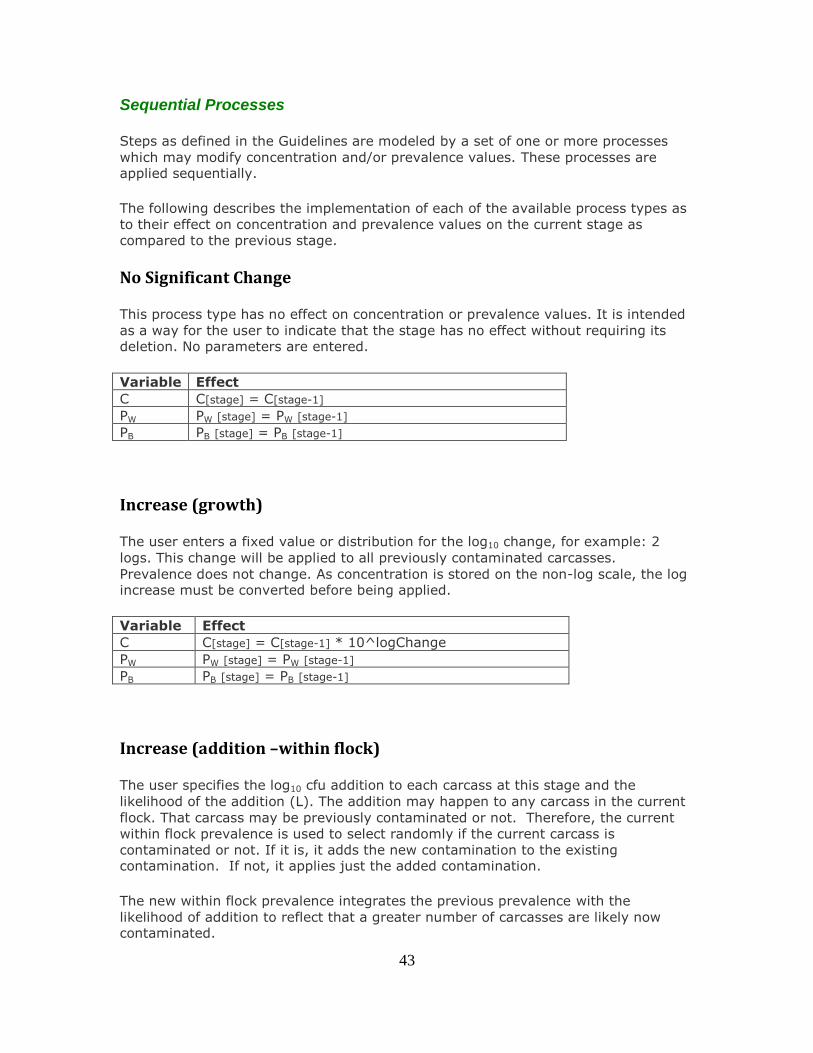
Sequential Processes
Steps as defined in the Guidelines are modeled by a set of one or more processes
which may modify concentration and/or prevalence values. These processes are applied sequentially.
The following describes the implementation of each of the available process types as
to their effect on concentration and prevalence values on the current stage as
compared to the previous stage.
No Significant Change
This process type has no effect on concentration or prevalence values. It is intended
as a way for the user to indicate that the stage has no effect without requiring its deletion. No parameters are entered.
Variable Effect
C C[stage] = C[stage-1]
PW PW [stage] = PW [stage-1]
PB PB [stage] = PB [stage-1]
Increase (growth)
The user enters a fixed value or distribution for the log10 change, for example: 2
logs. This change will be applied to all previously contaminated carcasses.
Prevalence does not change. As concentration is stored on the non-log scale, the log increase must be converted before being applied.
Variable Effect
C C[stage] = C[stage-1] * 10^logChange
PW PW [stage] = PW [stage-1]
PB PB [stage] = PB [stage-1]
Increase (addition –within flock)
The user specifies the log10 cfu addition to each carcass at this stage and the
likelihood of the addition (L). The addition may happen to any carcass in the current
flock. That carcass may be previously contaminated or not. Therefore, the current
within flock prevalence is used to select randomly if the current carcass is
contaminated or not. If it is, it adds the new contamination to the existing contamination. If not, it applies just the added contamination.
The new within flock prevalence integrates the previous prevalence with the
likelihood of addition to reflect that a greater number of carcasses are likely now contaminated.

44
Variable Effect
C IF Bernoulli(PW[stage-1])
THEN
C[stage] = C[stage-1] + 10^logAdded
ELSE
C[stage] = 10^ logAdded
END IF
PW PW [stage] = PW [stage-1] + L – (PW [stage-1] * L)
PB PB [stage] = PB [stage-1]
If the addition is less than the current contamination level, then this should reduce
the mean contamination level in the flock but increase the within flock prevalence. If
the addition is greater than the current contamination level, then both the mean concentration and the within flock prevalence should increase.
Decrease
The user specifies the log10 decrease expected for this stage, for example: 3 logs.
This change will be applied to all previously contaminated carcasses. As
concentration is stored on the non-log scale, the log decrease must be converted
before being applied. In some cases, the decrease will result in a total elimination of
cfu’s on the carcass. This is addressed by determining the probability the log
decrease would eliminate all cfu’s and adjusting the within flock prevalence accordingly.
Since the tool models the contamination level of positive carcasses, if the resulting
concentration is less than 1 cfu/carcass, it is set to 1 cfu/carcass.
Variable Effect
C C[stage] = C[stage-1] * 10^(-logDecrease)
IF C[stage] < 1 THEN C[stage] = 1
PW ProbDeath = 1 – (10^(-logDecrease))
PW [stage] = PW [stage-1] * (1- ProbDeath^C[stage-1])
PB PB [stage] = PB [stage-1]

45
Cross-contamination
The user specifies the cross-contamination factor (XC>=1) to apply to the current
within flock prevalence. The tool then computes the corresponding redistribution of
cfu/carcass. The tool assumes the total available concentration is sufficient to result
in at least 1 cfu/carcass for the entire flock.
When applying the cross-contamination factor, the tool considers the possibility the
new prevalence would be > 1 and adjusts the factor accordingly. A final prevalence value of 1 implies total cross-contamination.
Variable Effect
C EffectiveXC = 1/ PW [stage-1]
IF (PW [stage-1]*XC) < 1
THEN
C[stage] = C[stage-1] / XC
ELSE
C[stage] = C[stage-1] / EffectiveXC
END IF
IF C[stage] < 1 THEN C[stage] = 1
PW PW [stage] = PW [stage-1] * XC
IF PW [stage] > 1 THEN PW [stage] = 1
PB PB [stage] = PB [stage-1]
Within flock prevalence increase
The user specifies an increase factor (IF, 0-1) to apply to the current prevalence. For
example, a value of 0.2 will result in a 20% increase in prevalence. Prevalence only processes should be used with caution as concentration is not affected.
Variable Effect
C C[stage] = C[stage-1]
PW PW [stage] = PW [stage-1] * (1+IF)
PB PB [stage] = PB [stage-1]
46
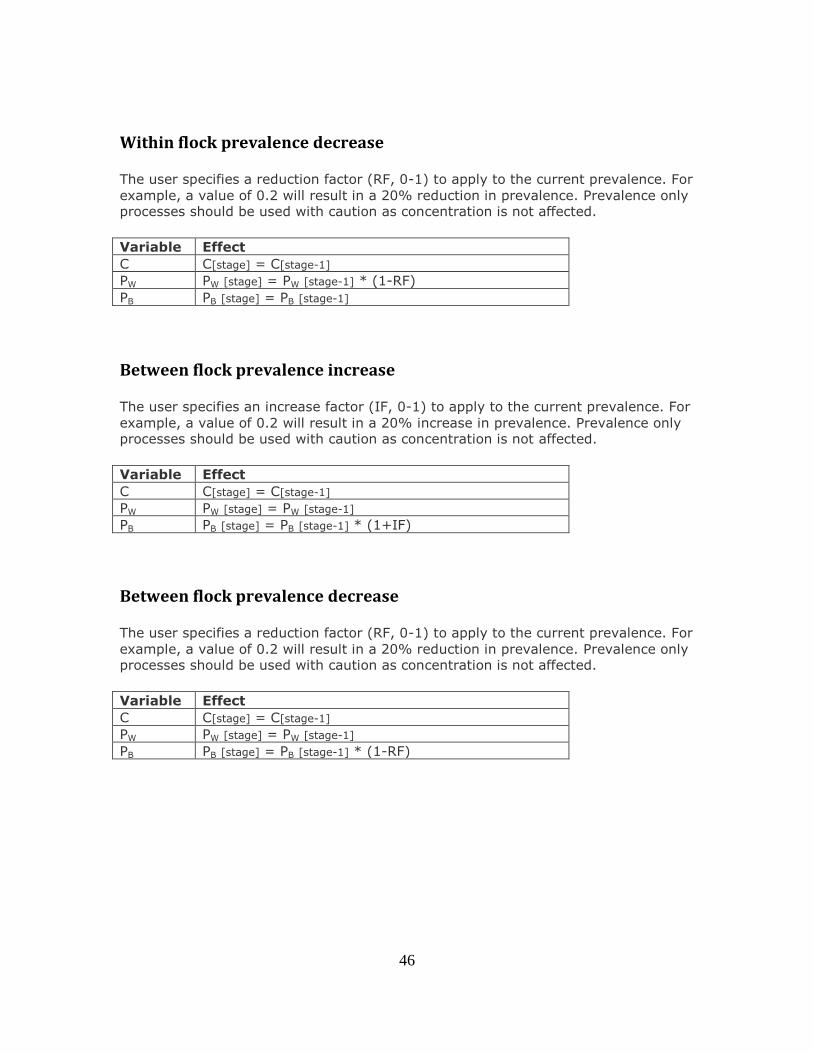
Within flock prevalence decrease
The user specifies a reduction factor (RF, 0-1) to apply to the current prevalence. For
example, a value of 0.2 will result in a 20% reduction in prevalence. Prevalence only processes should be used with caution as concentration is not affected.
Variable Effect
C C[stage] = C[stage-1]
PW PW [stage] = PW [stage-1] * (1-RF)
PB PB [stage] = PB [stage-1]
Between flock prevalence increase
The user specifies an increase factor (IF, 0-1) to apply to the current prevalence. For
example, a value of 0.2 will result in a 20% increase in prevalence. Prevalence only processes should be used with caution as concentration is not affected.
Variable Effect
C C[stage] = C[stage-1]
PW PW [stage] = PW [stage-1]
PB PB [stage] = PB [stage-1] * (1+IF)
Between flock prevalence decrease
The user specifies a reduction factor (RF, 0-1) to apply to the current prevalence. For
example, a value of 0.2 will result in a 20% reduction in prevalence. Prevalence only processes should be used with caution as concentration is not affected.
Variable Effect
C C[stage] = C[stage-1]
PW PW [stage] = PW [stage-1]
PB PB [stage] = PB [stage-1] * (1-RF)

47
Dose Response
A dose response model is used in the consumer practices node (see next section) to
compute probability of illness resulting from the consumption of a contaminated serving.
The default for the model is to assume a consumption fraction (CF) of ¼ (0.25) of the carcass per serving.
The default dose response model for Campylobacter is a Beta-Poisson with alpha =
0.21 and beta = 59.95. The probability of illness given infection is 0.33 (or 33%).
The default dose response model for Salmonella is a Beta-Poisson with alpha = 0.1324 and beta = 51.45. The probability of illness given infection is 1 (or 100%).
A user may choose to define a custom dose response model using a Beta-Poisson, exponential or linear model, and modify the fraction consumed.
The equation used to compute Pill is:
Pill = DoseResponse(C[final stage]*CF) * (Probability of Illness given Infection)
48
Consumer Practices
Consumer practices consists of two related items: cross contamination and cooking.
These are applied after all other process steps, using the final concentration and prevalence values.
Cross contamination
The user specifies the frequency of cross contamination events (FrCC) as a value
between 0 and 1.
The user specifies the proportion of pathogens consumed uncooked (though transfer to surfaces and other foods) as a value or distribution between 0 and 1 (PT).
Consumer cooking
The user specifies the log10 reduction in contamination that results from cooking
(CR).
The user may also optionally specify a frequency at which carcasses are undercooked (FrUC) between 0 and 1, and an associated log10 reduction (UCR).
Consumer Practices Algorithm
The tool uses the decrease process types to determine a net concentration and
prevalence from consumer practices. It also applies the dose response model to the
different concentration values that result and produces a weighted mean probability of illness from all possibilities.
Step 1: Compute the different pathogen counts for each situation
Cross contamination may occur or not. If it does not occur, all pathogens experience
cooking. If it does occur, some pathogens do not experience cooking due to transfer
off the carcass while those remaining on the carcass do experience cooking. Please
note in this and later steps the difference between Uncooked and Undercooked.
The former refers to pathogens that experience no cooking, while the later pathogens that experience a reduced cooking level.
countCookedNoCrossContamination = C[final stage]
countUnCookedWithCrossContamination = C[final stage]*PT
countCookedWithCrossContamination = C[final stage]*(1-PT)
Step 2: Compute counts after cooking
49
For the two situations above in which the carcass is cooked, it may be fully cooked or
undercooked. This results in four new counts computed using the decrease
concentration function of the decrease process type. The decrease concentration function takes as its parameters the count and the log reduction.
Additionally, each count is multiplied by the fraction of the carcass consumed (CF).
remainingCookedNoCrossContamination = DecreaseConc(countCookedNoCrossContamination, CR)*CF
remainingUndercookedNoCrossContamination = DecreaseConc (countCookedNoCrossContamination, UCR)*CF
remainingCookedWithCrossContamination = DecreaseConc (countCookedWithCrossContamination, CR)*CF
remainingUndercookedWithCrossContamination = DecreaseConc
(countCookedWithCrossContamination, UCR)*CF
Step 3: Compute the adjusted prevalence resulting from cooking
This step uses the decrease prevalence function of the decrease process type. It
takes three parameters: previous prevalence, count and log reduction. Since this process is modeling only positive carcasses, a prevalence of 1 is assumed.
prevAdjustNoCrossContam = DecreasePrev(1, countCookedNoCrossContamination, CR)
prevAdjustUndercookedNoCrossContam = DecreasePrev(1, countCookedNoCrossContamination, UCR)
prevAdjustWithCrossContam = DecreasePrev(1,
countCookedWithCrossContamination, CR)
prevAdjustUndercookedWithCrossContam = DecreasePrev(1, countCookedWithCrossContamination, UCR)
Step 4: Compute the Probability of Illness for each situation
The adjusted counts above are passed to the defined dose response model to
determine the probability of illness for each situation. This includes both the cooked and uncooked situations.
pillCookedNoCrossContamination =
DoseResponse(remainingCookedNoCrossContamination)

50
pillCookedWithCrossContamination = DoseResponse(remainingCookedWithCrossContamination)
pillUnderCookedNoCrossContamination = DoseResponse(remainingUndercookedNoCrossContamination)
pillUnderCookedWithCrossContamination =
DoseResponse(remainingCookedWithCrossContamination)
pillUncookedWithCrossContamination = DoseResponse(remainingUndercookedWithCrossContamination)
Step 5: Compute the weighted average for a final probability of illness
The weighted Pill is computed by summing the following values. Each value adjusts
the probability of illness by the adjusted prevalence of the situation and any
associated fractions results from whether the situation involved cross contamination
or undercooking.
No cross contamination
pillCookedNoCrossContamination*(1-FrCC)* prevAdjustNoCrossContam*(1-FrUC)
pillUndercookedNoCrossContamination*(1-FrCC)*
prevAdjustUndercookedNoCrossContam*(FrUC)
With cross contamination and cooked
pIllCookedWithCrossContam*(FrCC)* prevAdjustWithCrossContam*(1-FrUC)
pIllUndercookedWithCrossContam*(FrCC)*
prevAdjustUndercookedWithCrossContam*(FrUC)
With cross continuation, uncooked
pillUncookedWithCrossContami*(FrCC)*pillUncookedWithCrossContamination
If the resulting weighted sum is greater than 1, it is set to 1.

51
Residual Risk
The tool differentiates between baseline processes and intervention processes. The
tool computes the process flow for both the baseline and for the baseline plus
interventions. The tool compares the results of both to compute a residual risk factor (RR).
There are three steps involved to compute this factor: computing the risk (MR) per
path for both the baseline scenario and scenario including interventions, computing the residual risk of each path, and then computing the weighted residual risk.
Computing MR from Consumer Practices
The Consumer Practices module computes Pill. This Pill is scaled by the final within
and between flock prevalence values to compute the risk for each iteration of the Monte Carlo simulation.
R = Pill * PW[final stage]*PB[final stage]
The mean of all samples for each path is taken:
MR = Mean(R)
Compute the Residual Risk for Each Path
The residual risk for a path is computed by taking the ratio of MR with the scenario
with interventions over the MR for the baseline scenario (no interventions). A value
less than 1 indicates a relative reduction in risk.
RR = MR(interventions)/MR(baseline)
Compute the Weighted Residual Risk
The weight for each path in the process flow is the product of all the individual
weights assigned to each path.
For example, if the process flow has one path, the weight is 1. If the process flow
has two paths, the weights would be as entered. E.g. 0.01 and 0.99. If the first path
was further split into two paths with weights 0.4 and 0.6, then the process flow
would now have three paths with weights of 0.01x0.4, 0.01x0.6 and 0.99
respectively.
The final weighted residual risk is computed using the following equation:
WRR = SUM(RR[path]*W[path])

52
If there is only one path, the WRR = RR.