risk management seeing the unseen - self insurers of … electrical 2013... · peter erskine...
TRANSCRIPT


Risk management
Seeing the unseen electrical and mechanical issues

Risk and Electrical Switchboards and Infrastructure
The key objectives in risk fall into two categories
• Staff welfare and safety – identifying issues in electrical switchboards
• Continuous supply of power – ensuring equipment does not fail creating risks.
3

Common Approach What lies behind the door ?
Always been there – no issues to date
No Issues as I am aware
Our electricians address issues
4

5
Inside the switchboard all ok ?
Above cable heat acceptable tolerances

6
Required by legislation to check
But not
Operation- Signage – Access – Opening – Listing

7
Required by legislation to check
Operation- Signage – Access – Opening – Listing

Consequences of electrical switchboards faults and issues • Fire – Electricity major factor in fire cause. • Safety – incidents with electrical injury is often higher
than perceived. • Service delivery interruption. • Energy Costs – if power factor units and other vital
components not performing correctly. • Major Issue – Publicity - Impact on, share
holders/members.
8

Electrical assets to be surveyed Main Switch Boards Transformers
Motor Control Centre Uninterrupted Power Supply
Distribution Boards Bus bars
Electrical Motors Control Panels
Mechanical Services S/board Power Factor Correction
9

Vodaphone UK Business Continuity Study
Of greatest concern is technology-related risk,
being a tier one risk.
59% of managers are concerned about IT systems failure – related to power supply
10

The Asset Life Cycle Management Process Risk in Commissioning and Performance • Installation of Asset Upgrade – New project • Commissioning of Asset - Baseline - Warranty • Maintenance of Asset – Predictive or Reactive • Condition Monitoring within Maintenance – Thermography • Life Cycle assessment. Linking condition monitoring information. • Compliance – OH&S comprehensive
11

12
Disconnect between condition monitoring Asset Management Dr Lin Ma U of Q –

13
Standards for Switchboard Maintenance AS3439.1:2002 Clause 5.3 “ It is the responsibility of the owner of the ASSEMBLY to institute a system of maintenance.
Mark Betcher Blacktown City Switchboards National Electrical Switchboard Manufacturers Association

14
Non-routine maintenance Preventative maintenance Post fault maintenance Repair or corrective maintenance Routine maintenance
Switchboard Maintenance
Standard AS 2467 clauses 4.4.3, 4.4.4 & 4.4.5
Inspect – 12 months
Examine – 5 years
Overhaul – 15 years
Mark Betcher Blacktown City Switchboards National Electrical Switchboard Manufacturers Association
15

Cost Benefit Hartford Steam Boiler Inspections and Insurance Company completed a ten year study
evaluating the cost/benefits of infrared, in which it was determined a proper infrared predictive maintenance program produces hard cost savings of $4:1.
Trends NFPA 70 USA Section 20.17.5 Inspection Frequency and Procedures Annually – unless loss experience , New Equipment – Operation Load condition Arc Flash – listing assets that have arc flash potential Complete manual Australian Thermographers Association Creating standards and methods Canadian Government Master Specification
16
Thermography General Requirements

• What is a Thermographic survey?
• Using infrared images to measure temperature differential and graphically illustrate issues such as electrical anomalies, overheating, metal wear, insulation degradation, identifying leaks , observing air conditioning blockages are a few of the applications.
17

18

19
The issues below if addressed will ensure that your survey if required for legal, warranty or insurance claim purposes is not compromised. •Specialised equipment regularly serviced and calibrated. •Trained consultants with thermography qualifications and significant experience in electrical, mechanical and building industries •Operating to appropriate standards and guidelines. Australia / International . •Conduct surveys with due diligence to safety and addressing risk issues. •Reporting completed to a high standard that shows asset condition insights and issues to be addressed. •The thermography service company can show evidence of continued research and peer review, with ongoing professional development.

20
Board, Director and Senior Management level. Risks that an effective thermographic survey can address for organisations.
• Ensure all assets are checked •Survey is independent •Monitor faults to check for ongoing issues. •High Voltage Low Voltage •Expectation of Insurance objectives or addressing issues that are to be investigated. •Critical and high risk assets. •Performance of Assets Power Factor Correction unit – not operating creating costs

SWITCHING AND FUSES ABOVE TRANSFORMERS
21
Visible Light Image Infrared Thermal Image
These crimped connections between these transformers appear to be loose. They should be checked. A failure here would shut down the entire system.

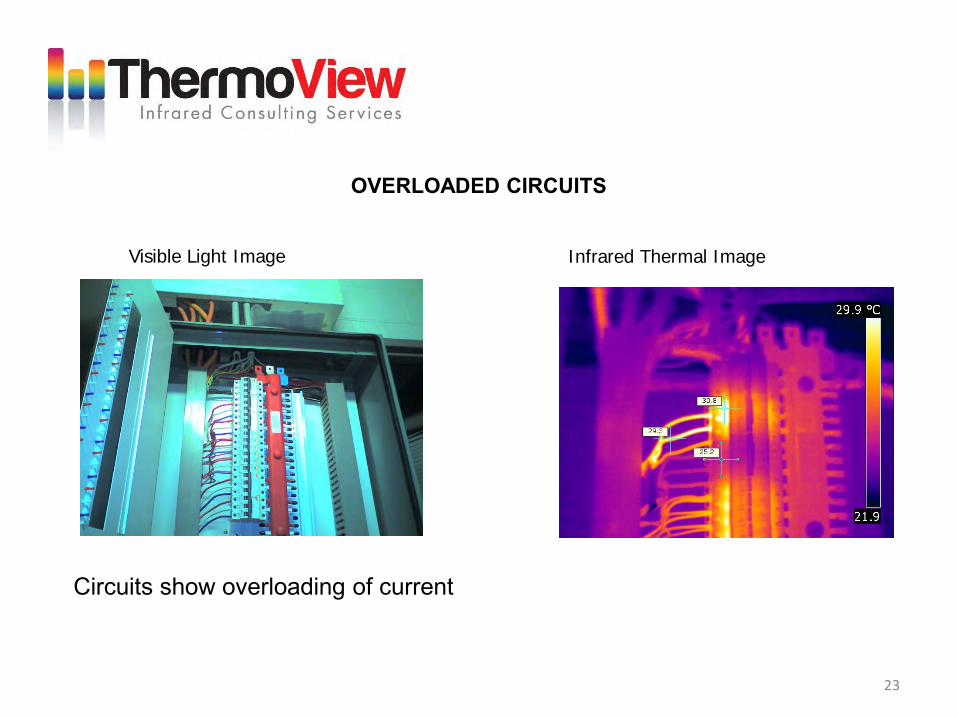
OVERLOADED CIRCUITS
22
Visible Light Image Infrared Thermal Image
Circuits show overloading of current
OVERLOADED CIRCUITS
23
Visible Light Image Infrared Thermal Image
Circuits show overloading of current

MOTORS – maintenance and performance
24
Visible Light Image Infrared Thermal Image
This motor is running too hot. Most motors are rated at 40C (104°F) over ambient for a maximum heat rise. Once a motor reaches that maximum for any length of time, the life expectancy of the motor is cut in half. For every 10° above that maximum heat rise, the life expectancy is cut in half again. Heat could take a 20 year motor and turn it into a 5 year motor pretty fast. This motor is probably overloaded or over greased.

Thermography Key Points Training Competence Calibrated Equipment Suitability of the equipment Standards Anecdotes – misdiagnosis – equipment – reporting.
25
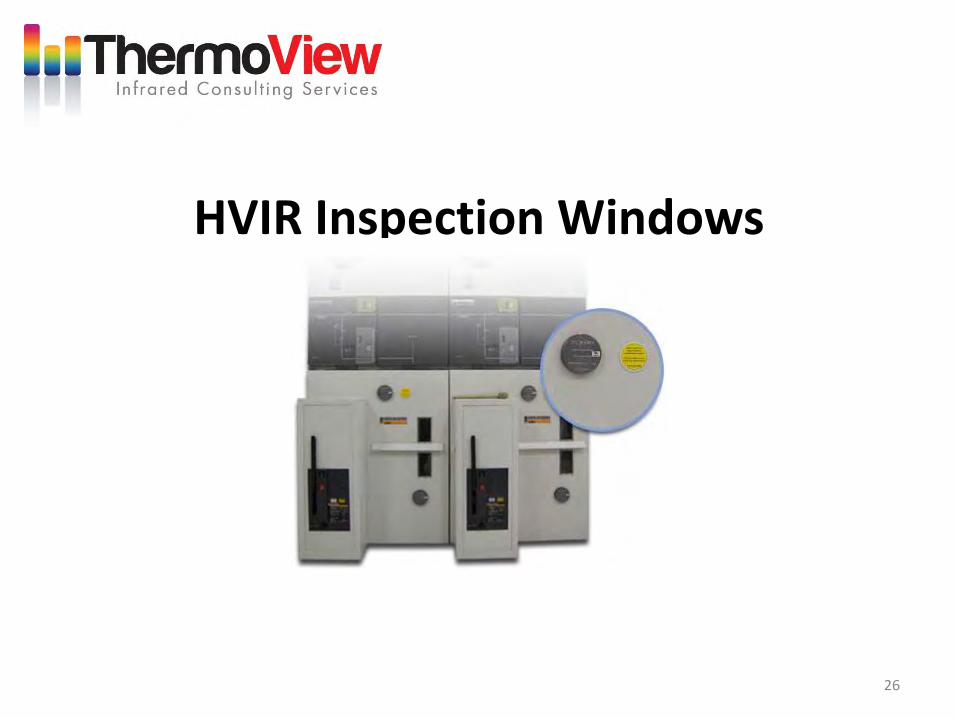
HVIR Inspection Windows
26

27
Thermographic Reporting Objectives •Approach asset surveys – Compliance or proactive. - How often to inspect. •Reporting – Your level of requirements •Maintenance – Overview of asset health What needs to be addressed with issues discovered? •Cumulative overview – Comparison online or hard copy showing past reports. •Management Overview – History of issues accessible, summary of compliance •Asset Management –Trending of individual asset performance under loading.

28
Condition Asset Knowledge is required that services the requirements of Board, Senior Executives, Maintenance Managers , Facility managers, and operation staff.

29
Overview of Reporting system. Initial Step Asset Register

30
Overview of Reporting system. Bar-coding – Full asset Register on site. Details of each asset and previous reports. Allows discussion with Client maintenance staff

31
Reporting system - Asset Performance.
Trending of asset after a number of surveys or focused study

32
Work with the Intuitive User Interface Thermal Trends intuitive user interface allows you to drill down to all of the relative information you need. Webs based access.

33
Overview of Reporting system. Routes of locations and equipment are bar coded for the automatic retrieval of each asset’s past inspection history. Reports – Options that can be generated by Thermoview • Historical Test Status Matrix for every survey completed. • Infrared Documentation pages – Issues to be addressed by priority. • Before vs. After repair function if required. • Problem Trending • Prioritized List of Problems • Cost Benefit Analysis – • Inventory Test Status • Problem Status/Aging and trends. • Visual Problems - • Equipment Baseline Trending Saving you time in analysis and asset review.

Risk and Maintenance Insurance companies require thermographic study.
Loss of Business Insurance requires Condition Monitoring
Independent Assessment
34

BUILDING AND PROCESSING SYSTEMS
35
Retrofit – New Construction – Tune Up – Commissioning Government funded study of facade of CBD building

36
Building Applications Thermography Trend toward developing professional methods
•Windows – Glazing – poor seals – facade performance •Insulation – •Walls and Frames – Thermal Bridging •HVAC •Cold Room •Plumbing – leaks blockages •Insulation lagging •Moisture •Electrical •Mechanical
Energy rating Rating against international standards. Canadian Government

37
Government Funded Study with Cundall and UNISA to create a method to evaluate the facades of CBD Buildings – 22 King William Street

FLAT ROOF LEAK DETECTION
38
Visible Light Image Infrared Thermal Image
Interior infrared survey conducted during daytime hours reveals central area saturated with moisture and in need of immediate repair.

MOISTURE CONTAMINATION
39
Visible Light Image Infrared Thermal Image
The thermogram of this vinyl-sided 3-floor apartment house clearly shows the path of a serious leak from a washing machine on the third floor, which is completely hidden within the wall.

PARTIALLY BLOCKED DRAIN PIPES
40
Visible Light Image Infrared Thermal Image
Image shows pipes becoming blocked. Further build up has likelihood of a
serious blockage and consequent damage.

WATER LEAKS
41
Visible Light Image Infrared Thermal Image
Water logged cool room insulation.
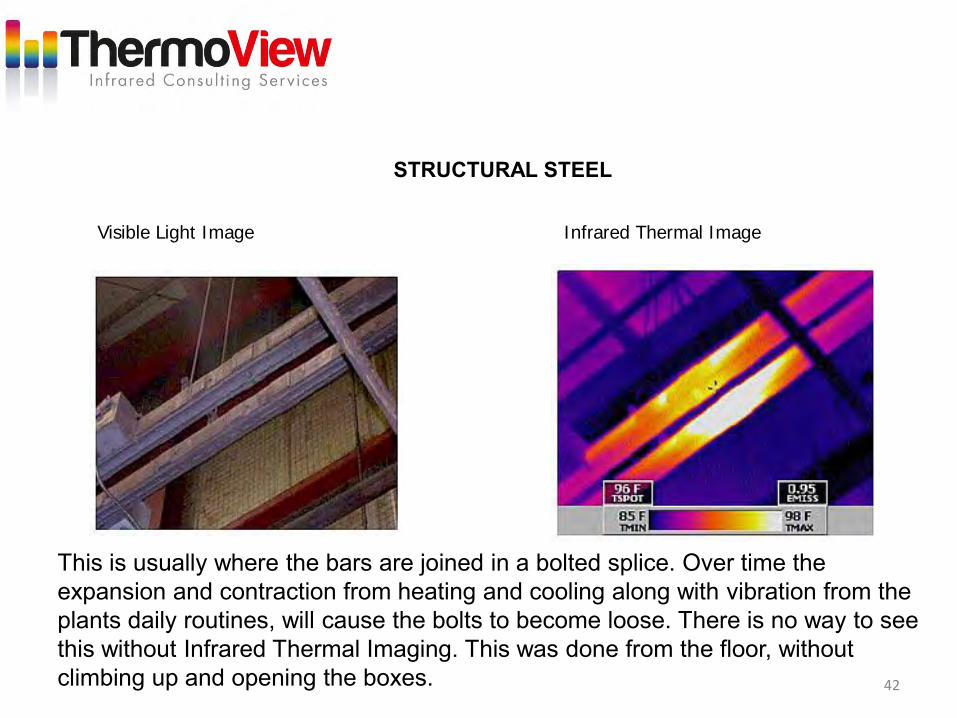
STRUCTURAL STEEL
42
Visible Light Image Infrared Thermal Image
This is usually where the bars are joined in a bolted splice. Over time the expansion and contraction from heating and cooling along with vibration from the plants daily routines, will cause the bolts to become loose. There is no way to see this without Infrared Thermal Imaging. This was done from the floor, without climbing up and opening the boxes.

CONCRETE DETERIORATION
43
Visible Light Image Infrared Thermal Image
Note the de-bonded concrete layer on viaduct parapet wall. The thermographic image has made it possible to efficiently and accurately detect the precise development of loosening or cracking concrete that can lead to concrete exfoliation in future. The safeguarding of third parties against potential disasters is dramatically improved through thermal imaging.

• Refrigeration – Maintenance – Energy Studies In alliance with Cundall Sustainability Consultants • Air Leakage in cold stores, trucks, containers and refrigerated equipment. • Degradation of insulation in panels. • Poor door seal performance. • Electrical switchboard review. • Electric Motor heating. • Moisture build up. • Roof leakage • Thermal bridging. • Insurance – risk management validation. • Cost Benefit Analysis
44

PROCESSING
45
Visible Light Image Infrared Thermal Image
Here we used Infrared Thermal Imaging to see the level of liquid in the tank. The vapour space above the liquid is warmer than the liquid and thus we see the temperature differential. The liquid will have a higher thermal capacitance (ability to store energy) than the vapour space, and that is why we can see the difference.

Summary
Review your switchboard risk profile.
46

Established since 1989 -National operations based in Adelaide
Servicing blue chip clients in Property, Mining, Manufacturing ,
Government
Independent Thermography Auditors
Highly qualified and experienced staff
Adhere to industry best practices and standards
State of the art Flir cameras, equipment and technology
Strong alliances and strategic partners Cundall, Green Ochre, CBC and overseas groups.
Member of Aust Institute of Non Destructive Testing
47

Thank You for your participation
Ken Burt Thermoview Pty Ltd
22 The Parade West
Kent Town SA 5067
Telephone 08 83636886
Mobile 0448 920 007
48