risk management by structured derivative product … economic policy review /april 1996 17 risk...
TRANSCRIPT

FRBNY ECONOMIC POLICY REVIEW / APRIL 1996 17
Risk Management by StructuredDerivative Product CompaniesEli M. Remolona, William Bassett, and In Sun Geoum
he phenomenal growth of the derivatives mar-
kets in the last decade and the spate of huge
losses there have highlighted the importance
of risk management.1 To respond to custom-
ers’ concerns about the credit risk of intermediaries in
these markets, some U.S. securities firms and non-U.S.
banks have created subsidiary derivative product compa-
nies (DPCs) that are specially structured to function as
intermediaries with triple-A credit ratings. These “struc-
tured” DPCs obtain these ratings because of the way in
which they manage risk.
The structured DPCs have developed approaches
to managing two basic types of risk—market risk and
credit risk—in an effort to minimize capital while main-
taining triple-A ratings. In particular, the DPCs hedge
market risk as fully as they can, typically by means of mir-
ror transactions with their parents. To manage credit risk,
DPCs use quantitative models so that they can measure
credit exposures precisely and allocate capital to cover just
the risks measured in a given day. In addition, the DPCs
have a contingency mechanism in place that would limit
the risk that would arise should their regular risk manage-
ment structure break down.
As subsidiaries of securities or banking firms,
structured DPCs are organized to secure credit ratings that
substantially exceed those of their parents. The nine such
DPCs currently operating around the world are rated Aaa
by Moody’s Investors Service and AAA or AAAt by Stan-
dard and Poor’s, the highest ratings of these agencies,
despite parents with no rating above single-A (Table 1).
The first such DPCs were designed to achieve triple-A rat-
ings because it was thought that many customers would
insist on dealing only with the most highly rated interme-
diaries.2 In 1995, however, four years after they first
emerged, the structured DPCs still accounted for a rela-
tively small share of markets in which the major interme-
diaries generally had substantially lower credit ratings. Are
the DPCs getting off to a slow start or are they structurally
inhibited from more significant market expansion?
T
The views expressed in this article are those of the authors and do not necessarily reflect the position of the Federal
Reserve Bank of New York or the Federal Reserve System.
The Federal Reserve Bank of New York provides no warranty, express or implied, as to the accuracy, timeliness, com-
pleteness, merchantability, or fitness for any particular purpose of any information contained in documents produced
and provided by the Federal Reserve Bank of New York in any form or manner whatsoever.

18 FRBNY ECONOMIC POLICY REVIEW / APRIL 1996
In this article, we explore the DPCs’ approaches
to risk management and the extent to which these
approaches provide competitive advantage. We begin by
characterizing the major intermediaries in the derivatives
markets and describing how they manage risk. We then
discuss the emergence of structured DPCs and their
approaches to managing risk, and explain how the
approaches minimize the capital required for triple-A rat-
ings. Finally, we discuss the possible reasons why, despite
these ratings, DPCs have not succeeded in taking a larger
share of the derivatives markets.
THE MAJOR INTERMEDIARIES IN THE
DERIVATIVES MARKETS
Over the past few years, six U.S. money-center commercial
banks and two U.S. securities firms have been the domi-
nant intermediaries in the over-the-counter markets for
derivatives, with each having a derivatives book exceeding
$1 trillion in notional value at year-end 1994 (Table 2).
Together, the six banks accounted for a total of $13 tril-
lion, or about one-third of the global over-the-counter
derivatives markets, which total perhaps $40 trillion in
notional value.3 Even the smallest derivatives book held by
these banks was sizable, approaching a notional value of
$1.3 trillion at the end of 1994.4 The two securities firms
are also major players, having the fifth and seventh largest
derivatives books in the markets when ranked with the banks.
CREDIT RATINGS
In a derivatives transaction, the intermediary’s credit rating
would, in principle, be more critical than the customer’s
credit rating because a credit-sensitive customer would deal
with credit risk not so much by “managing” it as by simply
choosing a creditworthy intermediary. When intermediar-
ies manage credit risk, they rely on a large number of coun-
terparties to pool risks so that statistical calculations can
Sources: Moody’s and Standard and Poor’s.aThe suffix “t” in five of the Standard and Poor’s ratings denotes a terminationstructure and emphasizes that counterparties to a terminating DPC face the riskthat their contracts will not run to maturity. Moody’s does not distinguishbetween the two structures.
Table 1CREDIT RATINGS OF STRUCTURED DPCSAND THEIR PARENTS/SPONSORS
Structured DPC Name
Ratinga
(S&P/Moody’s)
Parent/SponsorName
1995 Rating(S&P/
Moody’s)Merrill Lynch Derivative
Products (MLDP) AAA/Aaa Merrill Lynch A+/A1
Salomon Swapco AAAt/Aaa Salomon Brothers BBB+/Baa1
Paribas Derives Garantis(PDG) AAAt/Aaa Banque Paribas A/A1
Westpac Derivative Products(WDP) AAAt/Aaa Westpac Banking A+/A1
Morgan Stanley DerivativeProducts (MSDP) AAAt/Aaa Morgan Stanley A+/A1
Lehman Brothers FinancialProducts (LBFP) AAA/Aaa Lehman Brothers A/Baa1
Credit Lyonnais DerivativesProgram (CLDP) AAAt/Aaa Credit Lyonnais A-/A3
Tokai Derivative Products(TDP) AAA/Aaa Tokai Bank A-/A2
Sumitomo Bank CapitalMarkets DerivativeProducts (SBCM DP) AAA/Aaa Sumitomo Bank A+/A1
In 1995, four years after they first emerged, the
structured DPCs still accounted for a relatively
small share of markets in which the major
intermediaries generally had substantially
lower credit ratings.
Source: Annual reports for 1994.
Table 2DERIVATIVES AND CREDIT RATINGS OF MAJORU.S. COMMERCIAL BANKS AND SECURITIES FIRMS
InstitutionNotional Value
(Billions of Dollars)Rating
(S&P/Moody’s)Commercial banks
Chemical Bank 3,178 A+/Aa3Citibank 2,665 A+/A1Morgan Guaranty 2,473 AAA/Aa1Bankers Trust New York 2,026 A+/A1BankAmerica 1,401 A/A2Chase Manhattan Bank 1,306 A/A2
Total 13,049
Securities firmsSalomon Brothers 1,509 A-/A3Merrill Lynch 1,300 A+/A1
Total 2,809

FRBNY ECONOMIC POLICY REVIEW / APRIL 1996 19
provide reasonable estimates of actual losses. Few customers
have the luxury of being able to pool risks; the best they
can often do is choose an intermediary. The creditworthi-
ness of that intermediary, in turn, depends on how well it
manages risk.
Surprisingly, the banking and the securities firm
intermediaries that dominate the derivatives markets do
not seem to require triple-A credit ratings. In 1994, only
one bank had a triple-A rating from one of the two major
rating agencies; the rest, along with the securities firms,
were grouped in single-A territory.5 In fact, a triple-A rat-
ing may not be as important to derivatives customers as
one might think.
RISK MANAGEMENT BY THE MAJOR
INTERMEDIARIES
The major derivatives intermediaries actively manage two
basic types of risk: market risk and credit risk.6 As con-
tracts that derive their values from the market prices of
underlying assets, derivatives are volatile instruments that
can change in price very rapidly. Market risk is the expo-
sure to changes in derivatives prices, and indeed derivatives
tend to be contracts that concentrate such risk. Market
risk, in turn, gives rise to credit risk, which is the risk that
a counterparty on the losing side of a contract will default
on its obligation (Box 1 uses swaps to illustrate market and
credit risk).7 An important distinction between these risks
is that market risk can often be hedged, while credit risk
cannot so readily be hedged.8
In general, derivatives intermediaries manage their
risks to strike a balance between risk and return.9 Their
chosen trade-off typically results in some exposure to mar-
ket risk as well as to credit risk. They routinely try to hedge
a large part of their market risk but rarely can they run a
perfectly hedged derivatives book in the normal course of
business. The major intermediaries have recently developed
quantitative models to measure unhedged market risk,
summarizing it in a measure called value at risk. Intermedi-
aries mitigate credit risk largely by taking advantage of net-
ting agreements and by holding collateral.10 Even these
efforts, however, still leave intermediaries with a significant
amount of credit risk to be measured and controlled.
Market Risk
To measure market risk, the banks with the largest deriva-
tives books have invariably moved from traditional
approaches based largely on “risk buckets” to proprietary
quantitative models that track not only individual market
movements but also comovements among markets. Tradi-
tional approaches separated investments by type into vari-
ous buckets, such as residential mortgages, government
securities, and commercial loans, each of which would be
assigned a risk weight. By turning to a model-based
approach, the banks can now consolidate their exposures
into a value-at-risk summary measure, which specifies the
potential loss from adverse market movements over a spec-
ified time horizon and for a given confidence interval.11
The banks’ measures of value at risk reveal signifi-
cant exposures to market risk in the normal course of oper-
ations. The precise concept of value at risk used by
different banks varies with the chosen confidence interval
and the way volatilities and correlations are estimated
(Table 3). The confidence intervals range from 95 percent
to 99 percent. Because the internal models differ, the
value-at-risk numbers are not precisely comparable, even
given the same confidence intervals. Nonetheless, the
reported numbers show significant market risk exposure,
with likely average daily losses of up to $8 million (with a
5.0 percent probability of greater losses) for one bank and
daily losses of up to $65 million (with a 2.5 percent proba-
bility of greater losses) for another.
In general, derivatives intermediaries manage
their risks to strike a balance between risk and
return. Their chosen trade-off typically results
in some exposure to market risk as well as to
credit risk.

20 FRBNY ECONOMIC POLICY REVIEW / APRIL 1996
Percent of notional value
Swap Exposures
50 70 90 100 110 130120 150-0.6
-0.4
-0.2
0
0.2
0.4
0.6
Bond value
Source: Authors’� calculations.
60 80 140
100
St
Et max t+n ][0,Smax[0,St]
Credit Risk
Since credit risk is inherently difficult to hedge, much of the
effort to manage it involves measuring it. To measure credit
risk, intermediaries estimate both current and potential
credit exposures. Current exposures are the market values or
replacement costs of contracts with positive market value to
the intermediary at the time. These are the contracts for
Swaps, which are among the most common over-the-counterderivatives contracts, provide a simple illustration of marketrisk and credit risk. Swaps are contracts that exchange onetype of cash flow for another. For example, interest rate swapsexchange flows based on fixed interest rates for flows based onfloating interest rates. The typical swap has zero value at orig-ination, but market movements will in short order lead togains for one of the counterparties and losses for the other.The counterparty with losses will have suffered from marketrisk, while the one with gains will have benefited. At thesame time, however, the one with gains will be exposed tocredit risk, the possibility that the other counterparty coulddefault on its obligation. Because market values can change soquickly, this potential credit exposure may be quite large, andquantifying it is important.
The size of the potential credit exposure of a deriva-tives contract will depend on the volatility of the underlyingasset and on the time horizon being considered. The expectedexposure of a swap at time t looking n periods ahead can bedenoted by ct(n) and written as
ct(n) = Et max[0, st+n],
where st+n is the uncertain value of the swap n periods in thefuture.1 The value of the swap may turn negative in thefuture, but for credit exposure we care only about the positiveoutcomes, that is, about max [0, st+n].
The chart helps characterize the expected creditexposure for a plain vanilla interest rate swap from the pointof view of the fixed-rate receiver. For market valuation pur-poses, the swap is equivalent to a long position in a fixed-ratebond and a short position in a floating-rate note that is
BOX 1: THE MARKET RISK AND CREDIT RISK OF SWAPS
assumed to trade at par at inception and reset dates (Litzen-berger 1992). Hence, the swap value st is a linear function ofthe underlying asset, the fixed-rate bond, and is shown as thestraight line crossing the horizontal axis at the bond’s parvalue of 100. At initiation, the swap is typically priced to beconsistent with the bond starting at its par value, so thatst = 0. As time passes, interest rate movements will changethe underlying bond’s value, and the current swap exposurewill be given by max [0, st], which is shown by the brokenline that turns positive for bond values beyond 100. For nperiods ahead, the expectation Et max [0, st+n] behaves likethe value of a call option and is depicted by the curve. Thepotential exposure is then Et max [0, st+n] minus max [0, st],a difference that behaves like the time value of swaptions,which are call options on swaps.2
1 See Smith, Smithson, and Wilford (1990) and Hull (1993) for related discussions.
2 Simons (1993), Duffie (1994), and Hendricks (1994) explain how such exposure profiles may be estimated.
which counterparties would currently have obligations to
the intermediary and on which they could default. Credit
exposures depend significantly on the extent of netting
agreements and the amounts of collateral held. One major
intermediary, for example, reported current gross exposures
of $26.7 billion at the end of 1994.12 Netting agreements
reduced this exposure to $12.9 billion, and collateral held
FRBNY ECONOMIC POLICY REVIEW / APRIL 1996 21
Percent of notional value
Exposures on a Long-Maturity Interest Rate Swap
50 70 90 100 110 130120 150
Source: Authors’� calculations.
60 80 1400
0.5
1.0
1.5
2.0
2.5
3.0
3.5
Potential exposure
Current exposure
reduced it further, to $10.9 billion. Such current net expo-
sure represented 0.5 percent of the total notional value of
the intermediary’s derivatives.
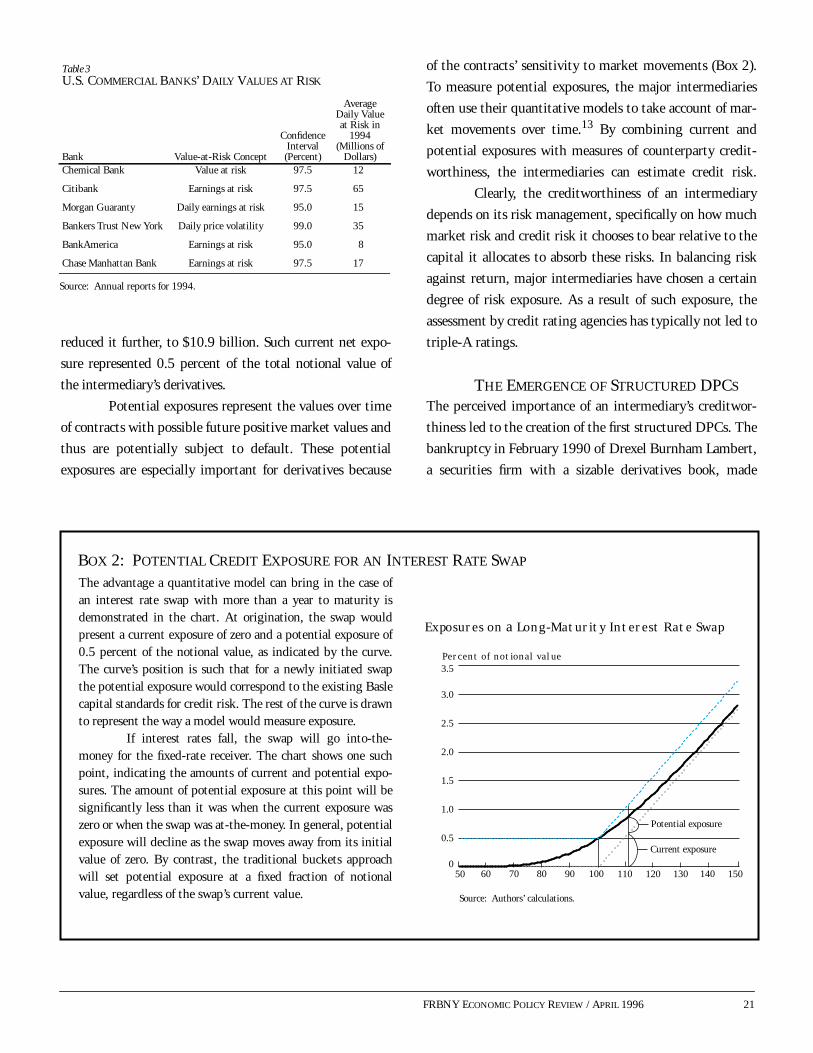
Potential exposures represent the values over time
of contracts with possible future positive market values and
thus are potentially subject to default. These potential
exposures are especially important for derivatives because
of the contracts’ sensitivity to market movements (Box 2).
To measure potential exposures, the major intermediaries
often use their quantitative models to take account of mar-
ket movements over time.13 By combining current and
potential exposures with measures of counterparty credit-
worthiness, the intermediaries can estimate credit risk.
Clearly, the creditworthiness of an intermediary
depends on its risk management, specifically on how much
market risk and credit risk it chooses to bear relative to the
capital it allocates to absorb these risks. In balancing risk
against return, major intermediaries have chosen a certain
degree of risk exposure. As a result of such exposure, the
assessment by credit rating agencies has typically not led to
triple-A ratings.
THE EMERGENCE OF STRUCTURED DPCS
The perceived importance of an intermediary’s creditwor-
thiness led to the creation of the first structured DPCs. The
bankruptcy in February 1990 of Drexel Burnham Lambert,
a securities firm with a sizable derivatives book, made
The advantage a quantitative model can bring in the case ofan interest rate swap with more than a year to maturity isdemonstrated in the chart. At origination, the swap wouldpresent a current exposure of zero and a potential exposure of0.5 percent of the notional value, as indicated by the curve.The curve’s position is such that for a newly initiated swapthe potential exposure would correspond to the existing Baslecapital standards for credit risk. The rest of the curve is drawnto represent the way a model would measure exposure.
If interest rates fall, the swap will go into-the-money for the fixed-rate receiver. The chart shows one suchpoint, indicating the amounts of current and potential expo-sures. The amount of potential exposure at this point will besignificantly less than it was when the current exposure waszero or when the swap was at-the-money. In general, potentialexposure will decline as the swap moves away from its initialvalue of zero. By contrast, the traditional buckets approachwill set potential exposure at a fixed fraction of notionalvalue, regardless of the swap’s current value.
BOX 2: POTENTIAL CREDIT EXPOSURE FOR AN INTEREST RATE SWAP
Source: Annual reports for 1994.
Table 3U.S. COMMERCIAL BANKS’ DAILY VALUES AT RISK
Bank Value-at-Risk Concept
ConfidenceInterval(Percent)
AverageDaily Valueat Risk in
1994(Millions of
Dollars)Chemical Bank Value at risk 97.5 12
Citibank Earnings at risk 97.5 65
Morgan Guaranty Daily earnings at risk 95.0 15
Bankers Trust New York Daily price volatility 99.0 35
BankAmerica Earnings at risk 95.0 8
Chase Manhattan Bank Earnings at risk 97.5 17

22 FRBNY ECONOMIC POLICY REVIEW / APRIL 1996
many derivatives customers suddenly aware of very real
credit risk (Chesler-Marsh 1990).14 Some observers pre-
dicted “credit gridlock,” whereby most derivatives cus-
tomers would refuse to deal with intermediaries other than
those with the highest credit ratings (Chew 1994). Merrill
Lynch responded to such perceived customer concerns by
organizing the first structured DPC in 1991, followed by
Salomon in 1993.
The structured DPCs set themselves apart from
nonstructured DPCs by using a special operating structure
to gain triple-A ratings. By the time Merrill Lynch and
Salomon created their subsidiaries, a variety of highly rated,
nonstructured DPCs had already been in operation, but
they had received their credit ratings by conventional
means. For example, the first group of DPCs in Table 4
obtained their credit ratings primarily by virtue of their
parents’ ratings. The second group of asset-backed DPCs
received their triple-A ratings simply by maintaining
enough capital to absorb nearly any risk they might take on.
The structured DPCs’ unusual approach to risk
management drew considerable notice in the derivatives
markets and initially led observers to believe that they
would take over much of the markets (Chew 1994; Locke
1995). However, such market success has not been evident.
The first two structured DPCs, Merrill Lynch Derivative
Products (MLDP) and Salomon Swapco, now boast the big-
gest derivatives books among the structured DPCs. How-
ever, they had derivatives books at the end of 1994 with
notional values of only $91 billion and $67 billion, respec-
tively, with each book representing less than 7 percent of
their parents’ derivatives books. To put this in greater per-
spective, the fifth largest derivatives book among the major
bank intermediaries—with a notional value of $1.4 tril-
lion—was at least fourteen times bigger than either
MLDP’s or Swapco’s books. We will attempt to explain
why, despite their superior credit ratings, structured DPCs
have so far remained relatively small players in the deriva-
tives markets.
HOW STRUCTURED DPCS MANAGE RISK
The structured DPC approach to risk management can be
characterized as an effort to minimize capital subject to the
constraint of meeting credit rating agency standards for
triple-A ratings. Such an approach has evolved to include
the complete hedging of market risk in the normal course
of operations, the precise measurement of credit exposures
combined with a dynamic allocation of capital, and the cre-
ation of an automatic “workout” process to control risk in
the event that the regular risk management process begins
to fail. Hence, with each type of risk, the DPCs have found
ways to reduce the need for capital. Credit rating agencies
consider such risk management to be so viable that they
assign structured DPCs their highest ratings, even while
assigning the parents significantly lower ratings.15
Sources: Moody’s and Standard and Poor’s.aThe suffix “t” in five of the Standard and Poor’s ratings denotes a terminationstructure and emphasizes that counterparties to a terminating DPC face the riskthat their contracts will not run to maturity. Moody’s does not distinguishbetween the two structures.b The Moody’s Aaa rating applies to Mitsui.
Table 4A VARIETY OF DPCS
Date NameDPC Ratinga
(S&P/Moody’s)Parent Rating(S&P/Moody’s)
DPCS WITH HIGHLY RATED PARENTS
5/85 Prudential Global Funding AA-/ AA-/Aa3
1/87 AIG Financial Products AAA/Aaa AAA/Aaa
5/90 Mercadian CapitalMercadian Funding
A+/NR/NR
A+/A3NR/NR
7/90 Credit Suisse Financial Products AAA/Aa2 AAA/Aa2
10/90 General Re Financial Products AAA/Aaa AAA/Aaa
12/93 Goldman Sachs Mitsui MarineDerivative Products AAA/ AAA/Aaab
ASSET-BACKED DPCS
3/92 Goldman Sachs FinancialProducts International AAA/Aaa A+/A1
7/93 Goldman Sachs FinancialProducts U.S. AAA/ A+/A1
STRUCTURED DPCS
11/91 Merrill Lynch Derivative Products AAA/Aaa A+/A1
3/93 Salomon Swapco AAAt/Aaa BBB+/Baa1
11/93 Paribas Derives Garantis AAAt/Aaa A/A1
11/93 Westpac Derivative Products AAAt/Aaa A+/A1
1/94 Morgan Stanley Derivative Products AAAt/Aaa A+/A1
1/94 Lehman Brothers Financial Products AAA/Aaa A/Baa1
10/94 Credit Lyonnais DerivativesProgram AAAt/Aaa A-/A3
2/95 Tokai Derivative Products AAA/Aaa A-/A2
4/95 Sumitomo Bank CapitalMarkets Derivative Products AAA/Aaa A+/A1

FRBNY ECONOMIC POLICY REVIEW / APRIL 1996 23
MARKET RISK AND MIRROR TRANSACTIONS
A common feature of structured DPCs is the elimination of
market risk in the normal course of operations. Such a DPC
would typically insulate itself from market risk by engag-
ing in collateralized hedging transactions—known as mir-
ror transactions—with its parent or an affiliated company.
The DPC would undertake one such transaction each time
it entered into a transaction with a customer. The parent is
required to post collateral to cover the net market value of
all the mirror transactions, enabling the DPC to avoid any
credit risk from its parent.16 Because the collateral is based
on the net exposure to a single counterparty, the amount of
collateral required would be much less than if the parent
collateralized each transaction with customers.
We illustrate how a mirror transaction works in
conjunction with a simple interest rate swap transaction,
since the DPCs are primarily vehicles for such transac-
tions (Exhibit 1). In this example, the DPC is the fixed-
rate receiver and the customer is the floating-rate receiver.
The DPC faces market risk through its exposure to a pos-
sible rise in interest rates and a resulting drop in the
swap’s market value. To hedge against this risk, the DPC
simultaneously engages in a mirror transaction with its
parent, in which it now becomes the floating-rate receiver
and the parent becomes the fixed-rate receiver. In this
way, the DPC is insulated from market risk.
The balance sheets of MLDP and Swapco also illus-
trate the role of mirror transactions (Table 5). The DPCs’
main assets are their customer derivative receivables and
affiliate derivative receivables, which are respectively the
marked-to-market values of the customer transactions and
mirror transactions that have positive values. The DPCs’
main liabilities are their customer derivative payables and
affiliate derivative payables, which are respectively the
marked-to-market values of the customer and mirror trans-
actions that have negative values. At the end of 1994,
MLDP was “out-of-the-money” (that is, the derivatives had
lost value) in its mirror transactions, which are thus reported
as affiliate payables of $553 million. In this case, collateral
was not required from the parent. MLDP’s affiliate payables
plus customer payables of $1,320 million exactly match its
customer receivables of $1,873 million. In contrast, Swapco
was “in-the-money” (the contracts had gained value) in its
mirror transactions, which are reported as affiliate receivables
of $154 million. In this case, the parent posted collateral
amounting to $154 million. The amount of affiliate receiv-
ables added to the amount of customer receivables equals the
amount of customer payables.
We should note that two of the structured DPCs,
Paribas Derives Garantis and the Credit Lyonnais Deriva-
tives Program, do not use mirror transactions because they
deal with customers not as derivatives counterparties but
as providers of a credit enhancement in the form of a third-
party guarantee, with the parent or sponsor still serving as
the derivatives intermediary.17 In this way, the DPCs
avoid market risk even as their guarantees expose them to
credit risk.
Source: Annual reports for 1994.
Table 5BALANCE SHEETS FOR MLDP AND SWAPCOMillions of Dollars at December 1994
Balance Sheet MLDP SwapcoTotal notional book 90,691.0 66,844.0
AssetsCash and investments 362.1 432.0Customer derivative receivables 1,873.3 874.6Affiliate derivative receivables 154.4Other assets 15.0 63.4Total assets 2,250.4 1,524.3
LiabilitiesCustomer derivative payables 1,320.3 1,029.0Affiliate derivative payables 553.0Other liabilities 9.0 214.8Total liabilities 1,882.3 1,243.8
Stockholder’s equity 368.1 280.5

24 FRBNY ECONOMIC POLICY REVIEW / APRIL 1996
CREDIT RISK AND CAPITAL
With the mirror transactions providing insulation from
market risk, structured DPCs are still exposed to the credit
risk inherent in their transactions with customers. DPCs
earmark capital to manage such credit risk. Again using
Exhibit 1 as our example, we see that a decline in interest
rates will present the DPC with a gain in the market value
of its swap with the customer, but this customer may
default on its obligation. The required amount of capital to
manage this risk is the amount adequate for the DPC to
absorb such a customer default and still meet its obliga-
tions to its other customers with a default probability or an
expected loss rate consistent with what the rating agencies
expect for triple-A borrowers. Since the DPCs rely on their
internal models to determine the required capital, addi-
tional capital is set aside for model risk, or the risk that the
models may not capture credit exposures adequately.18
Again, we should note that the two DPCs that
rely on a guarantee structure, Paribas Derives Garantis and
the Credit Lyonnais Derivatives Program, deal with credit
risk in the same way the other structured DPCs do, using
internal models to measure potential exposures and main-
taining sufficient capital to absorb credit losses consistent
with their triple-A ratings. One advantage of the guarantee
structure is that insurance coverage for individual custom-
ers may be explicitly specified in terms of net exposures,
even for jurisdictions where netting agreements would oth-
erwise not be enforceable.
Various portfolio restrictions provide additional
protection against credit risk. For example, structured
DPCs bar themselves from dealing with counterparties
below investment grade and place limits on gross and net
exposures to the counterparties with whom they deal. In
some cases, the limits may be exceeded if collateral is

FRBNY ECONOMIC POLICY REVIEW / APRIL 1996 25
posted by third parties. The DPCs also deal only in the
types of derivatives that do not pose valuation or hedging
problems. The capital, collateral, and portfolio restrictions
are designed to ensure that the structure remains viable
even in the face of unusual strain. MLDP’s capital and
exposure limits, for example, are designed to allow it to
withstand the simultaneous default of seven double-A-
rated counterparties.
Using a Model to Measure Credit Risk
Structured DPCs rely on quantitative models that attempt
to measure credit risk precisely (Exhibit 2). Such a model
would run Monte Carlo simulations, which involve gener-
ating a large number of possible future paths for every rele-
vant market variable—mainly interest rates and exchange
rates—based on estimated volatilities and correlations
among the variables. Using transaction data, the model
would evaluate each transaction along each path and thus
measure the DPC’s exposure to each counterparty.
For mirror transactions, the net current exposure
would determine the amount of collateral to be posted by
the parent. The net potential exposure would represent a
measure of value at risk for an event in which the parent is
unable to sustain the mirror transactions, and sensitivity
collateral would cover this market risk. For customer trans-
actions, the model would provide potential credit exposure
by counterparty, netting the exposures where appropriate.
(Box 2 illustrates the advantage of having such a model in
the calculation of potential exposures.) The model would
then simulate counterparty defaults based on historical
probabilities to calculate possible losses to the DPC. The
default probabilities are typically assumed to be indepen-
dent of market movements.19 The potential credit losses
would then set the required amount of capital.
Dynamic Allocation of Capital
The structured DPCs minimize their required capital by
allocating an amount that is just enough to cover, with a
high degree of confidence, credit risks measured over a
short time horizon.20 The choice of time horizon has
resulted in two types of capital rules: a static rule and a
dynamic rule. Of the nine structured DPCs in Table 6,
MLDP is the only one that operates under the static rule,
and is in the process of developing a dynamic model. The
static rule imposes a time horizon of one quarter when cal-
culating default probabilities and expected credit losses.
Correspondingly, MLDP adjusts its capital requirements
quarterly, although it monitors them much more fre-
quently. The eight other DPCs operate under a dynamic
capital rule, which shortens the time horizon for calculat-
ing default probabilities and expected credit losses to ten
trading days. Under this rule, the eight DPCs adjust their
capital requirements daily.
STRUCTURAL RISK AND WORKOUT PROCESSES
The various operating components of a structured DPC are
so critical to one another that the failure of one component
would reexpose the DPC to rising amounts of market risk.
The DPC limits its exposure to such risk by triggering a
workout process, in which the DPC would effectively self-
Sources: Moody’s and Standard and Poor’s.
Table 6CAPITAL OF TRIPLE-A DERIVATIVE PRODUCT COMPANIES
Name Actual Capital Minimum Required Capital at Inception Capital RuleMerrill Lynch Derivative Products $368 million $300 million StaticSalomon Swapco $285 million $175 million DynamicWestpac Derivative Products $200 million $100 million surety bond + $50 million DynamicMorgan Stanley Derivative Products $150 million $150 million DynamicLehman Brothers Financial Products $200 million $150 million DynamicParibas Derives Garantis FFr 800 million ($140 mil.) FFr 800 million DynamicTokai Derivative Products £100 million ($160 mil.) £100 million DynamicCredit Lyonnais Derivatives Program $200 million surety bond+capital
of Credit Lyonnais$200 million surety bond+capital
of Credit Lyonnais DynamicSumitomo Bank Capital Markets Derivative Products $300 million $300 million Dynamic

26 FRBNY ECONOMIC POLICY REVIEW / APRIL 1996
destruct, albeit in an orderly way. The DPC deals with the
market risk during the workout process by holding addi-
tional collateral from its parent or sponsor. Each of the
DPCs has adopted one of two workout structures: a con-
tingent manager (continuation) structure or an early termi-
nation structure.
In the event of a structural failure, DPCs with a
contingent manager structure would refrain from taking
on new transactions and turn over operations to a predesig-
nated contingent manager. The new manager would ser-
vice the contracts and manage the risks of the whole
derivatives book until the last contract matured. DPCs
with an early termination structure would end all contracts
within a few weeks, settling each contract for cash on the
basis of valuations at mid-market prices.21 The customers
holding out-of-the-money contracts would make the first
payments, and the DPC would use the proceeds to pay off
the in-the-money contracts. Under either structure, the
mirror transactions with the parent would be terminated
early and settled for cash, an action that might involve liq-
uidation of collateral. Standard and Poor’s attaches the suf-
fix “t” to its ratings of DPCs with the termination
structure, while Moody’s does not distinguish between
workout structures in its ratings.22
Choosing the Workout Structure
Customers may have reasons to choose one DPC over
another on the basis of workout structure. Structured
DPCs let customers know from the outset which workout
process will apply. This prespecification of the workout
process is an important innovation.
Workouts similar to those specified under the con-
tingent manager and early termination structures have
been used before. The main methods by which derivatives
were handled in the five largest defaults involving deriva-
tives held by financial institutions are reported in Table 7.
In three of the defaults, the derivatives books were trans-
ferred to another financial institution in much the same
way a DPC would proceed under a contingent manager
structure. In two of the defaults, the derivatives were ter-
minated early, just as a DPC would treat its contracts
under the termination structure. In no case, however, was
the eventual workout process known by the customers at
the origination of their contracts.
Customers with rules that bind them to dealing
only with triple-A counterparties may prefer the early ter-
mination structure. Others, wishing to avoid replicating a
The various operating components of a
structured DPC are so critical to one another
that the failure of one component would
reexpose the DPC to rising amounts of market
risk. The DPC limits its exposure to such risk
by triggering a workout process, in which the
DPC would effectively self-destruct, albeit
in an orderly way.
Sources: Asquith and Cunningham 1990; Swaps Monitor, March 5, 1990.
Table 7DEFAULT EVENTS AND DISPOSITION OF MAJOR DERIVATIVES BOOKS
Defaulting Financial Institution Event DateNotional Amount of
DerivativesNumber of
CounterpartiesMain Method of
DispositionProblem
CounterpartiesDevelopment Finance Corp. of New Zealand 10/89 NZ$4 billion 60 Transfer to Barclays 1Drexel Burnham Lambert 2/90 US$30 billion 200 Early termination 15British and Commonwealth 4/90 £2-3 billion 50 Transfer to Barclays 1 or 2Bank of New England 1/91 US$6.7 billion 387 Transfer to FDIC
bridge bankNone
Confederation Life 8/94 C$23 billion 50-100 Early termination N.A.

FRBNY ECONOMIC POLICY REVIEW / APRIL 1996 27
liquidated contract, may prefer the contingent manager
structure. In the case of swaps and forwards, the standard
contracts have zero value at inception, so replicating such a
contract when it no longer has zero value would involve
going to the “off market,” where bid-ask spreads are wider.
The more active a customer is in the derivatives markets,
the more experience it would have with early termination
clauses and with the off market; thus, it would be less likely
to harbor qualms about an early termination structure.
Trigger Events
Several types of events would trigger a workout under the
two different structures (Table 8). Under a contingent
manager structure, a parent’s failure to post collateral, a
serious downgrading of the parent’s credit rating on short-
term debt, or a default or bankruptcy by the parent would
lead to the DPC’s self-destruction. Under an early termina-
tion structure, a parent’s failure to meet capital or collateral
obligations, a serious downgrading of the DPC’s credit rat-
ing, or default or bankruptcy by the parent would result in
the DPC’s self-destruction. The parent’s short-term debt
rating tends to be more relevant than its long-term debt
rating under the contingent manager structure because
liquidity is a more important consideration.
By triggering a workout short of its default, a
DPC may avoid problems that arise when out-of-the-
money counterparties walk away from intermediaries that
had defaulted on other contracts. In at least three cases,
major defaulting financial institutions have been beset
with problem customers who walked away from out-of-
the-money contracts (Table 7). In the most serious case, 15
of Drexel’s approximately 200 derivatives counterparties
invoked limited two-way payments and refused to honor
their out-of-the-money contracts. Appendix I provides a
fuller description of problems associated with defaults by
intermediaries.
Sensitivity Collateral
The absence of mirror transactions during the workout
process would expose DPCs to market risk. To deal with
such risk, DPCs hold additional collateral, called sensitiv-
ity collateral. The amount of such collateral is derived from
a value-at-risk calculation, which depends on the composi-
tion of the DPC’s derivatives book and the chosen workout
structure.
An early termination structure implies a time
horizon for market risk of only a few weeks, and exposure
to market risk ends with liquidation of the portfolio. A
contingent manager structure implies a longer horizon
because of the time required for the contingent manager to
reconstruct a hedge for the derivatives book in the absence
of mirror transactions. Moreover, since the book must be
managed until the last contract has expired, even for a
book hedged against market risk, out-of-the-money coun-
terparties will still pose a credit risk. Thus, for otherwise
equivalent derivatives books, the early termination struc-
Sources: Moody’s and Standard and Poor’s.a Swapco, MLDP, and MSDP have a two-day grace period to meet the deficiency.b The trigger for TDP is the downgrade of Tokai Bank below Moody’s rating of Baa2.c WDP has three unique provisions: a downgrade of Westpac below BBB/Baa, a sale of WDP that results in a downgrade, or a downgrade of Australia’scredit rating below the Standard and Poor’s rating of A3.
Table 8TRIGGER EVENTS AT DPCS
Type of Structure
Failure of Parent toMeet CapitalObligations
Failure of Parent toPost Required
CollateralDowngrade of Parent
(S&P/Moody’s)Downgrade of DPC
(S&P/Moody’s)Bankruptcy or Defaultof Parent or Affiliate
Action byRegulatory Agency
Contingent manager(MLDP, LBFP, TDP,and SBCM DP) Yesa Below A-2 / P-2b Yes
Early termination(Swapco, WDP, PDG,MSDP, and CLDP) Yesa Yesa Below A- / A3c Yes WDP and PDG
28 FRBNY ECONOMIC POLICY REVIEW / APRIL 1996
ture requires less sensitivity collateral than the contingent
manager structure does.
TRIPLE-A RATINGS AND COMPETITIVE
ADVANTAGE
The emergence of structured DPCs in 1991 was viewed as
a threat to bank dominance of the over-the-counter deriva-
tives markets, particularly after the recent downgrades of a
few banks’ credit ratings (Locke 1995).23 Market observers
initially thought that a growing number of derivatives cus-
tomers would insist on triple-A-rated intermediaries.
However, four years after they first emerged, the DPCs had
yet to make significant inroads into the derivatives mar-
kets, despite their triple-A ratings. The issue examined in
this section is whether the DPCs’ risk management tech-
niques truly give them a competitive advantage. This
advantage would depend on the real importance of a DPC’s
triple-A rating in the minds of customers and on the
amount of capital required to maintain the rating.
THE IMPORTANCE OF TRIPLE-A RATINGS
Thus far, every structured DPC has been created to obtain a
triple-A credit rating. Indeed, the DPCs are set up to cease
operations as intermediaries once the rating can no longer
be maintained. However, a closer look at the growth of
derivatives on the books of the major U.S. intermediaries
shows that a triple-A rating contributes to, but is by no
means essential for, success in the derivatives business. For
instance, if we examine the growth rate of swaps and
options at the major intermediaries, we see no clear rela-
tionship between high credit ratings and high growth rates
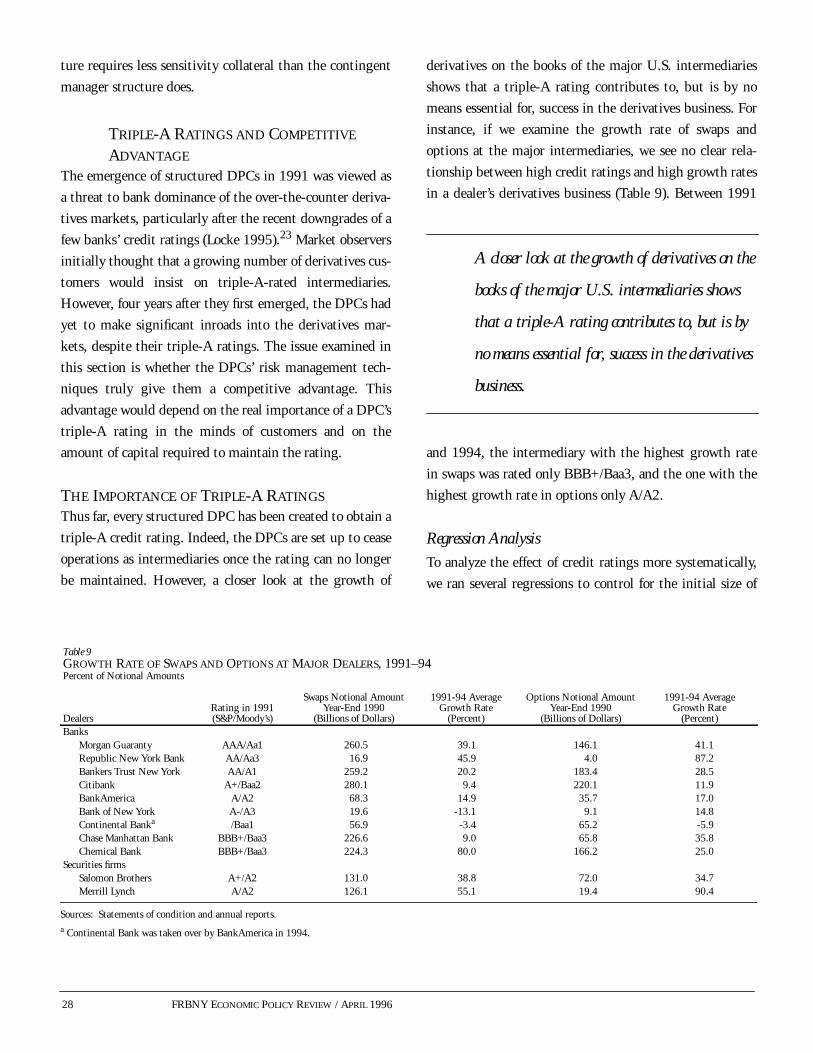
in a dealer’s derivatives business (Table 9). Between 1991
and 1994, the intermediary with the highest growth rate
in swaps was rated only BBB+/Baa3, and the one with the
highest growth rate in options only A/A2.
Regression Analysis
To analyze the effect of credit ratings more systematically,
we ran several regressions to control for the initial size of
Sources: Statements of condition and annual reports.a Continental Bank was taken over by BankAmerica in 1994.
Table 9GROWTH RATE OF SWAPS AND OPTIONS AT MAJOR DEALERS, 1991–94Percent of Notional Amounts
DealersRating in 1991(S&P/Moody’s)
Swaps Notional AmountYear-End 1990
(Billions of Dollars)
1991-94 AverageGrowth Rate
(Percent)
Options Notional AmountYear-End 1990
(Billions of Dollars)
1991-94 AverageGrowth Rate
(Percent)Banks
Morgan Guaranty AAA/Aa1 260.5 39.1 146.1 41.1Republic New York Bank AA/Aa3 16.9 45.9 4.0 87.2Bankers Trust New York AA/A1 259.2 20.2 183.4 28.5Citibank A+/Baa2 280.1 9.4 220.1 11.9BankAmerica A/A2 68.3 14.9 35.7 17.0Bank of New York A-/A3 19.6 -13.1 9.1 14.8Continental Banka /Baa1 56.9 -3.4 65.2 -5.9Chase Manhattan Bank BBB+/Baa3 226.6 9.0 65.8 35.8Chemical Bank BBB+/Baa3 224.3 80.0 166.2 25.0
Securities firmsSalomon Brothers A+/A2 131.0 38.8 72.0 34.7Merrill Lynch A/A2 126.1 55.1 19.4 90.4
A closer look at the growth of derivatives on the
books of the major U.S. intermediaries shows
that a triple-A rating contributes to, but is by
no means essential for, success in the derivatives
business.

FRBNY ECONOMIC POLICY REVIEW / APRIL 1996 29
the derivatives books, the yearly growth rates of the overall
markets, and whether or not the intermediary is a bank
(Appendix II). We used annual growth rates in the
notional value of derivatives at each dealer as the depen-
dent variable. Caution should be exercised in interpreting
the results because of the small sample size and the rapid
growth of the overall derivatives markets during the
period. Nonetheless, the regressions failed to show that
triple-A ratings carry decisive importance in the deriva-
tives markets. When we assigned numerical values to the
ratings (an AAA rating received 9 and a BBB rating 0), the
regressions showed that higher ratings do tend to be associ-
ated with higher derivatives growth rates. However, when
we used dummy variables to find threshold effects in the
ratings, the regressions showed that a double-A threshold
explained derivatives growth rates better than a triple-A
threshold. These results suggest that the expected wide-
spread insistence on triple-A ratings by derivatives cus-
tomers did not materialize.
Effect of Workout Risk
Even when derivatives customers value an intermediary’s
triple-A rating, they may not regard a structured DPC’s
rating as the equal of other triple-A ratings.24 The DPC’s
rating may be differently regarded because the workout risk
of such a DPC corresponds more closely to the parent’s typ-
ically single-A rating. The pure risk of default or credit loss
allows the credit rating agencies to assign the triple-A rat-
ings. The integrity of the DPC’s structure, however,
depends on its parent’s ability to sustain the mirror transac-
tions and the capital and collateral requirements. Therefore,
the risk of losing such parental support corresponds to the
parent’s rating. This loss of support triggers an automatic
workout process that may cause difficulties for the DPC’s
customers, even in the absence of default or credit loss.
Under a contingent manager structure, the work-
out process at the very least would cost DPC customers a
dealer relationship. The customers would be holding con-
tracts with an intermediary that is no longer rated triple-A
and with whom they can no longer engage in new transac-
tions. Under a termination structure, the concerted liquida-
tion of contracts would cause the DPC’s customers who still
need the derivatives to find ways to replicate terminated
contracts and the out-of-the-money customers to make
lump-sum cash payments on the spot.25 Moreover, the
workout process would proceed in markets that might still
be reeling from the shock that led to the DPC’s parent’s
financial distress or in markets coping with that distress.
These market conditions could contribute to problems of
liquidity for derivatives, making it difficult for a DPC’s
contingent manager to rehedge the book or for customers
with terminated contracts to replicate their contracts.
Economies of Scope
Rather than focus on triple-A credit ratings, some deriva-
tives customers may instead choose a lower rated bank
because of economies of scope between derivatives and
other bank products. The major bank intermediaries have
affiliated securities firms, called Section 20 subsidiaries,
which the Securities and Exchange Commission regulates
as broker-dealers. Given the regulatory “firewalls” between
banks and their Section 20 affiliates, it is significant that
the banks, not the securities affiliates, are uniformly the
ones that serve as derivatives intermediaries. The banks’
decision to locate the derivatives business in the banking
part of the organization is indirect evidence of the impor-
tance of economies of scope between derivatives and other
bank products.
In general, these economies of scope may arise
from banks’ informational advantages. Banks have tradi-
tionally specialized in the management of credit risk, and
information about such risks can help with managing the
Given the regulatory “firewalls” between banks
and their Section 20 affiliates, it is significant
that the banks, not the securities affiliates, are
uniformly the ones that serve as derivatives
intermediaries.

30 FRBNY ECONOMIC POLICY REVIEW / APRIL 1996
credit risk of derivatives (Edwards and Mishkin 1995).
Understanding a customer’s credit needs may also help a
bank understand the customer’s hedging needs, allowing
the bank to propose derivatives to help customers hedge
the market risk of other bank products. Large banks, for
example, dominate the international syndicated loan mar-
ket, and interest rate and currency swaps may often be use-
ful for hedging syndicated loans.
THE CAPITAL REQUIRED FOR A DPC’STRIPLE-A RATING
The cost of a structured DPC’s triple-A rating is repre-
sented largely by the amount of capital required to main-
tain the rating. In competing with non-triple-A
intermediaries for customers who do not insist on the
higher rating, the DPCs would ordinarily face a cost disad-
vantage if they simply managed risks the way other inter-
mediaries did.26 In principle, the DPCs’ risk management
techniques may allow them to operate with less capital than
non-triple-A intermediaries for similar derivatives transac-
tions. In practice, however, the DPCs seem to operate with
considerably more capital than other intermediaries.
DPC Capital and Bank Capital
Under current rating agency standards for triple-A ratings,
the DPCs’ actual capital requirements appear more strin-
gent than those for banks. To meet the minimum require-
ments for banks under the 1988 Basle Accord, for
example, in 1994 MLDP would have needed a minimum
of $40 million in tier 1 capital, only about one-ninth the
amount of capital it actually had (Table 10). Similarly,
Swapco would have needed only one-seventh the amount it
actually had.
In comparing DPC capital with bank capital, it
should be noted that banks often hold capital well in excess
of the Basle Accord’s minimum. The well-capitalized
double-A banks, for example, hold tier 1 capital amount-
ing to as much as two-and-a-half times the minimum. The
single-A banks hold capital amounting to about double the
Basle requirement. Nonetheless, such capital still falls
short of the capital held by DPCs, especially when mea-
sured relative to risk. The banks allocate capital to deal
with both market risk and credit risk, while the DPCs allo-
cate capital largely for credit risk because the mirror trans-
actions already take care of market risk.
Capital for a Double-A Rating
If a triple-A rating requires so much capital and the rat-
ing is not so critical in the minds of customers, why don’t
the structured DPCs settle for a double-A rating? We may
estimate what the DPC capital requirement would be for
a double-A rating by relying on the expected loss
approach used by Moody’s (Box 3). Our calculations sug-
gest that DPCs pursue triple-A ratings because these do
not require much more capital than double-A ratings
Sources: Annual reports for 1994; FRBNY staff estimates based on Moody’sexpected loss rates of 0.002 percent, 0.02 percent, 0.04 percent, 0.14 percent,0.24 percent, for Aaa, Aa1, Aa2, A1, and A2 ratings, respectively. Default rates are0.7 percent, 0.9 percent, and 2.0 percent for Aaa, Aa, and A ratings, respectively.
Table 10IMPLIED CAPITAL BY RATING AND REQUIRED CAPITALMillions of Dollars
Company NameActualCapital
Required BISTier 1 Capital
Implied AaCapital
Implied ACapital
Merrill LynchDerivative Products 368.1 40.0 317.4 192.3
Salomon Swapco 280.5 39.0 253.7 187.5Morgan Guaranty 8,265 3,408 8,265 —Bankers Trust New York 4,372 1,922 4,372 —Citibank 16,919 8,676 — 16,919Chase Manhattan Bank 7,759 3,739 — 7,759Chemical Bank 10,003 4,880 — 10,003
In principle, the DPCs’ risk management
techniques may allow them to operate with
less capital than non-triple-A intermediaries
for similar derivatives transactions. In
practice, however, the DPCs seem to operate
with considerably more capital than
other intermediaries.

FRBNY ECONOMIC POLICY REVIEW / APRIL 1996 31
(Table 10). For example, MLDP required $368 million for
its Aaa rating. Had it settled for an Aa, it would still have
needed $317 million, not a huge savings in capital. An A
rating would have represented substantially more in sav-
ings, but its parent already had that rating. Similarly,
Swapco would not have saved very much by settling for an
Aa rating. Moreover, for MLDP and Swapco, the fixed
costs of setting up the DPC, including the cost of lengthy
discussions with the credit rating agencies, should be
about the same for double-A and triple-A ratings.
Our analysis suggests that after all the effort to
keep required capital to a minimum, the structured DPC
approach to risk management still demands so much more
capital than is required by non-triple-A intermediaries that
the approach is unlikely to lend the DPCs a competitive
edge in the derivatives markets as a whole. Moreover,
DPCs would apparently not save much capital by simply
settling for a lower rating. In attracting customers who
must deal with a triple-A intermediary, the DPCs would
enjoy a clear advantage, but beyond this niche of customers
they would face a significant cost disadvantage.
CONCLUSION
The first structured DPCs created quite a stir in the deriv-
atives markets in the early 1990s because it was thought
that their unique approach to managing risks would allow
them to become major intermediaries in the markets. The
DPCs’ brand of risk management allowed them to gain
triple-A credit ratings with as little capital as possible,
and market observers believed that increasingly credit-
sensitive customers would flock to them. However, the
DPCs have so far failed to live up to that promise. Banks
without triple-A ratings are still among the dominant
market players, and even the DPCs’ parents, with at best
single-A ratings, engage in considerably more derivatives
transactions.
The structured DPCs manage risks in three ways:
they hedge market risks as fully as possible by means of
mirror transactions with their parents; they manage credit
risks—which are inherently difficult to hedge—by using
quantitative models to estimate exposures precisely and by
allocating capital to just cover the risks as measured daily;
and they prepare for the possibility that their structure
may someday fail by providing an automatic workout pro-
Under the expected loss approach used by Moody’s, theexpected loss rate is the product qL, where q is the probabilityof the DPC defaulting and L is the loss rate given the default.The loss rate L is in turn calculated as
L = (D - K)/P,
where D is the loss from the defaulting receivables that wouldcause the DPC to default, K the amount of the DPC’s capital,and P the amount of customer payables.
To satisfy the threshold for a triple-A rating, theexpected loss rate faced by a DPC customer may not exceed0.002 percent over a ten-year horizon (Gluck and Clarkson1993). The DPC starts with a trial amount of capital for Kand then uses its internal model to calculate the default prob-ability q and the receivable losses D for its derivatives book. Ifthe resulting expected loss exceeds 0.002 percent, the DPCcontinues to add more capital and to recalculate the expected
BOX 3: CALCULATING A DPC’S REQUIRED CAPITAL
loss until it reaches 0.002 percent. The resulting amount ofcapital at the threshold is then the requirement for the triple-A rating.
Knowing the triple-A DPC’s expected loss rate, itscapital, its default probability, and its potential amount of cus-tomer payables, we derive an estimate of D, or the implied lossfrom defaulting receivables, for the DPC’s derivatives book.We then recalculate the required amount of capital for a DPCwith the same book but one that would be rated only double-A or single-A by using the corresponding expected loss ratesand default probabilities (Fons, Carty, and Kaufman 1994).Strictly speaking, this calculation would be incorrect, becausethe estimate for D, as well as the loss rate L and default proba-bility q, would depend on the amount of capital. Nonetheless,if we assume that D, L, and q are relatively insensitive to theamount of capital, such a calculation would give us a roughorder of magnitude for the capital requirements.

32 FRBNY ECONOMIC POLICY REVIEW / APRIL 1996
cess designed to limit the ensuing risk.
Considering the strength of their risk manage-
ment, why haven’t structured DPCs taken over a larger
share of the derivatives markets? Our analysis suggests two
basic reasons. First, credit gridlock did not materialize, and
the DPCs’ triple-A ratings, in particular, did not become a
decisive factor in most customers’ choice of intermediaries.
In this regard, customers may not have been as comfortable
with the DPCs’ ratings as with other triple-A ratings
because the DPCs are subject to a workout risk correspond-
ing to their parents’ typically single-A ratings. Second,
despite their efforts to save on capital, under current rating
agency standards, the DPCs still faced more demanding
capital requirements than those faced by major intermedi-
aries without triple-A ratings. Settling for lower ratings
would not have saved the DPCs much capital. The DPCs
did not just get off to a slow start; they seem to have been
structurally inhibited from taking over a large share of the
markets.
Nonetheless, the structured DPCs continue to
receive capital support from their parents, and new ones
will continue to be formed. In the near future, these DPCs
are unlikely to dominate the markets as derivatives inter-
mediaries. Instead, they will serve a market niche consist-
ing of the relatively few, albeit important, customers who
insist on triple-A ratings.

APPENDIX I: RECENT CASES OF DERIVATIVES DEFAULTS
APPENDIX FRBNY ECONOMIC POLICY REVIEW / APRIL 1996 33
The recent history of defaults or dispositions of derivatives
portfolios points out many of the dangers that can arise
when an intermediary defaults. Those dangers include the
risk that the defaulting party will not be able to obtain full
market value when it transfers its portfolio to an underin-
formed buyer. In addition, limited two-way payment
options give rise to “walk-away” risk because counterpar-
ties can attempt to void their obligations to defaulting par-
ties. Finally, some regulators have the authority to “cherry
pick” from the portfolio and leave the in-the-money coun-
terparties at the mercy of the bankruptcy courts. However,
it appears that the structured DPCs have specific provisions
and safeguards designed to mitigate these risks.
The contingent manager provisions of the DPCs
would have helped Development Finance Corporation of
New Zealand (DFC) and British and Commonwealth transfer
their derivatives portfolios more easily. When DFC trans-
ferred its contracts to Barclays Bank, it had to make a pay-
ment to Barclays based on the mark-to-market value of the
portfolio. In the case of British and Commonwealth, local cli-
ent confidentiality laws prohibited disclosure of the names of
its counterparties to potential purchasers of its portfolio.
In each case, the contracts signed by counterpar-
ties of Merrill Lynch Derivative Products and Lehman
Brothers Financial Products would have specified that the
transactions be transferred automatically to a previously
agreed-upon contingent manager. Thus, there would be no
need for the self-destructing DPC to “settle” the book with
the contingent manager. Moreover, the contingent man-
ager would have been familiar with the book and prepared
to assume the day-to-day operations of the DPC.
The contingent manager structure also mitigates
the risk from limited two-way payments that was experi-
enced by DFC, British and Commonwealth, and Drexel
Burnham Lambert. Under limited two-way payments, the
nondefaulting counterparty is not obligated to make pay-
ments to the defaulting counterparty, regardless of the
market value of the swap. Assignment to mutually agreed-
upon contingent managers would probably prevent such
clauses from being exercised.
More important, both terminating and continua-
tion DPCs insist on full two-way payments clauses for the
settlement of terminated contracts. This means that
regardless of who defaults, the out-of-the-money counter-
party must make the payments. The prespecified workout
process may also help DPCs avoid walk-away risk by trig-
gering a workout short of default. In addition, the counter-
party must agree to settle the contracts based on the mid-
market calculations of the DPC, thus eliminating some
uncertainty surrounding the valuation of the termination
payments.
In the failure of the Bank of New England (BNE),
questions arose concerning the role of regulators in the dis-
posal of the bank’s derivatives portfolio. Immediately after
BNE was declared insolvent, the Federal Deposit Insurance
Corporation (FDIC) established a bridge bank to assume
BNE’s assets and liabilities and continue BNE’s operations
while a permanent solution was found. The FDIC had the
authority, under the Financial Institutions Relief, Recov-
ery, and Reform Act (FIRREA), to transfer to the bridge
bank only those contracts with counterparties that were
out-of-the money with respect to BNE.
However, the FDIC decided not to follow this
course of action because of the existence of limited two-way
payments clauses and the possibility of other detrimental
actions by counterparties. Since BNE’s portfolio was net in-
the-money, the decision was made to transfer it to the
bridge bank in its entirety. The DPCs are aware of the
FIRREA clauses, but they feel confident that the Interna-
tional Swaps and Derivatives Association agreement and the
additional protections that they seek from regulated coun-
terparties would be sufficient to protect them from losses.

34 FRBNY ECONOMIC POLICY REVIEW / APRIL 1996
APPENDIX II: EXPLAINING DERIVATIVES GROWTH FOR MAJOR INTERMEDIARIES
The relative importance of credit ratings can also be shown
using regression analyses covering the 1991-94 period. The
dependent variable is yearly derivatives growth by institu-
tion (DGROW). The independent variables are a credit rat-
ing variable (RATING), a dummy for whether an
institution was a bank or nonbank dealer (BANK), the size
of the book at the beginning of the year (BKSIZE), and a
year dummy to control for changing marketwide conditions:
DGROW = a + b1RATING + b2BANK + b3BKSIZE +
b4DUM91 + b5DUM92 + b6DUM93.
We ran several regressions based on different characteriza-
tions of the effect of credit ratings. In regression 1, we
assumed that credit ratings would have a continuous effect
on derivatives growth. Therefore, we defined a credit rating
variable, which was assigned a value of 9 for AAA, 8 for
AA+, 7 for AA, 6 for AA-, and so on, down to 0 for BBB-.
The result shows that the dealer’s credit rating was a signif-
icant positive factor in determining the growth of its deriv-
atives book.
In regressions 2 to 6, we made the slightly differ-
ent assumption that credit ratings had a threshold effect
(that is, the effect was the same beyond a certain threshold
rating). Regression 3, containing a dummy variable for
companies rated double-A or higher, explained more of the
variation in derivatives growth rates than any of the others.
Regression 2 for the triple-A or higher threshold and
regression 3 for the double-A or higher threshold yield
similar coefficients, but the latter is estimated with a
smaller standard error and a higher R-squared.
REGRESSION ANALYSIS OF YEARLY DERIVATIVES GROWTH
Dependent variable: Yearly derivatives growth rates by institution, 1991-94
Independent variables: Credit rating variable, dummy for bank versusnonbank, size of book (lagged), dummy for year
Regression NumberCredit RatingVariables 1 2 3 4 5 6Credit ratinga 0.441b
(3.36) —— — — —
Dummy for AAAor higher
— 0.221b
(2.46)— — — —
Dummy for AAor higher
— — 0.225b
(3.46)— — —
Dummy for A+or higher
— — — 0.141b
(2.26)— —
Dummy for Aor higher
— — — — 0.103(1.44)
—
Dummy for A-or higher
— — — — — 0.105(1.07)
R2 0.351 0.293 0.358 0.281 0.241 0.228
Source: Authors’ calculations.aWe assigned a value of 9 for AAA, 8 for AA+, 7 for AA, 6 for AA-, and so on,down to 0 for BBB-.b Denotes significance at 5 percent level of confidence or higher; R-statistics arein parentheses.

ENDNOTES
NOTES FRBNY ECONOMIC POLICY REVIEW / APRIL 1996 35
1. Remolona (1993) analyzes the economic forces driving the growth ofderivatives markets. Figlewski (1994) describes some of the basicstrategies that have resulted in losses.
2. Cantor and Packer (1994) provide a thoughtful discussion of themeaning and reliability of such ratings.
3. A survey of dealers conducted by the Bank for InternationalSettlements in April 1995 suggests global markets of $40 trillion innotional value, a much larger estimate than those produced by theregular surveys of the International Swaps and Derivatives Association.
4. However, by merging with Chemical Bank in 1995, Chase Manhattanis now the world’s largest derivatives intermediary.
5. In the last few years, only Morgan Guaranty had achieved an Aaarating from Moody’s, but it lost that rating in early 1995.
6. Intermediaries also manage other types of risk, such as legal risk(arising from uncertainty over the enforceability of contracts) andoperational risk (arising from the possibility of a breakdown in internalcontrols or in systems for processing and settling transactions).
7. Credit risk is more of a concern in the over-the-counter markets thanin organized derivatives exchanges, such as the Chicago Board of Trade(CBOT) or the London International Financial Futures and OptionsExchange (LIFFE). There, the interposition of a clearinghouse as acounterparty and the use of frequent margin payments reduce creditrisks drastically (Remolona 1993).
8. The development of the markets in credit derivatives may allow thehedging of some credit risk. Hedging products include credit swaps,credit-linked structured notes, and options on credit spreads, all of whichallow investors to isolate and trade the credit risk of their portfolios inmuch the same way as interest rate and currency derivatives isolatemarket risk.
9. Santomero (1984), for example, shows how a bank would trade off riskand return in its whole portfolio.
10. There are other ways to mitigate credit risk, but netting and collateral arethe most common ones. Netting agreements reduce credit exposures bybilaterally offsetting contracts with positive market values against contractswith negative market values between the intermediary and individualcustomers. Hendricks (1994) analyzes the effect of netting on creditexposures. The most common form of collateral is the use of interdealermargins in transactions among intermediaries. Chew (1994) andComptroller of the Currency (1994) provide more general discussions.
11. The confidence interval is an estimate of the probability that losseswill not exceed the value at risk.
12. Bankers Trust New York Corporation, 1994 Annual Report, Table 4,p. 28.
13. See, for example, Iben and Ratcliffe (1994).
14. Drexel Burnham Lambert had derivatives amounting to $30 billionin notional value. Under bankruptcy, the contracts were terminated earlywithout any apparent credit losses to counterparties.
15. The discussion in the rest of this section draws from Gluck andClarkson (1993), Scheyd and Bahar (1994), and Bartmann, Milich, andVolstad (1994).
16. In a recent arrangement, MLDP will serve as the intermediary forswaps with customers of Dai-Ichi Kangyo Bank, but the bank willprovide the collateralized mirror transactions.
17. Technically, Credit Lyonnais’s ratings are assigned to its derivativesprogram, which relies on guarantees provided by CLFG Corporation, aspecial purpose, bankruptcy-remote corporation wholly owned byFinancial Security Assurance Holdings, itself a triple-A-rated monolineU.S. insurer. The derivatives program will cover transactions with theNew York branch of Credit Lyonnais (the sponsor).
18. The rating agencies rely on external auditors to monitor the DPCs’operations, including the verification of the models’ results.
19. Duffie (1994) argues that the assumption of independence is a poorone, particularly in the case of interest rate contracts, because defaultstend to be more common when interest rates decline during a recession.
20. Structured DPCs typically choose a confidence interval of 99 percent,which would cover movements as large as 2.3 standard deviations fromthe mean and allow only a 1.0 percent probability that actual losses willexceed the threshold estimate.
21. Credit Lyonnais’s derivatives program would settle the contracts onthe basis of actual quotes from other intermediaries, and customerswould have the choice of having their contracts taken over by anotherintermediary or of settling for cash.
22. Moody’s uses an expected loss standard for its credit ratings. Underthis standard, it is unnecessary to distinguish between continuation andtermination structures.

36 FRBNY ECONOMIC POLICY REVIEW / APRIL 1996 NOTES
ENDNOTES (Continued)
23. In early 1995, Standard and Poor’s lowered its rating of MorganGuaranty from AAA to AA+ and Bankers Trust from AA- to A+. Therating agency also downgraded the ratings of Credit Suisse, the SwissBank Corporation, Banque Indosuez, and the Long-Term Credit Bank ofJapan.
24. Just as not all triple-A ratings may be created equal, a bank’s creditrating may be “more equal” than others, particularly when such a bank isperceived to be too big to fail. The issue of what a bank’s credit ratingtruly means is beyond the scope of this study.
25. Under the termination structure and depending on the type ofcustomer, a workout may also constitute a tax event because of impliedcapital gains or losses.
26. This assumes that DPCs and other intermediaries face similar costsof capital.
The authors thank Richard Cantor, Ellen Gaske, Jerry Gluck, Jean Helwege,Darryll Hendricks, John Kambhu, Frank Keane, John Langer, David Laster,James Mahoney, and Tony Rodrigues for helpful discussions.
REFERENCES
Asquith, Jonathan, and Daniel Cunningham. 1990. “Swaps andTermination Events.” Paper presented at the International SwapDealers Association Annual General Meeting, Paris, March.
Bartmann, F.C., D.A. Milich, and C.P. Volstad. 1994. “Separating Creditand Market Risks: The Special Purpose Derivatives Vehicle.” THE
FINANCIER, November.
Cantor, Richard, and Frank Packer. 1994. “The Credit Rating Industry.”FEDERAL RESERVE BANK OF NEW YORK QUARTERLY REVIEW,summer-fall.
Chesler-Marsh, Caren. 1990. “The Market Gets Choosy.” EUROMONEY,August.
Chew, Lilian. 1994. “Protect and Survive.” RISK MAGAZINE, March.
Comptroller of the Currency. 1994. RISK MANAGEMENT OF FINANCIAL
DERIVATIVES: COMPTROLLER’S HANDBOOK. Washington, D.C.,October.
Duffie, Gregory R. 1994. “On Measuring Credit Risks of DerivativeInstruments.” Board of Governors of the Federal Reserve System,Finance and Economics Discussion Series 94-27, September.
Edwards, Franklin R., and Frederic S. Mishkin. 1995. “The Decline ofTraditional Banking: Implications for Financial Stability andRegulatory Policy.” FEDERAL RESERVE BANK OF NEW YORK
ECONOMIC POLICY REVIEW 1, no. 2.
Figlewski, Stephen. 1994. “How to Lose Money in Derivatives.” JOURNAL
OF DERIVATIVES, winter.
Fons, Jerome, Lea Carty, and Jeremy Kaufman. 1994. “Corporate BondDefaults and Default Rates.” MOODY’S SPECIAL REPORT, January.
Gluck, Jeremy, and Brian Clarkson. 1993. “Moody’s Approach toEvaluating Derivative Products Subsidiaries.” MOODY’S SPECIAL
COMMENT, October.
Hendricks, Darryll. 1994. “Netting Agreements and the Credit Exposuresof OTC Derivatives Portfolios.” FEDERAL RESERVE BANK OF NEW
YORK QUARTERLY REVIEW, spring.
Hull, John C. 1993. OPTIONS, FUTURES, AND OTHER DERIVATIVE
SECURITIES. 2d ed. Englewood Cliffs: Prentice Hall.
Iben, Ben, and Rupert Brotherton Ratcliffe. 1994. “Credit Loss Distributionsand Required Capital for Derivative Portfolios.” JOURNAL OF FIXED
INCOME, June.

ENDNOTES (Continued)
NOTES FRBNY ECONOMIC POLICY REVIEW / APRIL 1996 37
Litzenberger, Robert H. 1992. “Swaps: Plain and Fanciful.” JOURNAL OF
FINANCE, July.
Locke, Jane. 1995. “Creditable Claims?” RISK MAGAZINE, August.
Remolona, Eli M. 1993. “The Recent Growth of Financial DerivativeMarkets.” FEDERAL RESERVE BANK OF NEW YORK QUARTERLY
REVIEW, winter.
Santomero, Anthony M. 1984. “Modelling the Banking Firm: A Survey.”JOURNAL OF MONEY, CREDIT AND BANKING 4 (November): 576-602.
Scheyd, Charles, and Reza Bahar. 1994. “Derivative Product CompanyRating Criteria.” STANDARD AND POOR’S CREDITWEEK
INTERNATIONAL. Special Edition, June 6.
Simons, Katerina. 1993. “Interest Rate Structure and the Credit Risk ofSwaps.” NEW ENGLAND ECONOMIC REVIEW, July-August.
Smith, Clifford W., Charles W. Smithson, and D. Sykes Wilford. 1990.MANAGING FINANCIAL RISK. New York: HarperCollins.

38 FRBNY ECONOMIC POLICY REVIEW / APRIL 1996