risk, liquidity and capital management -...
TRANSCRIPT
Hoist Kredit AB (publ)
Corp.id.no. 556329-5699
Risk, Liquidity and Capital Management
Pillar 3 – 2017
1
CONTENTS
1 INTRODUCTION .......................................................................................................................................... 2
1.1 HOIST FINANCE IN BRIEF ..................................................................................................................................2 1.2 PILLAR 3 REPORT ............................................................................................................................................2 1.3 HOIST FINANCE’S RISK PROFILE ..........................................................................................................................3 1.4 RISK DEVELOPMENT 2017................................................................................................................................3 1.5 SIGNIFICANT RISKS AND UNCERTAINTIES ..............................................................................................................4
2 THE BOARD OF DIRECTORS’ RISK DECLARATION AND RISK STATEMENT .................................................... 4
3 RISK MANAGEMENT ................................................................................................................................... 5
3.1 INTRODUCTION ..............................................................................................................................................5 3.2 RISK MANAGEMENT FRAMEWORK ......................................................................................................................5 3.3 GOVERNANCE AND INTERNAL CONTROL ...............................................................................................................6 3.4 RISK CULTURE ................................................................................................................................................7
4 OWN FUNDS AND OWN FUNDS REQUIREMENTS ....................................................................................... 8
4.1 OWN FUNDS ..................................................................................................................................................8 4.2 RISK EXPOSURE AMOUNTS AND OWN FUNDS REQUIREMENTS ..................................................................................9 4.3 CAPITAL RATIOS AND BUFFERS .........................................................................................................................10 4.4 LEVERAGE RATIO ..........................................................................................................................................11
5 FUNDING .................................................................................................................................................. 11
6 INTERNAL CAPITAL AND LIQUIDITY ADEQUACY ASSESSMENT PROCESS ................................................... 12
6.1 ICAAP .......................................................................................................................................................12 6.2 ILAAP........................................................................................................................................................13
7 CREDIT RISK .............................................................................................................................................. 13
7.1 THE GROUP’S CREDIT RISK PROFILE ...................................................................................................................13 7.1.1 Credit risk associated with acquired loan portfolios ...........................................................................13 7.1.2 Credit risk associated with the liquidity reserve ..................................................................................13 7.1.3 Counterparty credit risk as a result of hedging activities ....................................................................14
7.2 ADDITIONAL INFORMATION ON CREDIT RISK .......................................................................................................14 7.2.1 Past due loans and impairments .........................................................................................................14 7.2.2 Credit risk exposures ............................................................................................................................15
8 OPERATIONAL RISK .................................................................................................................................. 17
9 MARKET RISK ........................................................................................................................................... 19
9.1 FOREIGN EXCHANGE RISK ...............................................................................................................................19 9.2 INTEREST RATE RISK .......................................................................................................................................20
10 LIQUIDITY RISK ..................................................................................................................................... 21
10.1 LIQUIDITY COVERAGE RATIO ...........................................................................................................................22
DEFINITIONS..................................................................................................................................................... 23
ANNEX I – CONSOLIDATED SITUATION AND BALANCE SHEET RECONCILIATION ............................................... 24
ANNEX II – HOIST KREDIT AB (PUBL)................................................................................................................. 27
ANNEX III – DISCLOSURE OF TRANSITIONAL OWN FUNDS ................................................................................ 32
ANNEX IV – CAPITAL INSTRUMENTS INCLUDED IN OWN FUNDS ...................................................................... 35
ANNEX V – DISCLOSURE OF LEVERAGE RATIO .................................................................................................. 38
ANNEX VI – DISCLOSURE OF ENCUMBERED ASSETS AND UNENCUMBERED ASSETS ......................................... 40
2
1 INTRODUCTION
1.1 Hoist Finance in brief Hoist Finance AB (publ) is a pan-European financial group (“Hoist Finance” or the “Group”) active within debt purchasing and receivables management. Hoist Finance is a leading debt-restructuring partner to international banks. Present in eleven countries across Europe, Hoist Finance offer a broad spectrum of flexible and tailored solutions for the acquisition and management of non-performing unsecured consumer loans. In Sweden and Germany, Hoist Finance offer retail deposit service that is a major funding source for the Group. The subsidiary to Hoist Finance , Hoist Kredit AB (publ) (“Hoist Kredit ”), is licensed and regulated as a credit market company (Sw. Kreditmarknadsbolag) by the Swedish Financial Supervisory Authority (Sw. Finansinspektionen) (the “SFSA”).
Hoist Kredit and Hoist Finance AB (publ) completed a merger as of 2 January 2018. Through the merger, all of Hoist Kredit’s assets and liabilities have been transferred to Hoist Finance AB (publ) at the same time as Hoist Kredit was dissolved. The previously announced simplification of the corporate structure has been completed and Hoist Finance AB (publ) transitions from a holding company into the operational parent company of the Group. The merger has had no material financial effects for Hoist Finance. Just as Hoist Kredit, Hoist Finance AB (publ) is licensed and regulated as a credit market company under the supervision of the SFSA.
1.2 Pillar 3 report This Pillar 3 report provides information about risk management, capital and liquidity adequacy. The report is in reference to the information that shall be disclosed on a yearly basis in accordance with Regulation (EU) No 575/2013 of the European Parliament and of the Council, Commission Implementing Regulation (EU) No 1423/2013, the SFSA’s regulations regarding prudential requirements and capital buffers (FFFS 2014:12), the SFSA’s regulations regarding management of liquidity risks in credit institutions and investment firms (FFFS 2010:7) and EBA’s Guidelines on disclosure requirements under Part Eight of Regulation (EU) No 575/2013 (EBA/GL/2016/11). The information is given on the basis of the consolidated situation of Hoist Finance, see Annex I – Consolidated situation, as well as Hoist Kredit on an institutional level, see Annex II – Hoist Kredit AB (publ).
Additional information on corporate governance and remuneration is disclosed in the annual report and in the separate document “The remuneration policy and remuneration systems”. The information can be found on the Group’s website: www.hoistfinance.com.
3
1.3 Hoist Finance’s risk profile The table below describes the major risks Hoist Finance is exposed to and how they are managed.
Description Risk profile Risk management
Credit risk The risk to earnings and/or capital arising from a counterparty’s failure to repay principal or interest at the stipulated time or failure to otherwise perform as agreed.
Credit risk refers mainly to acquired loan portfolios and the risk that collection will be lower than forecasted. Other credit risk exposures are (i) cash deposits with banks, (ii) investments in fixed income instruments, and (iii) counterparty risk relating to hedging of FX and interest rate risk.
Credit risk in acquired loan portfolios is monitored, analysed and managed by the management in each country and by the Group’s Business Control function. Other credit risks are analysed and managed by the Treasury function.
The Group’s Risk Control function analyses and control all credit risk exposures.
Operational risk The risk of loss resulting from inadequate or failed internal processes, people, IT systems or from external events, including legal and compliance risk.
Large losses and negative incidents due to failures in operations are rare. Given the nature of Hoist Finance’s operations, it is not possible or cost effective to try to eliminate all operational risk. The goal is rather to minimise operational risk.
Routines for group-wide incident reporting, tracking of key risk indicators and regular training courses.
The “dual-control” is applied to critical decisions and is supported by back-up routines, e.g., in the form of ratified business continuity plans.
Market risk
The risk to earnings, capital or liquidity arising from adverse movements in market prices. This includes FX risk and interest rate risk.
The main FX risks arise from the fact that the loan portfolios (the assets) are denominated in EUR, PLN and GBP, while the reporting currency is SEK and the majority of liabilities are denominated in SEK.
Interest rate movements have an effect on net interest income.
Market risks are hedged continuously by the Group’s Treasury function and independently analysed and controlled by the Group’s risk control function.
Liquidity risk The risk of difficulties in obtaining funding and thus, not being able to meet payment obligations at maturity without encountering significantly higher financing costs.
Liquidity risk in Hoist Finance stems primarily from the risk of unexpected outflow of deposits, the risk of cash outflow due to mark-to-market of hedging derivatives and the re-financing risk of existing wholesale funding.
The Group has a significant liquidity reserve to cover potential outflows of liquidity.
1.4 Risk development 2017 During the year Hoist Finance showed improved financial results as well as slightly reduced risk levels in relation to the size of the business and, in several cases, in absolute terms. In 2017 Hoist Finance has worked extensively on integrating the operational risk management and control in the key business processes to a larger extent. The company has also reduced currency mismatches in the balance sheet which has reduced FX-risk and liquidity risk. Interest rate risk has increased slightly, however from a low level.
Credit risk from Hoist’s NPL-portfolios is deemed to have decreased slightly in proportion to the growth in acquired volume. This is primarily a result of the aggregated NPL-book containing older vintage investments (which have been reviewed from a valuation perspective multiple times) to a larger extent than before. The liquidity portfolio’s credit risk remained low in 2017, as investments are made in government, municipal and covered bonds of high credit quality.
Operational risk - The Group works continuously to improve the quality of its internal processes in order to limit operational risks. The operational risk level during the year is deemed to have increased less relative to the business growth. The focus during the year has been on increasing risk awareness and integrating the operational risk reducing tools closer to the business and operations.
Market risks were low during the year, as Hoist Finance continuously hedge both interest rate risk and FX risk. Interest Rate Risk has decreased slightly on shorter duration and increased on longer duration, however from a low level. The objective of the hedging is to reduce interest rate risk over the coming 3 year period why the uptick on longer duration which has been seen should be considered normal volatility within the hedging process. The FX-risk remained low during the year and has been slightly reduced as a result of better currency matching of assets and liabilities.
4
Liquidity risk remained low during the year mainly due to the availability of a large liquidity portfolio. The liquidity risk has also decreased during the year as a result of relatively lower levels of FX-swaps which reduces potential mark-to-market cash flows to be paid to our banking counterparty in these transactions. Due to its strong liquidity position, the Group is well prepared for future acquisitions and growth.
Capitalisation for Hoist Finance, expressed as CET1-ratio, amount to 11,7% by end of 2017, down from 12,5% in 2016. The company’s capitalisation is now within the CET1-ratio target range of 10,2% to 12,2%. Relative to regulatory CET1 ratio requirements, Hoist Finance today has a margin of 4.1%. The Group is therefore able to absorb unanticipated events without jeopardising its solvency, and the Group is well capitalised for continued growth.
1.5 Significant risks and uncertainties The Group is governed by many regulations due to the status of the subsidiary Hoist Kredit as a credit market company. Since new and amended regulations may have an impact on the Group, Hoist Finance carefully monitors regulatory developments such as Basel IV capital and liquidity regulations and amendments to deposit guarantee scheme regulations.
Hoist Finance is exposed to a number of uncertainties through its business operations and due to its broad geographic presence. New and amended financial regulations may affect the Group directly (e.g. via Basel IV capital and liquidity regulations) and indirectly through the impact of similar regulations on the market’s supply of loan portfolios. Due to the Group’s substantial deposits from the public, changes to the deposit guarantee scheme, for instance, may impact the Group. In other areas such as consumer protection, new regulations may require the Group to adjust the way in which it operates its collection activities. The Group’s loan portfolios are valued based on anticipated future collection levels. Factors that affect the Group’s capacity to achieve collection level forecasts sustainably and cost efficiently are therefore uncertainty factors.
In 2016, the UK held a national referendum on EU membership, with the results indicating that the UK will be withdrawing from the EU. This could affect Hoist Finance due to the company’s extensive operations in the UK and gives rise to increased uncertainty, for example, in relation to free trade agreements and legal issues.
2 THE BOARD OF DIRECTORS’ RISK DECLARATION AND RISK STATEMENT The Board of Directors of Hoist Finance AB (publ) (the “Board of Directors”) has approved the following risk declaration and risk statement.
Risk declaration Hoist Finance has adequate risk management arrangements, which are adapted to the Group's business model, risk appetite and risk management strategy.
Risk statement The Group’s business strategy is to profit on the expertise that the Group has in acquisition and management of non-performing loans. To manage and expose oneself to credit risk constitutes a central part of the Group’s business and help the Group to reach its highly set goals.
Mitigating operational risk is one of the Group’s primary areas of focus as it tries to limit it to an absolute minimum. The principle is that risk-minimising activities shall be implemented as long as the associated costs are less than the costs the risk could cause if materialised.
The Group’s appetite for market risk is low and is reflected in that all exposures should be hedged as much as practically possible. Certain exposure to market risk is however inevitable. The Board of Directors has therefore approved certain market risks within strict limits.
Liquidity risk in Hoist Finance stems primarily from the risk of unexpected outflow of deposits, the risk of cash outflow due to mark-to-market of hedging derivatives and the re-financing risk of existing wholesale funding. Hoist Finance has a low appetite for assuming liquidity risk why potential outflows are covered by a generous liquidity reserve.
Detailed information and figures with regards to Hoist Finance’s main risks (credit risk, operational risk, market risk and liquidity risk) and how these interact with the established risk appetite levels (limits) are presented in each section of this report.
5
3 RISK MANAGEMENT
3.1 Introduction Risk is an inherent part of any business operation. Without assuming risks, it is impossible for a business to achieve a reward and ensuring long-term profitability. Ongoing risk management is a core activity in Hoist Finance and it is fundamental for long-term profitability and stability. Hoist Finance acquires and manages receivables and thereby actively exposes itself to credit risk. This is Hoist Finance’s core business, in which the Group has been successful for the last 20 years.
Hoist Finance defines risk as the possibility of a negative deviation from what is expected. This could be a deviation from expected earnings, liquidity levels or capitalisation.
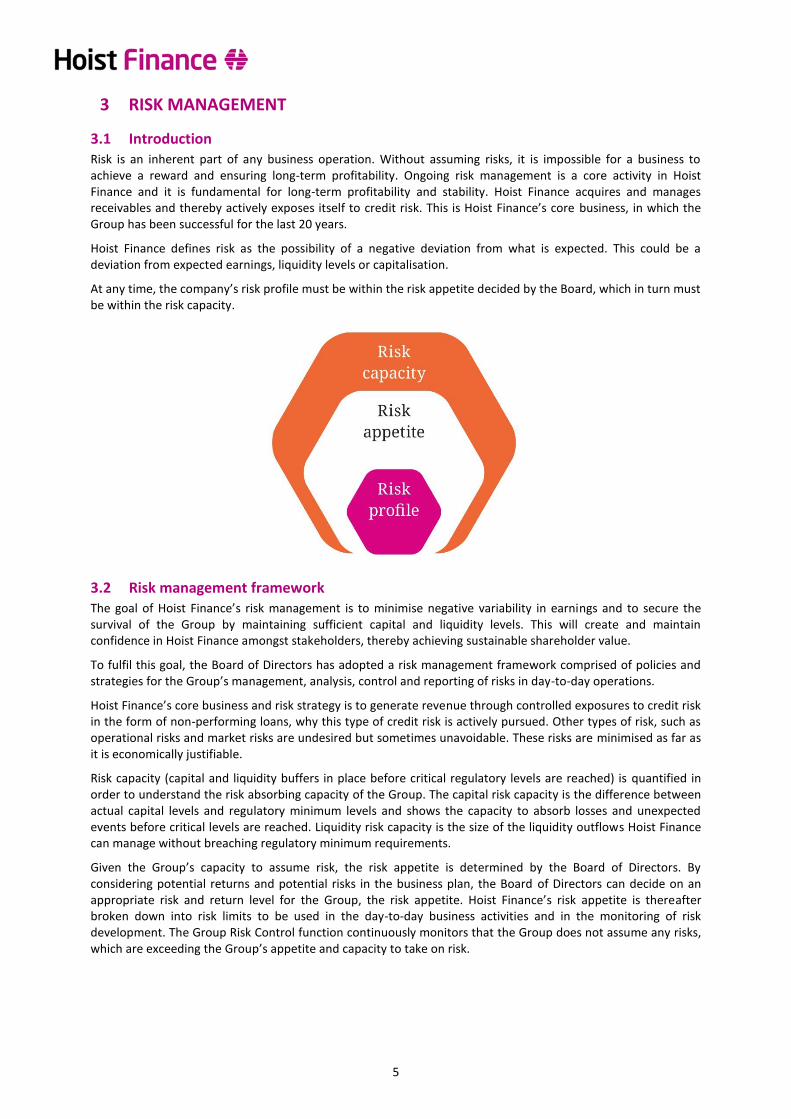
At any time, the company’s risk profile must be within the risk appetite decided by the Board, which in turn must be within the risk capacity.
3.2 Risk management framework The goal of Hoist Finance’s risk management is to minimise negative variability in earnings and to secure the survival of the Group by maintaining sufficient capital and liquidity levels. This will create and maintain confidence in Hoist Finance amongst stakeholders, thereby achieving sustainable shareholder value.
To fulfil this goal, the Board of Directors has adopted a risk management framework comprised of policies and strategies for the Group’s management, analysis, control and reporting of risks in day-to-day operations.
Hoist Finance’s core business and risk strategy is to generate revenue through controlled exposures to credit risk in the form of non-performing loans, why this type of credit risk is actively pursued. Other types of risk, such as operational risks and market risks are undesired but sometimes unavoidable. These risks are minimised as far as it is economically justifiable.
Risk capacity (capital and liquidity buffers in place before critical regulatory levels are reached) is quantified in order to understand the risk absorbing capacity of the Group. The capital risk capacity is the difference between actual capital levels and regulatory minimum levels and shows the capacity to absorb losses and unexpected events before critical levels are reached. Liquidity risk capacity is the size of the liquidity outflows Hoist Finance can manage without breaching regulatory minimum requirements.
Given the Group’s capacity to assume risk, the risk appetite is determined by the Board of Directors. By considering potential returns and potential risks in the business plan, the Board of Directors can decide on an appropriate risk and return level for the Group, the risk appetite. Hoist Finance’s risk appetite is thereafter broken down into risk limits to be used in the day-to-day business activities and in the monitoring of risk development. The Group Risk Control function continuously monitors that the Group does not assume any risks, which are exceeding the Group’s appetite and capacity to take on risk.
6
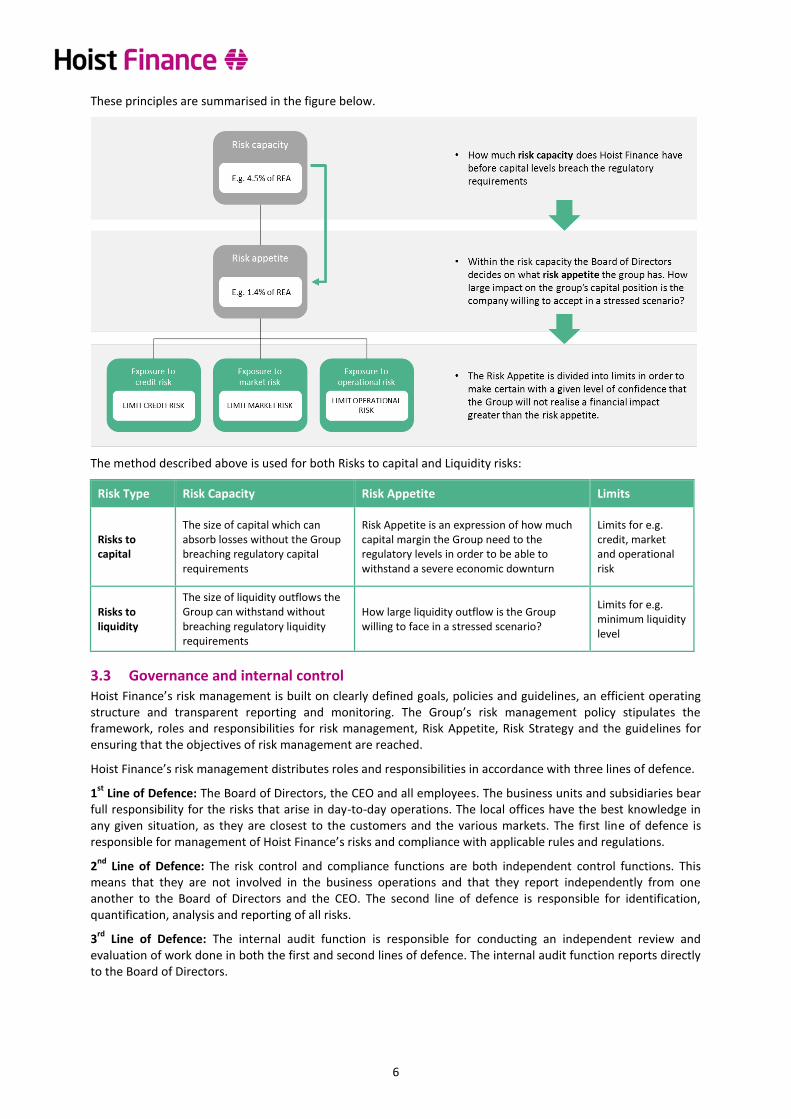
These principles are summarised in the figure below.
The method described above is used for both Risks to capital and Liquidity risks:
Risk Type Risk Capacity Risk Appetite Limits
Risks to capital
The size of capital which can absorb losses without the Group breaching regulatory capital requirements
Risk Appetite is an expression of how much capital margin the Group need to the regulatory levels in order to be able to withstand a severe economic downturn
Limits for e.g. credit, market and operational risk
Risks to liquidity
The size of liquidity outflows the Group can withstand without breaching regulatory liquidity requirements
How large liquidity outflow is the Group willing to face in a stressed scenario?
Limits for e.g. minimum liquidity level
3.3 Governance and internal control Hoist Finance’s risk management is built on clearly defined goals, policies and guidelines, an efficient operating structure and transparent reporting and monitoring. The Group’s risk management policy stipulates the framework, roles and responsibilities for risk management, Risk Appetite, Risk Strategy and the guidelines for ensuring that the objectives of risk management are reached.
Hoist Finance’s risk management distributes roles and responsibilities in accordance with three lines of defence.
1st
Line of Defence: The Board of Directors, the CEO and all employees. The business units and subsidiaries bear full responsibility for the risks that arise in day-to-day operations. The local offices have the best knowledge in any given situation, as they are closest to the customers and the various markets. The first line of defence is responsible for management of Hoist Finance’s risks and compliance with applicable rules and regulations.
2nd
Line of Defence: The risk control and compliance functions are both independent control functions. This means that they are not involved in the business operations and that they report independently from one another to the Board of Directors and the CEO. The second line of defence is responsible for identification, quantification, analysis and reporting of all risks.
3rd
Line of Defence: The internal audit function is responsible for conducting an independent review and evaluation of work done in both the first and second lines of defence. The internal audit function reports directly to the Board of Directors.

7
The figure below shows Hoist Finance’s governance structure.
The Finance function monitors the capital and liquidity adequacy and is responsible for the reporting to the SFSA. The Treasury function manage the credit risk stemming from lending to credit institutions and the liquidity portfolio while the credit risk stemming from the loan portfolios is managed and monitored by the management team in each jurisdiction. Furthermore the performance of the loan portfolios is continuously followed up by the Group Business Control function and the CFO function together with the management team in each jurisdiction. The Treasury function has the overall responsibility for management of market-, liquidity- and counterparty credit risks in the first line of defence. All employees manage the operational risks that exist in their processes.
The Risk Control function continuously analyse, control and report on the Group’s risk exposures (credit risk, operational risk, market risk and liquidity risk), capital and liquidity adequacy to the CEO and the Board of Directors. The Risk Control function also evaluates compliance with new internal and external regulations on the topic of risk management, capital adequacy and liquidity adequacy and assists in implementing the new regulations within the organisation. Strong emphasises is placed on reporting risk to the relevant interested parties in a clear and meaningful manner. Risks within the Group are handled according to set policies and instructions. Reporting on risk exposures, liquidity and capital adequacy from Risk Control to the Board of Directors, the Risk and Audit Committee and the CEO is delivered in writing monthly and otherwise when necessary. The operations are also reviewed by the Group Compliance and Group Audit at central and local level. Group Compliance is responsible for the overall assessment of compliance risks.
For further information on corporate governance and the risk organisation, see the corporate governance section in the annual report disclosed on the Group’s webpage: www.hoistfinance.com.
3.4 Risk Culture Within Hoist Finance there is deep insight and understanding of how a sound risk culture is critical for efficient risk management. Therefore, structured efforts are ongoing to support and promote a sound risk culture within the company. Hoist Finance defines a sound risk culture as:
• Transparency, where information is shared as far as possible and all communication and feedback is clear, concise and constructive.
• Teamwork, where the atmosphere is open and it is easy to share and learn from experience, both from successes and failures.
• Balance between risk/reward, where all decisions and considerations take into account both the risk and the reward that the decision entails. The company also believe that independent credible challenge and constructive discussions is critical for a sophisticated decision-making on risk and reward.
• Sound incident management, where incidents are reported, analysed and actions taken to mitigate risks insofar as it is economically justifiable and where a sound, learning risk culture promotes learning from mistakes to continuously improve.
8
Promoting the risk culture is a long-term and continuous endeavor that permeates everything Hoist Finance does. Internal rules, remuneration systems, incentives, ethical guidelines, formal educational initiatives and other governing mechanisms within the company are designed to ensure that the risk culture develops in a positive direction.
4 OWN FUNDS AND OWN FUNDS REQUIREMENTS The information in this section regards the basis of the consolidated situation of Hoist Finance, which includes the parent company Hoist Finance AB (publ), the regulated entity Hoist Kredit and its fully owned subsidiaries, which are all fully consolidated. For further information see Annex I – Consolidated situation. The difference between the consolidated accounts and the consolidated situation for capital adequacy purposes is that the equity method is applied in the consolidated accounts whereas the proportional method is applied for the joint ventures in relation to capital adequacy reporting.
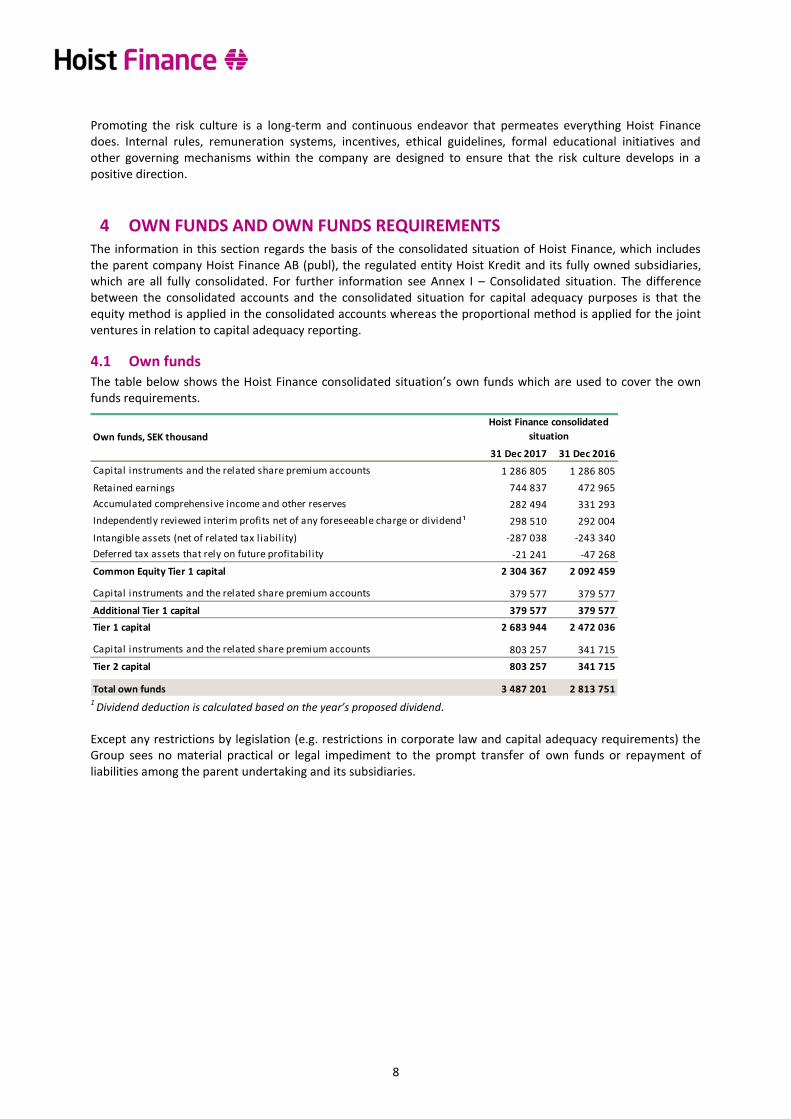
4.1 Own funds The table below shows the Hoist Finance consolidated situation’s own funds which are used to cover the own funds requirements.
1
Dividend deduction is calculated based on the year’s proposed dividend.
Except any restrictions by legislation (e.g. restrictions in corporate law and capital adequacy requirements) the Group sees no material practical or legal impediment to the prompt transfer of own funds or repayment of liabilities among the parent undertaking and its subsidiaries.
Own funds, SEK thousand
31 Dec 2017 31 Dec 2016
Capital instruments and the related share premium accounts 1 286 805 1 286 805
Retained earnings 744 837 472 965
Accumulated comprehensive income and other reserves 282 494 331 293
Independently reviewed interim profits net of any foreseeable charge or dividend ¹ 298 510 292 004
Intangible assets (net of related tax liability) -287 038 -243 340
Deferred tax assets that rely on future profitability -21 241 -47 268
Common Equity Tier 1 capital 2 304 367 2 092 459
Capital instruments and the related share premium accounts 379 577 379 577
Additional Tier 1 capital 379 577 379 577
Tier 1 capital 2 683 944 2 472 036
Capital instruments and the related share premium accounts 803 257 341 715
Tier 2 capital 803 257 341 715
Total own funds 3 487 201 2 813 751
Hoist Finance consolidated
situation

9
Common Equity Tier 1 capital mainly comprises equity after various adjustments, while Additional Tier 1 (AT1) capital and Tier 2 capital are mainly made up of perpetual AT1 notes and subordinated loans. A link between equity and the regulatory total capital at 31 December 2017 is presented below. Further information about the capital instruments included in total capital is disclosed in Annex IV – Capital instruments included in own funds.
Please refer to Annex III – Disclosure of transitional own funds for a full reconciliation of own funds.
4.2 Risk exposure amounts and own funds requirements The table below shows the risk exposure amounts per risk category for Hoist Finance. Since Hoist Finance’s core business is to acquire non-performing loan portfolios the risk exposure amount for “Exposures in default” is by far the largest.
Risk exposure amounts, SEK thousand
31 Dec 2017 31 Dec 2016
Exposures to central governments or central banks 0 0
Exposures to regional governments or local authorities 0 0
Exposures to institutions 380 984 261 882
of which counterparty credit risk 54 333 29 036
Exposures to corporates 135 760 199 920
Retail exposures 15 994 24 146
Exposures in default 15 348 907 13 270 498
Exposures in the form of covered bonds 368 902 247 485
Equity exposures 0 0
Other items 145 310 132 315
Credit risk (standardised approach) 16 395 857 14 136 246
Market risk (foreign exchange risk - standardised approach) 113 090 28 858
Operational risk (standardised approach) 3 158 430 2 622 373
Credit valuation adjustment (standardised approach) 27 430 0
Total risk exposure amount 19 694 807 16 787 477
Hoist Finance consolidated
situation
10
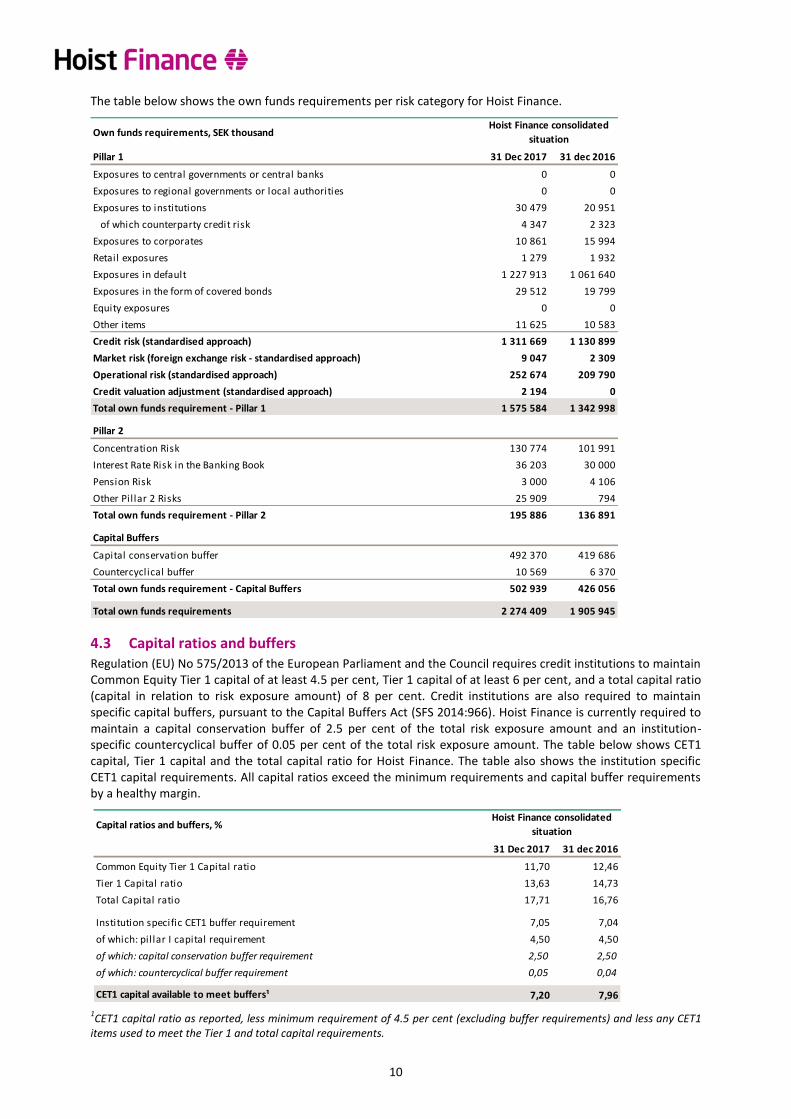
The table below shows the own funds requirements per risk category for Hoist Finance.
4.3 Capital ratios and buffers Regulation (EU) No 575/2013 of the European Parliament and the Council requires credit institutions to maintain Common Equity Tier 1 capital of at least 4.5 per cent, Tier 1 capital of at least 6 per cent, and a total capital ratio (capital in relation to risk exposure amount) of 8 per cent. Credit institutions are also required to maintain specific capital buffers, pursuant to the Capital Buffers Act (SFS 2014:966). Hoist Finance is currently required to maintain a capital conservation buffer of 2.5 per cent of the total risk exposure amount and an institution-specific countercyclical buffer of 0.05 per cent of the total risk exposure amount. The table below shows CET1 capital, Tier 1 capital and the total capital ratio for Hoist Finance. The table also shows the institution specific CET1 capital requirements. All capital ratios exceed the minimum requirements and capital buffer requirements by a healthy margin.
1CET1 capital ratio as reported, less minimum requirement of 4.5 per cent (excluding buffer requirements) and less any CET1
items used to meet the Tier 1 and total capital requirements.
Own funds requirements, SEK thousand
Pillar 1 31 Dec 2017 31 dec 2016
Exposures to central governments or central banks 0 0
Exposures to regional governments or local authorities 0 0
Exposures to institutions 30 479 20 951
of which counterparty credit risk 4 347 2 323
Exposures to corporates 10 861 15 994
Retail exposures 1 279 1 932
Exposures in default 1 227 913 1 061 640
Exposures in the form of covered bonds 29 512 19 799
Equity exposures 0 0
Other items 11 625 10 583
Credit risk (standardised approach) 1 311 669 1 130 899
Market risk (foreign exchange risk - standardised approach) 9 047 2 309
Operational risk (standardised approach) 252 674 209 790
Credit valuation adjustment (standardised approach) 2 194 0
Total own funds requirement - Pillar 1 1 575 584 1 342 998
Pillar 2
Concentration Risk 130 774 101 991
Interest Rate Risk in the Banking Book 36 203 30 000
Pension Risk 3 000 4 106
Other Pillar 2 Risks 25 909 794
Total own funds requirement - Pillar 2 195 886 136 891
Capital Buffers
Capital conservation buffer 492 370 419 686
Countercyclical buffer 10 569 6 370
Total own funds requirement - Capital Buffers 502 939 426 056
Total own funds requirements 2 274 409 1 905 945
Hoist Finance consolidated
situation
Capital ratios and buffers, %
31 Dec 2017 31 dec 2016
Common Equity Tier 1 Capital ratio 11,70 12,46
Tier 1 Capital ratio 13,63 14,73
Total Capital ratio 17,71 16,76
Institution specific CET1 buffer requirement 7,05 7,04
of which: pillar I capital requirement 4,50 4,50
of which: capital conservation buffer requirement 2,50 2,50
of which: countercyclical buffer requirement 0,05 0,04
CET1 capital available to meet buffers¹ 7,20 7,96
Hoist Finance consolidated
situation

11
Countercyclical buffer Hoist Finance is currently required to maintain an institution-specific countercyclical buffer of 0.05 per cent (0.04) of the total risk exposure amount. The table below shows the geographical distribution of Hoist Finance credit exposures relevant for the calculation of the countercyclical capital buffer.
The table below shows Hoist Finance amount of the institution-specific countercyclical capital buffer.
4.4 Leverage ratio The leverage ratio is a monitoring tool, which allows competent authorities to assess the risk of excessive leverage. Detailed information about Hoist Finance leverage ratio is illustrated in Annex V – Disclosure of Leverage Ratio.
The leverage ratio for Hoist Finance consolidated situation is 11.81 per cent (12.57 per cent) as at 31 December 2017.
The discussion by regulators has been to impose a leverage ratio of around 3 per cent. Hence, Hoist Finance has significant headroom to these levels and will continue to have so due to that the 100 per cent risk weighting of the majority of Hoist Finance’s loan portfolios sets an indirect cap on leverage.
5 FUNDING Hoist Finance has an effective and diversified funding structure through deposits from the public and through the capital markets.
In Sweden and Germany, Hoist Finance offer retail deposits. The majority of deposits from the public are payable on demand (variable deposits – “floating”), while about 35 per cent (36) of the Group’s deposits from the public are tied to longer maturities (“fixed deposits”) ranging from 12 to 36 months. Although most of the deposits from the public are payable on demand, the Group estimates, based on past client behaviour that a large portion of deposits can be treated as a longer maturity. About 99 per cent of deposits are backed by the deposit guarantee scheme.
Funding from debt issuance has increased during the year both from Senior unsecured debt and from Subordinated liabilities. Hoist Finance achieved investment grade rating from Moody’s in May 2017 and as a
Hoist Finance consolidated situation 31 Dec 2017, SEK thousand
Exposure value
for SA
Exposure value
for IRB
Of which:
general credit
exposures
Of which:
trading book
exposures
Of which:
securitisation
exposures
Total
Sweden 429 710 0 34 377 0 0 34 377 2,7 2,0%
UK 4 801 334 0 384 107 0 0 384 107 30,0 0,0%
Italy 4 063 989 0 325 119 0 0 325 119 25,4 0,0%
Germany 2 045 531 0 163 642 0 0 163 642 12,8 0,0%
Poland 2 122 823 0 169 826 0 0 169 826 13,3 0,0%
Netherlands 1 027 350 0 82 188 0 0 82 188 6,4 0,0%
France 558 014 0 44 641 0 0 44 641 3,5 0,0%
Spain 625 921 0 50 074 0 0 50 074 3,9 0,0%
Belgium 267 993 0 21 439 0 0 21 439 1,7 0,0%
Austria 29 404 0 2 352 0 0 2 352 0,2 0,0%
Jersey 29 257 0 2 341 0 0 2 341 0,2 0,0%
Greece 13 546 0 1 084 0 0 1 084 0,1 0,0%
Other countries 0 0 0 0 0 0 0,0 0,0%
Total 16 014 872 0 1 281 190 0 0 1 281 190 100,0 0,05%
Own funds
requirement
weights
General credit exposures Own funds requirements
Countercyclical
capital buffer
rate
Hoist Finance consolidated situation 31 Dec 2017, SEK thousand
SEK thousand 31 Dec 2017
19 694 807
0,054%
10 569Institution specific countercyclical buffer requirement
Institution specific countercyclical buffer rate
Total risk exposure amount

12
consequence debt issuance has become an increasingly attractive means of diversifying Hoist Finance funding base. The table below shows Hoist Finance main components of the funding.
For information about encumbered assets, see Annex VI – Disclosure of encumbered assets and unencumbered assets.
6 INTERNAL CAPITAL AND LIQUIDITY ADEQUACY ASSESSMENT PROCESS The internal capital and liquidity adequacy assessment process (ICAAP and ILAAP) is an ongoing process carried out by the Management, Treasury and Risk Control, which review, evaluate and quantify risks to which the Group is exposed in carrying out its business operations. This risk analysis forms the basis for ensuring that the Group has sufficient capital, liquidity and financial margin to meet regulatory requirements.
The capital and liquidity assessment process is developed and reviewed at least once per year. The annual review focuses on ensuring that the process and Risk Appetite is always relevant to the current risk profile and the Group’s operations. The Board of Directors decides on any changes to the process, and Internal Audit verifies that the process is carried out pursuant to the Board of Directors’ instructions.
The processes start with the Management’s business plan and budget for the coming three years. These are formalised into a forecast. The ICAAP and ILAAP use these forecasts as a starting point and, as a first step, evaluate the risks inherent in the forecasts.
6.1 ICAAP ICAAP is Hoist Finance’s internal evaluation to ensure that the Group has sufficient capital to meet the risks in both normal and stressed scenarios.
Credit and market risks are rigorously stress-tested to determine the amount of losses Hoist Finance is capable of incurring under extremely adverse circumstances. This loss figure is compared to the Pillar 1 capital requirement and, if the simulated losses exceed the Pillar 1 amount, the excess is covered with additional Pillar 2 capital.
The evaluation of operational risks is done in a series of workshops led by the Group’s Risk Control function. Qualitative and quantitative methods are used in these workshops to evaluate and quantify all significant operational risks in the Group. Once the operational risks are quantified, the next step is calculation of the amount of capital required to cover all unexpected losses arising from the identified risks. Here as well, the calculated capital requirement is compared to the Pillar 1 capital requirement and any excess loss risk is covered with additional Pillar 2 capital.
This practice of validation of Pillar 1 risks for credit, market and operational risk has the sole purpose of checking the relevancy of the Pillar 1 own funds requirements, since they are calculated according to very standardised methods as stipulated by regulation. Pillar 2 own funds requirements can also result as a consequence of identification of risk categories that are not considered in Pillar 1. These risks are also stressed to a magnitude of what one could observe once in a 100 year period. Capital is thereafter reserved to cover the outcome of the test.
Hoist Finance conducts stress tests and sensitivity analyses of the business plan, under ICAAP and on an ongoing basis in the operations, to ensure that the Group maintains a strong financial position in relation to regulatory capital requirements under extremely adverse internal and external market conditions.
Funding, SEK thousand
31 Dec 2017 31 dec 2016
Flex Deposits 8 580 487 7 582 909
Term Deposits 4 646 963 4 266 047
Senior Unsecured Debt 4 355 000 3 125 996
Tier 1 instruments 379 577 379 577
Tier 2 instruments 803 257 341 715
Equity 2 848 728 2 545 719
Other 922 552 907 963
Balance Sheet Total 22 536 564 19 149 926
Hoist Finance on a
consolidated basis

13
Rating 31 Dec 2017 31 Dec 2016
AAA 69,8% 69,2%
AA+ 6,3% 12,9%
AA 0,0% 0,0%
AA- 8,0% 0,5%
A+ 0,0% 0,0%
A 12,2% 13,9%
A- 1,0% 0,6%
BBB+ 1,9% 0,8%
BBB 0,0% 0,0%
BBB- 0,1% 1,1%
BB+ 0,1% 0,1%
BB 0,1% 0,0%
BB- 0,6% 0,7%
B+ 0,0% 0,0%
B 0,0% 0,0%
B- 0,0% 0,0%
N/A 0,0% 0,1%
Total, SEK thousand 6 799 957 5 788 574
of which liquidity portfolio 5 179 173 4 748 752
The own funds requirements produced by ICAAP is used by Management as a decision-making tool when making future plans for the Group. ICAAP thus adds a further dimension to the Group’s decision-making, above and beyond strategic and day-to-day planning – before being made, strategic plans, future forecasts and immediate management decisions are always reviewed against the background of own funds requirements.
The conclusions from this year’s ICAAP are that Hoist Finance has sufficient capacity to absorb unexpected events without risking its solvency, and that Hoist Finance is well-capitalised for continued growth.
6.2 ILAAP ILAAP is Hoist Finance’s internal evaluation to ensure that the Group maintains sufficient levels of liquidity buffers and sufficient funding in light of the liquidity risks that exist. The process identifies, verifies, plans and stress-tests Hoist Finance’s future funding and liquidity requirements.
Hoist Finance uses ILAAP to define the size of the liquidity buffer the Group needs to maintain to prevent identified liquidity risks from affecting the Group’s capacity to achieve its business plan and meet regulatory requirements (LCR/ NSFR) and the limits set by the Board of Directors.
Results from this year’s ILAAP shows that Hoist Finance has sufficient capacity to meet unexpected liquidity risks without risking refinancing problems, and that Hoist Finance maintains a liquidity reserve sufficient to maintain continued growth.
7 CREDIT RISK Credit risk is the risk to earnings and/or capital arising from a counterparty’s failure to repay principal or interest at the stipulated time or failure to otherwise perform as agreed.
7.1 The Group’s credit risk profile Credit risk in the Group stems mainly from: • Acquired loan portfolios • The liquidity reserve • Counterparty credit risk as a result of hedging activities
7.1.1 Credit risk associated with acquired loan portfolios
The loan portfolios are acquired at prices that typically vary between 5 and 35 per cent of the face value (principal amount) outstanding at the time of acquisition. The price depends on the portfolios’ specific characteristics and composition in terms of e.g. loan size, age, and type of loans as well as debtor age, location, type, etc. Credit risk in the portfolios relates primarily to the Group overpaying for a portfolio – i.e., recovering less from the portfolio than expected – resulting in higher than expected portfolio carrying amount impairments and lower revenue. Total credit risk exposure is equal to the carrying value of the assets. The carrying value of Hoist Finance’s portfolios at year-end was SEK 14,766 million (12,386). The majority of these loans are unsecured, although a limited number of portfolios have properties as collateral. These portfolios had a carrying value of SEK 261 million (226).
The risk of loan portfolios failing to pay as expected is regularly monitored by the business operations and the Risk Control function, with yield outcome compared against forecasts. This analysis is also used to assess potential impairment requirements for portfolio values.
7.1.2 Credit risk associated with the liquidity reserve
The credit risk associated with exposures in Hoist Finance’s liquidity reserve is managed in accordance with the Group’s Treasury Policy, which regulates the share that may be invested in assets issued by individual counterparties. Restrictions include limits on exposures given counterparty credit rating. Hoist Finance’s liquidity reserve mainly consists of bonds issued by the state of Sweden and Swedish municipalities as well as covered bonds.

14
The table to the right shows Standard & Poor’s credit rating for exposures in Hoist Finance’s liquidity reserve at 31 December 2017 as compared with 31 December 2016.
As at 31 December 2017, the weighted average maturity for liquidity portfolio assets was 1.49 years (1.43) and the modified duration was 0.37 years (0.38). Maturity and modified duration are important measures for evaluating the Hoist Finance’s credit spread risks and interest rate risks.
7.1.3 Counterparty credit risk as a result of hedging activities
The Group has counterparty credit risk towards the institutions with which it conducts derivative transactions, which are done solely for the purpose of reducing FX and interest rate risks in the Group.
The Group uses FX and interest rate derivatives to hedge its exchange rate and interest rate exposure. To avoid counterparty credit risks associated with these derivatives, the Group uses ISDA and CSA agreements for all derivative counterparties. These agreements allow for netting and daily settlement of credit risk and, accordingly, counterparty credit risk with derivative counterparties corresponds at most to a one-day fluctuation of the derivative’s value. The CSA agreement is backed by cash collateral. Derivative transactions are only conducted with stable counterparties with a minimum credit rating of A-, which also serves to limit the counter-party credit risk.
7.2 Additional information on credit risk
7.2.1 Past due loans and impairments
Hoist Finance specialises in acquiring portfolios of unsecured non-performing loans originated by large international banks and other financial institutions with whom Hoist Finance has strong and long-term relation-ships. These loan portfolios have been acquired at a significant discount relative to the face value. The price corresponds to the discounted value of expected future collections.
Many of the contracts in the portfolios that Hoist Finance acquires have been terminated for more than one year when the transactions are made, so Hoist Finance categorise the non-performing portfolios as past due more than one year. A financial asset is past due when a counterparty has failed to make a payment when contractually due.
An impairment is recognised when estimated future cash flows are deemed to be lower than previously anticipated. Hoist Finance’s portfolios are subject to revaluations and amortisation, and hence, excluded from impairment testing.
The Group monitors and evaluates actual collections in relation to forecasts, which are the basis for portfolio valuation. Should negative deviations occur, the Group first take additional operational measures in order to reduce the risk of deviations in the future. In the event that additional operational measures do not have, or is believed not to have, the intended effect a revised forecast is done for future collections. The forecast is also adjusted upwards in cases where the portfolios exhibit collections that are estimated to sustainably exceed the current forecast. Forecast adjustments are analysed in consultation with the management Investment Committee, and are decided on the Group level.
Risk Control regularly performs independent assessments of the book values of Hoist Finance acquired loan portfolios in order to verify how well the book values represent a fair and realistic valuation of the assets and to assess the risk of overvaluation of assets. Those reviews are part of Risk Controls duties as independent control function responsible for identification, control and reporting of all risks of the Hoist Finance Group.
15
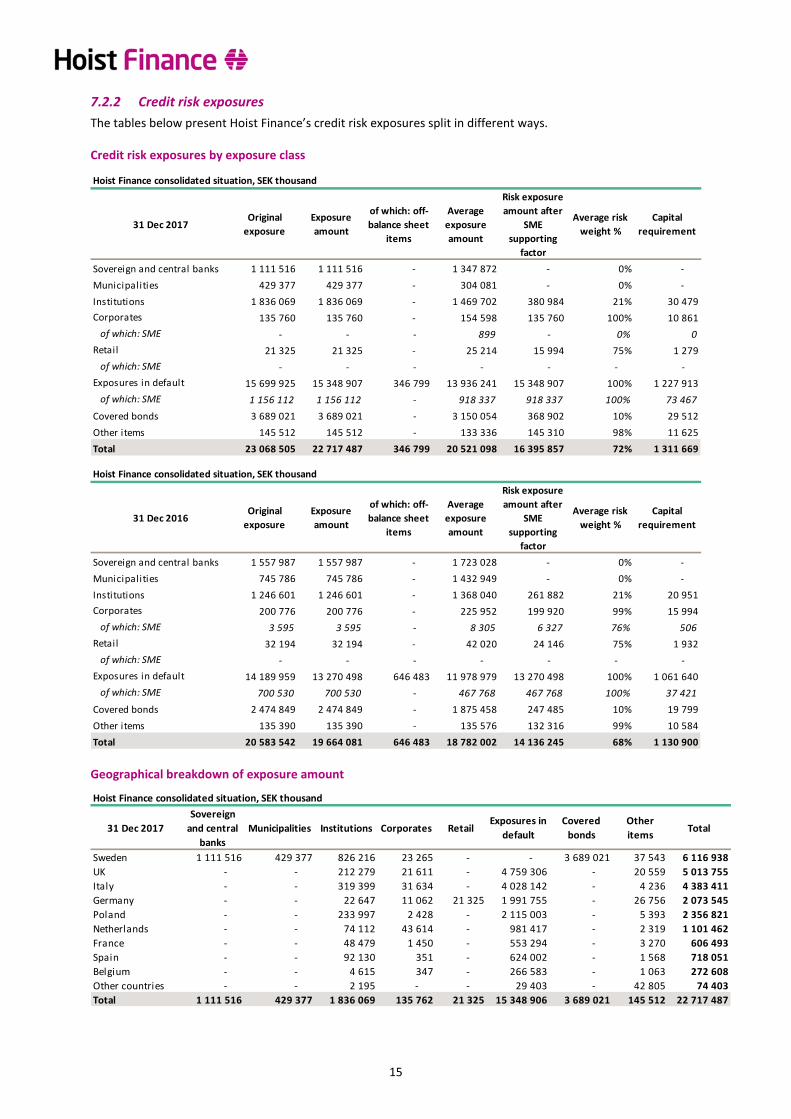
7.2.2 Credit risk exposures
The tables below present Hoist Finance’s credit risk exposures split in different ways.
Credit risk exposures by exposure class
Geographical breakdown of exposure amount
Hoist Finance consolidated situation, SEK thousand
31 Dec 2017Original
exposure
Exposure
amount
of which: off-
balance sheet
items
Average
exposure
amount
Risk exposure
amount after
SME
supporting
factor
Average risk
weight %
Capital
requirement
Sovereign and central banks 1 111 516 1 111 516 - 1 347 872 - 0% -
Municipalities 429 377 429 377 - 304 081 - 0% -
Institutions 1 836 069 1 836 069 - 1 469 702 380 984 21% 30 479
Corporates 135 760 135 760 - 154 598 135 760 100% 10 861
of which: SME - - - 899 - 0% 0
Retail 21 325 21 325 - 25 214 15 994 75% 1 279
of which: SME - - - - - - -
Exposures in default 15 699 925 15 348 907 346 799 13 936 241 15 348 907 100% 1 227 913
of which: SME 1 156 112 1 156 112 - 918 337 918 337 100% 73 467
Covered bonds 3 689 021 3 689 021 - 3 150 054 368 902 10% 29 512
Other items 145 512 145 512 - 133 336 145 310 98% 11 625
Total 23 068 505 22 717 487 346 799 20 521 098 16 395 857 72% 1 311 669
Hoist Finance consolidated situation, SEK thousand
31 Dec 2016Original
exposure
Exposure
amount
of which: off-
balance sheet
items
Average
exposure
amount
Risk exposure
amount after
SME
supporting
factor
Average risk
weight %
Capital
requirement
Sovereign and central banks 1 557 987 1 557 987 - 1 723 028 - 0% -
Municipalities 745 786 745 786 - 1 432 949 - 0% -
Institutions 1 246 601 1 246 601 - 1 368 040 261 882 21% 20 951
Corporates 200 776 200 776 - 225 952 199 920 99% 15 994
of which: SME 3 595 3 595 - 8 305 6 327 76% 506
Retail 32 194 32 194 - 42 020 24 146 75% 1 932
of which: SME - - - - - - -
Exposures in default 14 189 959 13 270 498 646 483 11 978 979 13 270 498 100% 1 061 640
of which: SME 700 530 700 530 - 467 768 467 768 100% 37 421
Covered bonds 2 474 849 2 474 849 - 1 875 458 247 485 10% 19 799
Other items 135 390 135 390 - 135 576 132 316 99% 10 584
Total 20 583 542 19 664 081 646 483 18 782 002 14 136 245 68% 1 130 900
Hoist Finance consolidated situation, SEK thousand
31 Dec 2017
Sovereign
and central
banks
Municipalities Institutions Corporates RetailExposures in
default
Covered
bonds
Other
itemsTotal
Sweden 1 111 516 429 377 826 216 23 265 - - 3 689 021 37 543 6 116 938
UK - - 212 279 21 611 - 4 759 306 - 20 559 5 013 755
Italy - - 319 399 31 634 - 4 028 142 - 4 236 4 383 411
Germany - - 22 647 11 062 21 325 1 991 755 - 26 756 2 073 545
Poland - - 233 997 2 428 - 2 115 003 - 5 393 2 356 821
Netherlands - - 74 112 43 614 - 981 417 - 2 319 1 101 462
France - - 48 479 1 450 - 553 294 - 3 270 606 493
Spain - - 92 130 351 - 624 002 - 1 568 718 051
Belgium - - 4 615 347 - 266 583 - 1 063 272 608
Other countries - - 2 195 - - 29 403 - 42 805 74 403
Total 1 111 516 429 377 1 836 069 135 762 21 325 15 348 906 3 689 021 145 512 22 717 487
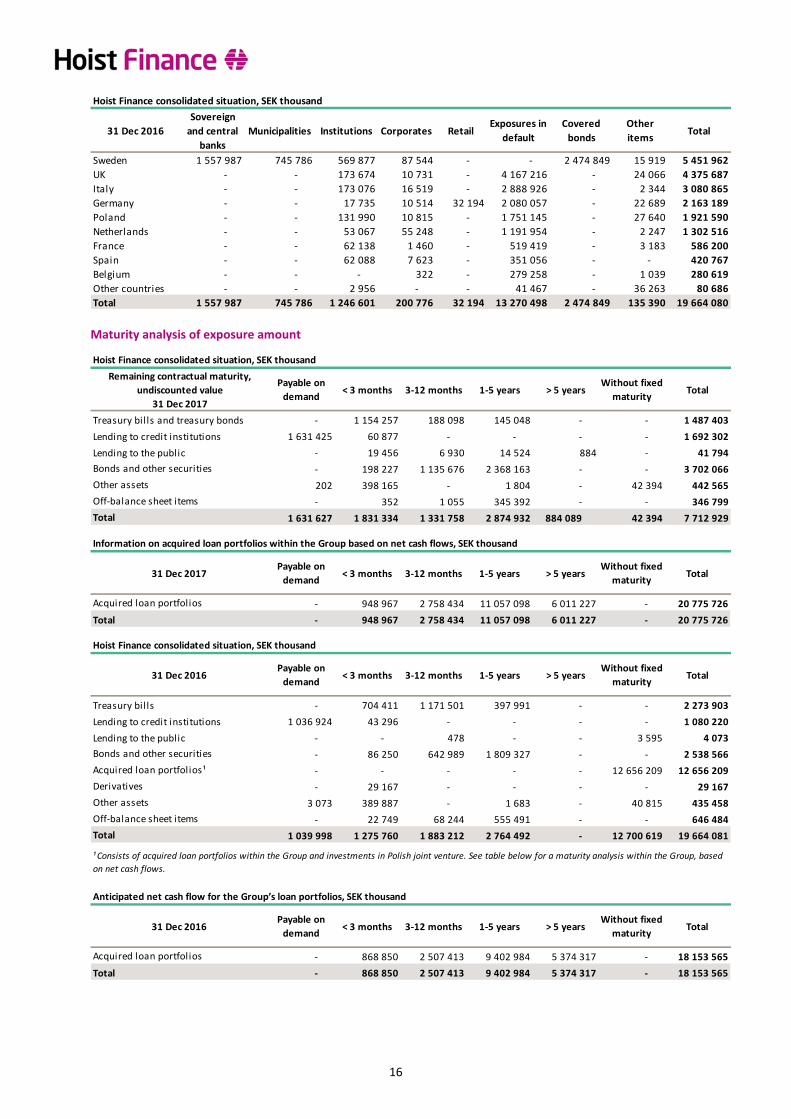
16
Maturity analysis of exposure amount
Hoist Finance consolidated situation, SEK thousand
31 Dec 2016
Sovereign
and central
banks
Municipalities Institutions Corporates RetailExposures in
default
Covered
bonds
Other
itemsTotal
Sweden 1 557 987 745 786 569 877 87 544 - - 2 474 849 15 919 5 451 962
UK - - 173 674 10 731 - 4 167 216 - 24 066 4 375 687
Italy - - 173 076 16 519 - 2 888 926 - 2 344 3 080 865
Germany - - 17 735 10 514 32 194 2 080 057 - 22 689 2 163 189
Poland - - 131 990 10 815 - 1 751 145 - 27 640 1 921 590
Netherlands - - 53 067 55 248 - 1 191 954 - 2 247 1 302 516
France - - 62 138 1 460 - 519 419 - 3 183 586 200
Spain - - 62 088 7 623 - 351 056 - - 420 767
Belgium - - - 322 - 279 258 - 1 039 280 619
Other countries - - 2 956 - - 41 467 - 36 263 80 686
Total 1 557 987 745 786 1 246 601 200 776 32 194 13 270 498 2 474 849 135 390 19 664 080
Hoist Finance consolidated situation, SEK thousand
Remaining contractual maturity,
undiscounted value
31 Dec 2017
Payable on
demand< 3 months 3-12 months 1-5 years > 5 years
Without fixed
maturityTotal
Treasury bills and treasury bonds - 1 154 257 188 098 145 048 - - 1 487 403
Lending to credit institutions 1 631 425 60 877 - - - - 1 692 302
Lending to the public - 19 456 6 930 14 524 884 - 41 794
Bonds and other securities - 198 227 1 135 676 2 368 163 - - 3 702 066
Other assets 202 398 165 - 1 804 - 42 394 442 565
Off-balance sheet items - 352 1 055 345 392 - - 346 799
Total 1 631 627 1 831 334 1 331 758 2 874 932 884 089 42 394 7 712 929
Information on acquired loan portfolios within the Group based on net cash flows, SEK thousand
31 Dec 2017Payable on
demand< 3 months 3-12 months 1-5 years > 5 years
Without fixed
maturityTotal
Acquired loan portfolios - 948 967 2 758 434 11 057 098 6 011 227 - 20 775 726
Total - 948 967 2 758 434 11 057 098 6 011 227 - 20 775 726
Hoist Finance consolidated situation, SEK thousand
31 Dec 2016Payable on
demand< 3 months 3-12 months 1-5 years > 5 years
Without fixed
maturityTotal
Treasury bills - 704 411 1 171 501 397 991 - - 2 273 903
Lending to credit institutions 1 036 924 43 296 - - - - 1 080 220
Lending to the public - - 478 - - 3 595 4 073
Bonds and other securities - 86 250 642 989 1 809 327 - - 2 538 566
Acquired loan portfolios ¹ - - - - - 12 656 209 12 656 209
Derivatives - 29 167 - - - - 29 167
Other assets 3 073 389 887 - 1 683 - 40 815 435 458
Off-balance sheet items - 22 749 68 244 555 491 - - 646 484
Total 1 039 998 1 275 760 1 883 212 2 764 492 - 12 700 619 19 664 081
¹ Consists of acquired loan portfolios within the Group and investments in Polish joint venture. See table below for a maturity analysis within the Group, based
on net cash flows.
Anticipated net cash flow for the Group’s loan portfolios, SEK thousand
31 Dec 2016Payable on
demand< 3 months 3-12 months 1-5 years > 5 years
Without fixed
maturityTotal
Acquired loan portfolios - 868 850 2 507 413 9 402 984 5 374 317 - 18 153 565
Total - 868 850 2 507 413 9 402 984 5 374 317 - 18 153 565
17
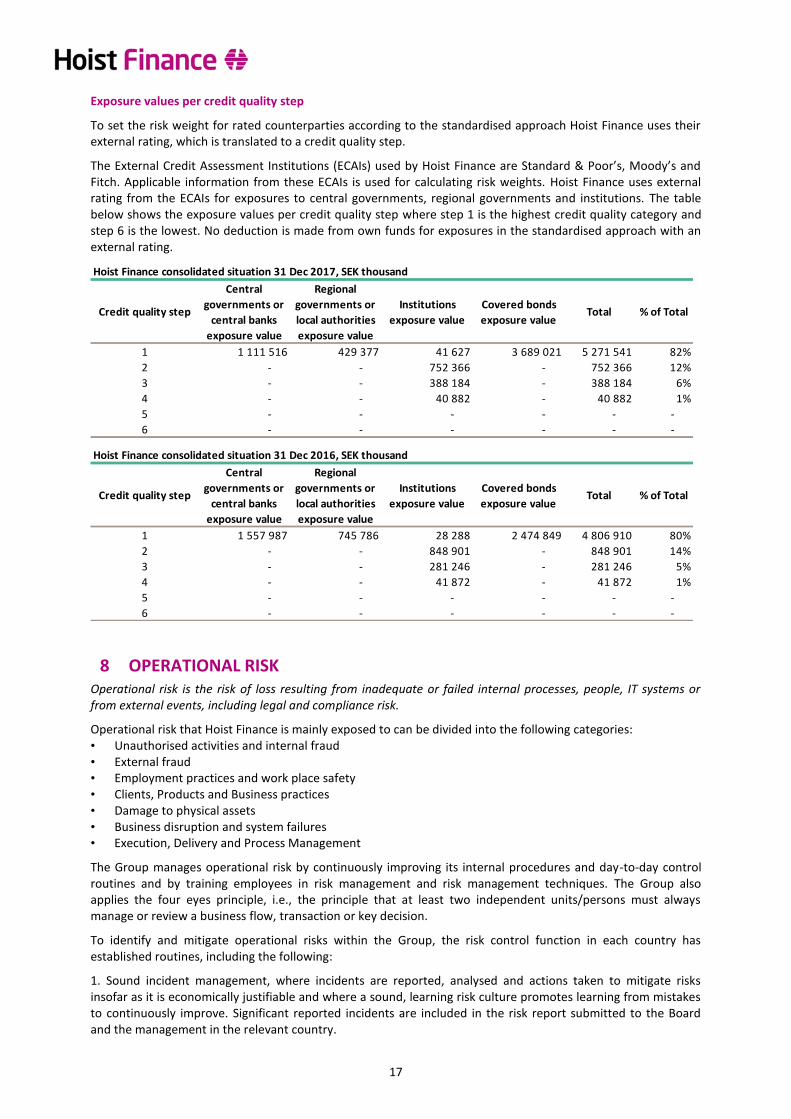
Exposure values per credit quality step
To set the risk weight for rated counterparties according to the standardised approach Hoist Finance uses their external rating, which is translated to a credit quality step.
The External Credit Assessment Institutions (ECAIs) used by Hoist Finance are Standard & Poor’s, Moody’s and Fitch. Applicable information from these ECAIs is used for calculating risk weights. Hoist Finance uses external rating from the ECAIs for exposures to central governments, regional governments and institutions. The table below shows the exposure values per credit quality step where step 1 is the highest credit quality category and step 6 is the lowest. No deduction is made from own funds for exposures in the standardised approach with an external rating.
8 OPERATIONAL RISK Operational risk is the risk of loss resulting from inadequate or failed internal processes, people, IT systems or from external events, including legal and compliance risk.
Operational risk that Hoist Finance is mainly exposed to can be divided into the following categories: • Unauthorised activities and internal fraud • External fraud • Employment practices and work place safety • Clients, Products and Business practices • Damage to physical assets • Business disruption and system failures • Execution, Delivery and Process Management
The Group manages operational risk by continuously improving its internal procedures and day-to-day control routines and by training employees in risk management and risk management techniques. The Group also applies the four eyes principle, i.e., the principle that at least two independent units/persons must always manage or review a business flow, transaction or key decision.
To identify and mitigate operational risks within the Group, the risk control function in each country has established routines, including the following:
1. Sound incident management, where incidents are reported, analysed and actions taken to mitigate risks insofar as it is economically justifiable and where a sound, learning risk culture promotes learning from mistakes to continuously improve. Significant reported incidents are included in the risk report submitted to the Board and the management in the relevant country.
Hoist Finance consolidated situation 31 Dec 2017, SEK thousand
Credit quality step
Central
governments or
central banks
exposure value
Regional
governments or
local authorities
exposure value
Institutions
exposure value
Covered bonds
exposure valueTotal % of Total
1 1 111 516 429 377 41 627 3 689 021 5 271 541 82%
2 - - 752 366 - 752 366 12%
3 - - 388 184 - 388 184 6%
4 - - 40 882 - 40 882 1%
5 - - - - - -
6 - - - - - -
Hoist Finance consolidated situation 31 Dec 2016, SEK thousand
Credit quality step
Central
governments or
central banks
exposure value
Regional
governments or
local authorities
exposure value
Institutions
exposure value
Covered bonds
exposure valueTotal % of Total
1 1 557 987 745 786 28 288 2 474 849 4 806 910 80%
2 - - 848 901 - 848 901 14%
3 - - 281 246 - 281 246 5%
4 - - 41 872 - 41 872 1%
5 - - - - - -
6 - - - - - -
18
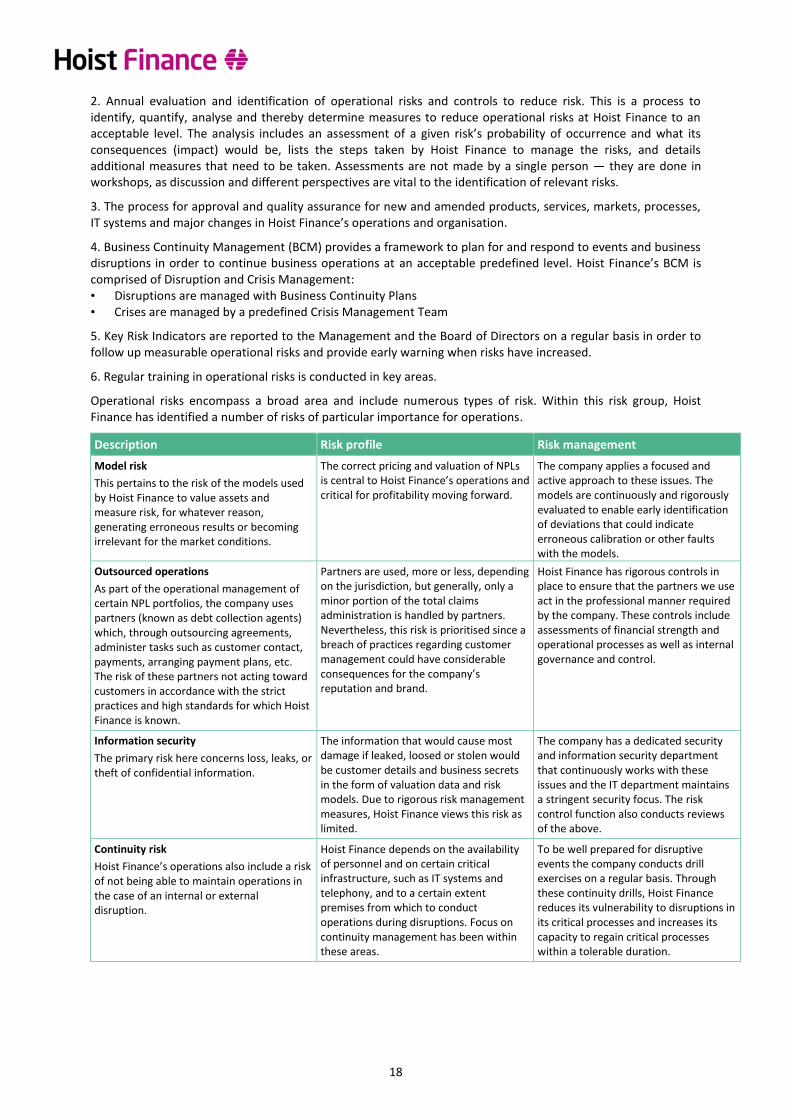
2. Annual evaluation and identification of operational risks and controls to reduce risk. This is a process to identify, quantify, analyse and thereby determine measures to reduce operational risks at Hoist Finance to an acceptable level. The analysis includes an assessment of a given risk’s probability of occurrence and what its consequences (impact) would be, lists the steps taken by Hoist Finance to manage the risks, and details additional measures that need to be taken. Assessments are not made by a single person — they are done in workshops, as discussion and different perspectives are vital to the identification of relevant risks.
3. The process for approval and quality assurance for new and amended products, services, markets, processes, IT systems and major changes in Hoist Finance’s operations and organisation.
4. Business Continuity Management (BCM) provides a framework to plan for and respond to events and business disruptions in order to continue business operations at an acceptable predefined level. Hoist Finance’s BCM is comprised of Disruption and Crisis Management: • Disruptions are managed with Business Continuity Plans • Crises are managed by a predefined Crisis Management Team
5. Key Risk Indicators are reported to the Management and the Board of Directors on a regular basis in order to follow up measurable operational risks and provide early warning when risks have increased.
6. Regular training in operational risks is conducted in key areas.
Operational risks encompass a broad area and include numerous types of risk. Within this risk group, Hoist Finance has identified a number of risks of particular importance for operations.
Description Risk profile Risk management
Model risk
This pertains to the risk of the models used by Hoist Finance to value assets and measure risk, for whatever reason, generating erroneous results or becoming irrelevant for the market conditions.
The correct pricing and valuation of NPLs is central to Hoist Finance’s operations and critical for profitability moving forward.
The company applies a focused and active approach to these issues. The models are continuously and rigorously evaluated to enable early identification of deviations that could indicate erroneous calibration or other faults with the models.
Outsourced operations
As part of the operational management of certain NPL portfolios, the company uses partners (known as debt collection agents) which, through outsourcing agreements, administer tasks such as customer contact, payments, arranging payment plans, etc. The risk of these partners not acting toward customers in accordance with the strict practices and high standards for which Hoist Finance is known.
Partners are used, more or less, depending on the jurisdiction, but generally, only a minor portion of the total claims administration is handled by partners. Nevertheless, this risk is prioritised since a breach of practices regarding customer management could have considerable consequences for the company’s reputation and brand.
Hoist Finance has rigorous controls in place to ensure that the partners we use act in the professional manner required by the company. These controls include assessments of financial strength and operational processes as well as internal governance and control.
Information security
The primary risk here concerns loss, leaks, or theft of confidential information.
The information that would cause most damage if leaked, loosed or stolen would be customer details and business secrets in the form of valuation data and risk models. Due to rigorous risk management measures, Hoist Finance views this risk as limited.
The company has a dedicated security and information security department that continuously works with these issues and the IT department maintains a stringent security focus. The risk control function also conducts reviews of the above.
Continuity risk
Hoist Finance’s operations also include a risk of not being able to maintain operations in the case of an internal or external disruption.
Hoist Finance depends on the availability of personnel and on certain critical infrastructure, such as IT systems and telephony, and to a certain extent premises from which to conduct operations during disruptions. Focus on continuity management has been within these areas.
To be well prepared for disruptive events the company conducts drill exercises on a regular basis. Through these continuity drills, Hoist Finance reduces its vulnerability to disruptions in its critical processes and increases its capacity to regain critical processes within a tolerable duration.
19
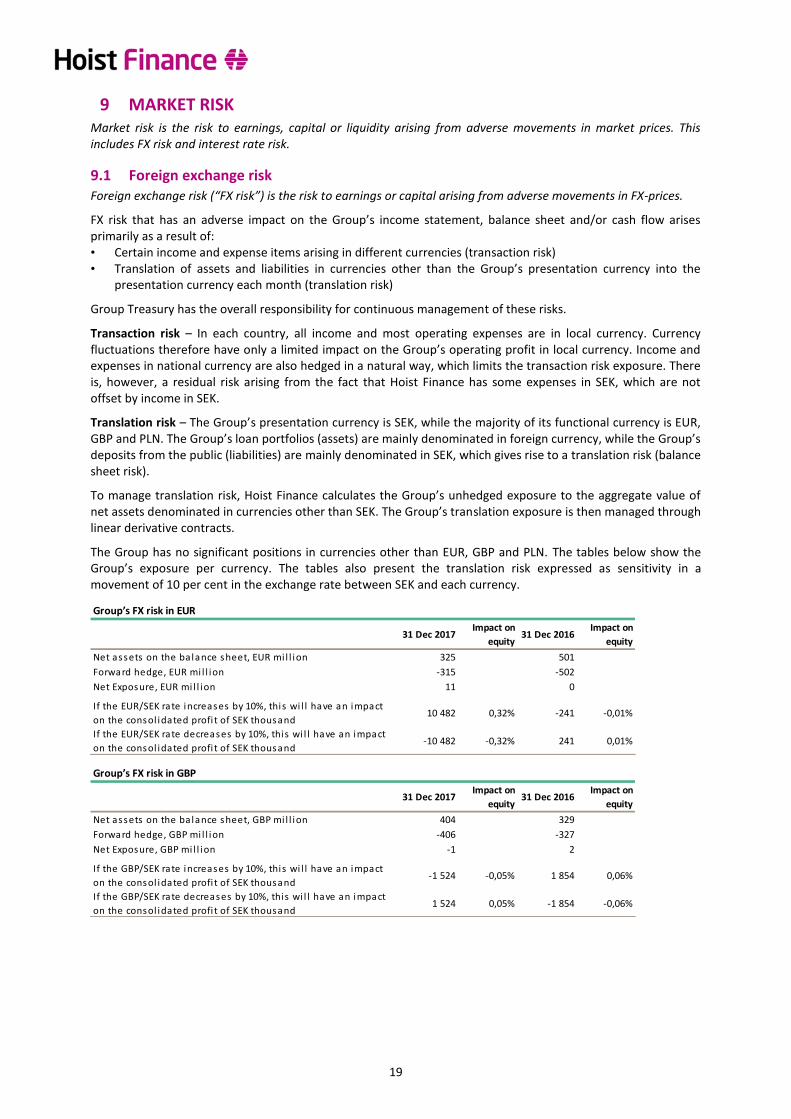
9 MARKET RISK Market risk is the risk to earnings, capital or liquidity arising from adverse movements in market prices. This includes FX risk and interest rate risk.
9.1 Foreign exchange risk Foreign exchange risk (“FX risk”) is the risk to earnings or capital arising from adverse movements in FX-prices.
FX risk that has an adverse impact on the Group’s income statement, balance sheet and/or cash flow arises primarily as a result of: • Certain income and expense items arising in different currencies (transaction risk) • Translation of assets and liabilities in currencies other than the Group’s presentation currency into the
presentation currency each month (translation risk)
Group Treasury has the overall responsibility for continuous management of these risks.
Transaction risk – In each country, all income and most operating expenses are in local currency. Currency fluctuations therefore have only a limited impact on the Group’s operating profit in local currency. Income and expenses in national currency are also hedged in a natural way, which limits the transaction risk exposure. There is, however, a residual risk arising from the fact that Hoist Finance has some expenses in SEK, which are not offset by income in SEK.
Translation risk – The Group’s presentation currency is SEK, while the majority of its functional currency is EUR, GBP and PLN. The Group’s loan portfolios (assets) are mainly denominated in foreign currency, while the Group’s deposits from the public (liabilities) are mainly denominated in SEK, which gives rise to a translation risk (balance sheet risk).
To manage translation risk, Hoist Finance calculates the Group’s unhedged exposure to the aggregate value of net assets denominated in currencies other than SEK. The Group’s translation exposure is then managed through linear derivative contracts.
The Group has no significant positions in currencies other than EUR, GBP and PLN. The tables below show the Group’s exposure per currency. The tables also present the translation risk expressed as sensitivity in a movement of 10 per cent in the exchange rate between SEK and each currency.
Group’s FX risk in EUR
31 Dec 2017Impact on
equity31 Dec 2016
Impact on
equity
Net assets on the balance sheet, EUR mi l l ion 325 501
Forward hedge, EUR mi l l ion -315 -502
Net Exposure, EUR mi l l ion 11 0
If the EUR/SEK rate increases by 10%, this wi l l have an impact
on the consol idated profi t of SEK thousand10 482 0,32% -241 -0,01%
If the EUR/SEK rate decreases by 10%, this wi l l have an impact
on the consol idated profi t of SEK thousand-10 482 -0,32% 241 0,01%
Group’s FX risk in GBP
31 Dec 2017Impact on
equity31 Dec 2016
Impact on
equity
Net assets on the balance sheet, GBP mi l l ion 404 329
Forward hedge, GBP mi l l ion -406 -327
Net Exposure, GBP mi l l ion -1 2
If the GBP/SEK rate increases by 10%, this wi l l have an impact
on the consol idated profi t of SEK thousand-1 524 -0,05% 1 854 0,06%
If the GBP/SEK rate decreases by 10%, this wi l l have an impact
on the consol idated profi t of SEK thousand1 524 0,05% -1 854 -0,06%
20
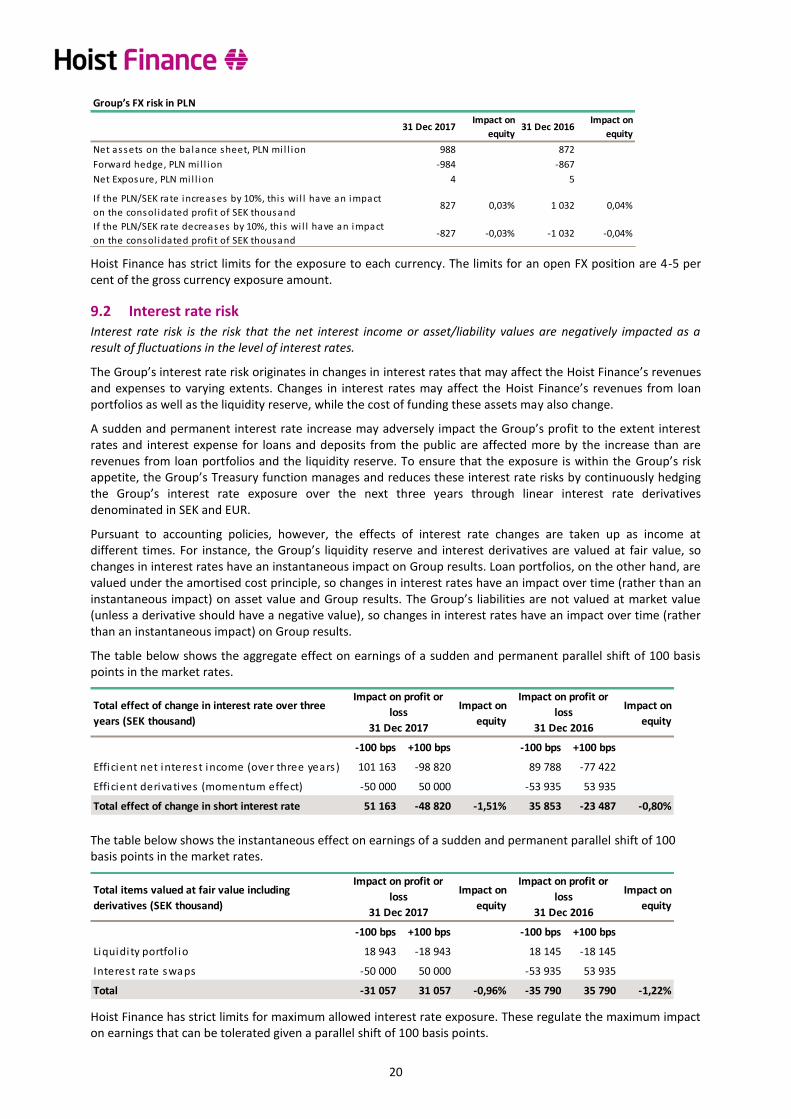
Hoist Finance has strict limits for the exposure to each currency. The limits for an open FX position are 4-5 per cent of the gross currency exposure amount.
9.2 Interest rate risk Interest rate risk is the risk that the net interest income or asset/liability values are negatively impacted as a result of fluctuations in the level of interest rates.
The Group’s interest rate risk originates in changes in interest rates that may affect the Hoist Finance’s revenues and expenses to varying extents. Changes in interest rates may affect the Hoist Finance’s revenues from loan portfolios as well as the liquidity reserve, while the cost of funding these assets may also change.
A sudden and permanent interest rate increase may adversely impact the Group’s profit to the extent interest rates and interest expense for loans and deposits from the public are affected more by the increase than are revenues from loan portfolios and the liquidity reserve. To ensure that the exposure is within the Group’s risk appetite, the Group’s Treasury function manages and reduces these interest rate risks by continuously hedging the Group’s interest rate exposure over the next three years through linear interest rate derivatives denominated in SEK and EUR.
Pursuant to accounting policies, however, the effects of interest rate changes are taken up as income at different times. For instance, the Group’s liquidity reserve and interest derivatives are valued at fair value, so changes in interest rates have an instantaneous impact on Group results. Loan portfolios, on the other hand, are valued under the amortised cost principle, so changes in interest rates have an impact over time (rather than an instantaneous impact) on asset value and Group results. The Group’s liabilities are not valued at market value (unless a derivative should have a negative value), so changes in interest rates have an impact over time (rather than an instantaneous impact) on Group results.
The table below shows the aggregate effect on earnings of a sudden and permanent parallel shift of 100 basis points in the market rates.
The table below shows the instantaneous effect on earnings of a sudden and permanent parallel shift of 100 basis points in the market rates.
Hoist Finance has strict limits for maximum allowed interest rate exposure. These regulate the maximum impact on earnings that can be tolerated given a parallel shift of 100 basis points.
Group’s FX risk in PLN
31 Dec 2017Impact on
equity31 Dec 2016
Impact on
equity
Net assets on the balance sheet, PLN mi l l ion 988 872
Forward hedge, PLN mi l l ion -984 -867
Net Exposure, PLN mi l l ion 4 5
If the PLN/SEK rate increases by 10%, this wi l l have an impact
on the consol idated profi t of SEK thousand827 0,03% 1 032 0,04%
If the PLN/SEK rate decreases by 10%, this wi l l have an impact
on the consol idated profi t of SEK thousand-827 -0,03% -1 032 -0,04%
Total effect of change in interest rate over three
years (SEK thousand)
Impact on
equity
Impact on
equity
-100 bps +100 bps -100 bps +100 bps
Efficient net interest income (over three years) 101 163 -98 820 89 788 -77 422
Efficient derivatives (momentum effect) -50 000 50 000 -53 935 53 935
Total effect of change in short interest rate 51 163 -48 820 -1,51% 35 853 -23 487 -0,80%
Impact on profit or
loss
31 Dec 2017
Impact on profit or
loss
31 Dec 2016
Total items valued at fair value including
derivatives (SEK thousand)
Impact on
equity
Impact on
equity
-100 bps +100 bps -100 bps +100 bps
Liquidity portfol io 18 943 -18 943 18 145 -18 145
Interest rate swaps -50 000 50 000 -53 935 53 935
Total -31 057 31 057 -0,96% -35 790 35 790 -1,22%
Impact on profit or
loss
31 Dec 2017
Impact on profit or
loss
31 Dec 2016

21
10 LIQUIDITY RISK Liquidity risk is the risk of difficulties in obtaining funding and thus, not being able to meet payment obligations at maturity without encountering significantly higher financing costs.
The Group’s cash flow from acquired loan portfolios is in its nature positive. The group normally receive a cash flow of ca 1.8 times the invested amount, over time. Major cash outflows stem from a deliberate decision to invest in a new portfolio or from unexpected cash outflows. The latter can result from outflow of deposits or from outflow due to mark-to-market of hedging derivatives or from outflow of existing wholesale funding (re-financing risk).
The overall objective of the Group’s liquidity management is to ensure that the Group maintains control over its liquidity risk situation, with sufficient amounts of liquid assets or immediately saleable assets to ensure timely satisfaction of its payment obligations without incurring high additional costs.
The Group has a diversified funding base with a diversified maturity structure, mainly in the form of deposits from the public and senior unsecured bonds, own funds instruments and equity. The majority of deposits from the public are payable on demand (flexible), while approximately 35 per cent (36) of the Group’s deposits from the public are locked into longer maturities (“term deposits”) ranging from 12 to 36 months.
In addition to having a diversified funding structure with respect to funding sources and maturity structure, the Group has taken a number of measures to minimise liquidity risk: • Centralised liquidity management: Management of liquidity risk is centralised and handled by the Group’s
Treasury function. • Independent analysis: The Group’s Risk Control function serves as a central unit for independent liquidity
analysis. Internal Audit is responsible for inspecting the Group’s liquidity control tools. • Continuous monitoring: The Group uses short- and long-term liquidity forecasts to monitor liquidity position
and reduce liquidity risk. These forecasts are presented to the Management and the Board of Directors. • Stress testing: The Group conducts stress tests of the liquidity situation. These tests vary in nature to
demonstrate the risk from multiple angles and to preclude negative results due to defects in stress test methodology.
• Interest rate adjustment: The size of deposits from the public can be managed by adjusting offered interest rates.
• Well-diversified deposit portfolio with no concentration risks: The highest savings amount is SEK 950 thousand. The risk of large outflows is further reduced through the coverage of 99 per cent of deposits by the deposit guarantee scheme.
• Liquidity portfolio: Liquidity investments are made in low-risk, high-liquidity interest-bearing securities, which allows for swift cash conversion if needed.
Hoist Finance has a low appetite for assuming liquidity risk why potential future liquidity gaps are covered by generous liquidity reserves. Hoist Finance’s liquidity reserve mainly consists of bonds issued by the state of Sweden and Swedish municipalities as well as covered bonds, see table below.
The Group’s Treasury Policy specifies a limit and a target level for the amount of available liquidity. Available liquidity totalled SEK 6,800 million (5,789) at 31 December 2017, exceeding the limit and the target level by a significant margin.
Total Total
31 Dec 2017 SEK EUR Other 31 Dec 2016
Cash and holdings in centra l banks 202 0 202 0 3 073
Depos its in other banks avai lable overnight 1 620 581 90 346 876 615 653 620 1 036 749
Securi ties i ssued or guaranteed by sovereigns , centra l banks or multi latera l development banks 1 060 775 1 060 775 0 0 1 528 116
Securi ties i ssued or guaranteed by municipal i ties or other publ ic sector enti ties 429 377 429 377 0 0 745 786
Covered bonds 3 689 021 3 689 021 0 0 2 474 849
Securi ties i ssued by non-financia l corporates 0 0 0 0 0
Securi ties i ssued by financia l corporates 0 0 0 0 0
Other 0 0 0 0 0
Total 6 799 956 5 269 519 876 817 653 620 5 788 573
Currency dis tributionLiquidity reserve, SEK thousand
22
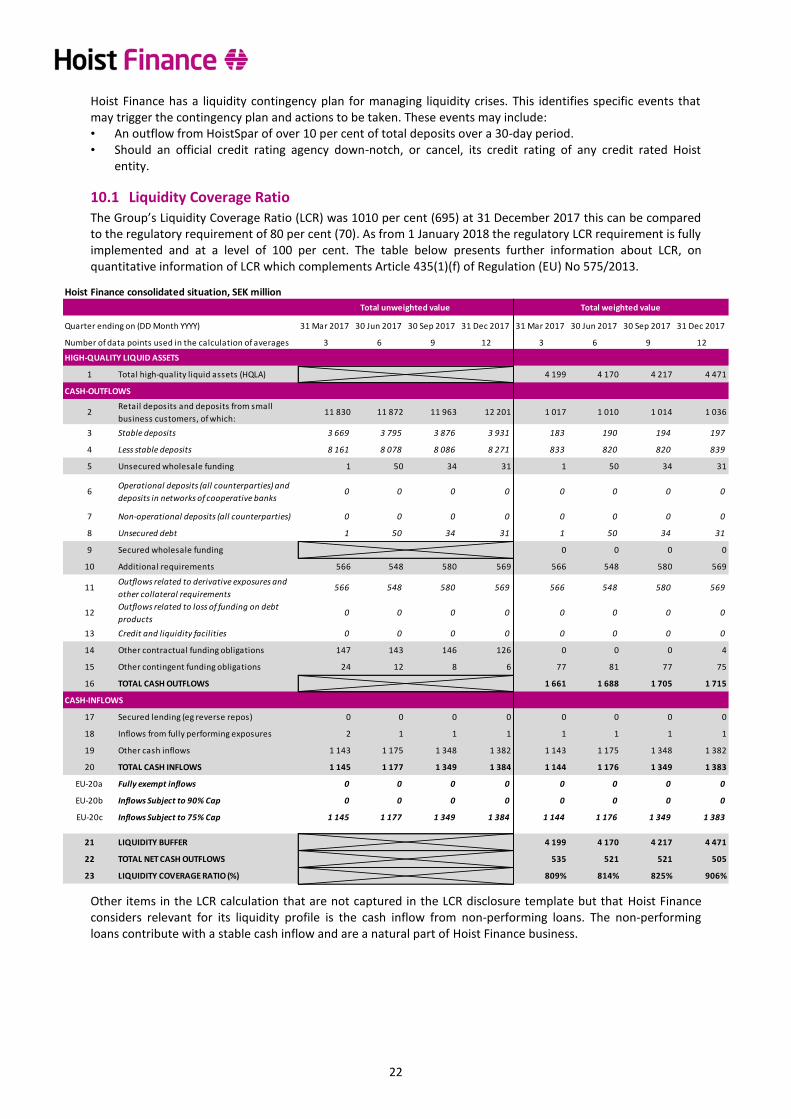
Hoist Finance has a liquidity contingency plan for managing liquidity crises. This identifies specific events that may trigger the contingency plan and actions to be taken. These events may include: • An outflow from HoistSpar of over 10 per cent of total deposits over a 30-day period. • Should an official credit rating agency down-notch, or cancel, its credit rating of any credit rated Hoist
entity.
10.1 Liquidity Coverage Ratio The Group’s Liquidity Coverage Ratio (LCR) was 1010 per cent (695) at 31 December 2017 this can be compared to the regulatory requirement of 80 per cent (70). As from 1 January 2018 the regulatory LCR requirement is fully implemented and at a level of 100 per cent. The table below presents further information about LCR, on quantitative information of LCR which complements Article 435(1)(f) of Regulation (EU) No 575/2013.
Other items in the LCR calculation that are not captured in the LCR disclosure template but that Hoist Finance considers relevant for its liquidity profile is the cash inflow from non-performing loans. The non-performing loans contribute with a stable cash inflow and are a natural part of Hoist Finance business.
Hoist Finance consolidated situation, SEK million
Quarter ending on (DD Month YYYY) 31 Mar 2017 30 Jun 2017 30 Sep 2017 31 Dec 2017 31 Mar 2017 30 Jun 2017 30 Sep 2017 31 Dec 2017
Number of data points used in the calculation of averages 3 6 9 12 3 6 9 12
HIGH-QUALITY LIQUID ASSETS
1 Total high-quality liquid assets (HQLA) 4 199 4 170 4 217 4 471
CASH-OUTFLOWS
2Retail deposits and deposits from small
business customers, of which:11 830 11 872 11 963 12 201 1 017 1 010 1 014 1 036
3 Stable deposits 3 669 3 795 3 876 3 931 183 190 194 197
4 Less stable deposits 8 161 8 078 8 086 8 271 833 820 820 839
5 Unsecured wholesale funding 1 50 34 31 1 50 34 31
6Operational deposits (all counterparties) and
deposits in networks of cooperative banks0 0 0 0 0 0 0 0
7 Non-operational deposits (all counterparties) 0 0 0 0 0 0 0 0
8 Unsecured debt 1 50 34 31 1 50 34 31
9 Secured wholesale funding 0 0 0 0
10 Additional requirements 566 548 580 569 566 548 580 569
11Outflows related to derivative exposures and
other collateral requirements566 548 580 569 566 548 580 569
12Outflows related to loss of funding on debt
products0 0 0 0 0 0 0 0
13 Credit and liquidity facilities 0 0 0 0 0 0 0 0
14 Other contractual funding obligations 147 143 146 126 0 0 0 4
15 Other contingent funding obligations 24 12 8 6 77 81 77 75
16 TOTAL CASH OUTFLOWS 1 661 1 688 1 705 1 715
CASH-INFLOWS
17 Secured lending (eg reverse repos) 0 0 0 0 0 0 0 0
18 Inflows from fully performing exposures 2 1 1 1 1 1 1 1
19 Other cash inflows 1 143 1 175 1 348 1 382 1 143 1 175 1 348 1 382
20 TOTAL CASH INFLOWS 1 145 1 177 1 349 1 384 1 144 1 176 1 349 1 383
EU-20a Fully exempt inflows 0 0 0 0 0 0 0 0
EU-20b Inflows Subject to 90% Cap 0 0 0 0 0 0 0 0
EU-20c Inflows Subject to 75% Cap 1 145 1 177 1 349 1 384 1 144 1 176 1 349 1 383
21 LIQUIDITY BUFFER 4 199 4 170 4 217 4 471
22 TOTAL NET CASH OUTFLOWS 535 521 521 505
23 LIQUIDITY COVERAGE RATIO (%) 809% 814% 825% 906%
Total unweighted value Total weighted value

23
DEFINITIONS
Term Definition
Additional Tier 1 capital (AT1)
All Tier 1 capital, which does not qualify as Common equity tier 1 capital, e.g. Tier 1 capital instruments.
Capital conservation buffer
A requirement for a capital buffer of 2.5 per cent of total risk exposure amount consisting of Common Equity Tier 1 capital. If the buffer is not complete, the bank must retain a portion of its profit to improve its capital ratio.
Common Equity Tier 1 capital (CET1)
Common shares issued by the institution, share premium, retained earnings, other comprehensive income, other disclosed reserves after deduction for deferred tax assets, intangible assets and goodwill.
Common Equity Tier 1 capital ratio
Common Equity Tier 1 capital in relation to total risk exposure amount.
Compliance risk The current or prospective risk to earnings and/or capital arising from violations or non-compliance with laws, rules, regulations, agreements, prescribed practices or ethical standards which can lead to fines, damages and/or the voiding of contracts and can diminish an institution’s reputation.
Concentration risk The vulnerability inherent in the concentration of exposures to a limited number of customers, suppliers, a particular sector or a geographic area.
Control function An independent function for risk control, compliance or internal audit.
Countercyclical buffer
A buffer calculated as a percentage of total risk exposure amount and depends on the geographical distribution of the Group’s credit exposures and the countercyclical values in these different countries as set by local regulators. The Countercyclical buffer shall regularly be updated and added to or deducted from the Group’s capital limits.
Liquidity Coverage Ratio (LCR)
A regulatory measure defined as the ratio between liquidity assets and net outflows in a 30 days’ period.
Legal risk The risk that contracts or other legal documents cannot be executed according to specified terms or that legal proceedings are initiated which affect the Group’s operations in a negative way.
Leverage ratio Tier 1 capital divided by the total exposure measure calculated in accordance with proposed amendments to Regulation (EU) No 575/2013.
Limit An established permitted level for a risk exposure.
Own funds The sum of Tier 1 capital and Tier 2 capital.
Own funds requirements – Pillar 1
Minimum own funds requirements for credit, market and operational risk.
Own funds requirements – Pillar 2
Own funds requirements in addition to the ones in Pillar 1.
Risk Exposure Amount (REA)
The sum of risk weighted assets for credit risk, and risk exposure amounts for market and operational risk.
Risk management Identifying, analysing, measuring, managing, controlling and reporting significant risks, which the Group is or may be exposed to.
Risk management framework
The Group’s strategies, processes, procedures, internal rules, limits, controls and reporting procedures, which govern the Group’s risk management processes.
Risk Strategy A strategy for assuming, steering and exercising control of the risks to which the Group is or could become exposed.
Risks to capital Risks that, should they materialise, will have a significant impact on the Group’s own funds over the next 12 months.
Tier 1 capital (T1) The sum of Common Equity Tier 1 capital and Additional Tier 1 capital.
Tier 1 capital ratio Tier 1 capital in relation to total risk exposure amount.
Tier 2 capital (T2) Subordinated loans as well as fixed-term subordinated loans with certain conditions as set out in Regulation (EU) No 575/2013.
Total capital ratio Own funds in relation to total risk exposure amount.

24
ANNEX I – CONSOLIDATED SITUATION AND BALANCE SHEET RECONCILIATION CONSOLIDATED SITUATION
Hoist Kredit is a credit market company, licensed and supervised by the SFSA, and is the only regulated entity within the consolidated situation. The parent company, Hoist Finance AB (publ) is included in the consolidated situation. All subsidiaries are fully consolidated and the joint venture BEST III NS FIZ and PQH Special Liquidation S.A. are consolidated using the proportional method. The tables below present companies included in Hoist Finance consolidated situation, both pre and post the merger between Hoist Finance AB (publ) and Hoist Kredit that was concluded on 2 January 2018 and in which Hoist Kredit was dissolved. The regulated entity within the Group will, going forward, be Hoist Finance AB (publ). For an overview of the complete legal structure, please see Hoist Finance’s Annual Report.
Company name (pre-merger) Corporate identity number Domicile Ownership %
Parent company
Hoist Finance AB (publ) 556012-8489 Stockholm
Subsidiaries
Hoist Kredit AB (publ) 556329-5699 Stockholm 100
Branches of Hoist Kredit AB (publ)
Hoist Kredit AB (publ), Belgium Branch 556329-5699 Brussels 100
Hoist Kredit AB (publ), Netherlands Branch 556329-5699 Amsterdam 100
Hoist Kredit AB (publ) Niederlassung Deutschland
556012-8489 Duisburg 100
Subsidiaries of Hoist Kredit AB (publ)
Hoist Finance Services AB 556640-9941 Stockholm 100
Hoist Finance SAS 444611453 Lille 100
HECTOR Sicherheiten-Verwaltungs GmbH HRB 74561 Duisburg 100
Hoist Portfolio Holding Ltd. 101438 St. Helier 100
Hoist Portfolio Holding 2 Ltd. 111085 St. Helier 100
Hoist Kredit Ltd. 7646691 London 100
Hoist Finance UK Ltd. 8303007 London 100
Robinson Way Ltd. 6976081 Manchester 100
Compello Holdings Ltd. 8045571 Milton Keynes 100
Compello Operations Ltd. 8045559 Milton Keynes 100
MKE (UK) Ltd. 7042157 Milton Keynes 100
MKDP LLP OC349372 Milton Keynes 100
C L Finance Ltd. 1108021 West Yorkshire 100
The Lewis Group Ltd. SC127043 Glasgow 100
Hoist Italia S.R.L 12898671008 Rome 100
Marte SPV S.R.L 4634710265 Conegliano 100
Nais Uno Reoco S.r.l. RM-1530404 Rome 100
Hoist Finance Cyprus Ltd. HE 338570 Nicosia 100
Hoist Polska sp. z o.o. 0000536257 Wroclaw 100
Hoist Spain S.L. B87547659 Madrid 100
Optimus Portfolio Management S.L. B86959285 Madrid 100
Hoist Hellas S.A. 137777901000 Athens
Funds
HOIST I NS FIZ* RFI 702 Warszawa 100
Go Debt1 FIZ NFS* 0000292229 Warszawa 100
Joint venture
BEST III NS FIZ* RFI 623 Gdynia 50
PQH Single Special Liquidation S.A. 138353201000 Athens 33
* Polish Sec Fund. Non-standardised securitisation funds of which Hoist Finance Kredit AB (publ) holds investment certificates

25
Company name (post-merger) Corporate identity number Domicile Ownership %
Parent company
Hoist Finance AB (publ) 556012-8489 Stockholm
Branches of Hoist Finance AB (publ)
Hoist Finance AB (publ), Belgium Branch 556329-5699 Brussels 100
Hoist Finance AB (publ), Netherlands Branch
556329-5699 Amsterdam 100
Hoist Finance AB (publ) Niederlassung Deutschland
556012-8489 Duisburg 100
Subsidiaries of Hoist Finance AB (publ)
Hoist Finance Services AB 556640-9941 Stockholm 100
Hoist Finance SAS 444611453 Lille 100
HECTOR Sicherheiten-Verwaltungs GmbH HRB 74561 Duisburg 100
Hoist Portfolio Holding Ltd. 101438 St. Helier 100
Hoist Portfolio Holding 2 Ltd. 111085 St. Helier 100
Hoist Kredit Ltd. 7646691 London 100
Hoist Finance UK Ltd. 8303007 London 100
Robinson Way Ltd. 6976081 Manchester 100
Compello Holdings Ltd. 8045571 Milton Keynes 100
Compello Operations Ltd. 8045559 Milton Keynes 100
MKE (UK) Ltd. 7042157 Milton Keynes 100
MKDP LLP OC349372 Milton Keynes 100
C L Finance Ltd. 1108021 West Yorkshire 100
The Lewis Group Ltd. SC127043 Glasgow 100
Hoist Italia S.R.L 12898671008 Rome 100
Marte SPV S.R.L 4634710265 Conegliano 100
Nais Uno Reoco S.r.l. RM-1530404 Rome 100
Hoist Finance Cyprus Ltd. HE 338570 Nicosia 100
Hoist Polska sp. z o.o. 0000536257 Wroclaw 100
Hoist Spain S.L. B87547659 Madrid 100
Optimus Portfolio Management S.L. B86959285 Madrid 100
Hoist Hellas S.A. 137777901000 Athens
Funds
HOIST I NS FIZ* RFI 702 Warszawa 100
Go Debt1 FIZ NFS* 0000292229 Warszawa 100
Joint venture
BEST III NS FIZ* RFI 623 Gdynia 50
PQH Single Special Liquidation S.A. 138353201000 Athens 33
* Polish Sec Fund. Non-standardised securitisation funds of which Hoist Finance AB (publ) holds investment certificates.
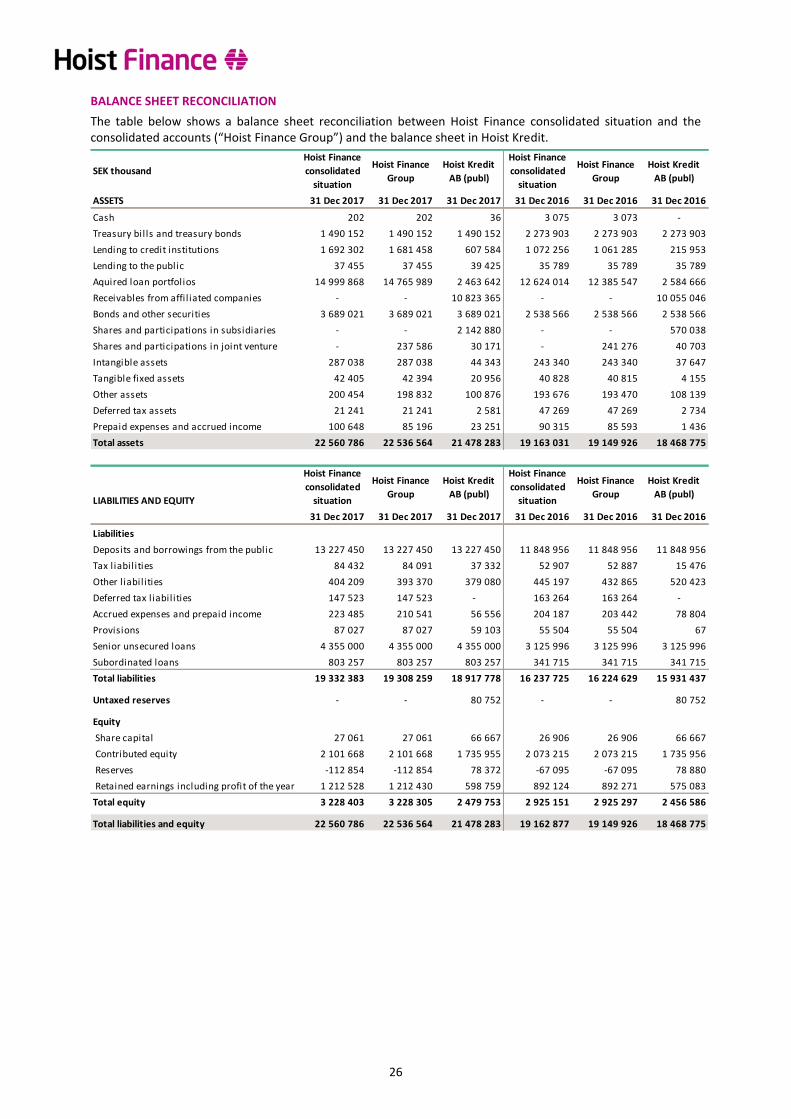
26
BALANCE SHEET RECONCILIATION
The table below shows a balance sheet reconciliation between Hoist Finance consolidated situation and the consolidated accounts (“Hoist Finance Group”) and the balance sheet in Hoist Kredit.
SEK thousand
Hoist Finance
consolidated
situation
Hoist Finance
Group
Hoist Kredit
AB (publ)
Hoist Finance
consolidated
situation
Hoist Finance
Group
Hoist Kredit
AB (publ)
ASSETS 31 Dec 2017 31 Dec 2017 31 Dec 2017 31 Dec 2016 31 Dec 2016 31 Dec 2016
Cash 202 202 36 3 075 3 073 -
Treasury bil ls and treasury bonds 1 490 152 1 490 152 1 490 152 2 273 903 2 273 903 2 273 903
Lending to credit institutions 1 692 302 1 681 458 607 584 1 072 256 1 061 285 215 953
Lending to the public 37 455 37 455 39 425 35 789 35 789 35 789
Aquired loan portfolios 14 999 868 14 765 989 2 463 642 12 624 014 12 385 547 2 584 666
Receivables from affil iated companies - - 10 823 365 - - 10 055 046
Bonds and other securities 3 689 021 3 689 021 3 689 021 2 538 566 2 538 566 2 538 566
Shares and participations in subsidiaries - - 2 142 880 - - 570 038
Shares and participations in joint venture - 237 586 30 171 - 241 276 40 703
Intangible assets 287 038 287 038 44 343 243 340 243 340 37 647
Tangible fixed assets 42 405 42 394 20 956 40 828 40 815 4 155
Other assets 200 454 198 832 100 876 193 676 193 470 108 139
Deferred tax assets 21 241 21 241 2 581 47 269 47 269 2 734
Prepaid expenses and accrued income 100 648 85 196 23 251 90 315 85 593 1 436
Total assets 22 560 786 22 536 564 21 478 283 19 163 031 19 149 926 18 468 775
LIABILITIES AND EQUITY
Hoist Finance
consolidated
situation
Hoist Finance
Group
Hoist Kredit
AB (publ)
Hoist Finance
consolidated
situation
Hoist Finance
Group
Hoist Kredit
AB (publ)
31 Dec 2017 31 Dec 2017 31 Dec 2017 31 Dec 2016 31 Dec 2016 31 Dec 2016
Liabilities
Deposits and borrowings from the public 13 227 450 13 227 450 13 227 450 11 848 956 11 848 956 11 848 956
Tax liabilities 84 432 84 091 37 332 52 907 52 887 15 476
Other l iabilities 404 209 393 370 379 080 445 197 432 865 520 423
Deferred tax l iabilities 147 523 147 523 - 163 264 163 264 -
Accrued expenses and prepaid income 223 485 210 541 56 556 204 187 203 442 78 804
Provisions 87 027 87 027 59 103 55 504 55 504 67
Senior unsecured loans 4 355 000 4 355 000 4 355 000 3 125 996 3 125 996 3 125 996
Subordinated loans 803 257 803 257 803 257 341 715 341 715 341 715
Total liabilities 19 332 383 19 308 259 18 917 778 16 237 725 16 224 629 15 931 437
Untaxed reserves - - 80 752 - - 80 752
Equity
Share capital 27 061 27 061 66 667 26 906 26 906 66 667
Contributed equity 2 101 668 2 101 668 1 735 955 2 073 215 2 073 215 1 735 956
Reserves -112 854 -112 854 78 372 -67 095 -67 095 78 880
Retained earnings including profit of the year 1 212 528 1 212 430 598 759 892 124 892 271 575 083
Total equity 3 228 403 3 228 305 2 479 753 2 925 151 2 925 297 2 456 586
Total liabilities and equity 22 560 786 22 536 564 21 478 283 19 162 877 19 149 926 18 468 775
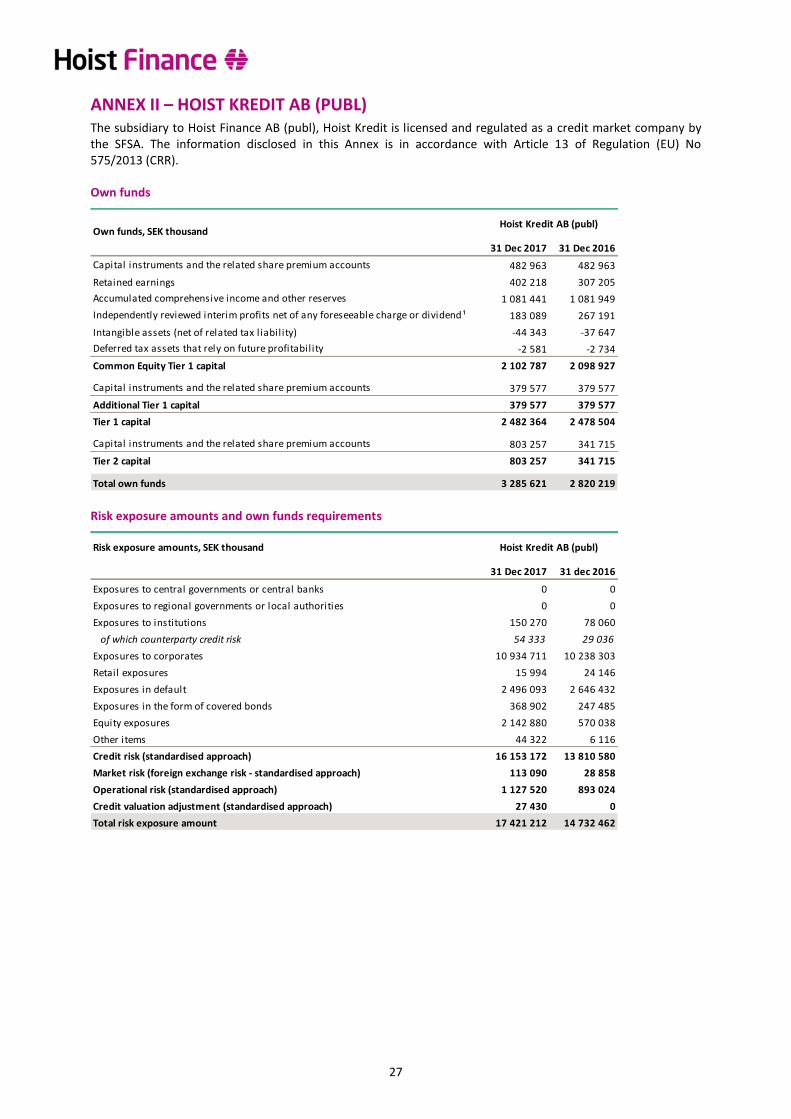
27
ANNEX II – HOIST KREDIT AB (PUBL) The subsidiary to Hoist Finance AB (publ), Hoist Kredit is licensed and regulated as a credit market company by the SFSA. The information disclosed in this Annex is in accordance with Article 13 of Regulation (EU) No 575/2013 (CRR).
Own funds
Risk exposure amounts and own funds requirements
Own funds, SEK thousand
31 Dec 2017 31 Dec 2016
Capital instruments and the related share premium accounts 482 963 482 963
Retained earnings 402 218 307 205
Accumulated comprehensive income and other reserves 1 081 441 1 081 949
Independently reviewed interim profits net of any foreseeable charge or dividend ¹ 183 089 267 191
Intangible assets (net of related tax liability) -44 343 -37 647
Deferred tax assets that rely on future profitability -2 581 -2 734
Common Equity Tier 1 capital 2 102 787 2 098 927
Capital instruments and the related share premium accounts 379 577 379 577
Additional Tier 1 capital 379 577 379 577
Tier 1 capital 2 482 364 2 478 504
Capital instruments and the related share premium accounts 803 257 341 715
Tier 2 capital 803 257 341 715
Total own funds 3 285 621 2 820 219
Hoist Kredit AB (publ)
Risk exposure amounts, SEK thousand
31 Dec 2017 31 dec 2016
Exposures to central governments or central banks 0 0
Exposures to regional governments or local authorities 0 0
Exposures to institutions 150 270 78 060
of which counterparty credit risk 54 333 29 036
Exposures to corporates 10 934 711 10 238 303
Retail exposures 15 994 24 146
Exposures in default 2 496 093 2 646 432
Exposures in the form of covered bonds 368 902 247 485
Equity exposures 2 142 880 570 038
Other items 44 322 6 116
Credit risk (standardised approach) 16 153 172 13 810 580
Market risk (foreign exchange risk - standardised approach) 113 090 28 858
Operational risk (standardised approach) 1 127 520 893 024
Credit valuation adjustment (standardised approach) 27 430 0
Total risk exposure amount 17 421 212 14 732 462
Hoist Kredit AB (publ)
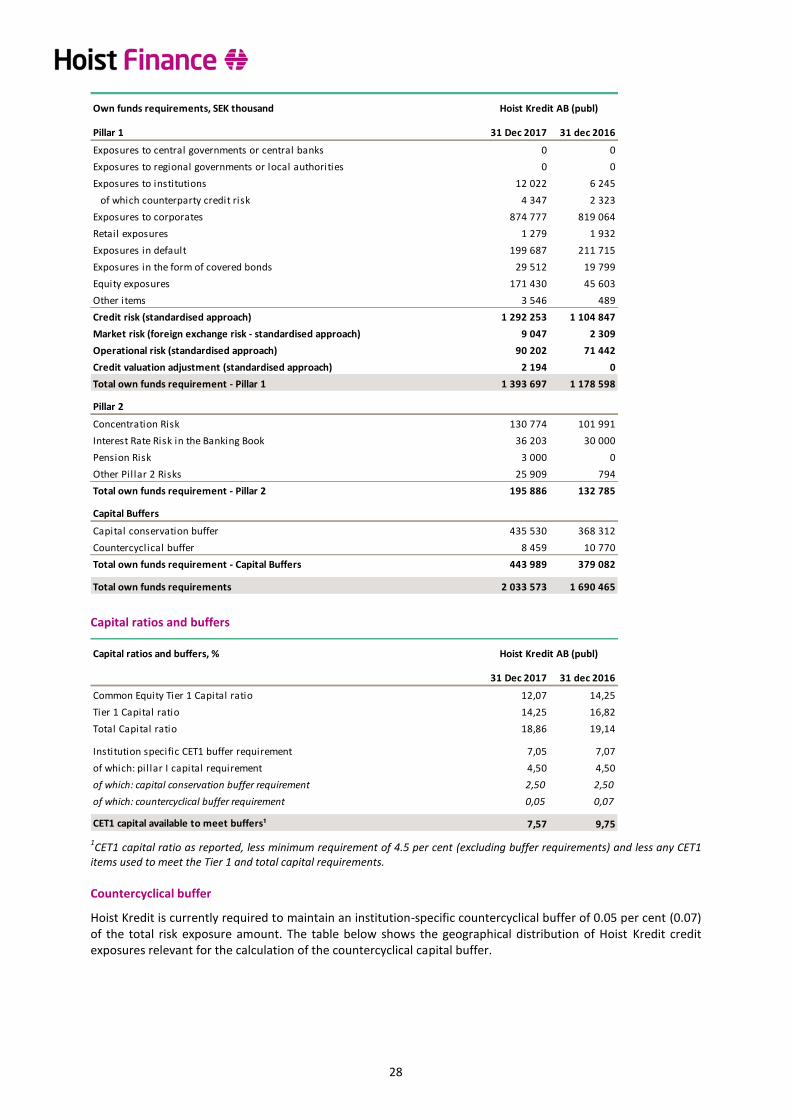
28
Capital ratios and buffers
1CET1 capital ratio as reported, less minimum requirement of 4.5 per cent (excluding buffer requirements) and less any CET1
items used to meet the Tier 1 and total capital requirements.
Countercyclical buffer
Hoist Kredit is currently required to maintain an institution-specific countercyclical buffer of 0.05 per cent (0.07) of the total risk exposure amount. The table below shows the geographical distribution of Hoist Kredit credit exposures relevant for the calculation of the countercyclical capital buffer.
Own funds requirements, SEK thousand
Pillar 1 31 Dec 2017 31 dec 2016
Exposures to central governments or central banks 0 0
Exposures to regional governments or local authorities 0 0
Exposures to institutions 12 022 6 245
of which counterparty credit risk 4 347 2 323
Exposures to corporates 874 777 819 064
Retail exposures 1 279 1 932
Exposures in default 199 687 211 715
Exposures in the form of covered bonds 29 512 19 799
Equity exposures 171 430 45 603
Other items 3 546 489
Credit risk (standardised approach) 1 292 253 1 104 847
Market risk (foreign exchange risk - standardised approach) 9 047 2 309
Operational risk (standardised approach) 90 202 71 442
Credit valuation adjustment (standardised approach) 2 194 0
Total own funds requirement - Pillar 1 1 393 697 1 178 598
Pillar 2
Concentration Risk 130 774 101 991
Interest Rate Risk in the Banking Book 36 203 30 000
Pension Risk 3 000 0
Other Pillar 2 Risks 25 909 794
Total own funds requirement - Pillar 2 195 886 132 785
Capital Buffers
Capital conservation buffer 435 530 368 312
Countercyclical buffer 8 459 10 770
Total own funds requirement - Capital Buffers 443 989 379 082
Total own funds requirements 2 033 573 1 690 465
Hoist Kredit AB (publ)
Capital ratios and buffers, %
31 Dec 2017 31 dec 2016
Common Equity Tier 1 Capital ratio 12,07 14,25
Tier 1 Capital ratio 14,25 16,82
Total Capital ratio 18,86 19,14
Institution specific CET1 buffer requirement 7,05 7,07
of which: pillar I capital requirement 4,50 4,50
of which: capital conservation buffer requirement 2,50 2,50
of which: countercyclical buffer requirement 0,05 0,07
CET1 capital available to meet buffers¹ 7,57 9,75
Hoist Kredit AB (publ)
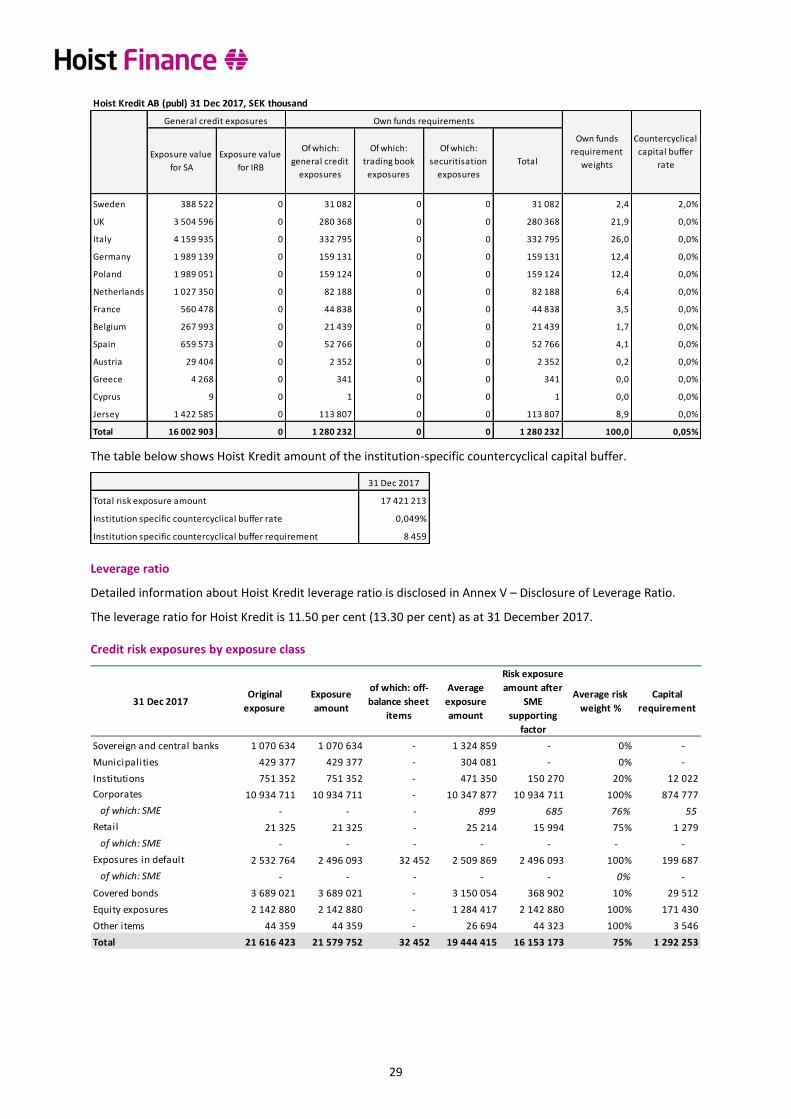
29
The table below shows Hoist Kredit amount of the institution-specific countercyclical capital buffer.
Leverage ratio
Detailed information about Hoist Kredit leverage ratio is disclosed in Annex V – Disclosure of Leverage Ratio.
The leverage ratio for Hoist Kredit is 11.50 per cent (13.30 per cent) as at 31 December 2017.
Credit risk exposures by exposure class
Hoist Kredit AB (publ) 31 Dec 2017, SEK thousand
Exposure value
for SA
Exposure value
for IRB
Of which:
general credit
exposures
Of which:
trading book
exposures
Of which:
securitisation
exposures
Total
Sweden 388 522 0 31 082 0 0 31 082 2,4 2,0%
UK 3 504 596 0 280 368 0 0 280 368 21,9 0,0%
Italy 4 159 935 0 332 795 0 0 332 795 26,0 0,0%
Germany 1 989 139 0 159 131 0 0 159 131 12,4 0,0%
Poland 1 989 051 0 159 124 0 0 159 124 12,4 0,0%
Netherlands 1 027 350 0 82 188 0 0 82 188 6,4 0,0%
France 560 478 0 44 838 0 0 44 838 3,5 0,0%
Belgium 267 993 0 21 439 0 0 21 439 1,7 0,0%
Spain 659 573 0 52 766 0 0 52 766 4,1 0,0%
Austria 29 404 0 2 352 0 0 2 352 0,2 0,0%
Greece 4 268 0 341 0 0 341 0,0 0,0%
Cyprus 9 0 1 0 0 1 0,0 0,0%
Jersey 1 422 585 0 113 807 0 0 113 807 8,9 0,0%
Total 16 002 903 0 1 280 232 0 0 1 280 232 100,0 0,05%
Own funds
requirement
weights
Countercyclical
capital buffer
rate
General credit exposures Own funds requirements
31 Dec 2017
17 421 213
0,049%
8 459Institution specific countercyclical buffer requirement
Institution specific countercyclical buffer rate
Total risk exposure amount
31 Dec 2017Original
exposure
Exposure
amount
of which: off-
balance sheet
items
Average
exposure
amount
Risk exposure
amount after
SME
supporting
factor
Average risk
weight %
Capital
requirement
Sovereign and central banks 1 070 634 1 070 634 - 1 324 859 - 0% -
Municipalities 429 377 429 377 - 304 081 - 0% -
Institutions 751 352 751 352 - 471 350 150 270 20% 12 022
Corporates 10 934 711 10 934 711 - 10 347 877 10 934 711 100% 874 777
of which: SME - - - 899 685 76% 55
Retail 21 325 21 325 - 25 214 15 994 75% 1 279
of which: SME - - - - - - -
Exposures in default 2 532 764 2 496 093 32 452 2 509 869 2 496 093 100% 199 687
of which: SME - - - - - 0% -
Covered bonds 3 689 021 3 689 021 - 3 150 054 368 902 10% 29 512
Equity exposures 2 142 880 2 142 880 - 1 284 417 2 142 880 100% 171 430
Other items 44 359 44 359 - 26 694 44 323 100% 3 546
Total 21 616 423 21 579 752 32 452 19 444 415 16 153 173 75% 1 292 253
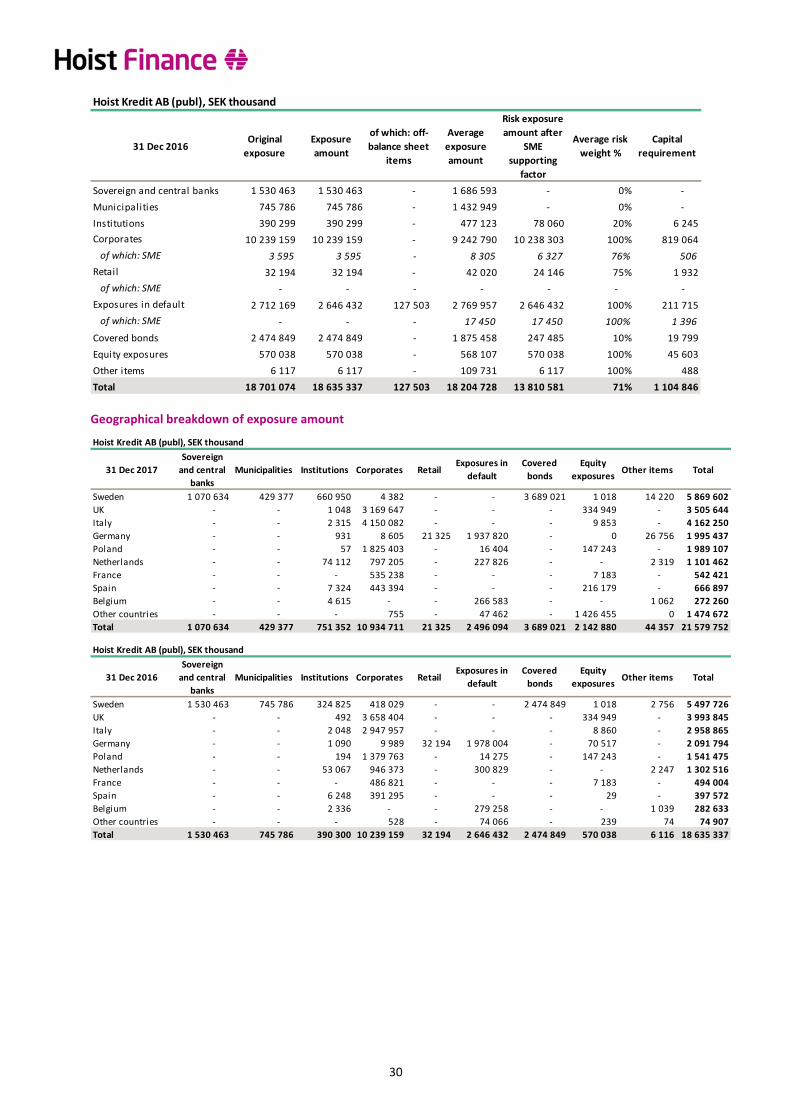
30
Geographical breakdown of exposure amount
Hoist Kredit AB (publ), SEK thousand
31 Dec 2016Original
exposure
Exposure
amount
of which: off-
balance sheet
items
Average
exposure
amount
Risk exposure
amount after
SME
supporting
factor
Average risk
weight %
Capital
requirement
Sovereign and central banks 1 530 463 1 530 463 - 1 686 593 - 0% -
Municipalities 745 786 745 786 - 1 432 949 - 0% -
Institutions 390 299 390 299 - 477 123 78 060 20% 6 245
Corporates 10 239 159 10 239 159 - 9 242 790 10 238 303 100% 819 064
of which: SME 3 595 3 595 - 8 305 6 327 76% 506
Retail 32 194 32 194 - 42 020 24 146 75% 1 932
of which: SME - - - - - - -
Exposures in default 2 712 169 2 646 432 127 503 2 769 957 2 646 432 100% 211 715
of which: SME - - - 17 450 17 450 100% 1 396
Covered bonds 2 474 849 2 474 849 - 1 875 458 247 485 10% 19 799
Equity exposures 570 038 570 038 - 568 107 570 038 100% 45 603
Other items 6 117 6 117 - 109 731 6 117 100% 488
Total 18 701 074 18 635 337 127 503 18 204 728 13 810 581 71% 1 104 846
Hoist Kredit AB (publ), SEK thousand
31 Dec 2017
Sovereign
and central
banks
Municipalities Institutions Corporates RetailExposures in
default
Covered
bonds
Equity
exposuresOther items Total
Sweden 1 070 634 429 377 660 950 4 382 - - 3 689 021 1 018 14 220 5 869 602
UK - - 1 048 3 169 647 - - - 334 949 - 3 505 644
Italy - - 2 315 4 150 082 - - - 9 853 - 4 162 250
Germany - - 931 8 605 21 325 1 937 820 - 0 26 756 1 995 437
Poland - - 57 1 825 403 - 16 404 - 147 243 - 1 989 107
Netherlands - - 74 112 797 205 - 227 826 - - 2 319 1 101 462
France - - - 535 238 - - - 7 183 - 542 421
Spain - - 7 324 443 394 - - - 216 179 - 666 897
Belgium - - 4 615 - - 266 583 - - 1 062 272 260
Other countries - - - 755 - 47 462 - 1 426 455 0 1 474 672
Total 1 070 634 429 377 751 352 10 934 711 21 325 2 496 094 3 689 021 2 142 880 44 357 21 579 752
Hoist Kredit AB (publ), SEK thousand
31 Dec 2016
Sovereign
and central
banks
Municipalities Institutions Corporates RetailExposures in
default
Covered
bonds
Equity
exposuresOther items Total
Sweden 1 530 463 745 786 324 825 418 029 - - 2 474 849 1 018 2 756 5 497 726
UK - - 492 3 658 404 - - - 334 949 - 3 993 845
Italy - - 2 048 2 947 957 - - - 8 860 - 2 958 865
Germany - - 1 090 9 989 32 194 1 978 004 - 70 517 - 2 091 794
Poland - - 194 1 379 763 - 14 275 - 147 243 - 1 541 475
Netherlands - - 53 067 946 373 - 300 829 - - 2 247 1 302 516
France - - - 486 821 - - - 7 183 - 494 004
Spain - - 6 248 391 295 - - - 29 - 397 572
Belgium - - 2 336 - - 279 258 - - 1 039 282 633
Other countries - - - 528 - 74 066 - 239 74 74 907
Total 1 530 463 745 786 390 300 10 239 159 32 194 2 646 432 2 474 849 570 038 6 116 18 635 337

31
Maturity analysis of exposure amount
Liquidity Coverage Ratio
Hoist Kredit Liquidity Coverage Ratio (LCR) was 415 per cent (375) at 31 December 2017 this can be compared to the regulatory requirement of 80 per cent (70). As from 1 January 2018 the regulatory LCR requirement is fully implemented and at a level of 100 per cent.
Hoist Kredit AB (publ), SEK thousand
Remaining contractual maturity,
undiscounted value
31 Dec 2017
Payable on
demand< 3 months 3-12 months 1-5 years > 5 years
Without fixed
maturityTotal
Treasury bills and treasury bonds - 1 154 257 188 098 145 048 - - 1 487 403
Lending to credit institutions 605 905 1 679 - - - - 607 584
Lending to the public - 18 470 6 930 14 524 884 - 40 808
Bonds and other securities - 198 227 1 135 676 2 368 163 - - 3 702 066
Receivables from affil iated companies - 236 955 2 608 247 6 212 373 - 4 114 615 13 172 189
Other assets 36 239 720 - 347 - 2 194 008 2 434 112
Off-balance sheet items - 352 1 055 31 045 - - 32 452
Total 605 942 1 849 660 3 940 005 8 771 501 884 089 6 308 622 21 476 614
Information on acquired loan portfolios within the Group based on net cash flows, SEK thousand
31 Dec 2017Payable on
demand< 3 months 3-12 months 1-5 years > 5 years
Without fixed
maturityTotal
Acquired loan portfolios - 201 323 556 161 1 795 984 1 096 288 - 3 649 756
Total - 201 323 556 161 1 795 984 1 096 288 - 3 649 756
Hoist Kredit AB (publ), SEK thousand
31 Dec 2016Payable on
demand< 3 months 3-12 months 1-5 years > 5 years
Without fixed
maturityTotal
Treasury bills - 704 411 1 171 501 397 991 - - 2 273 903
Lending to credit institutions 215 475 478 - - - - 215 953
Lending to the public - - 478 - - 3 595 4 073
Bonds and other securities - 86 250 642 989 1 809 327 - - 2 538 566
Acquired loan portfolios ¹ - - - - - 2 616 860 2 616 860
Receivables from affil iated companies - 187 340 4 426 014 2 502 344 - 2 939 241 10 054 939
Derivatives - 29 167 - - - - 29 167
Other assets - 224 890 - 322 - 614 897 840 109
Off-balance sheet items - 331 993 60 443 - - 61 767
Total 215 475 1 232 867 6 241 975 4 770 427 - 6 174 593 18 635 337
Anticipated net cash flow for Hoist Kredit's loan portfolios, SEK thousand
31 Dec 2016Payable on
demand< 3 months 3-12 months 1-5 years > 5 years
Without fixed
maturityTotal
Acquired loan portfolios - 268 360 603 685 1 837 170 1 146 032 - 3 855 247
Total - 268 360 603 685 1 837 170 1 146 032 - 3 855 247
¹ Consists of acquired loan portfolios within Hoist Kredit. See table below for a maturity analysis based on net cash flows.
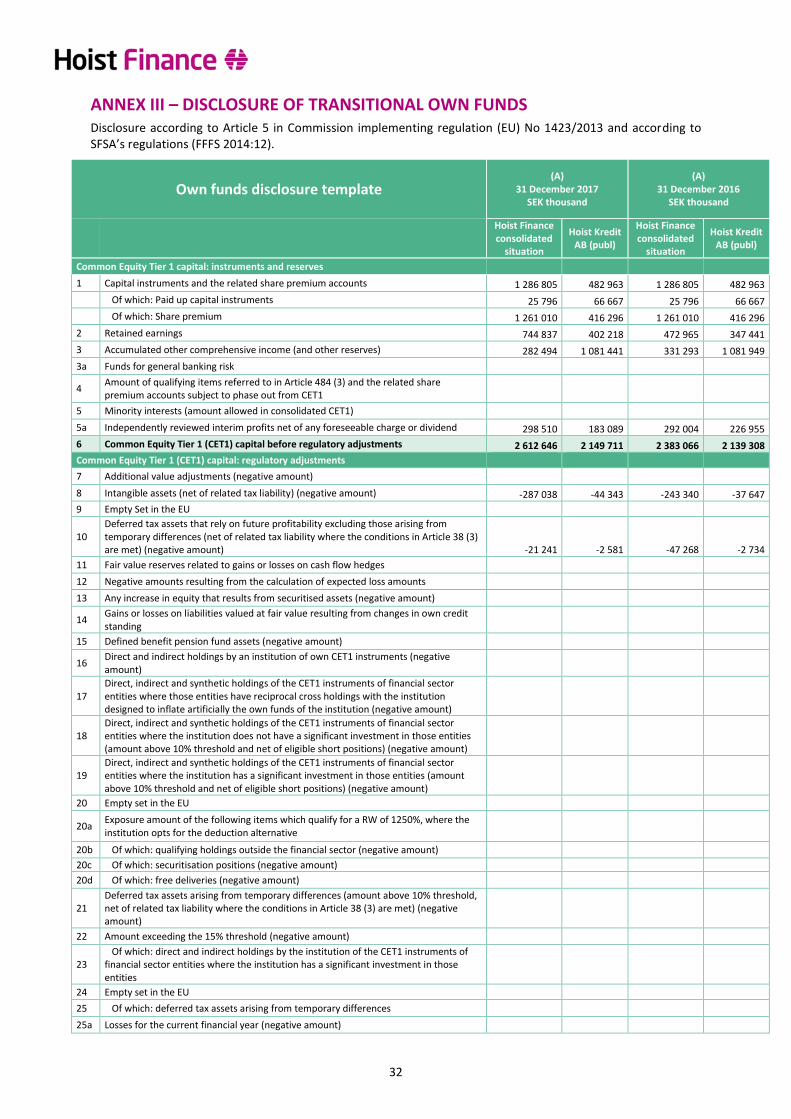
32
ANNEX III – DISCLOSURE OF TRANSITIONAL OWN FUNDS Disclosure according to Article 5 in Commission implementing regulation (EU) No 1423/2013 and according to SFSA’s regulations (FFFS 2014:12).
Own funds disclosure template
(A) 31 December 2017
SEK thousand
(A) 31 December 2016
SEK thousand
Hoist Finance consolidated
situation
Hoist Kredit AB (publ)
Hoist Finance consolidated
situation
Hoist Kredit AB (publ)
Common Equity Tier 1 capital: instruments and reserves
1 Capital instruments and the related share premium accounts 1 286 805 482 963 1 286 805 482 963
Of which: Paid up capital instruments 25 796 66 667 25 796 66 667
Of which: Share premium 1 261 010 416 296 1 261 010 416 296
2 Retained earnings 744 837 402 218 472 965 347 441
3 Accumulated other comprehensive income (and other reserves) 282 494 1 081 441 331 293 1 081 949
3a Funds for general banking risk
4 Amount of qualifying items referred to in Article 484 (3) and the related share premium accounts subject to phase out from CET1
5 Minority interests (amount allowed in consolidated CET1)
5a Independently reviewed interim profits net of any foreseeable charge or dividend 298 510 183 089 292 004 226 955
6 Common Equity Tier 1 (CET1) capital before regulatory adjustments 2 612 646 2 149 711 2 383 066 2 139 308
Common Equity Tier 1 (CET1) capital: regulatory adjustments
7 Additional value adjustments (negative amount)
8 Intangible assets (net of related tax liability) (negative amount) -287 038 -44 343 -243 340 -37 647
9 Empty Set in the EU
10 Deferred tax assets that rely on future profitability excluding those arising from temporary differences (net of related tax liability where the conditions in Article 38 (3) are met) (negative amount) -21 241 -2 581 -47 268 -2 734
11 Fair value reserves related to gains or losses on cash flow hedges
12 Negative amounts resulting from the calculation of expected loss amounts
13 Any increase in equity that results from securitised assets (negative amount)
14 Gains or losses on liabilities valued at fair value resulting from changes in own credit standing
15 Defined benefit pension fund assets (negative amount)
16 Direct and indirect holdings by an institution of own CET1 instruments (negative amount)
17 Direct, indirect and synthetic holdings of the CET1 instruments of financial sector entities where those entities have reciprocal cross holdings with the institution designed to inflate artificially the own funds of the institution (negative amount)
18 Direct, indirect and synthetic holdings of the CET1 instruments of financial sector entities where the institution does not have a significant investment in those entities (amount above 10% threshold and net of eligible short positions) (negative amount)
19 Direct, indirect and synthetic holdings of the CET1 instruments of financial sector entities where the institution has a significant investment in those entities (amount above 10% threshold and net of eligible short positions) (negative amount)
20 Empty set in the EU
20a Exposure amount of the following items which qualify for a RW of 1250%, where the institution opts for the deduction alternative
20b Of which: qualifying holdings outside the financial sector (negative amount)
20c Of which: securitisation positions (negative amount)
20d Of which: free deliveries (negative amount)
21 Deferred tax assets arising from temporary differences (amount above 10% threshold, net of related tax liability where the conditions in Article 38 (3) are met) (negative amount)
22 Amount exceeding the 15% threshold (negative amount)
23 Of which: direct and indirect holdings by the institution of the CET1 instruments of financial sector entities where the institution has a significant investment in those entities
24 Empty set in the EU
25 Of which: deferred tax assets arising from temporary differences
25a Losses for the current financial year (negative amount)

33
Own funds disclosure template
(A) 31 December 2017
SEK thousand
(A) 31 December 2016
SEK thousand
Hoist Finance consolidated
situation
Hoist Kredit AB (publ)
Hoist Finance consolidated
situation
Hoist Kredit AB (publ)
25b Foreseeable tax charges relating to CET1 items (negative amount)
27 Qualifying AT1 deductions that exceeds the AT1 capital of the institution (negative amount)
28 Total regulatory adjustments to Common Equity Tier 1 (CET1) -308 279 -46 924 -290 609 -40 382
29 Common Equity Tier 1 (CET1) capital 2 304 367 2 102 787 2 092 458 2 098 927
Additional Tier 1 (AT1) capital: instruments
30 Capital instruments and the related share premium accounts 379 577 379 577 379 577 379 577
31 Of which: classified as equity under applicable accounting standards 379 577 379 577 379 577 379 577
32 Of which: classified as liabilities under applicable accounting standards
33 Amount of qualifying items referred to in Article 484 (4) and the related share premium accounts subject to phase out from AT1
34 Qualifying Tier 1 capital included in consolidated AT1 capital (including minority interest not included in row 5) issued by subsidiaries and held by third parties
35 Of which: instruments issued by subsidiaries subject to phase out
36 Additional Tier 1 (AT1) capital before regulatory adjustments 379 577 379 577 379 577 379 577
Additional Tier 1 (AT1) capital: regulatory adjustments
37 Direct and indirect holdings by an institution of own AT1 instruments (negative amount)
38 Direct, indirect and synthetic holdings of the AT1 instruments of financial sector entities where those entities have reciprocal cross holdings with the institution designed to inflate artificially the own funds of the institution (negative amount)
39 Direct, indirect and synthetic holdings of the AT1 instruments of financial sector entities where the institution does not have a significant investment in those entities (amount above 10% threshold and net of eligible short positions) (negative amount)
40 Direct, indirect and synthetic holdings of the AT1 instruments of financial sector entities where the institution has a significant investment in those entities (amount above 10% threshold and net of eligible short positions) (negative amount)
41 Empty set in the EU
42 Qualifying T2 deductions that exceed the T2 capital of the institution (negative amount)
43 Total regulatory adjustments to Additional Tier 1 (AT1) capital 0 0 0 0
44 Additional Tier 1 (AT1) capital 379 577 379 577 379 577 379 577
45 Tier 1 capital (T1 = CET1 + AT1) 2 683 944 2 482 364 2 472 035 2 478 503
Tier 2 (T2) capital: instruments and provisions
46 Capital instruments and the related share premium accounts 803 257 803 257 341 715 341 715
47 Amount of qualifying items referred to in Article 484 (5) and the related share premium accounts subject to phase out from T2
48 Qualifying own funds instruments included in consolidated T2 capital (including minority interest and AT1 instruments not included in rows 5 or 34) issued by subsidiaries and held by third party
49 Of which: instruments issued by subsidiaries subject to phase out
50 Credit risk adjustments
51 Tier 2 (T2) capital before regulatory adjustment 803 257 803 257 341 715 341 715
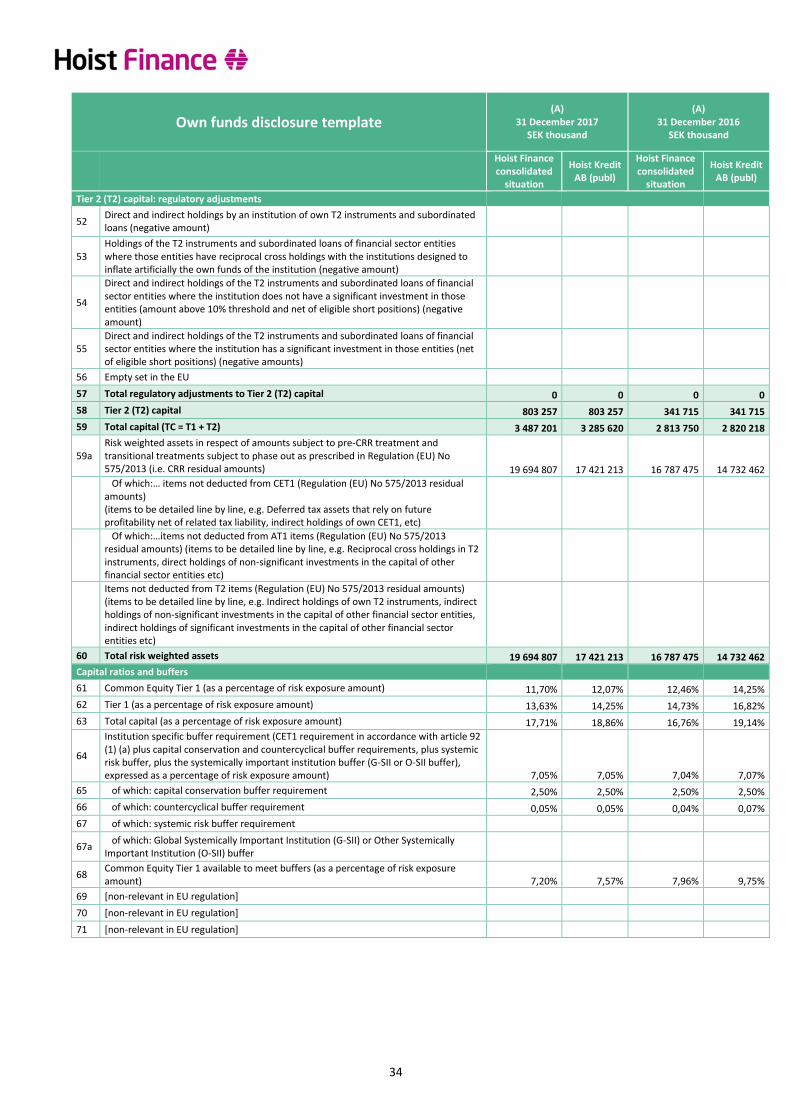
34
Own funds disclosure template
(A) 31 December 2017
SEK thousand
(A) 31 December 2016
SEK thousand
Hoist Finance consolidated
situation
Hoist Kredit AB (publ)
Hoist Finance consolidated
situation
Hoist Kredit AB (publ)
Tier 2 (T2) capital: regulatory adjustments
52 Direct and indirect holdings by an institution of own T2 instruments and subordinated loans (negative amount)
53 Holdings of the T2 instruments and subordinated loans of financial sector entities where those entities have reciprocal cross holdings with the institutions designed to inflate artificially the own funds of the institution (negative amount)
54
Direct and indirect holdings of the T2 instruments and subordinated loans of financial sector entities where the institution does not have a significant investment in those entities (amount above 10% threshold and net of eligible short positions) (negative amount)
55 Direct and indirect holdings of the T2 instruments and subordinated loans of financial sector entities where the institution has a significant investment in those entities (net of eligible short positions) (negative amounts)
56 Empty set in the EU
57 Total regulatory adjustments to Tier 2 (T2) capital 0 0 0 0
58 Tier 2 (T2) capital 803 257 803 257 341 715 341 715
59 Total capital (TC = T1 + T2) 3 487 201 3 285 620 2 813 750 2 820 218
59a Risk weighted assets in respect of amounts subject to pre-CRR treatment and transitional treatments subject to phase out as prescribed in Regulation (EU) No 575/2013 (i.e. CRR residual amounts) 19 694 807 17 421 213 16 787 475 14 732 462
Of which:… items not deducted from CET1 (Regulation (EU) No 575/2013 residual amounts) (items to be detailed line by line, e.g. Deferred tax assets that rely on future profitability net of related tax liability, indirect holdings of own CET1, etc)
Of which:…items not deducted from AT1 items (Regulation (EU) No 575/2013 residual amounts) (items to be detailed line by line, e.g. Reciprocal cross holdings in T2 instruments, direct holdings of non-significant investments in the capital of other financial sector entities etc)
Items not deducted from T2 items (Regulation (EU) No 575/2013 residual amounts) (items to be detailed line by line, e.g. Indirect holdings of own T2 instruments, indirect holdings of non-significant investments in the capital of other financial sector entities, indirect holdings of significant investments in the capital of other financial sector entities etc)
60 Total risk weighted assets 19 694 807 17 421 213 16 787 475 14 732 462
Capital ratios and buffers
61 Common Equity Tier 1 (as a percentage of risk exposure amount) 11,70% 12,07% 12,46% 14,25%
62 Tier 1 (as a percentage of risk exposure amount) 13,63% 14,25% 14,73% 16,82%
63 Total capital (as a percentage of risk exposure amount) 17,71% 18,86% 16,76% 19,14%
64
Institution specific buffer requirement (CET1 requirement in accordance with article 92 (1) (a) plus capital conservation and countercyclical buffer requirements, plus systemic risk buffer, plus the systemically important institution buffer (G-SII or O-SII buffer), expressed as a percentage of risk exposure amount) 7,05% 7,05% 7,04% 7,07%
65 of which: capital conservation buffer requirement 2,50% 2,50% 2,50% 2,50%
66 of which: countercyclical buffer requirement 0,05% 0,05% 0,04% 0,07%
67 of which: systemic risk buffer requirement
67a of which: Global Systemically Important Institution (G-SII) or Other Systemically Important Institution (O-SII) buffer
68 Common Equity Tier 1 available to meet buffers (as a percentage of risk exposure amount) 7,20% 7,57% 7,96% 9,75%
69 [non-relevant in EU regulation]
70 [non-relevant in EU regulation]
71 [non-relevant in EU regulation]

35
ANNEX IV – CAPITAL INSTRUMENTS INCLUDED IN OWN FUNDS CAPITAL INSTRUMENTS MAIN FEATURES
SHARE CAPITAL PERPETUAL AT1 NOTES PERPETUAL AT1 NOTES FIXED TERM SUBORDINATED LOAN NOTES
1 Issuer Hoist Finance AB (publ) Hoist Kredit AB (publ)* Hoist Kredit AB (publ)* Hoist Kredit AB (publ)*
2 Unique identifier SE0006887063 N/a XS1538294890 XS1617700197
3 Governing law(s) Swedish law Swedish law English and Swedish law English law
Regulatory treatment
4 Transitional CRR rules Common Equity Tier 1 Additional Tier 1 Additional Tier 1 Tier 2
5 Post-transitional CRR rules Common Equity Tier 1 Additional Tier 1 Additional Tier 1 Tier 2
6 Eligible at solo/(sub-) consolidated
Solo & consolidated Solo & consolidated Solo & consolidated Solo & consolidated
7 Instrument type Share capital Additional Tier 1 as published in Regulation (EU) No 575/2013 article 52
Additional Tier 1 as published in Regulation (EU) No 575/2013 article 52
Tier 2 as published in Regulation (EU) No 575/2013 article 63
8 Amount recognised in regulatory capital
SEK 1,287 million SEK 93 million EUR 29,95 million SEK 803 million
9 Nominal amount of instrument SEK 26 million SEK 100 million EUR 30 million EUR 80 million
9a Issue price SEK1,287 million 100 per cent 100 per cent 100 per cent
9b Redemption price N/a 100 per cent of nominal amount
100 per cent of nominal amount
100 per cent of nominal amount
10 Accounting classification Equity Equity Equity Liability – amortised cost
11 Original date of issuance 21 August 1915 23 April 2013 21 December 2016 19 May 2017
12 Perpetual or dated Perpetual Perpetual Perpetual Dated
13 Original maturity date N/a Perpetual Perpetual 19 May 2027
14 Issuer call subject to prior supervisory approval
N/a Yes Yes No
15 Optional call date, contingent call dates, and redemption amount
N/a 23 April 2018 100 per cent of nominal amount
21 June 2023 100 per cent of nominal amount
Optional redemption date 19 May 2022 Optional redemption amount 100 per cent of nominal amount Early Redemption amount - for taxation reasons or a capital event - 100 per cent of nominal amount
16 Subsequent call dates, if applicable
N/a Any time after first call date Any time after first call date N/A
Coupons / dividends
17 Fixed or floating dividend/coupon
N/a Fixed Fixed rate reset Fixed rate reset
18 Coupon rate and any related index
N/a 15 per cent
Fixed 8.625 per cent until first call date, thereafter the rate is reset for a period of 5 years to a rate of 5Y Mid-Swap Rate plus the initial credit spread of 8.326 per cent.
Fixed 3.875% per cent p.a. until first call date, thereafter 6M EURIBOR plus a margin equal to 3.657% per cent
19 Existence of a dividend stopper N/a Yes Yes No
20a Fully/partially discretionary or mandatory (in terms of timing)
N/a Fully discretionary Fully discretionary Mandatory
20b Fully/partially discretionary or mandatory (in terms of amount)
N/a Fully discretionary Fully discretionary Mandatory
21 Existence of step up or other incentive to redeem
N/a No No No
22 Non-cumulative or cumulative Non-cumulative Non-cumulative Non-cumulative Non-cumulative
23 Convertible or non-convertible Non-convertible Non-convertible Non-convertible Non-convertible
*On 2 January 2018 the merger between Hoist Kredit and Hoist Finance AB (publ) was completed. Through the merger all
assets and liabilites, including these capital instruments, were transferred from Hoist Kredit to Hoist Finance AB (publ) by
universal succession.
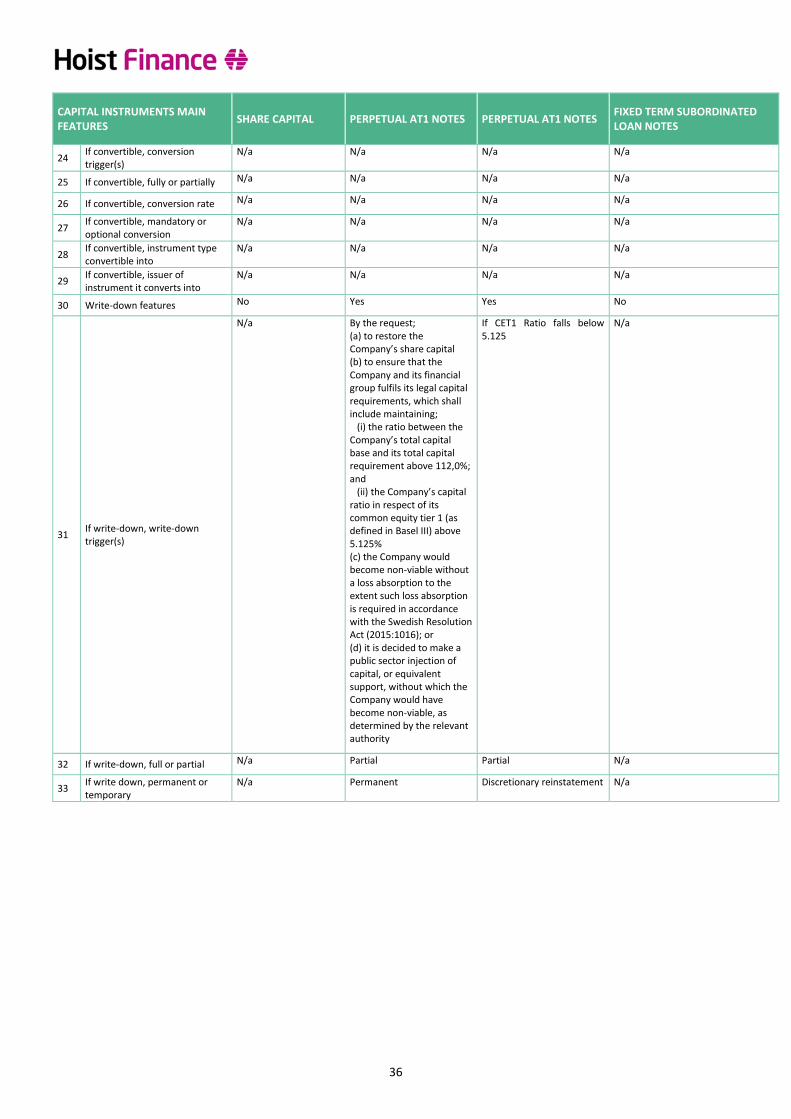
36
CAPITAL INSTRUMENTS MAIN FEATURES
SHARE CAPITAL PERPETUAL AT1 NOTES PERPETUAL AT1 NOTES FIXED TERM SUBORDINATED LOAN NOTES
24 If convertible, conversion trigger(s)
N/a N/a N/a N/a
25 If convertible, fully or partially N/a N/a N/a N/a
26 If convertible, conversion rate N/a N/a N/a N/a
27 If convertible, mandatory or optional conversion
N/a N/a N/a N/a
28 If convertible, instrument type convertible into
N/a N/a N/a N/a
29 If convertible, issuer of instrument it converts into
N/a N/a N/a N/a
30 Write-down features No Yes Yes No
31 If write-down, write-down trigger(s)
N/a By the request; (a) to restore the Company’s share capital (b) to ensure that the Company and its financial group fulfils its legal capital requirements, which shall include maintaining; (i) the ratio between the Company’s total capital base and its total capital requirement above 112,0%; and (ii) the Company’s capital ratio in respect of its common equity tier 1 (as defined in Basel III) above 5.125% (c) the Company would become non-viable without a loss absorption to the extent such loss absorption is required in accordance with the Swedish Resolution Act (2015:1016); or (d) it is decided to make a public sector injection of capital, or equivalent support, without which the Company would have become non-viable, as determined by the relevant authority
If CET1 Ratio falls below 5.125
N/a
32 If write-down, full or partial N/a Partial Partial N/a
33 If write down, permanent or temporary
N/a Permanent Discretionary reinstatement N/a
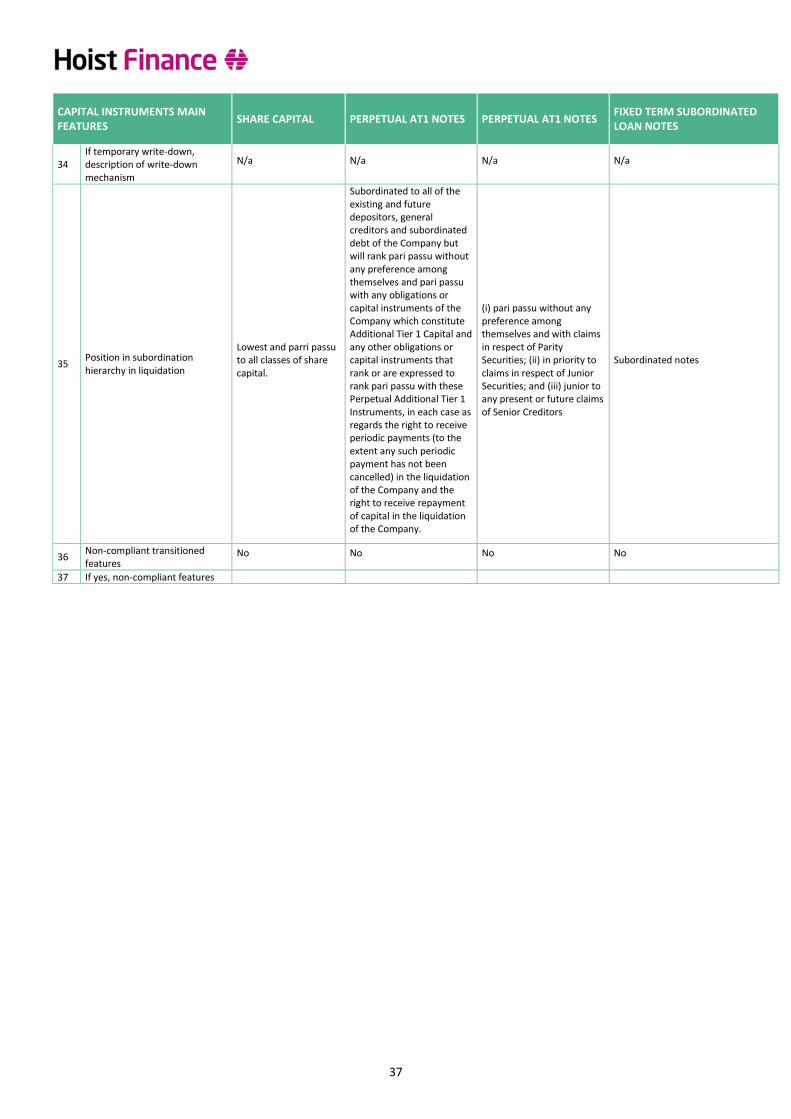
37
CAPITAL INSTRUMENTS MAIN FEATURES
SHARE CAPITAL PERPETUAL AT1 NOTES PERPETUAL AT1 NOTES FIXED TERM SUBORDINATED LOAN NOTES
34 If temporary write-down, description of write-down mechanism
N/a N/a N/a N/a
35 Position in subordination hierarchy in liquidation
Lowest and parri passu to all classes of share capital.
Subordinated to all of the existing and future depositors, general creditors and subordinated debt of the Company but will rank pari passu without any preference among themselves and pari passu with any obligations or capital instruments of the Company which constitute Additional Tier 1 Capital and any other obligations or capital instruments that rank or are expressed to rank pari passu with these Perpetual Additional Tier 1 Instruments, in each case as regards the right to receive periodic payments (to the extent any such periodic payment has not been cancelled) in the liquidation of the Company and the right to receive repayment of capital in the liquidation of the Company.
(i) pari passu without any preference among themselves and with claims in respect of Parity Securities; (ii) in priority to claims in respect of Junior Securities; and (iii) junior to any present or future claims of Senior Creditors
Subordinated notes
36 Non-compliant transitioned features
No No No No
37 If yes, non-compliant features

38
ANNEX V – DISCLOSURE OF LEVERAGE RATIO Disclosure according to EBA Implementing Technical Standards of the leverage ratio under Article 451(2) of Regulation (EU) No 575/2013.
Leverage ratio disclosure template 31 December 2017
SEK thousand
31 December 2016
SEK thousand
Hoist Finance consolidated
situation
Hoist Kredit AB (publ)
Hoist Finance consolidated
situation
Hoist Kredit AB (publ)
Table LRSum: Summary reconciliation of accounting assets and leverage ratio exposures
Applicable
Amount Applicable
Amount Applicable
Amount Applicable
Amount
1 Total assets as per published financial statements 22 536 564 21 478 283 19 149 926 18 468 775
2 Adjustment for entities which are consolidated for accounting purposes but are outside the scope of regulatory consolidation
3 (Adjustment for fiduciary assets recognised on the balance sheet pursuant to the applicable accounting framework but excluded from the leverage ratio exposure measure in accordance with Article 429(13) of Regulation (EU) No 575/2013)
4 Adjustments for derivative financial instruments 126 487 126 487 145 178 145 178
5 Adjustments for securities financing transactions (SFTs)
6 Adjustment for off-balance sheet items (ie conversion to credit equivalent amounts of off-balance sheet exposures)
346 799 32 452 646 483 61 766
EU-6a
(Adjustment for intragroup exposures excluded from the leverage ratio exposure measure in accordance with Article 429(7) of Regulation (EU) No 575/2013)
EU-6b
(Adjustment for exposures excluded from the leverage ratio exposure measure in accordance with Article 429(14) of Regulation (EU) No 575/2013)
7 Other adjustments [292 362] [57 470] [277 505] [40 382]
8 Total leverage ratio exposure measure 22 717 488 21 579 752 19 664 081 18 635 337
Table LRCom: Leverage ratio common disclosure
CRR leverage
ratio exposures
CRR leverage ratio
exposures
CRR leverage ratio
exposures
CRR leverage ratio
exposures
On-balance sheet exposures (excluding derivatives and SFTs)
1 On-balance sheet items (excluding derivatives, SFTs and fiduciary assets, but including collateral)
22 536 564 21 478 283 19 149 926 18 468 775
2 (Asset amounts deducted in determining Tier 1 capital) [292 362] [57 470] [277 505] [40 382]
3 Total on-balance sheet exposures (excluding derivatives, SFTs and fiduciary assets) (sum of lines 1 and 2)
22 244 202 21 420 814 18 872 420 18 428 393
Derivative exposures
4 Replacement cost associated with all derivatives transactions (ie net of eligible cash variation margin)
11 304 11 304 29 167 29 167
5 Add-on amounts for PFE associated with all derivatives transactions (mark-to-market method)
115 183 115 183 116 011 116 011
EU-5a
Exposure determined under Original Exposure Method
6 Gross-up for derivatives collateral provided where deducted from the balance sheet assets pursuant to the applicable accounting framework
7 (Deductions of receivables assets for cash variation margin provided in derivatives transactions)
8 (Exempted CCP leg of client-cleared trade exposures)
9 Adjusted effective notional amount of written credit derivatives
10 (Adjusted effective notional offsets and add-on deductions for written credit derivatives)
11 Total derivative exposures (sum of lines 4 to 10) 126 487 126 487 145 178 145 178
Securities financing transaction exposures
12 Gross SFT assets (with no recognition of netting), after adjusting for sales accounting transactions
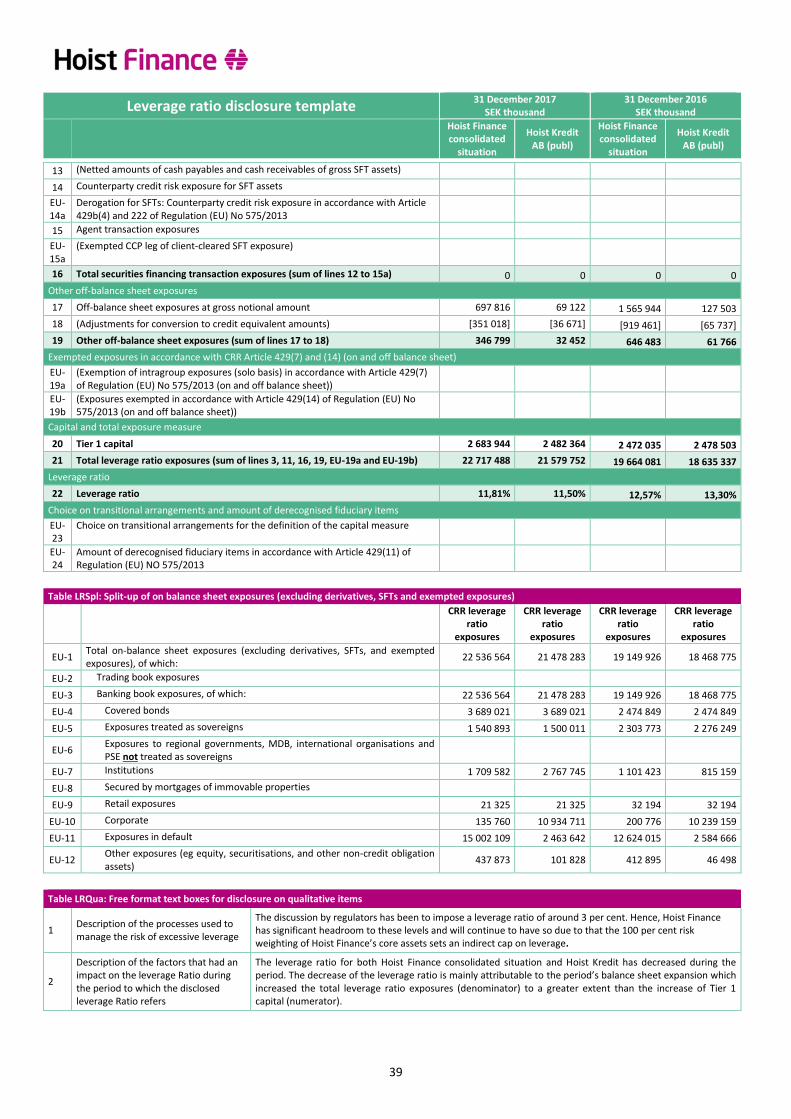
39
Leverage ratio disclosure template 31 December 2017
SEK thousand 31 December 2016
SEK thousand
Hoist Finance consolidated
situation
Hoist Kredit AB (publ)
Hoist Finance consolidated
situation
Hoist Kredit AB (publ)
13 (Netted amounts of cash payables and cash receivables of gross SFT assets)
14 Counterparty credit risk exposure for SFT assets EU-
14a Derogation for SFTs: Counterparty credit risk exposure in accordance with Article 429b(4) and 222 of Regulation (EU) No 575/2013
15 Agent transaction exposures EU-
15a (Exempted CCP leg of client-cleared SFT exposure)
16 Total securities financing transaction exposures (sum of lines 12 to 15a) 0 0 0 0
Other off-balance sheet exposures
17 Off-balance sheet exposures at gross notional amount 697 816 69 122 1 565 944 127 503
18 (Adjustments for conversion to credit equivalent amounts) [351 018] [36 671] [919 461] [65 737]
19 Other off-balance sheet exposures (sum of lines 17 to 18) 346 799 32 452 646 483 61 766
Exempted exposures in accordance with CRR Article 429(7) and (14) (on and off balance sheet)
EU-19a
(Exemption of intragroup exposures (solo basis) in accordance with Article 429(7) of Regulation (EU) No 575/2013 (on and off balance sheet))
EU-19b
(Exposures exempted in accordance with Article 429(14) of Regulation (EU) No 575/2013 (on and off balance sheet))
Capital and total exposure measure
20 Tier 1 capital 2 683 944 2 482 364 2 472 035 2 478 503
21 Total leverage ratio exposures (sum of lines 3, 11, 16, 19, EU-19a and EU-19b) 22 717 488 21 579 752 19 664 081 18 635 337
Leverage ratio
22 Leverage ratio 11,81% 11,50% 12,57% 13,30%
Choice on transitional arrangements and amount of derecognised fiduciary items
EU-23
Choice on transitional arrangements for the definition of the capital measure
EU-24
Amount of derecognised fiduciary items in accordance with Article 429(11) of Regulation (EU) NO 575/2013
Table LRSpl: Split-up of on balance sheet exposures (excluding derivatives, SFTs and exempted exposures)
CRR leverage
ratio exposures
CRR leverage ratio
exposures
CRR leverage ratio
exposures
CRR leverage ratio
exposures
EU-1 Total on-balance sheet exposures (excluding derivatives, SFTs, and exempted exposures), of which:
22 536 564 21 478 283 19 149 926 18 468 775
EU-2 Trading book exposures
EU-3 Banking book exposures, of which: 22 536 564 21 478 283 19 149 926 18 468 775
EU-4 Covered bonds 3 689 021 3 689 021 2 474 849 2 474 849
EU-5 Exposures treated as sovereigns 1 540 893 1 500 011 2 303 773 2 276 249
EU-6 Exposures to regional governments, MDB, international organisations and PSE not treated as sovereigns
EU-7 Institutions 1 709 582 2 767 745 1 101 423 815 159
EU-8 Secured by mortgages of immovable properties
EU-9 Retail exposures 21 325 21 325 32 194 32 194
EU-10 Corporate 135 760 10 934 711 200 776 10 239 159
EU-11 Exposures in default 15 002 109 2 463 642 12 624 015 2 584 666
EU-12 Other exposures (eg equity, securitisations, and other non-credit obligation assets)
437 873 101 828 412 895 46 498
Table LRQua: Free format text boxes for disclosure on qualitative items
1 Description of the processes used to manage the risk of excessive leverage
The discussion by regulators has been to impose a leverage ratio of around 3 per cent. Hence, Hoist Finance has significant headroom to these levels and will continue to have so due to that the 100 per cent risk weighting of Hoist Finance’s core assets sets an indirect cap on leverage.
2
Description of the factors that had an impact on the leverage Ratio during the period to which the disclosed leverage Ratio refers
The leverage ratio for both Hoist Finance consolidated situation and Hoist Kredit has decreased during the period. The decrease of the leverage ratio is mainly attributable to the period’s balance sheet expansion which increased the total leverage ratio exposures (denominator) to a greater extent than the increase of Tier 1 capital (numerator).
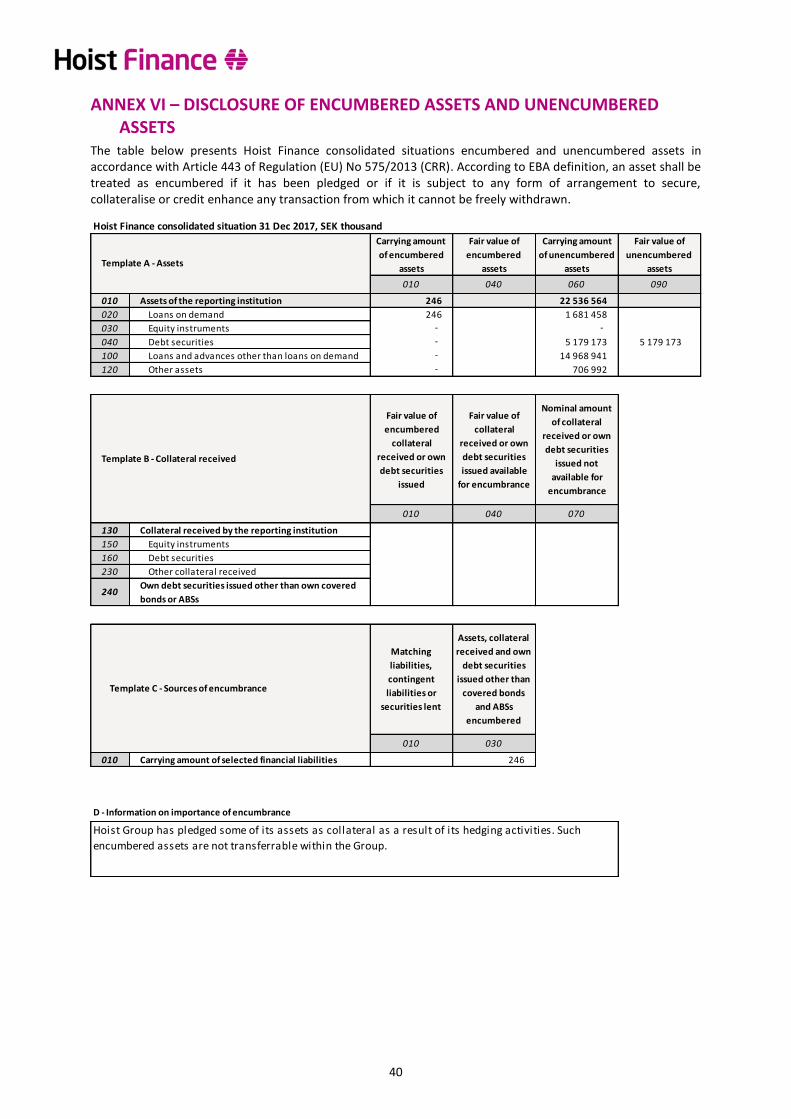
40
ANNEX VI – DISCLOSURE OF ENCUMBERED ASSETS AND UNENCUMBERED ASSETS
The table below presents Hoist Finance consolidated situations encumbered and unencumbered assets in accordance with Article 443 of Regulation (EU) No 575/2013 (CRR). According to EBA definition, an asset shall be treated as encumbered if it has been pledged or if it is subject to any form of arrangement to secure, collateralise or credit enhance any transaction from which it cannot be freely withdrawn.
Hoist Finance consolidated situation 31 Dec 2017, SEK thousand
Carrying amount
of encumbered
assets
Fair value of
encumbered
assets
Carrying amount
of unencumbered
assets
Fair value of
unencumbered
assets
010 040 060 090
010 Assets of the reporting institution 246 22 536 564
020 Loans on demand 246 1 681 458
030 Equity instruments - -
040 Debt securities - 5 179 173 5 179 173
100 Loans and advances other than loans on demand - 14 968 941
120 Other assets - 706 992
Fair value of
encumbered
collateral
received or own
debt securities
issued
Fair value of
collateral
received or own
debt securities
issued available
for encumbrance
Nominal amount
of collateral
received or own
debt securities
issued not
available for
encumbrance
010 040 070
130 Collateral received by the reporting institution
150 Equity instruments
160 Debt securities
230 Other collateral received
240Own debt securities issued other than own covered
bonds or ABSs
Matching
liabilities,
contingent
liabilities or
securities lent
Assets, collateral
received and own
debt securities
issued other than
covered bonds
and ABSs
encumbered
010 030
010 Carrying amount of selected financial liabilities 246
D - Information on importance of encumbrance
Hoist Group has pledged some of its assets as collateral as a result of its hedging activities. Such
encumbered assets are not transferrable within the Group.
Template A - Assets
Template B - Collateral received
Template C - Sources of encumbrance