risk frameworks for the simultaneous intersection of ... · ... climate change impacts in the...
TRANSCRIPT

Risk Frameworks for the Simultaneous Intersection of Infrastructure
Interdependencies, Infrastructure Usage, and Extreme Events
Society for Risk Analysis Webinar
June 23, 2017
Professor Rae Zimmerman
New York University
Wagner Graduate School of Public Service

Scope and Objectives Introduction • Infrastructure-based services are becoming more concentrated, interdependent,
and located in areas vulnerable to disruptions • These interconnections include functional, spatial, cyber, and other
relationships. • They are often choke points.
• Society is increasingly dependent on infrastructure services influenced by settlement patterns and other factors
• Extreme events affecting these basic services are increasing. Objectives • To begin using a risk lens to understand and manage these three dimensions
simultaneously • To provide some choices and solutions
• Decentralized infrastructure concepts are introduced to reduce these vulnerabilities yet retaining the density of urban settings
• Alterations in infrastructure relationships to users and coping with extreme events are proposed for flexibility.

Framing Intersections I. INFRASTRUCTURE • Location • Configuration • Interconnections
III. EXTREME EVENTS • Weather • Climate
II. SOCIAL DEPENDENCE ON SERVICES
• Settlement Patterns • Preferences
IV. INTERSECTIONS (Catastrophic)
Risk-Based Choices
Risk-Based Choices
Risk-Based Choices
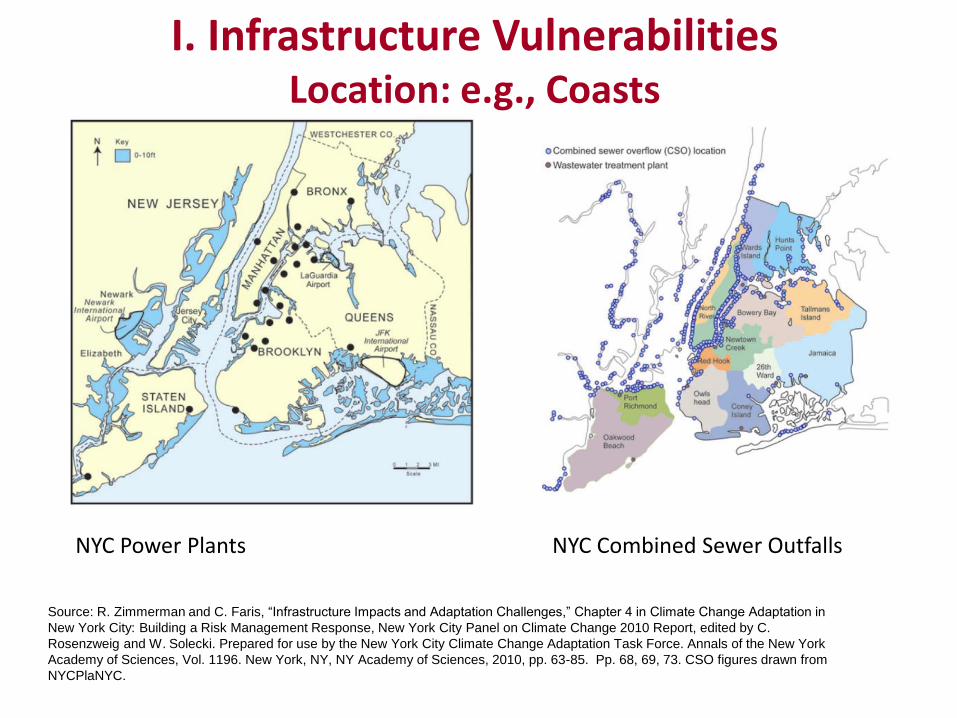
I. Infrastructure Vulnerabilities Location: e.g., Coasts
Source: R. Zimmerman and C. Faris, “Infrastructure Impacts and Adaptation Challenges,” Chapter 4 in Climate Change Adaptation in
New York City: Building a Risk Management Response, New York City Panel on Climate Change 2010 Report, edited by C.
Rosenzweig and W. Solecki. Prepared for use by the New York City Climate Change Adaptation Task Force. Annals of the New York
Academy of Sciences, Vol. 1196. New York, NY, NY Academy of Sciences, 2010, pp. 63-85. Pp. 68, 69, 73. CSO figures drawn from
NYCPlaNYC.
NYC Power Plants NYC Combined Sewer Outfalls
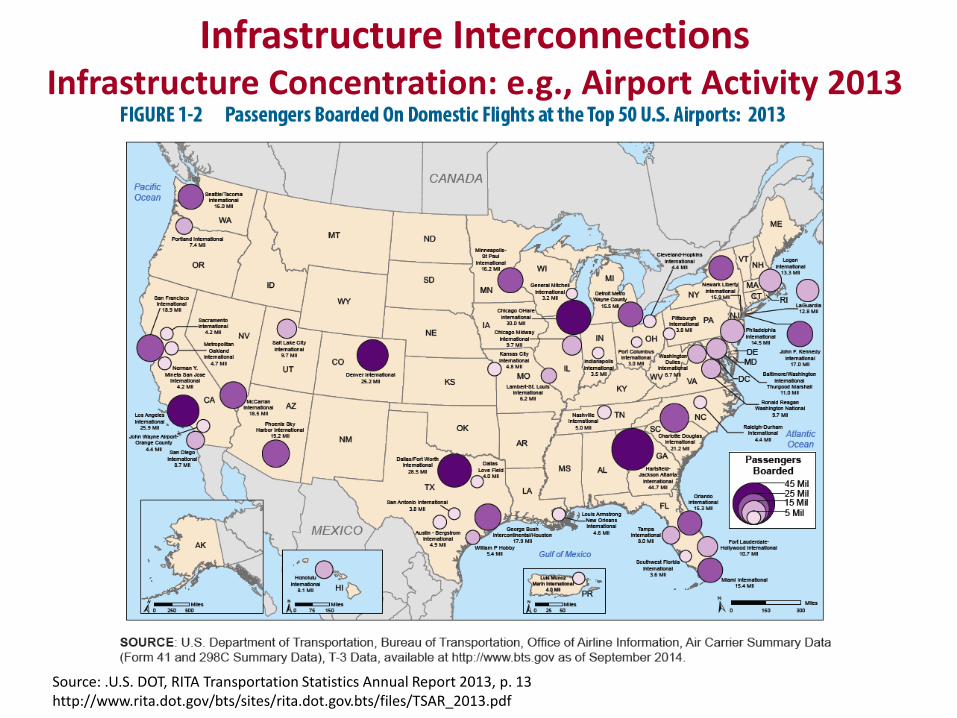
Infrastructure Interconnections Infrastructure Concentration: e.g., Airport Activity 2013
Source: .U.S. DOT, RITA Transportation Statistics Annual Report 2013, p. 13 http://www.rita.dot.gov/bts/sites/rita.dot.gov.bts/files/TSAR_2013.pdf
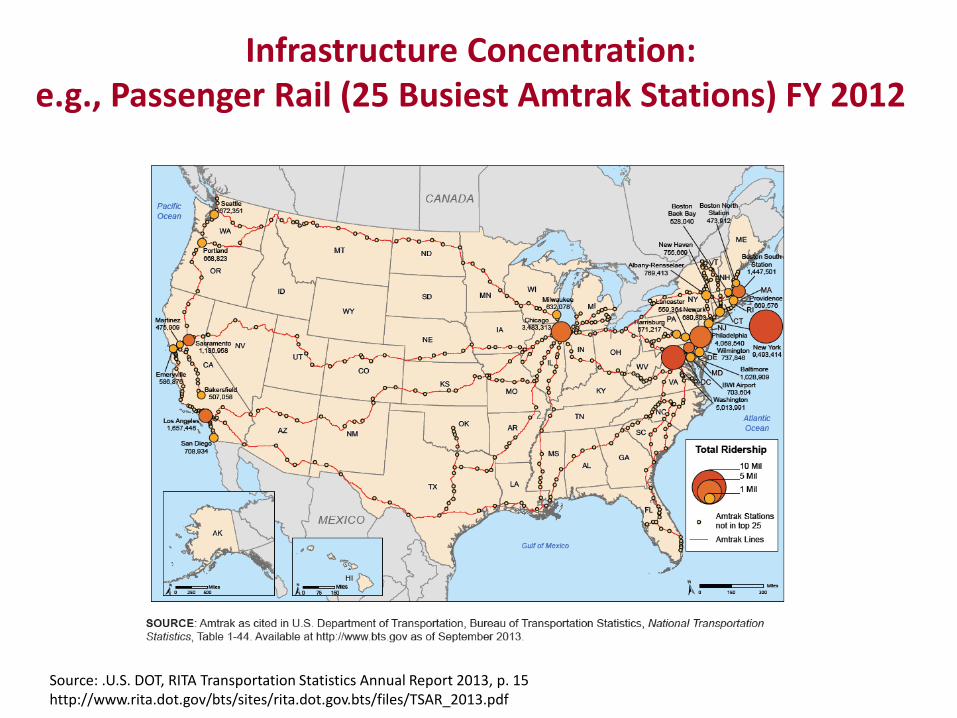
Infrastructure Concentration: e.g., Passenger Rail (25 Busiest Amtrak Stations) FY 2012
Source: .U.S. DOT, RITA Transportation Statistics Annual Report 2013, p. 15 http://www.rita.dot.gov/bts/sites/rita.dot.gov.bts/files/TSAR_2013.pdf

Interdependencies under Normal (non-disruptive) Conditions
TRANSPORTATION WATER MANAGEMENT
Roads • Signals • Lighting
Rail track) • Signals • Switches • Lighting
Water Conveyance • Drainage Structures • Catch Basins • Culverts • Sewers
Transportation supports distribution and storage structures for water infrastructure via co-location (geographic dependence)
Water management infrastructure provides water reduction services for transportation to prevent flooding (functional dependence)
ENERGY
Dependence on energy Source: NYCEP 2017 Progress Report 2017 NYC Municipal Separate Storm Sewer System (MS4) - Stormwater Management Program Plan, p. 2.
Transportation for water management Catch basin cleaning
Transportation for water management Catch basins and roads
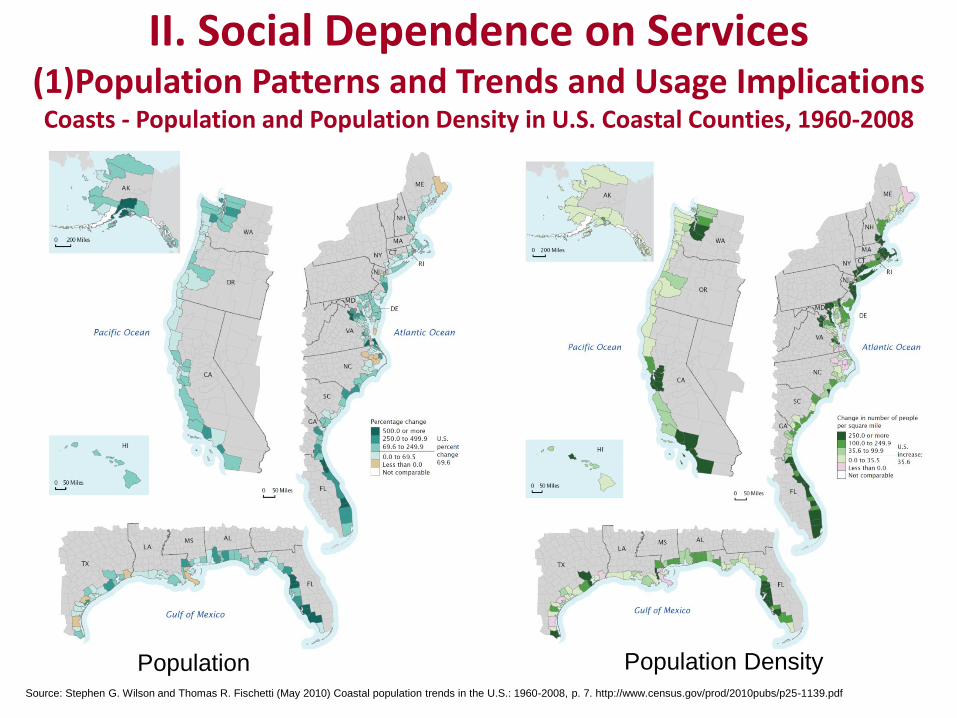
II. Social Dependence on Services (1)Population Patterns and Trends and Usage Implications Coasts - Population and Population Density in U.S. Coastal Counties, 1960-2008
Source: Stephen G. Wilson and Thomas R. Fischetti (May 2010) Coastal population trends in the U.S.: 1960-2008, p. 7. http://www.census.gov/prod/2010pubs/p25-1139.pdf
Population Population Density

(2) Increasing Use of Infrastructure Services Infrastructure usage has continued to grow: • The U.S. DOT indicates Vehicle Miles of Travel is steadily increases (U.S. DOT[1]); • The U.S. DOT and APTA indicate transit ridership is similarly increasing (APTA) • According to EIA, energy production and use steadily increased nationwide.[2] • CTIA indicates the exponential growth in cellular technologies.[3] • The Pew Center [4] indicates dramatic increases in information technology usage,
i.e., for the internet, computers and cell phones.
These services continue to be marked by poor condition and needing large investment thus diminishing use or usage quality: Condition 2017: U.S. average is “D+”[5, p. 5] Age: NYC infrastructure age ranges, according to CUF[6], are: sewer mains and subway facilities (about 80-90 years old) to airport support facilities (40-50 years old); water mains and bridges are in the middle. Design and environmental issues: However, age may not be the whole story, since many bridge collapses have occurred in newer bridges[7] Investment: ASCE estimates a $4.59 trillion need to 2025[5, p. 8]
•Sources: : [1] U.S. DOT, FHWA Highway Statistics (April 2013) .[2]Center for Urban Future (2015) Caution Ahead, New York, NY: CUF, p. 11; [3] CTIA
(2014) Annual Wireless Industry Survey; [4] Pew Research Center, February 2014, “The Web at 25,” summarized from pp. 4, 11 and 13 Available at:
http://www.pewinternet.org/2014/02/27/the-web-at-25-in-the-u-s. [5] ASCE (2017) American Society of Civil Engineers (ASCE) (2017). “2017 report card
for America’s infrastructure,” ASCE, Washington, D.C.; [6] http://www.eia.gov/totalenergy/data/monthly/pdf/mer.pdf; [7]R. Zimmerman, Transport the
Environment and Security, 2012. R. Zimmerman NIST presentation October 2016

Population Growth vs. VMT Growth, U.S.
Source: U.S. EPA (2013) Our Built and Natural Environments: A Technical Review of the Interactions among Land Use, Transportation, and Environmental Quality, Second edition. Washington, D.C.: EPA http://www.epa.gov/dced/pdf/b-and-n/b-and-n-EPA-231K13001.pdf, p. 26
U.S. DOT, FHWA (April 2013) Highway Statistics 2011, Chart RC-
1C;
http://www.fhwa.dot.gov/policyinformation/statistics/2011/pdf/rc1c.pdf

III. Selected Trends in Natural Hazards • NOAA’s National Climate Data Center (2016) reported the continued prominence of
severe storms and flooding among other weather or climate related events whose losses exceed a billion dollars.[1]
• NOAA’s National Hurricane Center reported that the recent couple of decades accounted for the most severe storms in dollar losses and other factors.[2]
• The National Climate Assessment trends and projections reported increases in most climate change-related extreme phenomena: temperature, sea level rise, heavy precipitation, hurricanes.[3]
• Swiss Re reported generally increasing trends in catastrophic losses (according to their threshold definitions based on “insured losses (claims), economic losses, and casualties”): “353 catastrophe events across the world in 2015, up from 339 in 2014. Of those, 198 were natural catastrophes, the highest ever recorded in one year,” most of which are weather-related.[4]
• NOAA reported that records are being exceeded or almost being exceeded for temperature (NOAA’s State of the Climate), hurricane extremes, and ice loss (NOAA National Snow and Ice Data Center).[5]
• 1980-2017 (to date): “The U.S. has sustained 208 weather and climate disasters since 1980 where overall damages/costs reached or exceeded $1 billion (including CPI adjustment to 2017). The total cost of these 208 events exceeds $1.1 trillion.”[6]
Sources: R. Zimmerman NIST presentation October 2016 [1]NOAA National Climate Data Center (2016) [2]Blake, E.S., C.W. Landsea and E.J. Gibney (August 2011) The Deadliest, Costliest, and Most Intense United States Tropical Cyclones from 1851 to 2010 NWS NHC-6, available at http://www.nhc.noaa.gov/pdf/nws-nhc-6.pdf [3]Walsh, J., et al. (2014) Ch. 2: Our Changing Climate. Climate Change Impacts in the United States: The Third National Climate Assessment, J. M. Melillo, Terese (T.C.) Richmond, and G. W. Yohe, Eds., U.S. Global Change Research Program, 19-67. doi:10.7930/J0KW5CXT. pp. 19-67.Page 20-21. http://nca2014.globalchange.gov/report/our-changing-climate/introduction [4]Swiss Re (2016) Sigma Report No. 1/2016, pages 2 and 5. [5]NOAA (2016) State of the Climate; National Snow and Ice Data Center [6] NOAA National Centers for Environmental Information (NCEI) U.S. Billion-Dollar Weather and Climate Disasters (2017). https://www.ncdc.noaa.gov/billions/ Note: These findings can vary by location.
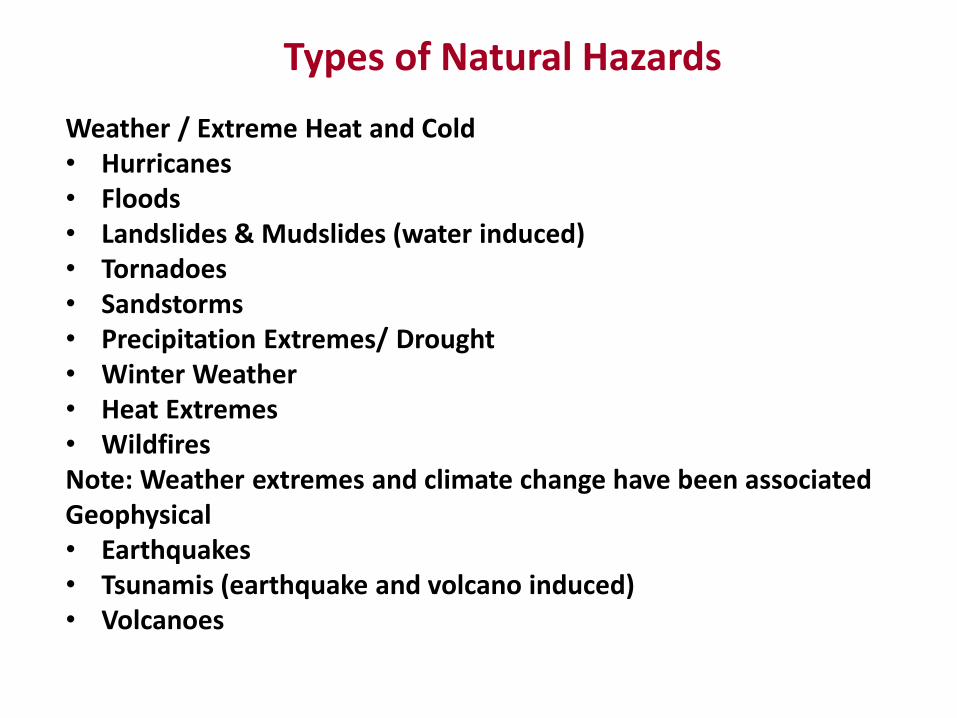
Types of Natural Hazards
Weather / Extreme Heat and Cold • Hurricanes • Floods • Landslides & Mudslides (water induced) • Tornadoes • Sandstorms • Precipitation Extremes/ Drought • Winter Weather • Heat Extremes • Wildfires Note: Weather extremes and climate change have been associated Geophysical • Earthquakes • Tsunamis (earthquake and volcano induced) • Volcanoes

Definition of Extreme Events NOAA, NCDC U.S. Climate Extremes Index (CEI)
“The U.S. CEI is the arithmetic average of the following five or six indicators of the percentage of the conterminous U.S. area [expressed as a percentage]:
• 1. Maximum Temperature. “The sum of (a) percentage of the United States with maximum temperatures much below normal and (b) percentage of the United States with maximum temperatures much above normal.”
• 2. Minimum Temperature. “The sum of (a) percentage of the United States with minimum temperatures much below normal and (b) percentage of the United States with minimum temperatures much above normal.”
• 3. Drought. “The sum of (a) percentage of the United States in severe drought (equivalent ot the lowest tenth percentile) based on the PDSI and (b) percentage of the United States with severe moisture surplus (equivalent to the highest tenth percentile) based on the PDSI.”
• 4. Precipitation (1-day). “Twice the value of the percentage of the United States with a much greater than normal proportion of precipitation derived from extreme (equivalent to the highest tenth percentile) 1-day precipitation events.”
• 5. Precipitation. “The sum of (a) percentage of the United States with a much greater than normal number of days with precipitation and (b) percentage of the United States with a much greater than normal number of days without precipitation.”
• 6. Storms. “The sum of squares of U.S. landfalling tropical storm and hurricane wind velocities scaled to the mean of the first five indicators.” (experimental)
Interpretation: “In each case, we define much above (below) normal or extreme conditions as those falling in the upper (lower) tenth percentile of the local, period of record.”
Source: NOAA, NCDC, http://www.ncdc.noaa.gov/extremes/cei/definition

Extreme Event Trends: All Disasters
Source: NOAA National Centers for Environmental Information (NCEI) U.S. Billion-Dollar Weather and Climate Disasters (2017). https://www.ncdc.noaa.gov/billions/

Selected Characteristics of Billion Dollar Weather Events, 1980-2017
Number of Events: 208 • Severe storms accounted for the greatest number of events – 86 or
41.3% • Tropical cyclones were second (16.8%) and flooding was third (13.0%) Costs: Total Losses (CPI-adjusted) $1,197.3 billion and average event cost $5.8 billion • Tropical cyclones ranked highest in total losses ($566.0 billion or 47.3%)
and per event costs ($16.2 billion) • Drought was second in total losses ($226.0 billion or 18.9%) and in per
event average cost ($9.4 billion) Deaths: 9,660 • Tropical cyclones ranked highest in deaths (3,310) • Drought ranked second (2,993 that were heat-wave related) • Severe storms ranked third (1,578)
Source: NOAA National Centers for Environmental Information (NCEI) U.S. Billion-Dollar Weather and Climate Disasters (2017). https://www.ncdc.noaa.gov/billions/summary-stats

Extreme Event Example: Tropical Cyclones
Source: U.S. EPA (2016) Climate Indicators https://www.epa.gov/climate-indicators; Note: the Power Dissipation Index is a function of wind “strength, duration and frequency”

Greenhouse Gas Emissions Are Increasing
Source: U.S. EPA (2016) Climate Indicators https://www.epa.gov/climate-indicators

IV. Intersections/Juxtapositions Storms, Roads and Rail
Source: NOAA
(2006) NOAA
Celebrates 200
years
NYC Environmental Protection
NOAA (2013) Service Assessment, Hurricane/Post Tropical Cyclone Sandy, Cover page
NOAA (2016) Service Assessment The Historic SC Floods of Oct 1-5, 2015, Photos by NWS Weather Forecast Offices
and USGS, pp. 15, 22.
R. Zimmerman NIST presentation October 2016
South Ferry MTA Station after Hurrican e Sandy. Source: Metropolitan Transportation Authority

Human Activity, Infrastructure and Extreme Events: Greenhouse Gas Emissions by Source
Source: U.S. EPA (April 14, 2017) Inventory of U.S. Greenhouse Gas Emissions and Sinks: 1990 – 2015. Washington, D.C.: U.S. EPA, p. ES-28. Available at https://www.epa.gov/sites/production/files/2017-2/documents/2017_complete_report.pdf

Dysfunctional Interconnected Infrastructure in Extreme Weather
TRANSPORTATION WATER MANAGEMENT
Roads • Signals • Lighting
Rail track) • Signals • Switches • Lighting
Water Conveyance • Drainage Structures • Catch Basins • Culverts • Sewers
Extreme Weather • Flooding • Debris
Power Outages
ENERGY
Transportation blockages impede water controls
Water structure blockages and failures due to clogging, over-capacity, and damage affect transportation
Choke points at the intersection of different interconnected infrastructure systems

V. What Next Choices: Risk-Based
Risk = Probability X Consequences Probabilities (Most Difficult to Change) Alter Social Development Patterns and Use of Infrastructure Services • Reduction in use • Reduction in effects (e.g., emission reduction and
shift to non-Carbon energy) Consequences Alter Infrastructure • Decentralization to reduce interdependencies • Renewables • Reduce exposure and vulnerability

(1) PROBABILITIES Altering Infrastructure Use / non-Carbon Energy
Greenhouse Gas Emission Trends: Reducing Usage
Source: U.S. EPA (April 14, 2017) Inventory of U.S. Greenhouse Gas Emissions and Sinks: 1990 – 2015. Washington, D.C.: U.S. EPA, p. 2-34 and 3-33 . Available at https://www.epa.gov/sites/production/files/2017-2/documents/2017_complete_report.pdf

Water Management Infrastructure Re-design with Green Infrastructure and Modified Gray Infrastructure:
For Protection in Extreme Conditions
TRANSPORTATION WATER MANAGEMENT
Roads Rail (track)
Water Conveyance/ Reduction: GREEN* • Vegetative Nourishment • Islands, reefs
Transportation provides physical support for green infrastructure
Water management (green, gray) infrastructure is decentralized
porous track beds
porous pavement vegetation
vegetation
*Suggested by Georgetown Climate Center (2017) Rebuilding with Resilience, p. 9 Note: Extreme events can impair green infrastructure where floodwaters and debris overwhelm them. Green infrastructure is meant to support water management under normal conditions so that flood volumes can be reduced when extreme events do happen.
Energy Use
Water Protection: GRAY* • Barriers, levees, structures
parallel/perpendicular to shorelines

Interconnection Adaptation to Transportation Redesign -- Multimodal Connectivity to Move from Gray to Green
(shortening bike-share and subway station distances)
INTERCITY RAIL
COMMUTER RAIL
SUBWAY/ LIGHT RAIL
Motor Vehicle
Bike/ Bike-Share
Pedestrian
Motor Vehicle
Bus Transit
These still rely on roadways, but can reduce roadway surfaces by shortening distances. Porous pavement could also be introduced. Source: Produced by Professor Rae Zimmerman, New York University.

Flexibility Through Multi-Modal Connections: Bus Connections at Subway Stations, NYC
Source: Zimmerman, R. et al. (2014 forthcoming), “Promoting Transportation Flexibility in Extreme Events through Multi-Modal Connectivity,” New York, NY: NYU-Wagner. Funded by the U.S. DOT Region 2 UTRC. GIS constructed diagram by Joshua Sellers.

Introducing Energy Infrastructure Interconnections
Gray infrastructures consumes energy in a number of ways: • the use of fuels to power equipment • the use of electric power in the operation of equipment Gray infrastructure can reduce energy usage by: • relying on renewable energy to run equipment • Using materials that are less energy intensive Green infrastructure supports energy reduction in: • reducing reliance on the gray infrastructure equipment
requiring fossil-fuel based energy Green infrastructure consumes energy if: • vegetation requires energy under conditions where sunlight
is not present and for irrigation when water is scarce
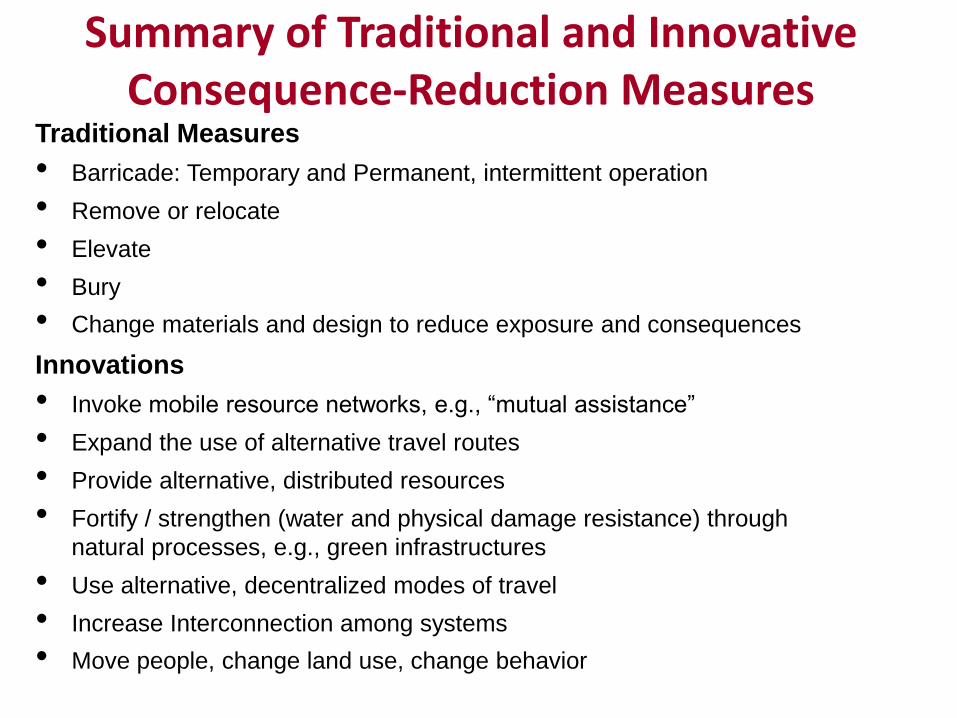
Summary of Traditional and Innovative Consequence-Reduction Measures
Traditional Measures
• Barricade: Temporary and Permanent, intermittent operation
• Remove or relocate
• Elevate
• Bury
• Change materials and design to reduce exposure and consequences
Innovations
• Invoke mobile resource networks, e.g., “mutual assistance”
• Expand the use of alternative travel routes
• Provide alternative, distributed resources
• Fortify / strengthen (water and physical damage resistance) through
natural processes, e.g., green infrastructures
• Use alternative, decentralized modes of travel
• Increase Interconnection among systems
• Move people, change land use, change behavior

Selected Conclusions • Network frameworks are useful for portraying how
infrastructure, population and extreme events interact and are interdependent
• From a risk-based perspective, it is easier to deal with consequences than probabilities; in the short-term, consequences might be easier to address
• There are different ways of reducing consequences: • changing design • materials • distribution of infrastructure
• Social Systems take longer to adjust than physical systems • Time is an important dimension in the network:
• time to develop and introduce a technology and • time to assemble resources to support them • time for public engagement and acceptance • time to comply with or adapt regulations

Acknowledgement
This work was supported by the following grants: “Urban Resilience to Extreme Weather Related Events Sustainability Research Network (UREx SRN)” funded by The National Science Foundation (#1444755) to Arizona State University. (1444755)
Critical Resilient Interdependent Infrastructure Systems and Processes (CRISP) Type 1—
Reductionist and integrative approaches to improve the resiliency of multi-scale
interdependent critical infrastructure,” funded by the NSF (1541164)
“Dynamic Resiliency Modeling and Planning for Interdependent Critical Infrastructures,” funded by the Critical Infrastructure Resilience Institute, U. of Illinois, Urbana-Champaign, part of the Homeland Security Center of Excellence funded by the U.S. Department of Homeland Security Disclaimer: Any opinions, findings, and conclusions or recommendations expressed in this material are those of the authors and do not necessarily reflect the views of the sponsors, the National Science Foundation or the U.S. Department of Homeland Security.