risk factors in long term immunosuppressive use and …598 bx, (no scr 462, scrb 102, scra 34)...
TRANSCRIPT

Risk Factors in Long Term Immunosuppressive Use
and Advagraf
Daniel Serón
Nephrology department
Hospital Universitari Vall d’Hebron

Progressivewell defineddiseases
ABMRGN Polyoma
Non-specificFindings
FibrosisInflammation
Non-specificFindings
FibrosisInflammation
1st year > 1 year

Time dependency of histological diagnosis
Sellares J et al. Am J Transplant 2012; 12: 388

ABMR is the main cause of graft failure
Early
Late
0
10
20
30
40
50
60
70
Torres IB et al. Unpubliished observation
Before 6 mAfter 6m

Inflammation a driving force for fibrosis
Prevention of early inflammation and progression of fibrosis
Providing an adequate immunosuppression

Inflammation a driving force for fibrosis
Prevention of early inflammation and progression of fibrosis
Providing an adequate immunosuppression

Temporal evolution of histologic lesions120 patients with DM1, receiving a kidney-pancreas transplant, 961 biopsies
Nankivell B et al N Engl J Med 2003; 349: 2236
Glomerulosclerosis
Subclinical inflammation
IF/TA

Fibrosis is measured with an ordinal scale
10%
25%
50%
100%
0%
3
2
1
0

Inflammation and progression of IF/TA in paired biopsies
n=598 Bx, (no SCR 462, SCRB 102, SCRA 34)
Nankivell BJ et al, Transplantation 2004; 78:242
* p<0.05***p<0.001

Classification of inflammation and fibrosis
Normal (no inflammation no fibrosis)
Inflammation and fibrosis
Inflammation (no fibrosis)
Fibrosis (no inflammation)

i-IF/TA
Shishido et al, JASN 2003; 14: 1046Cosio FG et al, Am J Transplant 2005; 5: 2464, Moreso F et al Am J Transplant 2006; 6:747Gago M et al. Am J Transplant 2012; 12: 1199
.25
.5
.75
1
0 50 100 150 200 months
Normal=186i=74
IF/TA=110
i=IF/TA=65
Surveillance biopsies < 6 m

Inflammation at 1m/4m and IF/TA and i-IF/TA at 1 y Induction + TAC+MMF+P (500, 250,125,60,30)
No inflammation 172, Borderline 50, acute rejection 19
0
10
20
30
40
50
60
i-IF/TA
i-IF/TA0
10
20
30
40
50
60
IF/TA ≥ 2
IF/TA ≥ 2
Heilman RL et al. Am J Transplant 2010; 10: 563

Inflammation IF/TA and i-IF/TA at 1year
Inflammation
IF/TA
i-IF/TA

(p=0.003)
Acute score
Inflammation at 4 m and risk of late AMR 1988-2006
Moreso F et al. Transplantation 2012; 93: 41
Late AMR 44IF/TA nos 42Recurrence 11De novo GN 7Acute rejection 4Polyoma 1
SurveillanceBxn = 517
IndicationBxn = 109
7y

CHR, IF/TA and outcome
Moreso F et al. Transplantation 2012; 93: 41

0
0,1
0,2
0,3
0,4
0,5
0,6
0,7
DSA No DSA
i
ptc
Wiebe C et al. Am J Transplant 2012; 12: 1157
Surveillance Bx at 6m, de novo DSA and late AMR n=315 (DSA=47, no DSA=268)Time of DSA detection 4.6±3.0

Wiebe C et al. Am J Transplant 2012; 12: 1157
Graft survival and DSA

AR during 1st year in DSA neg pts and 1y protocol Bx
n=797 pts (1998-2010), DSA pre Tx neg
El Ters M et al. Am J Transplant 2013: 13: 2334
% normal histology at 1 y
% class II DSA at 1 y

Inflammation
IF/TA
i-IF/TA
CHR+IF/TA

What does early inflammation mean?
a.) Injury repairinnate immunity
a.) Alloimmune responseaquired immune response againstdonor antigens
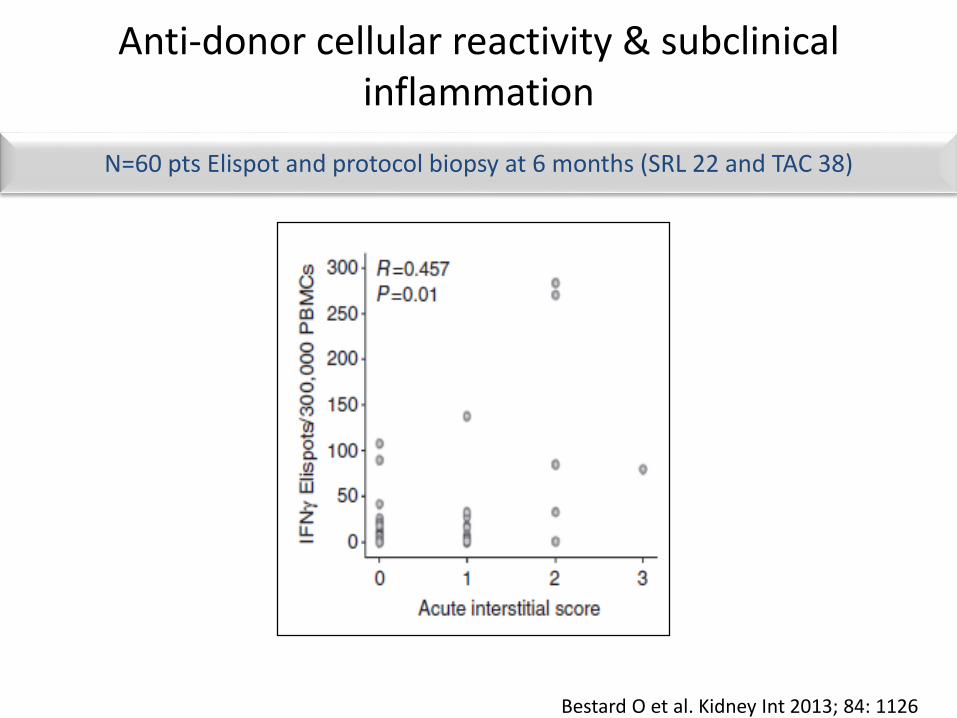
N=60 pts Elispot and protocol biopsy at 6 months (SRL 22 and TAC 38)
Anti-donor cellular reactivity & subclinicalinflammation
Bestard O et al. Kidney Int 2013; 84: 1126

Injury/repair after kidney transplantation
TissueDamage
Inflammation
ApoptosisNecrosis
MBL
Complement

Failure to repair injury and inflammation:Mannose binding lectin
Ibernon M et al. Transpl Immunol 2014; 31: 152

• Ibernon M et al. Transpl Immunol 2014; 31: 152

p=0.044
0
0,5
1
1,5
2
2,5
3
3,5
MBL T1 MBL T2+T3
v
t
i
g
InflammationApoptotic cells
Ibernon M et al. Transpl Immunol 2014; 31: 152
Low MBL and increased inflammation and apoptosis

Inflammation
IF/TA
i-IF/TA
CHR
Alloimmunity
Injury/repair

Inflammation a driving force for fibrosis
Prevention of early inflammation and progression of fibrosis
Providing an adequate immunosuppression

Treatment of SCR with steroid boluses(n=72; 36 pts per group)
CsA+AZA+PN
1 2 3 6 12
Biopsy group
Control group
Randomization
Biopsy group Control group_______________________________________________________________chronic score at 6m 0.50 0.13 1.02 0.31 nsci + ct score at 6m 0.21 0.09 0.62 0.18 0.05_______________________________________________________________
Rush D et al, J Am Soc Nephrol 1998; 9: 2129
Inflammation > 50 (%)

Treatment of SCR in p<tients treatedwith TAC+MMF+PProspective, multicentric study (12 centres)
Protocol Bx Control(n=121) (n=119)
____________________________________________6m IF/TA>2 (%) 35 2024m IF/TA>2 (%) 48 3924 m CrCl (ml/min) 7627 72 18_____________________________________________
1 2 3 6 24
Biopsy group
Control group
Randomization
Rush D et al Am J T ransplant2007; 7: 2538
5 7 0 9 0
6 2

TAC vs CsA: a case control studyall treated with MMF and P
n=98
Moreso F et al Transplantation 2004; 78: 1064
borderline
AR I
AR II

Tac versus CsA: 4m immunophenotype
Serón D et al. Transplantation 2007;83:649–652
p<0.01
p<0.01 p<0.05ns
Tacrolimus (n=44) vs ciclosporina (n=22)

NUMBER OF INTERSTITIAL INFILTRATING CELLS ACCORDING TO TACROLIMUS TROUGH LEVELS AT BIOPSY
(median TAC levels at Bx = 9.3 ng/mL) n=90 pts
P=0.122
P=0.020
P=0.004
P = 0.0031
Torres IB. 2015 unpublished observation

CNI+MMF vs CNI +SRLProspective randomized study (jun 2000-oct 2004)
Basiliximab + stop steroids at 2 days
Kumar A et al. Transpl Immunol 2008; 20:32
Lesión CsA + MMF
50
CSA + SRL
50
TAC + MMF
50
TAC + SRL
50
BPAR % (1a) 18 8 14 4
SCR% (1a) 22 8 16 6
IF/TA % (5a) 54 16 38 14

CNI +MMF vs CNI +EVR6 m protocol Bx
historical cohort 2002-2006 (N=51), experimental cohort 2006-2009 (N=28)
0
5
10
15
20
25
CNI +MMF
CNI +EVR
SCR
0
10
20
30
40
50
CNI +MMF
CNI +EVR
IF/TA
Kanzelmeyer NK et al. Clin Transplant 2013; 27:319
54
56
58
60
62
64
66
68
70
CNI + MMF CNI + EVR
eGFR
ml/min/1.73m2

CsA minimisation & progression of IF/TAN=155 patients & 310 biopsies
Serón D et al. Kidney Int 2002;61:727
0 4m 1y
No progression
(n=104)
Progression
(n=51)
P
Donor age (years) 35 ± 18 37 ± 15 NS
DGF (%) 19 16 NS
AR (%) 21 20 NS
Mean CsA levels (1st
biopsy)
218 72 217 74 NS
Mean CsA levels (2nd
biopsy)
165 ± 50 149 ± 41 0.04

Tac Exposure and Evolution of Histology in the First Year After Transplantation
(n=61 pairs of biopsies)
Naesens M et al. AJT 2007;7:2114–2123

Tacrolimus minimisation and withdrawal after 1 year
is associated with poor graft survival
Withdrawal (n=296)
Continuation (n=1,736)Dose reduction (n=352)
Tacrolimus:
Kidney graft survival (serum creatinine <260µmol/L); both comparisons
Cu
mu
lati
ve s
urv
ival
0 1 5 7
0
100
65
80
85
90
32 4 6
70
75
95
Years post-transplantation
Opelz G et al. Transplantation 2008;86:371
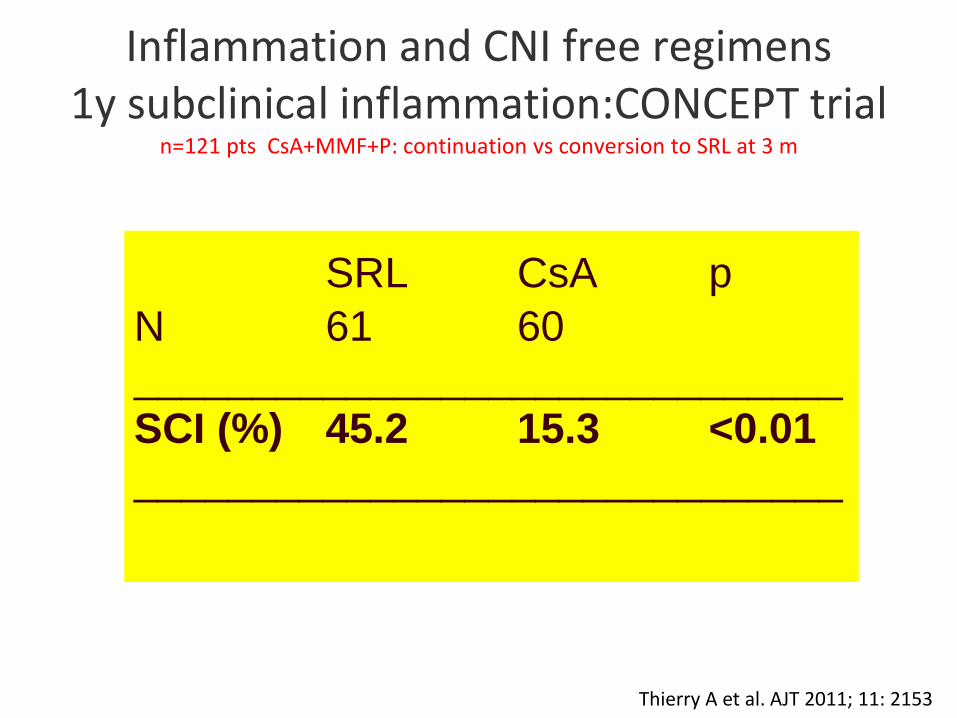
Thierry A et al. AJT 2011; 11: 2153
Inflammation and CNI free regimens1y subclinical inflammation:CONCEPT trial
n=121 pts CsA+MMF+P: continuation vs conversion to SRL at 3 m
SRL CsA p
N 61 60
______________________________
SCI (%) 45.2 15.3 <0.01
______________________________
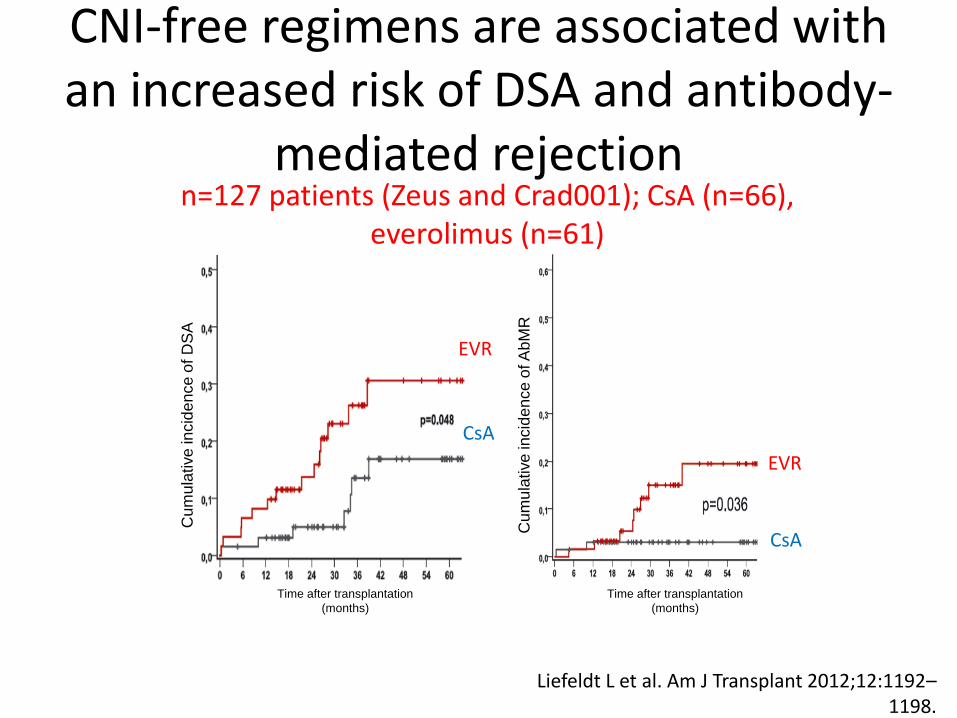
CNI-free regimens are associated with an increased risk of DSA and antibody-
mediated rejectionn=127 patients (Zeus and Crad001); CsA (n=66),
everolimus (n=61)
Cum
ula
tive
incid
en
ce o
f D
SA
Cum
ula
tive
incid
en
ce o
f A
bM
R
Time after transplantation
(months)
Time after transplantation
(months)
Liefeldt L et al. Am J Transplant 2012;12:1192–1198.
EVR
CsA
EVR
CsA

Inflammation a driving force for fibrosis
Prevention of early inflammation and progression of fibrosis
Providing an adequate immunosuppression


Adherence in children and graft survival > 6m Medicacation possesion ratio
Tx 1995-2000 4080
CNI based IS 4009
Graft survival > 6m 3908
36 m follow up 3856
36m claims database 877
Crisholm-Burns MA et al. Am J Transplant 2009; 9: 2497
Upper quartile
1-3 quartiles

Cause of graft failure and non adherence
Sellares J et al. Am J Transplant 2012; 12: 388-399.

Non-adherence is associated with poor graft survival in kidney transplantation
Kaplan-Meier graft survival. The non-adherent group consisted of 19 patients (3 graft failures) and the adherent group consisted of 94 patients (2 graft failures)
Tielen M et al. Am J Transplant 2014;Article 675301.
∕∕

Non adherence
Fine et al. Am J Transplant 2009; 9: 35

Evaluation of non adherence

Morisky scale yes (0) and no (1)
MMAS-4
Do you ever forget to take your medicine?
Are you careless at times about taking your medicine?
Sometimes when you feel worse when you take the medicine, do you stop taking it?
When you feel better do you sometimes stop taking your medicine?

Couzi et al et al. Transplantation 2013; 95: 326
Factors associated with non-adherenceN=312 pts: Morisky scale > 0
0
5
10
15
20
25
30
35
40
3m 6m 12m 24m
% NA

Non adherence18 y73 %males87 % cadaveric87 % first TxN=63%
SMAQ 27 %
BAASIS 30.2 %

Prospective randomized study: adherence contract vs conventional follow up
Chisholm-Burns MA et al. Am J Transplant 2013; 13: 2364.
Adherence (pharmacy refill records) Probability (%) NOT to be hospitalized

High variability in tacrolimus exposure is associated with increased incidence of rejection
100
80
60
40
20
0
No rejection
(n=36)
CV
% o
f ta
cro
lim
us l
evels
Rejection (n=10)
CV% >41%
OR=9.7, P=0.005
Hsiau M et al. Transplantation2011;92:918

Varaibility of TAC and outcomeoutcome variable: late AR, TG, graft loss
Sapir-Pichhadze T et al. Kidney Int 2013; 85: 1404

Variability of TAC levels and inflammation
Variable Tac CV (<26,7) n =
28
Tac CV (26,7-43,8) n =
29
Tac CV >43,8 n=28 p-value
E GFR 57± 16 57± 13 53±17 ns
g-score 0.06± 0.24 0.11 ± 0.32 0.13±0.33 ns
i-score 0.17 ± 0.4 0.28± 0.5 0.57±0.6 0.0161
Total i score 0.22±0.5 0.36±0.7 0.7±0.8 0.0027
CD45 17.2±22 11.9±8 25±18 0.034
IB Torres et al Manuscript in preparation

Moreso F et al. (in press)
Factors associated with non-adherence
Socio-economic factorsfinancial difficulties / lack of transportation
Health organization barriers limited amount of time/patient, staff rotation
Disease related factorsdepression and anxiety
Therapy related factors side effects of drugs, complex dose regimens
Patient related factorscommunication barriers, healt attitudeshealth beliefs and literacy

Improvements in correct dosing after
conversion from TAC to ADV (n=219 pts)
Kuypers et al. Transplantation 2013; 95: 333
p= 0.0009

Non adherence is more commonin the evening dose
Kuypers et al. Transplantation 2013; 95: 333

Conversion from TAC to ADVn=1832 pts
Conv 1:1 and 1 to 1.1 in pts with through levels < 6 ng(ml
Guirado L et al. Am J Transplant 2011; 11: 1965

Var AUC 0-24 after conversion from TAC BID toTAC QD
AUC 5 times before and 5 times after conversion (n=40)
0
2
4
6
8
10
12
14
16
Var coeficient %14,1
TAC
ADV
P =0.012
Stifft F et al. Transplantation 2014;97: 775

Treatment
inflammation
+
IF-TA
i-IFTA
Chronic humoral rejection
Summary
+

Under-immunosuppression as a cause of chronic rejection and graft loss
