risk based marine inspection performance measures · risk-based marine inspection performance...
TRANSCRIPT

i
Title Page
Risk-Based Marine Inspection Performance
Measures
An Interactive Qualifying Project
Submitted to the faculty of
Worcester Polytechnic Institute
in partial fulfillment of the requirements for the
Degree of Bachelor of Science
Submitted to:
Coast Guard Liaisons: Jonathan Wendland, Tony Morris, Lt. Joshua Buck, and Pat Lee
WPI Advisors: James Hanlan and David DiBiasio
Submitted by:
Christina Bailey Mitchell Caisse
Erika Kirichenko Nicholas Smith
Submitted on December 19, 2013

ii
Abstract
The objective of this project was to standardize the way risk reduction is measured
during marine vessel inspections, based on the deficiencies found on each vessel by the Coast
Guard. Over the course of the project, we researched past performance measure models, in
addition to working closely with the MISLE database and Coast Guard personnel to determine
which factors should be included in our analysis. We then created a prototype model, based on
the vessel data from the past decade, for automatically assigning risk-reduction values to
various deficiencies.

iii
Acknowledgements
We would like to thank the following institutions and people:
Our sponsoring agency, the United States Coast Guard (USCG), for providing us with this opportunity, the resources necessary to fulfill our project, and support and guidance throughout our time in Washington, D.C. We would especially like to thank the following people from the Coast Guard:
Our administrative liaisons, Jonathan Wendland and Tony Morris, for their help in becoming acclimated at the Coast Guard HQ.
Lt. Joshua Buck, for his dedication to seeing our project succeed and for helping guide us through the process of creating our model.
Commander Norton, for showing interest in and support for our project.
Pat Lee, for helping arrange contact with SMEs and for providing us with information necessary to our project.
Jack Kemerer, for his support, enthusiasm, and attendance of our poster session at the 40th anniversary event.
The entire CVC-05 sector, especially Robert Gauvin and Shahzad Aziz.
Additionally, we would like to thank Captain Gary Oliveira, Vice President and General Manager of McAllister Towing of Narragansett Bay, and Scott Jason, Project Manager, Atlantic Division of Foss Maritime Company for allowing us to gain more knowledge about the towing vessel industry through interviews. Finally, we would like to thank Worcester Polytechnic Institute for this opportunity to travel and fulfill our IQP requirement in Washington, DC. Especially our advisors:
Our WPI primary advisor, James Hanlan, for his support and input on our report.
Our WPI co-advisor, David DiBiasio, for his guidance.
iv
Table of Contents Title Page ..................................................................................................................................... i
Abstract ...................................................................................................................................... ii
Acknowledgements .................................................................................................................... iii
Table of Contents ....................................................................................................................... iv
Table of Figures ........................................................................................................................ viii
Table of Tables ........................................................................................................................... ix
List of Abbreviations.................................................................................................................... x
Executive Summary .................................................................................................................... xi
Chapter 1: Introduction ...............................................................................................................1
Chapter 2: Background ................................................................................................................4
2.1 Vessels and Inspections .....................................................................................................4
2.1.1 Vessel Regulations .......................................................................................................4
2.1.1.1 Vessel Equipment Regulations ..............................................................................5
2.1.1.2 Accidents due to Human Error ..............................................................................6
2.1.1.3 American Waterways Operators ...........................................................................7
2.1.2 Types of Vessels ..........................................................................................................8
2.1.2.1 Towing Vessels ......................................................................................................8
2.1.2.2 Other Vessels ........................................................................................................9
2.1.3 Inspection System .......................................................................................................9
2.1.4 Changes to Inspection System ...................................................................................11
2.1.4.1 New Inspection System for Towing Vessels .........................................................11
2.2 Prevention Measures .......................................................................................................12
2.2.1 Available Resources ...................................................................................................13
v
2.2.1.1 MISLE Database ..................................................................................................14
2.2.1.2 Models ................................................................................................................15
2.2.2 Risk-Reduction Values ...............................................................................................15
2.3 Summary .........................................................................................................................16
Chapter 3: Methodology ...........................................................................................................18
3.1 Research of Past Performance-Measuring Models ...........................................................18
3.1.1 Risk Indices Analysis ..................................................................................................18
3.1.2 Fault and Event Tree Analysis ....................................................................................19
3.1.3 Failure Modes and Effects Analysis ............................................................................24
3.1.4 Cost Risk Analysis ......................................................................................................25
3.2 Development of a Prototype ............................................................................................25
3.2.1 Risk Indices Analysis ..................................................................................................26
3.2.2 Fault and Event Tree Analysis ....................................................................................26
3.2.3 Failure Modes and Effects Analysis ............................................................................27
3.2.4 Cost Risk Analysis ......................................................................................................27
3.3 Application of Vessel Data ...............................................................................................28
3.3.1 MISLE Database .........................................................................................................29
3.3.2 USCG CGBI .................................................................................................................29
3.4 Testing of the Final Product .............................................................................................30
Chapter 4: Results and Analysis .................................................................................................31
4.1 Risk-Reduction Model ......................................................................................................31
4.1.1 Assigning Severity ......................................................................................................33
4.1.2 Component Frequency Calculations ..........................................................................34
4.1.3 Component: Assigning Severity .................................................................................35

vi
4.1.4 Relating Sub-system and Component ........................................................................36
4.2 Test Case Calculation .......................................................................................................37
4.2.1 Sub-system Severity ..................................................................................................37
4.2.2 Component Severity ..................................................................................................38
4.2.3 Component Frequency ..............................................................................................38
4.2.3 RRV Calculation .........................................................................................................40
4.2.5 Streamlining the Process ...........................................................................................41
4.3 Application of the RRV Model ..........................................................................................42
4.3.1 Setting the RRVs ........................................................................................................42
4.3.2 Application to Towing Vessel Data .............................................................................43
4.3.3 Identifying the Most Important Deficiencies ..............................................................45
4.4 RRV’s Potential Link to the Accident Data ........................................................................47
4.4.1 Human Casualties ......................................................................................................48
4.4.2 Economic Cost ...........................................................................................................49
4.4.3 Environmental Impact ...............................................................................................49
Chapter 5: Conclusions and Recommendations .........................................................................51
5.1 Conclusions ......................................................................................................................51
5.1.1 Application of the RRV Model to Towing Vessel Data ................................................52
5.2 Recommendations .......................................................................................................53
5.2.1 Improve Data Quality ................................................................................................53
5.2.2 Link between Accidents and Deficiencies ..................................................................54
5.2.3 Verifying Consequence Scale .....................................................................................54
5.2.4 Component Scale Clarifications .................................................................................55
References ................................................................................................................................56
vii
Appendices ...............................................................................................................................60
Appendix A: Sponsor Description ...........................................................................................60
Appendix B: What is an IQP?..................................................................................................65
Appendix C: Interview Protocols ............................................................................................67
Appendix D: Interview Transcripts .........................................................................................68
D-1 Foss Maritime Company ..............................................................................................68
D-2 McAllister Towing of Narragansett Bay ........................................................................70
Appendix E: Calculating Risk-Reduction Value .......................................................................72
Appendix F: Calculating Accident Value .................................................................................75
Appendix G: RRV Assistant User Guide ..................................................................................78
Appendix H: RRV Assistant Developer Guide ..........................................................................81
Appendix I: Excel Program User Guide ...................................................................................83

viii
Table of Figures
Figure 1: RRV Process ................................................................................................................ xii
Figure 2: Prevention Pillars ........................................................................................................13
Figure 3: Fault Tree Analysis Example (IEC, 2009) ......................................................................20
Figure 4: Event Tree Analysis Example (IEC, 2009) .....................................................................22
Figure 5: Cause - Consequence Analysis Example (IEC, 2009) ....................................................23
Figure 6: System Breakdown from USCG MISLE database..........................................................31
Figure 7: Example System ..........................................................................................................32
Figure 8: RRV Equation ..............................................................................................................32
Figure 9: Frequency Equation Components ...............................................................................35
Figure 10: RRVs within Communications ...................................................................................41
Figure 11 Towing Vessel RRV Totals by Year ..............................................................................43
Figure 12: USCG District Map (Units, 2013) ...............................................................................61
Figure 13: USCG Organizational Chart (Organizational Structure, 2013) ....................................63
Figure 14: Human Casualty Scale ...............................................................................................72
Figure 15: Environmental Impact Scale......................................................................................72
Figure 16: Property Damage Scale .............................................................................................73
Figure 17: Component Impact Scale ..........................................................................................73
Figure 18: RRV Ending Year dropdown example ........................................................................78
Figure 19: RRV Sub System dropdown example .........................................................................79
Figure 20: RRV Severity Modification example ..........................................................................80
Figure 21: Excel Example ...........................................................................................................83

ix
Table of Tables
Table 1: Sub-system Environmental Impact Severity Scale ........................................................33
Table 2: Component Severity Scale ...........................................................................................36
Table 3 “Alarms/Indicators” Sub-system Impact Rating .............................................................38
Table 4: Deficiency Detections Doubled ....................................................................................39
Table 5: Severity Doubled..........................................................................................................39
Table 6: RRVs for “Alarms/Indicators” .......................................................................................40
Table 7: Top 10 Deficiencies: 2009 - 2013..................................................................................46
Table 8: Example Severity Scale to SMEs ...................................................................................74
Table 9: AV Severity Scale Components .....................................................................................75
Table 10: AV Example Calculation .............................................................................................77
Table 11: SYSTEMS Table specification ......................................................................................82
Table 12: SUB_SYSTEMS Table specification ..............................................................................82
Table 13: COMPONENTS Table specification .............................................................................82

x
List of Abbreviations
ABS – American Bureau of Shipping
AV – Accident Value
AWO – American Waterways Operators
CCC & IT – Command, Control, Communications and Information Technology
CGBI – Coast Guard Business Intelligence
CVC – Commercial Vessel Compliance
ETA – Event Tree Analysis
FMEA – Failure Modes and Effects Analysis
FORCECOM – Force Readiness Command
FTA – Fault Tree Analysis
HR – Human Resources
IEC – International Electrotechnical Commission
IHI – Institute of Health Improvement
IQP – Interactive Qualifying Project
ISM – International Safety Management Code
ISO – International Organization for Standardization
ITB – Integrated Tug and Barge
MISLE – Marine Information for Safety and Law Enforcement
MMS – Mission Management System
MSRAM – Maritime Security Risk Analysis Model
RIA – Risk Indices Analysis
RPN – Risk Priority Number
RRV – Risk Reduction Value
SME – Subject Matter Expert
TSAC – Towing Safety Advisory Committee
TVNCOE – Towing Vessel National Center of Expertise
USCG – United States Coast Guard
WPI – Worcester Polytechnic Institute

xi
Executive Summary
The United States Coast Guard (USCG) is phasing in a new set of regulations requiring
annual inspections for towing vessels, a category of vessels which have not been previously
subject to Coast Guard inspection. To maximize the value of these new regulations, it is
important for the Coast Guard to assess their performance during towing vessel inspections,
and quantify their level of preventative measures to better allocate both time and resources.
Currently, no systematic method of accomplishing this task exists.
The Coast Guard’s Prevention mission performance has historically been measured and
reported in terms of “tombstone parameters” that have included annual statistics of deaths
and casualties. This information did not provide a complete and accurate picture of all the
measures taken by the Coast Guard to create a safer marine environment, nor did it account for
the fact that most accidents are not caused by a lack, or poor quality, of inspections. Therefore,
the Coast Guard set out to develop a risk-based performance-measuring model that would
create a method for systematically measuring risk reduction achieved through vessel
inspections. To complete this task, this project centers on the assumption that each vessel
deficiency has a Risk-Reduction Value (RRV) based on the amount of risk potentially prevented
through the discovery of a deficiency. One may find the overall risk reduced through vessel
inspection of any given vessel by summing the total risk reduction values from discovered
deficiencies.
The goal of our project was to create a methodology for systematically assigning RRVs to
vessel deficiencies. We accomplished this by first gaining a better understanding of risk-based
analysis through research of past, successful performance measures. We then accessed the

xii
Coast Guard’s Marine Information for Safety and Law Enforcement (MISLE) Database and
analyzed towing vessel data from the past decade. In order to better gauge the severity of each
deficiency, we tracked trends such as frequency of incident occurrence and deficiency
detection in inspection reports. Figure 1, below, helps depict how the RRV model incorporates
frequency and severity to calculate the RRVs.
Figure 1: RRV Process
We then completed our model by adopting useful ideas from past methodologies and
customized the model to best tailor it to vessel inspections. We initially tested the feasibility of
our prototype by applying it to towing vessel data. The Coast Guard expects to run larger scale
tests, and implement a front end for the program, eventually connecting to all vessel
inspections. We anticipate that our findings and recommendations will help the Coast Guard
fulfill their Prevention mission and lower the casualties and expenses associated with vessel
incidents.
Sub-system Severity
Component Severity
Component Frequency RRV
1
Chapter 1: Introduction
As part of its Prevention mission, the United States Coast Guard (USCG) (2013) recently
created an annual inspection system for towing vessels, with plans for implementation in 2015
(P. Lee, personal communication, Sept. 17, 2013). While there were no previous formal USCG
inspection processes in place for towing vessels, a bridging program was initiated to phase in
regular inspections over the course of the past few years. As a result this will allow the Coast
Guard to measure the value of the new regulations by comparing inspection data before,
during, and after the bridging program.
With these new regulations in place, the Coast Guard hopes to lower marine casualties
and financial losses through preventative measures which will anticipate and address problems
before incidents occur. However, without a system in place that can utilize the data from the
new inspection program, and compare it to data from the years prior to inspections,
determining the true value of new regulations will be difficult (Talley, Jin, & Kite-Powell, 2007).
Despite having extensive vessel and inspection information on hand, no distinct process has yet
been created to accurately measure the performance of the new inspection system.
In past attempts at gauging the value of the inspections, data on vessel safety were
based on “tombstone parameters” of numbers of casualties and property damage after an
accident had occurred. While these are informative indicators of what accidents have
happened, they do not directly indicate the effectiveness of the preventative measures.
Because prevention extends beyond directly stopping an incident and involves identifying and
diminishing certain risky conditions and circumstances, the Coast Guard’s performance must be

2
measured in another way. For this reason, the Coast Guard aims to create a more
comprehensive performance measuring system to gauge the efficiency of inspections and
understand how their efforts and resources can be better spent and distributed, as well as to
demonstrate the progress made as a result of the new inspection system.
To reach this goal, a system for keeping track of deficiencies found during inspections,
as well as their severity, has been recently proposed by Coast Guard officials (Mission
Management System Staff, 2013). This system is risk-reduction based, and assigns numerical
values to different deficiencies found during examinations. The overall risk-reduction is then
calculated by adding up all deficiency values. However, these individual risk-reduction values
(RRVs) are currently subjectively assigned on a scale from one to ten based on the opinions and
knowledge of the best estimations of the experts who got started on developing the
performance evaluation system.
In order to measure the effectiveness of the new inspection program with precision, the
method for assigning reduction values needs to be designed in an objective and systematic
fashion. To fulfill this goal as part of our project, we examined how prior, successful
performance measuring programs accomplished this task, which could aid in creating an
improved process for marine vessel inspections. We initially narrowed our focus by analyzing
towing vessel data within the Marine Information for Safety and Law Enforcement (MISLE)
database from the past five years for test purposes, and then applied our method to the past
five years of deficiency data for all vessel types. This ensured that the methodology for this
process is sustainable enough to apply to other types of vessels or facilities as well as to enable
3
our product to have more expansive application and maximize value for the Coast Guard’s
Prevention mission.

4
Chapter 2: Background
In order to ensure that all commercial vessels operating in U.S. waters meet minimum
operational and safety requirements, the Coast Guard has put in place a variety of regulations,
outlined in Title 46 of the Code of Federal Regulations (USCG, 2013). This chapter reviews the
current vessel regulations, types of vessels, the general inspection process, and the changes
made to the new inspection system for towing vessels. It then proceeds to look at prevention
methods and evaluate ways by which we can quantitatively gauge risk-based performance
measures.
2.1 Vessels and Inspections
Understanding vessels and the criteria used to inspect them is a necessary starting
component to our project. Most commercial vessels are regulated by the Coast Guard and
inspections are used to ensure regulatory compliance. Unlike other types of vessels, towing
vessels are unique because they are currently uninspected. Thus, regulations are not evenly
enforced throughout the towing vessel industry (S. Jason, personal communication, October 2,
2013). The new inspection system, which is planned to be fully implemented in 2015, will help
in achieving better enforcement and safer waterways. This section provides an overview of
regulations, types of vessels, and the inspection system process.
2.1.1 Vessel Regulations
Commercial vessels are regulated from the moment the plans for vessel construction
are completed. The Coast Guard then continues to oversee vessel construction by qualified

5
Coast Guard Inspectors or by a designated recognized organization called a Classification
Society (USCG, 2013). Once the vessel is completed, final inspections are completed and
required documentation is issued to the owner/operator. This issued documentation is proof
for the owner or operator that the vessel is certified for the intended service. During the
vessel’s life, the vessel will be periodically inspected and examined, which evaluates the fitness
of the vessel to continue service. For example, a vessel designed to carry oil, undergoes
rigorous inspections to ensure that the cargo tanks are intact and properly maintained. This will
aid in preventing the possibility of an accidental discharge (J. Buck, personal communication,
December 1, 2013). Inspectors must make sure that the vessel is able to operate safely without
presenting a hazard to navigation. The scope of each inspection often includes a systematic
check of most interior voids, as well as conducting an external exam of the vessel’s hull, in
addition to vital vessel systems necessary for safe operation. Upon completion of this
inspection, the inspector will endorse some of the documentation of the vessel to indicate that
the vessel can continue service until the next scheduled inspection.
2.1.1.1 Vessel Equipment Regulations
U.S. regulations require the inspection of engineering systems, materials, tools, safety
devices, and other key components necessary for safe operations installed onboard each
inspected vessel (USCG, 2009). These inspection requirements are mandated to ensure that the
vital systems on vessels will perform as intended in case of an emergency. It is important to
reiterate that Coast Guard regulatory oversight of vital vessel systems begins at the vessel’s
design and construction, when the materials and methods used must initially be approved.
Thereafter, the installation and maintenance of machinery is regulated through approvals,

6
tests, and inspections. The extent of regulation may depend upon how critical a system
component is in relationship to the safe operation of the vessel; and to the degree of failure of
the component that may contribute to a significant or major marine casualty. Other parts
subject to regulation include auxiliary machinery, boilers, spill valves, emergency lighting,
power equipment, and various vessel specific tools such as welding gear and petroleum related
machinery. Lifesaving equipment has stringent regulations and failure to meet these
requirements often mandates reporting the failure, which could lead to an investigation as to
why the established standards were not met.
2.1.1.2 Accidents due to Human Error
Because accidents are not always caused by physical damage to a vessel, or by the
absence or failure of equipment, the human factor must be taken into account as well. In
current inspections, emphasis is put on the certification and verification of the mariners who
work on commercial vessels (USCG, 2000). The type of professional credential a mariner holds
determines what type of vessel on which he or she will work. Additionally, regulations
concerning the length of a watch by a single crew member must be followed, such as the
established three watch system on Commercial Fishing Vessels, unless licensed to do otherwise.
There are also voluntary programs, such as The Crew Endurance Management System, that
allow for vessel owners and operators to identify risk factors in crew endurance and ways to
manage these risks.
All of the regulations mentioned above aim to prevent the most common causes of
accidents: human error and equipment malfunction (Rothblum, 2000). Despite the
implementation of regulations governing mariner activity and the technological advances in

7
marine vessel construction, the accident rate remains relatively high. For example, between
2000 and 2012, there were a total of 2,365 medium to high severity incidents involving towing
vessels. This means that the impact of each incident involved costs of $50,000 and higher,
and/or injuries ranging in severity from those that involved professional treatment, up to
hospitalization, or even death (AWO, 2013). These accidents included fires, collisions, tanker
accidents, towing vessel groundings, and collisions. Looking at statistical data, human error
appears to play a significantly larger role in compromising vessel safety than any other risk
factor. In fact, research suggests that 75-96% of casualties are human error related, such as
75% of fires and explosions, as well as 89-96% of collisions, in addition to other types of
accidents (Rothblum, 2000).
2.1.1.3 American Waterways Operators
The American Waterways Operators (AWO, 2013) is the national association for towing
vessels and barges. The mission of the AWO is “to promote the long term economic soundness
of the industry, and to enhance the industry’s ability to provide safe, efficient, and
environmentally responsible transportation, through advocacy, public information, and the
establishment of safety standards” (About, AWO). The AWO has a Responsible Carrier Program
which builds upon and exceeds the government regulations and is available for companies to
opt into in order to enhance their credentials by assuring that they meet the heightened
standards of the AWO. The program is a good option for towing vessel companies because this
program is uniquely tailored to the industry. Along with this program, the AWO ensures safety
for towing vessels through their partnership with the Coast Guard and through safety
committees.
8
The AWO has become increasingly involved and concerned with security measures since
September 11, 2001. With the Coast Guard and the U.S. Army Corps of Engineers, the AWO
(2013) developed a security plan for risks associated with towing hazardous cargo. In 2002,
AWO released the first Alternative Security Program, which is Coast Guard approved under the
current regulations. This security program includes annual audits and requirements such as
security drills and exercises, security system and equipment maintenance, responding to
changes in the prevailing Coast Guard-established Maritime Security Level, and security
measures for cargo handling.
2.1.2 Types of Vessels
There are a multitude of vessels that travel in the waters around the U.S. This includes,
but is not limited to, towing vessels, passenger vessels, cargo vessels, and fishing vessels. These
vessels all have a basic structure in common, but each has a unique purpose. The vessel’s
purpose is what defines how and where the ship will operate.
2.1.2.1 Towing Vessels
A towing vessel has many roles and can operate in a variety of water ways (Marine
Insight, 2010). Towing vessels are mainly responsible for moving other vessels that are unable
to move themselves, or are unable to safely maneuver in tight spaces. This requires towing
vessels to have a variety of different sizes and engine capacities and to be able to work in
different environments. Each role, as well as location, imposes different risk factors and size
requirements on the vessels.

9
One location where towing vessels operate is in harbors. There they are responsible for
moving much larger vessels, as these vessels generally move forward and backwards easily, but
have large turning radiuses and are generally unable to maneuver sideways (Marine Insight,
2010). Therefore, harbor towing vessels have much more power, generally around 27,000 horse
power engines, than other towing vessels which have between 680 to 3,400 horsepower.
Towing vessels have the ability to operate in narrow and shallow waters (Pearce, 2005).
This makes them an ideal choice for moving cargo up and down navigable rivers. They generally
do this by towing barges, which are unable to move on their own. Most barges are not as big or
as heavy as cargo ships, therefore river tugboats generally have less horsepower than ocean
tugs, usually between 680 to 3,400 hp.
2.1.2.2 Other Vessels
Other vessels such as cargo, passenger, and fishing vessels also exist. Their purposes
however, do not involve moving other ships (USCG, 2013). A passenger vessel’s main purpose
is to safely transport people from place to place. Their size varies depending on how many
people they are intended to carry. Cargo vessels are similar to passenger vessels, except,
instead of transporting people, they transport goods. Cargo vessels have dedicated, yet limited
accommodations for the crew.
2.1.3 Inspection System
Various areas on a vessel, along with its equipment, are inspected during a typical vessel
inspection. The USCG (2013) divides the inspection process into these main categories:

10
Credentials, documents, and records Navigation safety equipment Lifesaving equipment Towline and terminal gear equipment Pollution prevention equipment Firefighting and prevention equipment Hazardous conditions.
Using a comprehensive inspection checklist with these headings, either a third party inspector
or a Coast Guard inspector, goes through each applicable component to determine if the
component is in satisfactory condition. Any time a deficiency is found, it is included in the
inspection report and related to a specific component of the vessel. At the end of the form,
there is an area for the inspector to make notes on the deficiencies of the vessel and also a
section for notes and recommendations.
Vessels are inspected on a regular basis that is tailored to the specific type of vessel.
Many of the inspections done on certain large commercial vessels are performed by a third
party, called a Classification Society, which is approved by the Coast Guard (Oceana, 2013). In
addition to this third party inspection system, an owner will sometimes inspect his or her own
vessels on a regular basis. While personal inspection is a good practice, it is not a replacement
for a third party or Coast Guard inspector who would normally be less biased (Federal Register,
Sept. 2011). If a company opts to be inspected by a third party, the Coast Guard must approve
and audit the third party inspection system as well as the company approximately every five
years. If a company does not opt for a third party system, as might be the case for a smaller
company without the resources of a larger company, Coast Guard officials will inspect the
company’s vessels yearly. While this is the general inspection system process, towing vessels
are currently not regularly inspected, and will not be until 2015.

11
2.1.4 Changes to Inspection System
Since towing vessels were put under USCG purview in 2004, they have been classified as
uninspected vessels, and as such there have been no required, regularly scheduled inspections
put in place (Federal Register, Aug. 2011). Up to this point, there have only been examinations
of individual vessels when a particular reason came to the attention of either the owner or the
Coast Guard. Recently, the Coast Guard has decided to institute a new system but wants to
ensure that this new system is operating at its full potential.
2.1.4.1 New Inspection System for Towing Vessels
In order to ensure that the towing vessel industry is cooperating with this new system,
the Coast Guard (Towing Vessel National Center of Expertise, 2013) has held several public
meetings through the Towing Safety Advisory Committees (TSAC) where towing vessel industry
representatives participate in the discussion of regulations and inspections (Federal Register,
Sept. 2011). The Coast Guard hopes that, by including the industry from the start, a smooth
transition into an efficient, systematic, and effective system will evolve. One major concern
voiced by industry representatives during the public meetings was about the rationale behind
the new system. Industry representatives argued that any new regulations or inspections
should address real risks instead of trying to cover every aspect of tug operations in broad
strokes.
The new system is still in development and few specifics have been released. There are,
however, a few existing systems in place that can be looked to for potential sources of
precedence, including systems currently in place for passenger vessel inspections (USCG, 2013).
Additionally, towing vessels are subject to examinations when deficiencies are noticed and

12
reported by either the owner or the Coast Guard, or if a vessel casualty takes place. There are
standard forms to fill out in the event of these examinations which include provisions for
checking crew certifications and licenses, machinery, lifesaving equipment, navigational
systems, structural integrity, and more. These forms represent an existing inspection method
which will likely be used in part as a basis for the new system.
2.2 Prevention Measures
With the broader scope of vessels and the inspection system for towing vessels now
defined, it is crucial to understand how inspection data can be used to implement better
prevention measures. The Coast Guard has five pillars that fall under the category of
prevention including Investigation, Facilities, Inspection, Water Ways Management, and Port
Security Advisory, as demonstrated in Figure 2. Our project will be concentrating on the
“Inspection” pillar, highlighted in green, with future application to all five pillars. This section
provides an overview of what the Coast Guard currently does in terms of prevention and what
their ultimate goal is. Understanding the Coast Guard’s available resources, relevant prevention
models, and risk-reduction values, specifically for inspections, is important for our goal of
creating an objective prevention methodology.

13
Figure 2: Prevention Pillars
Currently, the Coast Guard reports the quality of their preventative measures to
Congress in terms of “tombstone parameters.” These parameters include items such as deaths
and injuries to crew members and passengers, vessel groundings, and collisions (USCG, 2013).
These parameters, however, are not a good representation of what is done to prevent
accidents from occurring. The risk-reduction measures taken during inspection systems are not
accounted for when prevention data is reported, because there is currently no system for
objectively looking at how deficiencies were addressed during the inspection process.
Therefore, it would be useful to create a method for determining how effective inspection
systems are at preventing accidents in order to allow the inspection system to reach its full
potential.
2.2.1 Available Resources
At every stage of our project, we utilized a number of resources available in terms of
both internal Coast Guard research, as well as external research. These resources include
databases, data analysis tools, and past risk assessment models that gave us groundwork for
the creation of one model tailored to vessel inspections. This section provides information on
Prevention
Investigation Facilities Inspection Water Ways
Management Port Security
Advisory

14
the Marine Information for Safety and Law Enforcement (MISLE) database and existing risk
assessment models.
2.2.1.1 MISLE Database
Due to the wide range of responsibilities, the Coast Guard keeps extensive records of all
of its activities that go back for decades. The MISLE database is the main database used at the
Coast Guard (USCG, 2013). The database includes information on vessels, facilities, vessel
inspections, incidents, and parties involved, keeping detailed track of all activities within the
Coast Guard across all districts. This provides us with good records of deficiencies discovered
during inspections, and to which system of the vessel those deficiencies pertain. We can also
view the incidents that occurred each year, and access information on their financial,
environmental, and human impact.
Although MISLE contains a wealth of information, it tends to be organized on a case by
case basis. In order to compile large amounts of data for the purpose of analysis, the Coast
Guard uses a tool called Coast Guard Business Intelligence (CGBI) that provides spreadsheets of
records retrieved from the MISLE database. CGBI allows the user to filter the data by year,
vessel type, and many other criteria, which proved to be helpful in our analysis of vessel data
used in the creation of the risk assessment model.
From the CGBI and the MISLE database, inspection and accident data can be obtained,
which proved to be the most useful data sets for designing our prevention model. Inspection
reports contain information about types of systems, sub-systems, and component deficiencies.
The system is the overarching classification which funnels down into a sub-system and further
down, into a specific deficiency. For example, one system, “Communications,” has a sub-

15
system, “Alarms/Indicators,” which can indicate a deficiency of the “Fire Alarm.” Thus, an
inspector records these three categories of information when he or she finds a deficiency on a
vessel. Accident reports provide information on the initial event type of the accident, such as a
collision or fire, and the consequences of that accident, such as injuries or property damage.
While our final product did not end up using information from the accident reports, they could
be useful in the future to further enhance our model.
2.2.1.2 Models
Researching risk models can be useful in gaining a better understanding of how risk has
previously been calculated. By looking at the ways the Coast Guard, other agencies, and other
companies have already evaluated risk, a new model specific to risk-reduction due to
inspections was created. General risk models, including Failure Modes and Effects Analysis
(FMEA), risk indices, fault and event trees, and cost risk analysis, helped with identifying key
variables and suggesting best ways to look at data (IEC/ ISO 31010, 2009-11). Specific models,
such as the Maritime Security Risk Analysis Model (MSRAM) and the FMEA tool for the Institute
of Health Improvement aided in providing models that are already successfully in place. Each
model is explained in further depth in the following Methodology chapter. Conducting in depth
research on these models was essential to creating a risk model for the Coast Guard’s
prevention program.
2.2.2 Risk-Reduction Values
The Risk-Reduction Value (RRV) is a rating assigned to a vessel component based upon
the potential risk the component poses to the vessel, environment, and property upon failure

16
(J. Buck, personal communication, October 30, 2013). It can be used to represent the amount of
risk that the Coast Guard was able to prevent by finding a vessel deficiency. As our project goal
is to create a method that determines the amount of risk the Coast Guard reduces by
identifying and fixing issues on a vessel, the output of the method is a risk-reduction value. The
Coast Guard can then use this method to help evaluate the overall performance of their
inspection program.
2.3 Summary
The maritime vessel industry is highly regulated because of the risks involved in
traveling by water. These risks include potential human error, as well as equipment failure and
environmental risk. To ensure that the regulations are met, inspection systems are typically put
in place. Towing vessels are currently not formally inspected, which allows some vessel
companies to get by without meeting the regulations for towing vessels (S. Jason, personal
communication, October 2, 2013). Since towing vessels are essential vessels operating in ports
and harbors and potentially towing oil or hazardous material, the Coast Guard seeks to make
inspections mandatory for these vessels to ensure the regulations are being upheld by each
towing vessel company.
Currently, there is no method available for understanding how beneficial an inspection
system is towards preventing accidents from occurring (USCG, 2013). Data is given to Congress
in “tombstone parameters;” however, this does not give an accurate portrayal on what has
either been done or neglected in trying to prevent vessel incidents. The Coast Guard has

17
multiple sources of useful information that help create a system to determine inspection
effectiveness.
Since the inspection system for towing vessels is currently being phased in and will be
fully implemented in 2015, there is a nice spectrum of data available on towing vessels. Using
this range of data and a methodology for determining deficiency values, towing vessels are a
useful example in providing information on where the inspection systems were effective in
preventing accidents from occurring and where improvements can be made.

18
Chapter 3: Methodology
Although the Coast Guard is currently instituting a new inspection program for towing
vessels that, in theory, should help prevent accidents and all the costs and casualties associated
with them, the program’s effectiveness has no way of being tested. In order to quantitatively
measure the program’s performance, the USCG plans to phase in a risk-reduction rating system
that would gauge the effectiveness of preventative measures based on the information about
deficiencies found during inspections for all vessel types. The goal of our project is to develop a
methodology for systematically acquiring risk-reduction values for various vessel deficiencies
that could be utilized in this USCG model. The following sections explain the approaches and
steps we took to accomplish this task.
3.1 Research of Past Performance-Measuring Models
In order to understand how risk-performance measures work, we extensively
researched relevant studies and past successful models that had been applied to similar
situations. This research allowed us to determine which variables and components of data
analysis are most relevant to our project. Additionally, our model gains more credibility for
being based on existing, trusted models. This research is presented in the following sections.
3.1.1 Risk Indices Analysis
A risk index is a quantitative measure of risk that is used as the basis for many risk
management programs (USCG, 2013). Most commonly, this index is defined as a product of
consequence and probability. The consequence may be measured in a number of ways,

19
including a scaled value representing severity or scope of impact, or the direct and indirect
monetary costs of the events. In a comprehensive risk index, this could include positive and
negative values, potentially resulting in net positive or net negative outcomes. The probability
values can either involve strict probability values ranging from 0 to 1, or more abstract values
that could span any range. Any combination of these methods is valid, but each method
provides the results in a different format.
One of the existing models we looked at is the Coast Guard’s Maritime Security Risk
Assessment Model (MSRAM), which is used to assess the risk which various potential acts of
terrorism pose to ports and harbors around the country. MSRAM defines risk as a product of
consequence, vulnerability, and threat. The total consequence is the sum of the outcomes of
possible events. The product of vulnerability and threat provides a measure of probability and
represents a calculation of the likelihood of the events in question. The end result of the
MSRAM model is a risk index that represents the risk posed by any certain port or harbor.
3.1.2 Fault and Event Tree Analysis
Fault tree analysis (FTA) is used to identify the factors contributing to an accident (IEC/
ISO 31010, 2009-11). Fault trees are one method to funnel out causes of a specific deficiency or
problem that occurred on a vessel. Figure 3 shows an example of a fault tree, and it illustrates
the method used to analyze causational factors for an event. The event at the top of the
diagram is the final outcome, and each element linked below it is a cause that directly precedes
the element above it. Along the links between causal factors are symbols for logic gates,
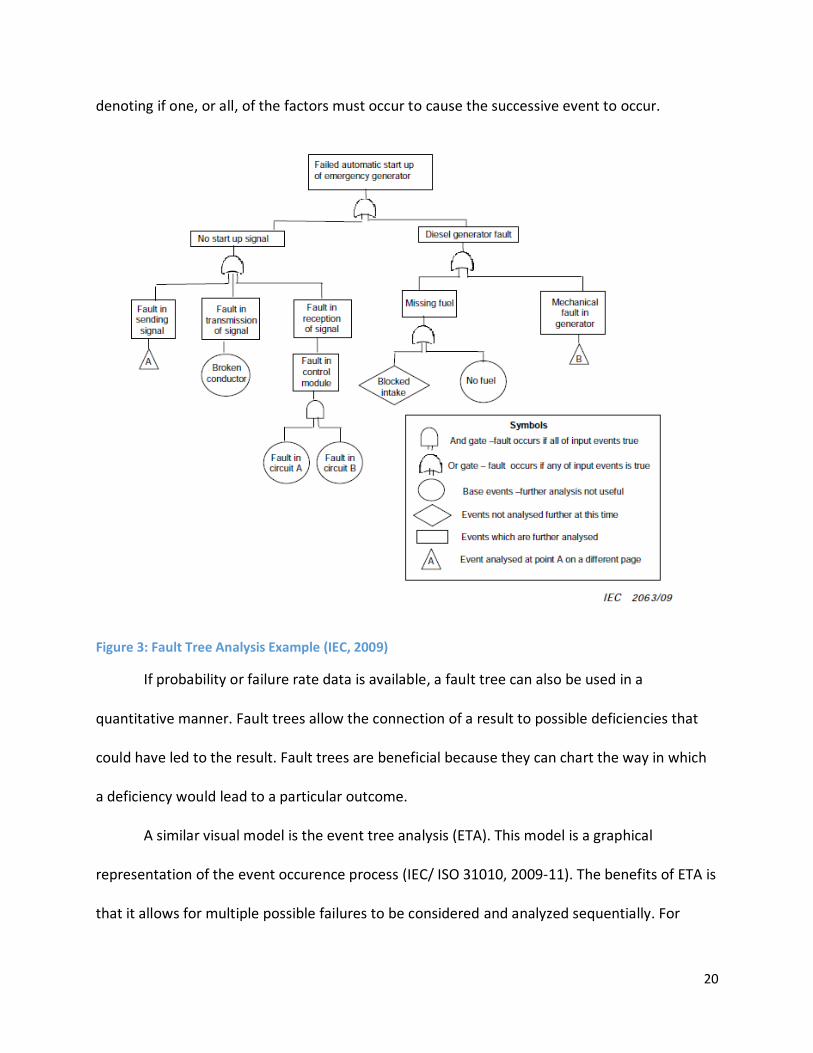
20
denoting if one, or all, of the factors must occur to cause the successive event to occur.
Figure 3: Fault Tree Analysis Example (IEC, 2009)
If probability or failure rate data is available, a fault tree can also be used in a
quantitative manner. Fault trees allow the connection of a result to possible deficiencies that
could have led to the result. Fault trees are beneficial because they can chart the way in which
a deficiency would lead to a particular outcome.
A similar visual model is the event tree analysis (ETA). This model is a graphical
representation of the event occurence process (IEC/ ISO 31010, 2009-11). The benefits of ETA is
that it allows for multiple possible failures to be considered and analyzed sequentially. For

21
example, as demonstrated in the diagram above, the failures in the overall system can be
traced to multi-cause failures of smaller subsystems and components. Figure 4 shows how this
method can be used to determine the cause of an event, in this case the failure of an
emergency generator to start, and also how probabilities can be associated with the method as
the basis for a quantitative analysis. On the left is the first event of the sequence, and each
branch to the right represents a binary option where a subsequent event either does or does
not happen, including the functioning of safety systems in place. The second-rightmost column
is the outcome based on the series of events. Along the branches there are numbers which
represent the probability of each option. By multiplying the probabilities of successive events,
the overall probability of an outcome can be determined and, based on the frequency of the
initiating event, the expected frequency of that outcome has been calculated in the rightmost
column.
For example, there are 10-2 explosions per year, on average, shown at the left. These
explosions have a chance of 0.8 to start a fire. If the fire starts, one would follow the branch up.
Then, there is the sprinkler system, which has a 0.99 chance to work correctly. If it does, follow
the branch up again. After that is a check for wether the “Fire Alarm” is activated, which has a
0.999 chance to occur correctly. Following that branch up leads to the outcome, “Controlled
fire with alarm.” The frequency given, 7.9 × 10⁻³ occurances per year, is the product of 10-2, 0.8,
0.99, and 0.999.

22
Figure 4: Event Tree Analysis Example (IEC, 2009)
By combining both the fault tree analysis and the event tree analysis, a cause-
consequence analysis can be developed (IEC/ ISO 31010, 2009-11). This analysis technique gives
a more complete analysis by taking the failure logic from the FTA and allowing the diagram to
develop over time with the help of ETA analysis. Figure 5 shows an example diagram of how the
cause-consequence analysis can be used. In this diagram, the circles at the bottom represent
the base events from the FTA, which lead up through logic gates to several binary options, as

23
seen in the ETA. These binary options represent events that may also be influenced by other
fault trees, following which they either occur or not. All of these will again have probabilities
assigned to them, as may the base events of the fault trees. By combining these appropriately,
as in the ETA, probabilities for the final consequences are determined. Through this type of
step-by-step, multi-outcome analysis, a comprehensive understanding of a certain event can be
provided.
Figure 5: Cause - Consequence Analysis Example (IEC, 2009)

24
3.1.3 Failure Modes and Effects Analysis
The Failure Modes and Effects Analysis (FMEA) is a technique used to identify the ways a
system can fail. This method focuses on prevention by aligning all potential risks with their root
sources, allowing for a better approach to risk prevention. Numerically, FMEA assesses risk by
assigning a Risk Priority Number (RPN) to each failure, produced by multiplying Severity (S),
Occurrence (O), and Detection (D) rankings. These rankings are all based on a one to ten scale,
where a lower value corresponds to a lower risk factor. The scales for these three factors are
usually produced by teams of experts who subjectively assign values to various failures based
on their expertise.
While the FMEA tool allows for a comprehensive analysis of extremely complex systems
with multiple variables and risk factors, it has its disadvantages (Haq, Lipol, 2011). A major
concern involving the standard for assigning the S, O, and D values on a scale include the
cooperation and agreement of subject experts which can make the system implementation
cumbersome. Additionally, the validity of the ordinal, one to ten scale is questionable, because
the degree of severity may not always vary accordingly.
One application of the FMEA is through the Institute for Healthcare Improvement FMEA
tool (IHI, 2013). This institute developed a computer system that allows hospitals to calculate
their Risk Priority Number. The system allows for a hospital to input different scenarios and,
with each scenario, a number on a one to ten scale is assigned based on the likelihood of
adverse occurrence, the likelihood of detection and the severity of the issue. These three
values are then multiplied to obtain an RPN. Each scenario includes the failure mode, cause,
and effect in the system. As an example, a failure mode is input as the wrong diagnosis given to

25
the patient, the cause is given as an inaccurate exam by the provider, and the effects include
the assignments and orders of wrong tests, medications, and treatments. For this failure mode,
the occurrence number assigned was an eight, the detection number was a three, and the
severity was an eight. These numbers are then multiplied to get an RPN for this specific mode,
which in this case is 192. To get the overall RPN for all failure modes in a certain section of a
hospital, all of the individual risk priority numbers are summed for that section. Furthermore,
the entire hospital can be given an RPN value by summing all individual RPN values.
3.1.4 Cost Risk Analysis
Another possible model we looked at is a cost risk analysis. This model is a specific
incarnation of the risk index system in which a monetary value is assigned to all consequences
involved and a final monetary value represents the average expected net cost of an adverse
incident. When applied to our problem, the final net cost would represent how much money
the Coast Guard has saved by averting the action involved by having a preventative system in
place (Yoe, 2000). This will allow a casual observer to easily assess the performance of the
system as the final values are costs. This would provide a relatively simple and effective way for
the Coast Guard to present their performance to third parties not involved in the inspection
program.
3.2 Development of a Prototype
After the completion of our research into the different types of models available to us,
we selected the aspects of each that would be most relevant and useful to solving our problem.
The method that we chose to use for our main equations includes elements from risk indices

26
and FMEA. Our method is a result of careful consideration and examination of the models
researched.
3.2.1 Risk Indices Analysis
Risk Indices Analysis (RIA) is one of the models that heavily contributed to the
development of our own risk based analysis of performance measures. The formula that our
model shares with RIA is based upon the general formula of a risk index:
.
However, we adjusted our model to fit the data we were provided. We also chose to use
several scaled values to represent different elements of the consequence, rather than using a
monetary cost, as stated in 3.2.4. The scale values that we chose were based upon the
standards set by the AWO’s scale for injuries, property damage, and environmental damage.
We also chose to use some parts from the MSRAM model. We mainly used this as a
guideline and for ideas on how to choose possible consequence factors, such as environmental
impact, economic impact and injury mentioned earlier. However, because MSRAM is security
based rather than safety based, some factors used were not applicable to our model.
3.2.2 Fault and Event Tree Analysis
While fault and event trees are a useful method for thinking through the consequences
of an event, it did not apply to our purposes. Because of the large number of deficiencies, it
would have been cumbersome to create a tree for each deficiency. This would not have been
the best use of our time, nor would it have been feasible with the information provided to us.

27
While this model could provide a good visual for thinking through the risk of a deficiency, there
were more effective methods for us to focus on.
3.2.3 Failure Modes and Effects Analysis
Through our research and the analysis of the data available to us through the Coast
Guard databases, we decided that the FMEA would serve as a good basis for our risk
performance model. In fact, the FMEA appears to lie at the heart of most risk assessment
models, such as IHI and MSRAM.
As has been mentioned in earlier sections, the basis of FMEA is as follows:
In the case of towing vessel inspections, the “Severity” factor is based on the potential
consequences of a failure due to a given deficiency. Because the data currently available does
not draw direct lines between incidents and deficiencies, we had to systematically rate
deficiencies on several impact scales for potential consequences. Finally, “Detection” was
quantified by accessing inspection reports and statistically evaluating the frequency with which
a certain deficiency is found.
3.2.4 Cost Risk Analysis
When developing the RRV model, we chose not to use a cost risk analysis. There were
several factors that led to this choice, including difficulty in determining and justifying certain
monetary costs, as well as the maintenance the model would require over the years to ensure
the monetary values remained accurate (Yoe, 2000). When using a cost-based method, we
would have to determine an appropriate value of someone’s life or injury. While there are

28
standards for these values, we would still have to decide which to use and determine the scope
of these approximations. For example, the projected cost may encompass just the Coast
Guard’s expenses, or it may include the personal costs. Additionally, the assigned costs will also
need to be justified to multiple parties. When evaluating their performance, the Coast Guard
would need to have substantial proof that they are indeed saving this much money, and cost
estimates are not just based on arbitrary amounts or rough estimates. Additionally, the costs
and values of services and currency are constantly changing, which would require the model to
be constantly updated to reflect the current cost of services. While certain agencies, such as
insurance companies and law firms, maintain and update life value tables, these periodically
recurrent changes would, in turn, need to be reflected in our model. This complication could be
avoided by not using cost directly in our method.
3.3 Application of Vessel Data
In order to narrow the scope and ease data analysis, we initially limited our model
prototype to towing vessel inspections. This particular vessel type was selected due to the
circumstances surrounding the history of their regulations; after being previously uninspected,
a bridging program has been phased in over the course of the past few years, meant to prepare
for the final implementation of annual inspections in 2015. This provided us with a means of
comparison of recent data prior to and after the implementation of inspections, accomplishing
the task of measuring their effectiveness. After this initial data analysis, we saw that it was
essential to assign the RRVs based on a larger set of inspection data. To do this, we calculated
RRVs using the past five years of inspection data on all vessels. These set RRVs were then

29
applied to data for towing vessels. By doing this, we were able to more accurately calculate the
RRVs and portray the RRVs for towing vessels before and during the bridging program.
3.3.1 MISLE Database
MISLE is the primary database of the Coast Guard, containing records concerning all
aspects of marine activity (2013). This includes inspection information relevant to our project.
From the data available, we selected the FMEA model based on our research of past
performance measures as well as the needs and requirements of the model in question. The
FMEA model best incorporates the data from MISLE to obtain RRVs. While aspects from other
models were used in this data analysis, FMEA was the core model around which we centralized
our data analysis.
3.3.2 USCG CGBI
While the MISLE database acts as the primary database for the USCG (2013) and
contains all of its marine information, systematically retrieving information can be difficult.
Therefore, the CGBI program was used to access and download large, and filterable
spreadsheets of data from multiple years. Initially, this tool allowed us to determine what data
is available through the Coast Guard databases and can be utilized for our model. The CGBI
then allowed us to filter data depending on certain criteria, such as vessel type and deficiency
type, and became useful for obtaining the data necessary to test our prototype.

30
3.4 Testing of the Final Product
Once we developed the RRV model, we needed to ensure that it was working
appropriately. To do so, we once again used data from the MISLE database and CGBI program.
We initially looked at towing vessel data from the past five years. Specifically, the inspection
reports were utilized for the purpose of measuring frequency of detection of deficiencies used
in our model. We then assigned test values to different deficiencies and input the values into
our model. By repeating this process for several different types and severities of deficiencies,
we were able to estimate the range of values our model can produce, as well as judge whether
the values produced were reasonable. For example, the risk-reduction value of a light in the
crew quarters not working should not be higher than that of the electrical system
malfunctioning. Finally, we applied the scale of 1-100 to the RRVs across all systems, where a
100 corresponded to the highest RRV produced.
Due to the time constraints, we only ran enough tests to ensure that the RRV model was
on the right path. The model passed those tests, so we went on to present it to the Coast
Guard, where subject matter experts will perform the bulk of the testing and fine tuning to
make the model fully functional. These tasks will include, but will not be limited to, collecting
more data and adjusting the scaling to fit the needs of the Coast Guard.

31
Chapter 4: Results and Analysis
4.1 Risk-Reduction Model
As stated in previous sections, the main objective of our project is to quantify the risk-
reduced by deficiencies found during marine vessel inspection. To do so, the model assumes a
vessel is a sum of systems examined during an inspection. The model uses the framework
inherent in the USCG MISLE Database. MISLE includes three levels for vessels systems, the
highest level is a system, then sub-systems, and the sub-systems are further broken down into
components. Figure 6 displays the branching within MISLE.
Figure 6: System Breakdown from USCG MISLE database
For example, the system “Communications” includes “Alarms/Indicators” as a sub-
system. Each sub-system includes relevant components; for example, “Alarms/Indicators”
contains items such as a “General Alarm” and “Fire Alarm,” as illustrated in Figure 7.
System
Sub-System
Component
Component
Sub-system Component

32
Sub-system Severity
Component Severity
Component Frequency RRV
Figure 7: Example System
The lowest branch, components, connects to the deficiency found during inspections.
Therefore, the U.S. Coast Guard’s leaders may measure marine inspection performance in risk
reduction values by summing deficiencies found during inspections.
In order to quantify the value of risk reduced, the proposed model assigns a Risk-
Reduction Value (RRV) to each deficiency. However, in order to provide an accurate measure of
performance, these values need to be assigned systematically throughout all systems. Relying
on the research of past risk-based performance measures and keeping in mind data available to
us, we based risk-reduction values on their severity and frequency, as show below in Figure 8:
The model assigns severity and frequency factors to the MISLE components, but only
addresses severity for the sub-systems.
Where:
Communications Alarms/
Indicators
General Alarm
Fire Alarm
Figure 8: RRV Equation

33
√
The sub-systems were chosen over the larger systems for a more comprehensive
analysis because they are more specific. The process and basis for calculating these are
explained in the sections below.
4.1.1 Assigning Severity
The severity of sub-system failure is measured in terms of potential consequences of
this failure. Three factors were used in the evaluation of severity: human casualty,
environmental impact and property damage. A group of vessel inspection subject matter
experts rated each sub-system concerning these factors.
Table 1: Sub-system Environmental Impact Severity Scale
No Impact 0
Minor, Small Scale Impact (<10 gal oil spilled in water) 1
2
Moderate Impact (100 – 500 gal oil spilled in water) 3
4
Severe, Large Scale Impact (>1000 gal oil spilled in water) 5
The model measures the factors on a 0-5 scale, with a lower value corresponding to a
lower impact. However, because the RRV is a product of three numbers, a default value of one
has to be assigned to at least one factor in order to prevent any one RRV from becoming
reduced to a zero. Human casualty ranges from minor/no injury, up to multiple deaths;
environmental impact is represented through gallons of oil spilled, ranging from zero to over

34
1,000 gallons; finally, property damage in dollars spans from $0-$50,000, to over $250,000 at
the highest end of the scale. Table 1 provides a visual of the environmental impact severity
scale. Refer to Appendix E for all of the visual representations of severity scales.
Assigning severity to each sub-system demonstrates a difference between a sub-system
of lesser value and a smaller impact, and one with higher importance in the event of failure.
Therefore, the severity value has the potential to boost or dampen the value of any
components within a given sub-system. It is essential to have multiple SMEs rate each system’s
components using these scales in order to obtain less subjective values.
4.1.2 Component Frequency Calculations
Every sub-system contains a number of components or potential deficiencies; these are
approached similarly to the sub-systems in terms of severity, with the addition of frequency
calculations. However, there are some differences in the specifics of the scales and calculations.
This section will focus on frequency, which is calculated as follows and illustrated visually in
Figure 9:
√(
)

35
Figure 9: Frequency Equation Components
The figure above summarizes the components in the equation. The model divides the
number of times a specific component was deficient during inspections, by the total number of
deficiencies in a given time period. This function allows deficiencies across all sub-systems to be
compared to one another. This results in more weight given to deficiencies with a higher
probability of failure due to frequent discovery, since that is indicative of more deficiencies of
the same type that need to be discovered. The model applies a square root to the frequency to
dampen its effect on the final RRV and give higher priority to a component’s severity rating.
Finally, the value of one is a default value to deficiencies that are never discovered and
consequently, lack frequency data, to ensure the RRV is never equal to zero.
4.1.3 Component: Assigning Severity
One of the three numbers comprising the RRV, component severity, was set to be
measured in terms of its impact on its corresponding sub-system, or the likelihood of the failure
any one component to affect a failure in the larger sub-system. The scale of one to ten was
• Scales values against increasing number of inspections
Proportion of Deficiencies Detected to Total Deficiencies Detected
• Increases the relevance of smaller frequencies Multiplying by 100
• Ensures every component will have minimum RRV of 1, even if the number of detections are 0
Adding 1
• Reduces the impact of higher frequencies to avoid overpowering limited severity values
Square Root

36
applied to this factor to allow flexibility and variation for subject matter experts during the
rating process. The range of one to ten is essential toward ascertaining an accurate measure.
The model averages the responses from subject matter experts to obtain a final severity value
for each component. The component severity scale is provided in Table 2. On this scale, a lower
value implies a lower impact. Refer to Appendix E for more details on severity scales.
Table 2: Component Severity Scale
No Likely Impact 1
2
3
4
Moderate Impact 5
6
7
8
9
High Impact 10
4.1.4 Relating Sub-system and Component
Once the individual frequencies and severities are calculated for the components and
the overall severities assigned for the sub-systems, they are combined through multiplication to
produce a risk-reduction value for a specific component:
A higher RRV indicates a higher risk associated with the failure of a certain component;
therefore, a closer inspection of these components is encouraged to reduce the elevated risk.
Through the assignment of RRVs to all deficiencies that may be issued (within MISLE), the USCG

37
may measure the amount of RRV produced from vessel inspection. The RRV provides a conduit
toward an overall performance measure for Coast Guard inspectors by quantifying the amount
of risk they have reduced. Additionally, RRVs can be summed for an entire year range to
compare the risk reduced through inspections annually. This allows the Coast Guard to
compare their inspection performance across years, which is especially important in looking at
before and after the towing vessel bridging program.
4.2 Test Case Calculation
To gain a better understanding of the process used, an example calculation for risk-
reduction values will be explained in this section. This test calculation will show how risk-
reduction values were calculated for the “General Alarm” component in the sub-system
“Alarms/Indicators.” While our initial calculations were done using towing vessel data for the
past five years, it is best to set the RRVs using a larger data set, as mentioned in previous
sections. Thus, our example calculations used the past five years of all vessel data to determine
the RRVs. The general equations and severity scales previously explained in section 4.1 can also
be referenced in Appendix E. This section serves to give a more specific example of how our
model assigns a risk reduction value to a given vessel component.
4.2.1 Sub-system Severity
The severity of “Alarms/Indicators” failing was rated on the human impact,
environmental impact, and property damage scales. Subject matter experts rated the impact
that “Alarms/Indicators” could potentially have on these three categories in the event of an
accident based on a zero to five scale, where zero has no impact and five has the most impact.

38
Five subject matter experts assigned values for “Alarms/Indicators.” Their ratings were
averaged for the following results:
Table 3 “Alarms/Indicators” Sub-system Impact Rating
Human Casualty Environmental Impact Property Damage
4.60 4.40 4.60
These individual severity values are then added to calculate the total severity value for the sub-
system as follows:
4.2.2 Component Severity
The severity value for the impact “General Alarm” has on the sub-system
“Alarms/Indicators,” failing was rated on a one to ten scale by subject matter experts. The
severity value for “General Alarm” was rated by five SMEs and, after averaging their responses,
was determined to be 9.6.
4.2.3 Component Frequency
For each component, the frequency is calculated in terms of the total number of
deficiencies detected. Deficiencies were detected for “General Alarm” 344 times in a five year
period. This is then divided by the total number of deficiencies, 188,259, and multiplied by 100
to get the percentage of how often “General Alarm” deficiencies are detected out of all
deficiencies. A base number of one is added to this frequency value to take into account those
deficiencies not yet found. This ensures an RRV is not zero. Lastly, the square root of the
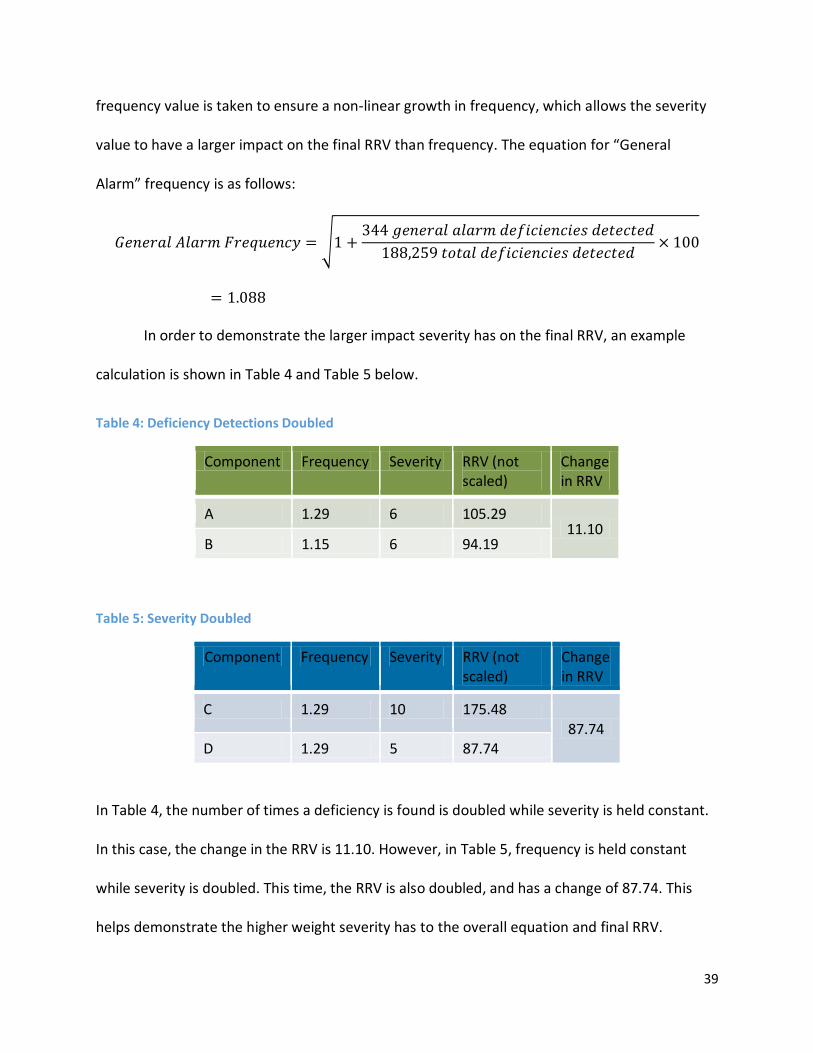
39
frequency value is taken to ensure a non-linear growth in frequency, which allows the severity
value to have a larger impact on the final RRV than frequency. The equation for “General
Alarm” frequency is as follows:
√
In order to demonstrate the larger impact severity has on the final RRV, an example
calculation is shown in Table 4 and Table 5 below.
Table 4: Deficiency Detections Doubled
Component Frequency Severity RRV (not scaled)
Change in RRV
A 1.29 6 105.29 11.10
B 1.15 6 94.19
Table 5: Severity Doubled
Component Frequency Severity RRV (not scaled)
Change in RRV
C 1.29 10 175.48 87.74
D 1.29 5 87.74
In Table 4, the number of times a deficiency is found is doubled while severity is held constant.
In this case, the change in the RRV is 11.10. However, in Table 5, frequency is held constant
while severity is doubled. This time, the RRV is also doubled, and has a change of 87.74. This
helps demonstrate the higher weight severity has to the overall equation and final RRV.

40
4.2.3 RRV Calculation
A risk-reduction value can now be calculated for each component by multiplying the
sub-system severity value, the component severity value, and the component frequency value
as follows:
The “General Alarm” RRV above is not normalized on a 1-100 scale. Once all RRVs are
calculated, the values are divided by the highest RRV. From our initial calculations with limited
severities scaled by SMEs, the “General Alarm” would scale to 81.28.
Table 6 below shows the RRVs for additional components within “Alarms/Indicators.”
This table serves to help compare components among each other.
Table 6: RRVs for “Alarms/Indicators”
Sub-system Severity Frequency RRV Scaled RRV (1-100)
Alarms/Indicators 13.6
Component
Abandon Ship Alarm 8.4 1.000531 114.30 65.43
Autopilot Alarm 4.6 1.000266 62.58 35.82
Ballast Alarm 7.6 1.001327 103.50 59.25
Bilge Alarm 9.2 1.281691 160.37 91.81
Collision Alarm 6.8 1.001327 92.60 53.01
Engine RPM Gauge/Indicator 5.8 1.066074 84.09 48.14
Engineers' Assistance-needed Alarm 8.6 1.016856 118.93 68.09
Fire Alarm 9.6 1.051778 137.32 78.61
General Alarm 9.6 1.087533 141.99 81.28
High Water Alarm 9.2 1.083618 135.58 77.62
In this table, it is evident that “Bilge Alarm” has the highest RRV, while “Autopilot Alarm” has a
lower RRV. As demonstrated, our method allows for easy comparison among components’
RRVs, even further simplified by the values being presented on a 1-100 scale.

41
Figure 10 below also aids in demonstrating the range of RRVs obtained throughout using
our model.
Figure 10: RRVs within Communications
This graph shows a few examples of scaled risk-reduction values. “EPIRB” has the highest RRV,
scaling to a 100 with all other components normalized based on “EPIRB.” “Bilge Alarm” also has
a high RRV, “Load Line Mark” and “Security Drill” have medium RRVs, and “TWIC Escorting,”
“VGP,” and “Certificate of Number” have low RRVs. Thus, our model produces a range of RRVs
on the 1 – 100 scale.
4.2.5 Streamlining the Process
Initially, Microsoft Excel was used to help us develop and understand the calculation
process. However, using Excel to calculate the RRVs for each deficiency is a lengthy process, and
involves manually creating an entry for each different component, as well as ensuring that the
0
20
40
60
80
100
EPIRB BilgeAlarm
Load LineMark
SecurityDrill
TWICEscorting
Certificateof Number
Scal
ed R
RV
Component
RRV Comparison

42
complicated formulas copied over correctly. With approximately 223 sub-systems and 3,000
deficiencies, a computer model was created by our team to simplify the process, streamline the
calculations from sections 4.2.1, 4.2.2, and 4.2.3, and make them less reliant on user action.
This model automatically pulls all of the different components from a database and calculates
their RRVs. The user then needs to simply enter the severity values for each sub-system and
component in order to calculate the RRV. The program also outputs the RRVs back to the
database in a convenient form for future use by other applications. Refer to Appendix G and H
for a user and developer guide containing more detailed information on this program.
4.3 Application of the RRV Model
The numerical assignment of risk to all deficiencies discovered during inspections opens
up a variety of opportunities for its use. The RRVs can be added up for any one vessel, a
geographical area, or a time period, and then compared using these criteria. The following
sections discuss several examples of potential applications of the RRV model.
4.3.1 Setting the RRVs
Apart from the severity values assigned to sub-systems and deficiencies that are
dependent upon subject matter experts’ ratings, the RRVs incorporate frequency of detection,
which fluctuates from year to year. For that reason, it is important to use a large sample of data
when permanently assigning the RRVs. From our calculations, we found five years of all vessel
data to be a sufficient representation of the detection frequencies; specifically, the time range
between 2009 and 2013 was used. The RRVs were then normalized to a relative 1-100 scale,
with the maximum value of 100 assigned to the highest deficiency value calculated.
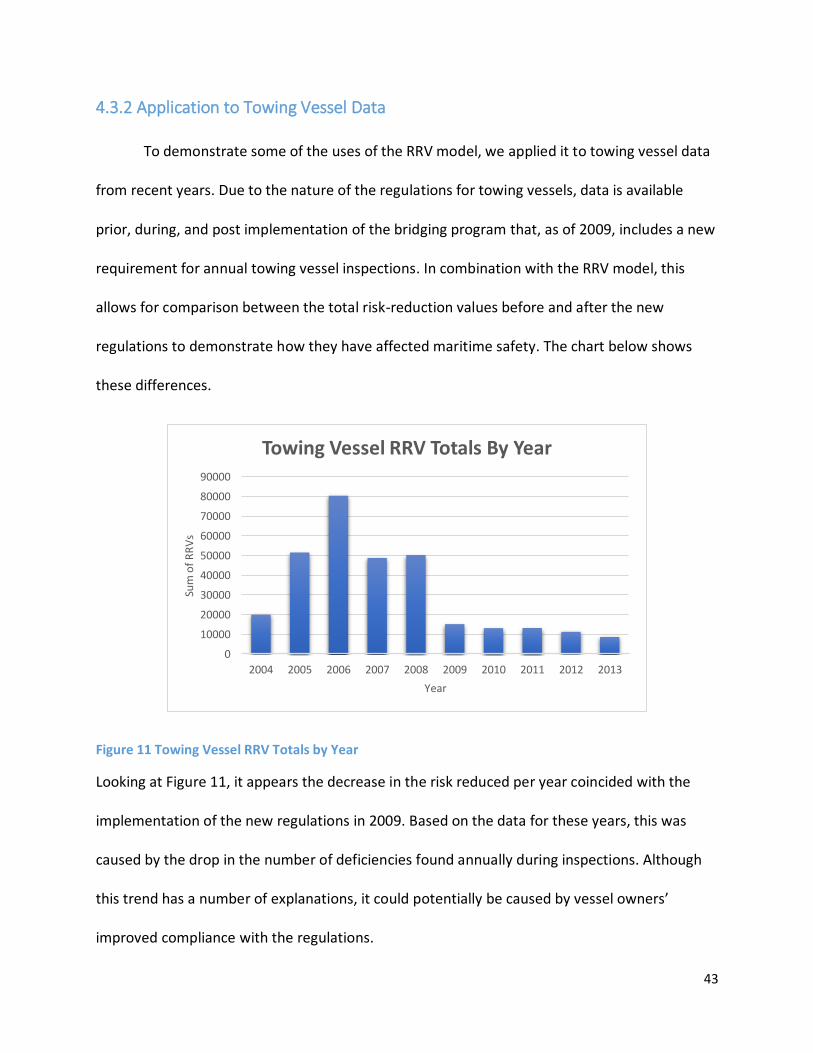
43
4.3.2 Application to Towing Vessel Data
To demonstrate some of the uses of the RRV model, we applied it to towing vessel data
from recent years. Due to the nature of the regulations for towing vessels, data is available
prior, during, and post implementation of the bridging program that, as of 2009, includes a new
requirement for annual towing vessel inspections. In combination with the RRV model, this
allows for comparison between the total risk-reduction values before and after the new
regulations to demonstrate how they have affected maritime safety. The chart below shows
these differences.
Figure 11 Towing Vessel RRV Totals by Year
Looking at Figure 11, it appears the decrease in the risk reduced per year coincided with the
implementation of the new regulations in 2009. Based on the data for these years, this was
caused by the drop in the number of deficiencies found annually during inspections. Although
this trend has a number of explanations, it could potentially be caused by vessel owners’
improved compliance with the regulations.
0
10000
20000
30000
40000
50000
60000
70000
80000
90000
2004 2005 2006 2007 2008 2009 2010 2011 2012 2013
Sum
of
RR
Vs
Year
Towing Vessel RRV Totals By Year

44
Another capability of the model lies in its use for calculating the average RRV per
inspection each year. This can allow the Coast Guard to track trends in how much risk was
reduced per vessel and correlate it with the number and extent of vessel inspections completed
each year. For example, Figure 13 below utilizes the data from Figure 12, where the total risk
reduced is divided by the number of inspections made in each corresponding year:
Figure 12: Number of Towing Inspections: 2009-2013
0
500
1,000
1,500
2,000
2,500
3,000
3,500
4,000
4,500
5,000
2006 2007 2008 2009 2010 2011 2012 2013
Nju
mb
er o
f In
spec
tio
ns
Year
Towing Vessel Inspections by Year

45
Figure 13: RRV per Inspection for Towing Vessels
Despite the large number of inspections performed in 2006, the risk reduced per inspection
proved to be relatively low. This correlation may indicate that the inspections done by the
Coast Guard in 2006 were not focused on in-depth examinations of all vessels, but rather,
looked only at specific systems or aimed to meet a certain goal for the number of inspections
for the given year. Combined with other tools and data, this type of analysis can provide insight
into Coast Guard performance, allow its inspectors to better allocate their time and resources,
and potentially improve the quality of inspections.
4.3.3 Identifying the Most Important Deficiencies
Currently, the Coast Guard annually reports the top ten most frequent deficiencies
discovered on vessels, but solely bases their importance on their frequency of detection (J.
Buck, personal communication, December 1, 2013). However, the RRV model can now allow
one to gauge the value of each deficiency based on its RRV. For example, the following table
0.0
5.0
10.0
15.0
20.0
25.0
30.0
35.0
40.0
2006 2007 2008 2009 2010 2011 2012 2013
RRV per Inspection for Towing Vessels

46
provides a side-by-side comparison of two “top ten” lists of deficiencies based on these two
criteria:
Table 7: Top 10 Deficiencies: 2009 - 2013
Top 10 Deficiencies: 2009 – 2013
By Occurrence By RRV
1. Certificate of Inspection 1. Navigation Lights
2. Oily Water Separator 2. Oily Water Separator
3. Abandon Ship Drill 3. EPIRB
4. Recovery of Survival Craft Drill/Instruction 4. Hull Plating
5. Navigation Lights 5. Fire Extinguishing System Servicing
6. Electric Generator Servicing 6. Abandon Ship Drills/Instructions
7. Bilge Water Pump 7. Electrical Generator Servicing
8. CO2 Fire Extinguishing Servicing 8. Watertight Integrity
9. Not Operational Bilge Water System 9. Recovery of Survival Craft Drills/Instructions
10. Lifebuoys Serviceability 10. Fire Doors
While there are some similarities between the components and their relative standing
in the two lists, this comparison shows some important differences. Because the second
column incorporates total RRV for the given year range on top of the frequency of detection,
the list generated using the RRV model contains deficiencies that have comparatively larger
importance. For example, the most frequent deficiency, seen in the first column, is “Certificate
of Inspection,” a document that poses little risk with its absence. However, the top component
in the second column, “Navigation Lights,” could have a much larger impact if found deficient.
The inspectors can utilize this information by focusing their attention on not only frequent, but
potentially most impactful components of the vessel. Finally, this new deficiency classification
B Y R R V
1. Navigation Lights 2. Oily Water Separator 3. EPIRB 4. Hull Plating 5. Fire Extinguishing System Servicing 6. Abandon Ship Drills/Instructions 7. Electrical Generator Servicing 8. Watertight Integrity 9. Recovery of Survival Craft Drills/Instructions 10. Fire Doors

47
created with the help of the RRV model can improve the way Coast Guard assesses and reports
risk-reduction and deficiency importance.
4.4 RRV’s Potential Link to the Accident Data
Originally, we wanted to link component deficiencies to accident data for a
consequence factor in our model. However, after talking to the Investigations Program Office
(CG-INV), we determined that this is currently not feasible because MISLE does not directly link
inspection and incident reports. In the future, we feel that this link could be beneficial, so the
following section serves to explain how we would have calculated a value using incident reports
to include in the RRV model.
The Accident Value Model focuses on ascertaining risk posed by certain accidents by
evaluating past data regarding the frequency and consequences of each accident type.
Frequency is universally measured in incidents per year. The consequences of the accidents are
divided into three types: human, economic, and environmental. Each of these is further divided
into rankings of severity which are based on an existing model created and utilized by the AWO
(2013).
In the current model, data is pulled from spreadsheets produced by CGBI and filtered by
Excel functions. The accident data is not pre-filtered according to vessel type, so all functions
which pull data from the accident spreadsheet include a provision to compare the list against a
list of towing vessels. Data on the total number of accidents is gathered, as well as figures for
property damage, environmental damage, and human losses. Cells for each of these figures
contain functions which filter the data according to type of accident, or collect the data from all

48
types of accidents. All values pulled are displayed together on a separate sheet from the raw
data, allowing the raw data sheets to be easily replaced with new or differently filtered data.
Most of the calculations are done by referencing the values already collected from the
raw data sheets. This allows the calculation functions to be smaller and simpler. The
calculations take the quantity and average data through similar processes for each subset.
Frequencies are calculated by dividing the quantity by the number of years the data represent.
These frequencies are then multiplied by a weight value, and then averaged per incident to
provide an average resultant value. These values are then combined across the three subsets,
generating the final Accident Value. Specifics regarding each subset will be discussed in the
following sections, and equations showing steps in this process can be found in Appendix F. It is
important to note that these calculations did not go into our final RRV model; however, we
believe this could prove useful in future development.
4.4.1 Human Casualties
Human casualties are divided by the Coast Guard into four primary types: “at risk,”
“injured,” “missing,” and “dead” (MISLE, USCG, 2013). In order to emphasize the importance of
human life, we assigned an exponential weighting system for these. This results in “at risk”
being weighted at one, “injured” at ten, “missing” at 100, and “dead” at 1000. Because of this,
even if deaths are infrequent, the severity of their potential is enough to influence the overall
value. The average of the weighted values is currently unaltered before being summed with the
other subset values, but the model includes the option to increase or decrease the weight of
human casualties in order to fine tune the system in accordance with the Coast Guard’s
priorities.

49
4.4.2 Economic Cost
Economic costs are broken down according to the scale produced by the AWO into
three ranges: <$50,000; $50,000 - $250,000; and >$250,000 (AWO, 2013). A frequency and
average cost is calculated for each of these ranges and used for the calculations. The weight for
each range is calculated as the number of incidents per year in that range divided by the total
number of incidents per year. This weighting system ensures that more common but lower
value incidents are not inherently outweighed by high-cost, infrequent incidents. The average
cost for each range is multiplied by the respective weight, and then averaged. This average is
compared to the original scale, and a number is assigned as the environmental factor based on
the scale. If the average of the weighted values is less than $50,000 the factor is a one, between
$50,000 and $250,000, the factor is a two, and over $250,000, the factor is a three. This value is
added directly to the other subset values to provide the overall Accident Value, but could be
weighted higher or lower in accordance with the Coast Guard’s priorities.
4.4.3 Environmental Impact
Environmental impact is measured by the Coast Guard in terms of gallons of oil spilled.
In the model, the severity is based again on the AWO scale, this time with ranges of less than
ten gallons, 10 – 1000 gallons, and greater than 1000 gallons. The process for calculating the
environmental impact subset value is nearly identical to that of economic cost, except that it
uses this other scale to divide and compare the values to, with less than ten gallons
representing a one, 10 – 1000 gallons as a two, and over 1000 gallons is a three. This value can

50
also be weighted, but is currently added directly to the previous two in order to produce the
total Accident Value.

51
Chapter 5: Conclusions and Recommendations
After eight weeks of researching, designing, and testing our model for calculating risk-
reduction, we have drawn conclusions about how our model should operate and the larger
impact it can have. This section also serves to explain recommendations for improvements that
could be beneficial to the Coast Guard’s ongoing risk assessment mission.
5.1 Conclusions
Through the use of our model, RRVs are calculated in a standardized manner. With
careful research, we have created a model using previously developed methods and related
them specifically to the purpose of marine inspection. Our automated program is designed to
calculate and set all RRVs for USCG MISLE deficiencies, which can then be applied to calculate
the risk-reduced on specific vessels, such as towing vessels. The RRV is supported by five years
of deficiency data from USCG business intelligence. Additionally, our model is sustainable and
has the potential for application to other types of vessels or USCG Prevention missions in the
future. In summary, the model has the following positive aspects:
Based on previously developed risk models
Allows for easy comparison across values of different systems
Includes large sample size to account for deficiency frequency in order to set the RRVs
Can be applied to obtain the risk-reduced for towing vessels
Subjective values are produced by experts
Has potential for application within multiple USCG Prevention missions (e.g., any
inspection focused mission).

52
While we would ideally like to include the AV within the RRV model, we believe that
doing so is not currently feasible. After speaking with the Investigations Program Office (CG-
INV) at USCG HQ, it was decided that accidents and deficiencies cannot be directly connected to
the RRV due to a lack of supporting data. Additionally, accidents rarely directly correlated with
component failures, and instead are often caused by human error. While there is a possible
connection between deficiencies and accidents that could potentially be beneficial in the
future, it would be detrimental to our model to include them in our final product at this time.
The calculated RRVs will then be applied to a larger program that will determine the
overall performance of inspections. This overall performance will include the accomplishment
of inspections along with the cost of doing an inspection. Thus, having a standardized system to
measure the risk-reduced due to an inspection aids in calculating the overall performance of
inspections.
5.1.1 Application of the RRV Model to Towing Vessel Data
Because towing vessels were previously uninspected, three sets of inspection data will
soon exist for this type of vessel. Those will include deficiencies found prior to regular
inspections, during the bridging program, which came into effect in 2009, and eventually, post-
implementation of the new regulations. The RRV model can then be used to calculate risk
reduced during each time period, and allow the Coast Guard to determine the value of the
changes made to towing vessel regulations. This can be accomplished by adding up all the risk-
reduction values for any given time period and comparing with the sum of the values for

53
another time period. Finally, the RRV model can also demonstrate trends in deficiency
severities and frequencies prior and post the implementation of these new regulations, as seen
in Figure 11 from the Results chapter.
5.2 Recommendations
During the process of developing the RRV model, we realized that several aspects could
be improved upon, but doing so was out of the scope of our project. While these are not
necessary to use with our model, we recommend that they be taken into consideration in
potential future iterations. These could not only improve the usability of our model, but also
other applications of our model and other projects. These recommendations for improvement
are outlined below.
5.2.1 Improve Data Quality
While there is a wealth of data in the MISLE database that could potentially be useful, a
lot of it cannot be utilized for our immediate purposes due to the way the database is
organized. For example, some fields that should be numeric are stored as text values instead of
as numerical values, making it necessary to convert these values before performing any
operations. Along with type mismatch, a lot of fields that could easily be represented by a set of
predefined, scaled values, such as accident causes, are simply entered as text values. This
creates potential for a lot of human error associated with spelling of the accident types, which
could interfere with sorting the data later on and unnecessarily complicate numerical data
analysis. Trying to analyze data that is not entered in a uniform format requires extensive, and
perhaps excessive, human input and interpretation. Such issues could be resolved by using

54
numerical coding, and, where possible, scaled data fields instead of text fields. Use of
predefined quantifiable entries for fields such as accident category would greatly improve the
usability of that data in terms of quantifiable analysis.
5.2.2 Link between Accidents and Deficiencies
When we first envisioned our model, we wanted to base the severity of a deficiency on
the types of accidents that it could cause. However this was not possible because there are no
direct links between deficiencies found during inspections and causes of accidents. While we
understand that not all accidents are caused by deficiencies and it is difficult to determine if a
deficiency did actually cause an accident to occur, a potential link between an incident and
deficiencies noted in the most recent vessel inspection would add a more quantitative
consequence to the model. However, this link would have to be discussed and confirmed with
the subject matter experts on incident investigation before making recommendations and
implementing this strategy into our overall method.
5.2.3 Verifying Consequence Scale
When creating the consequence scale for the failure of any given system, we decided to
base the scale on the AWO’s scale for gauging the severity of impact of each factor when an
incident occurs. These factors include human injury/death, environmental impact, and cost of
damages. While we believe that the AWO scale was a good basis for this purpose, we are
unsure about how well it aligns to the Coast Guard’s internal measures of accident severity. We
recommend an assessment be undertaken of the extent to which the two align with one
another. Additionally, the weight of each severity factor within the model can be adjusted in

55
accordance with Coast Guard’s goals. For example, while human, environmental and financial
impact components are currently weighed equally on a 0-5 scale, the human injury and death
factor may be adjusted to carry more weight than the other two factors to produce more
accurate RRVs.
5.2.4 Component Scale Clarifications
After we sent out the deficiency lists to several subject matter experts, we often found
their ratings largely inconsistent. While we understand that some inconsistency is inevitable,
we expected a smaller standard deviation among different SMEs. This may be due to the
differences between the deficiencies on inspection sheets from those in the MISLE.
Additionally, we received some feedback concerning creating description for some
components, as some tend to be unclear. We believe this might aid in decreasing the standard
deviation and creating more accurate RRVs. Finally, we also recommend that a large amount of
SMEs to rate the components using our scales for more accurate and less subjective severity
values.

56
References
American Waterways Operators. (2013). Retrieved from http://www.americanwaterways.com/
Davis, M. E. (2010). Negative effects of external support during inspection and survey
inspections on board U.S. Navy, military sealift command and U.S. Coast Guard vessels.
Fort Leavenworth, KS : U.S. Army Command and General Staff College. Retrieved from
http://cgsc.contentdm.oclc.org/cdm/ref/collection/p4013coll2/id/2667
DuPont, D. K., & Glass, P. (2011). Towing the line: towboats and other vessels to undergo
regular inspection. WorkBoat, 68, 28. Diversified Publications. Retrieved from
http://go.galegroup.com/ps/i.do?id=GALE|A269541435&v=2.1&u=mlin_c_worpoly&it=r
&p=ITOF&sw=w
Eich, M., & Vogele, T. (2011). Design and control of a lightweight magnetic climbing robot for
vessel inspection. Retrieved from
http://ieeexplore.ieee.org/xpls/abs_all.jsp?arnumber=5983075&tag=1
Glass, P. (2009). Inspection time. Workboat, 66, 38. Diversified Publications. Retrieved from
http://go.galegroup.com/ps/i.do?action=interpret&id=GALE|A214216938&v=2.1&u=mli
n_c_worpoly&it=r&p=ITOF&sw=w&authCount=1
Hocke, K. (2011). Industry has say at towing vessel inspection meeting. Workboat, 68, 22.
Diversified Publications. Retrieved from
http://go.galegroup.com/ps/i.do?id=GALE%7CA275234738&v=2.1&u=mlin_c_worpoly&
it=r&p=ITOF&sw=w
57
IEC/ISO 31010 International Standard. (2009-11). Risk management – Risk assessment
techniques
Inspection of Towing Vessels. (2011). Federal Register. Retrieved from
http://go.galegroup.com/ps/i.do?id=GALE%7CA263960853&v=2.1&u=mlin_c_worpoly&
it=r&p=AONE&sw=w
Institute for Healthcare Improvement (2013). Failure Modes and Effects Analysis Tool.
Retrieved from http://app.ihi.org/Workspace/tools/fmea/
Knoska, J. J., Dalrymple, M. L., & Williams, W. D. (2004). U.S. Patent No. 6,816,088. Washington,
DC: U.S. Patent and Trademark Office.
Le Blanc, L. A., & Rucks, C. T. (1996). A multiple discriminant analysis of vessel accidents.
Accident Analysis & Prevention, 28(4), 501-510. Retrieved from
http://www.sciencedirect.com/science/article/pii/0001457596000206
Lipol, L.S., Haq, J. (2011). Risk analysis method: FMEA/FMECA in the organizations.
International Journal of Basic & Applied Sciences IJBAS-IJENS, 11 (5), 74-81. Retrieved
from http://www.ijens.org/vol_11_i_05/117705-3535-ijbas-ijens.pdf
Manufacturing Technology Committee (2008). Failure Modes and Effects Analysis Guide.
Product Quality Research Institute – Training Guides. Retrieved from
http://www.pqri.org/pdfs/MTC/FMEA_Training_Guide.pdf
Marine Insight. (September 27, 2010). What are Tug Boats? Marine Insight. Retrieved from
http://www.marineinsight.com/marine/types-of-ships-marine/what-are-tug-boats/
MMS Staff (2013). Risk-Based Marine Inspection Performance Measures – WPI Project
Overview and Statement of Work.
58
Murphy, T. E., Lamoureux, J. A., Contonio, J. N., & Noonan, F. F. (2001). Inspection process
improvements for the United States Coast Guard (Undergraduate Major Qualifying
Project No. E-Project 01D175M). Retrieved from Worcester Polytechnic Institute
Electronic Projects Collection: http://www.wpi.edu/Pubs/E-
project/Scanned/01D175M.pdf
Oceana. (2013). Retrieved from http://oceana.org/en
Parsons, C. E. (2008). Inspections & Examinations. Inspections & Examinations. Retrieved from
http://www.uscg.mil/proceedings/archive/2008/Vol65_No1_Spr2008.pdf#page=32
Rothblum, A. M. (2000). Human error and marine safety. Retrieved from
http://www.bowleslangley.com/wp-
content/files_mf/humanerrorandmarinesafety26.pdf
Talley, W. K. (2002). The safety of ferries: an accident injury perspective. Maritime Policy &
Management, 29(3), 331-338. Retrieved from
http://www.tandfonline.com/doi/abs/10.1080/03088830210132641
Talley, W. K., Jin, D., & Kite-Powell, H. (2005). Determinants of crew injuries in vessel accidents.
Maritime Policy & Management, 32(3), 263-278. Retrieved from
http://www.tandfonline.com/doi/abs/10.1080/03088830500139760#.UjXjb8bkuSo
United States Coast Guard (2013). Maritime Security Risk Analysis Model Overview [PowerPoint
Slides]. Retrieved from http://create.usc.edu/Fu-Mowrer%20-%20Pres.pdf
United States Environmental Protection Agency (2013). Superfund Ecological Risk Assessment 8-
Step Process. Retrieved from http://www.epa.gov/R5Super/ecology/8stepera.html
The U.S. Coast Guard Vessel Inspection Programme: A Probability Analysis. (2005). Maritime

59
Economics and Logistics, 7(2), 156-172. Retrieved from
http://dx.doi.org/10.1057/palgrave.mel.9100127.
The United States Coast Guard (2000, May 21). Marine Safety Manual: Volume II.
Retrieved 9/26/2013, from http://www.uscg.mil/directives/cim/16000-
16999/CIM_16000_7A.pdf.
The United States Coast Guard (2009, March). United States Coast Guard Requirements for
Uninspected Towing Vessels. Retrieved 9/26/2013, from
http://www.mxak.org/home/news/news_docs/utvreq.pdf
Pearce L. M. (2005) Towing and Tugboat Services. In Encyclopedia of American Industries. (Vol.
2, pp. 410-414). Detroit, Michigan: The Gale Group, Inc.
United States Coast Guard. (2013). Retrieved 9/8/2013, from www.uscg.mil
Wells & Co Marine Insurance Agency. (2013). Wells & Co Marine Insurance Agency. Retrieved
October 6, 2013, from http://wellsmarineinsurance.com/
Wheeler, T. A., Gawande, K., & Bespalko, S. (1997). Development of Risk-Based Ranking
Measures of Effectiveness for the United States Coast Guard's Vessel Inspection
Program. Risk Analysis, 17(3), 333-340.
Yoe, Charles. (2000) Risk Analysis Framework For Cost Estimation. Retrieved 11/4/2013, from
http://www.iwr.usace.army.mil/Portals/70/docs/iwrreports/00-R-91.pdf

60
Appendices
Appendix A: Sponsor Description
The United States Coast Guard (USCG) (2013), established in 1790, is a non-profit
government organization and a branch of the U.S. Department of Homeland Security during
peace time and United States Navy during war. Their mission is: “We protect the maritime
economy and the environment, we defend our maritime borders, and we save those in peril”
(Missions). Under this, there are 11 sub-missions of the USCG including:
1. Ports, waterways, and coastal security 2. Drug interdiction 3. Aid to navigation 4. Search and rescue 5. Living marine resources 6. Marine safety 7. Defense readiness 8. Migrant interdiction 9. Marine environmental protection 10. Ice operations 11. Other law enforcement
In order to fulfill these missions, the USCG has access to a large number of resources. The USCG
is funded by the United States Government with a budget for the 2014 fiscal year of $9.79
billion. In 2012, the USCG had over 43,000 members on active duty, 8,000 reserves, and over
8,800 civilian employees.
The USCG (2013) is led by a Commandant, Admiral Robert J. Papp, Jr., and Vice
Commandant, Vice Admiral John P. Currier. Under them there are two deputy commandants,
one in charge of operations and the other in mission support. The operations department
includes capability and marine safety, security, and stewardship, while mission support covers a

61
host of units which includes Command, Control, Communications and Information Technology
(CCC and IT), Human Resources (HR), Force Readiness Command (FORCECOM), and Logistics
(See Figure 12). The USCG is divided into two geographical areas, Atlantic and Pacific, each with
its own commander. These areas are further divided into 9 districts as seen in the map below.
CG-5 is one of ten major groups within the USCG (2013) and denotes the department for
Marine Safety, Security, and Stewardship. The office that is especially relevant for this project
is the Office of Vessel Activities, which is part of this department. The mission of this unit is to
Figure 12: USCG District Map (Units, 2013)

62
ensure that all vessels in U.S. waters are up to the USCG standards through vessel safety and
inspection programs. The office also enforces international treaties and domestic regulations.
The full organization of the USCG can be seen in Figure 13 below.

63
Figu
re 1
3: U
SCG
Org
aniz
atio
nal
Ch
art
(Org
aniz
atio
nal
Str
uct
ure
, 201
3)

64
To reach their safety goal, the Office of Vessel Activities is seeking to improve their
current vessel inspection program. Helping to achieve this goal, the USCG (2013) has partnered
with several organizations including American Waterways Operators and The International
Association of Independent Tanker Owners. Through the American Waterways Operators
partnership, they have achieved safer operations during dangerous water conditions and dealt
with safety concerns with crew fatalities and tank barge spills. The International Association of
Independent Tanker Owners has helped facilitate better communication with the USCG and the
vessel industry while aiding vessel safety.

65
Appendix B: What is an IQP?
The purpose of an Interactive Qualifying Project (IQP) is for students at WPI to gain a
“broad understanding of the cultural and social contexts of those fields, and thus be more
effective and socially responsible practitioners and citizens” (WPI, 2013, Interactive Qualifying
Project). The IQP experience is unique because it is not a typical course setting, and it is not
directly related to a student’s major. Rather, it combines the technological and social aspects of
society to allow students to work beyond their technical backgrounds. To accomplish this goal,
“small teams of students work under the guidance of faculty members from all disciplines to
conduct research, using social science methods, directed at a specific problem or need”
(Interactive Qualifying Project). Typically, project sponsors are nonprofit, municipal, or
government agencies. An IQP fosters team skills, leadership, and the ability for students to
“deliver findings and recommendations through formal reports and oral presentations to
project sponsors and faculty advisors” (Interactive Qualifying Project).
Our project, Risk-Based Marine Inspection Performance Measures for USCG Prevention
Program, qualifies as an IQP by allowing us to help solve a problem our society faces. Directly,
this project aids the Coast Guard in evaluating their performance, but it plays a part in a larger
context. By helping the Coast Guard in their maritime safety mission, it will impact society by
improving the safety of vessels travelling in U.S. waters, and as a result make U.S. waterways
safer for everyone. Additionally, our project allows for interdisciplinary collaboration by having
a team of two chemical engineering majors, a computer science major, and a civil engineering
major. We will touch upon the technical side through our research on risk assessment, and
incorporate the societal aspects of how to measure preventative performance. With this

66
collaboration and with working on a major societal issue, our project is considered an
Interactive Qualifying Project.

67
Appendix C: Interview Protocols Towing Vessel Company Representatives:
1. What, generally, is the towing industry like?
2. How many towing vessels does your company own?
3. How many towing vessels does the average company own?
4. What is the usual geographic range of work for a company?
5. What kind of work is most common? Emergency towing or scheduled movement of
larger ships?
6. What kind of towing work does your company do, primarily?
7. Where do most of the safety regulations followed by your company come from?
Company policies, Coast Guard regulations, or third party standards?
8. In your opinion, which regulations have been most effective in keeping the industry
safe? Why?
9. How transparent has the Coast Guard been about their upcoming inspection and
regulation system?
10. What kinds of hazards is your company most concerned with when operating towing
vessels?
11. Does your company believe that more regulations would lead to safer vessels and vessel
operation? Why or why not?
12. Do you notice that some companies are less stringent in following industry safety
standards? If so, why do you believe this is the case?

68
Appendix D: Interview Transcripts
D-1 Foss Maritime Company
October 2, 2013
Scott Jason, Project Manager, Atlantic Division
617-561-0223
Interviewers: Christina Bailey, Erika Kirichenko
Recorder: Mitchell Caisse
Medium: Telephone
1) What is the towing industry like? What is the average size of a company and what kind
of work is most common?
a. Towing vessels aid all container ships that are coming into port.
b. Petroleum is the biggest job performed by towing vessels in the North East. In
Massachusetts 50% of all gasoline is transferred by barges being maneuvered by
towing vessels.
c. Industry has a very high barrier to entry, with the cost of tug boats and meeting
industry standards.
i. Not many small operators are currently entering the industry.
2) How has the towing industry changed in the past few years?
a. Towing vessels are becoming more specialized in their roles in the past 10 – 15
years.
b. Harbor assist tug boats are being build specify for maneuvering large ships, have
multi directional thrust, and large amounts of horse power.
i. This has greatly increased the safety of harbor assist, as the towing
vessels can now move in every direction rather than just forward and
backwards.
c. Integrated Tug and Barge (ITB) reduce the risk involved with towing barges, as
instead of using lines to pull the barge, the tug boat attaches directly to the
barge and it acts as one ship.
d. New winches that handle the lines and perform automatic line recovery for lost
lines, taking away the crew’s responsibility for manipulating the lines.
e. Advancements are limited to large companies that have the capital for newer
technologies as well as the need for safer vessels, mostly companies working
with high value cargo (ex. petroleum, wind mill blades, drilling equipment.)
3) What types of accidents are most common and what can be done to help reduce them?
a. Human error, every incident comes down to some form of human error, either
because the captain turned the wrong direction or the ship was not properly
maintained.

69
b. Crew endurance management and proper rest are the most important but also
the most difficult to properly implement and enforce.
4) How many people on average are on a towing vessel?
a. Varies depending on the location of the vessel and the work it is performing
i. Harbor Assist vessels have 2 operators, a deck hand and a captain
ii. Ocean going ITB have 9 operators on board.
5) How is your company currently regulated?
a. Regulated by third parties, insurance companies and international standards.
b. USCG also over sees regulations, but Foss maintains a higher level of regulation
than current USCG standards.
6) How transparent has the Coast Guard been about their upcoming inspection and
regulation system?
a. They have been very transparent with towing vessel operations who report their
safety operations to them.
b. They have press releases, a bridging program, and companies can volunteer to
have their vessels inspected by USCG.
7) What kind of hazards is your company most concerned with when operating towing
vessels?
a. Physical injury of deck hands, no one wants to see their crew to get hurt.
b. Having a towing vessel get stranded, as the USCG does not have the equipment
necessary to tow a towing vessel.
8) Does your company believe that more regulations would lead to safer vessels and vessel
operation?
a. The current issue is not with lack of regulation but the lack of enforcement, if the
currently industry standard regulations are enforced, then that should lead to
safer vessels.
b. The regulations will have to be enforced equally across all companies.
Unenforced regulations disadvantages to companies that do follow the
regulations.
c. Unsure how thorough the USCG can be in inspection with their limited budget
and resources.
9) Where do most of the safety regulations followed by your company come from?
Company policies, Coast Guard regulations, or third party standards?
a. States set laws / regulations to enforce safety standards
i. California has one of the highest standards to operate vessels. Need
certain type of vessel to assist certain ships.
b. American Bureau of Shipping (ABS) does USCG inspection on barges and bigger
vessels.
c. Beyond class society ships there needs to be skilled inspectors.
d. All of Foss’s vessels are International Safety Management Code (ISM) certified by
International Maritime Organization to prepare for USCG standards.
70
10) How do you feel more regulations will affect the industry?
a. It will make it harder for smaller companies to enter the industry and stay in the
industry.
b. Majority of the bigger companies already follow industry standards, not much
change to them.
D-2 McAllister Towing of Narragansett Bay
October 2, 2013
Captain Gary Oliveira, Vice President and General Manager
401-331-1930
Interviewers: Christina Bailey, Nick Smith
Recorder: Mitchell Caisse
Medium: Telephone
1) What is the towing industry like? What is the average size of a company and what kind
of work is most common?
a. The size of a company depends on where the company is located and what kind
of work that they are doing. The number of vessels a company has can vary from
1 to 100.
b. McAllister has about 9 towing vessels and mostly focuses on emergency towing,
assisting ships in ports / harbors, and towing barges.
c. They operate in 13 ports on the east coast of the U.S. from Maine all the way
down to Puerto Rico, and have 3 locations in Massachusetts alone.
2) Where do most of the safety regulations followed by your company come from?
Company standards, Cost Guards regulations, or third part standards?
a. Each company defines their own standards, as well as follows standards setup by
other organizations which include American Waterways Operators (AWO), the
United States Cost Guard (USCG) and Oceana.
3) How transparent has the USCG been about their upcoming inspection and regulation
system?
a. The information that the USCG releases depends on the company
b. McAllister is involved with joint training with the USCG as well as most other
companies in the industry
4) What changes do you expect to happen when the USCG’s new regulations are put in
place?
a. It has been in the works for about 10 years and bigger companies in the industry
have been preparing for it and self-regulate, not that much of a change when
they are put in place.
b. USCG regulations will follow the regulations that are already industry standards.

71
5) What kind of hazards is your company most concerned with when operating towing
vessels?
a. Bad weather, equipment failure, moving heavy gear around on deck.
b. Implemented safety standards to reduce the safety risk associated with these.
6) Does your company believe that more regulations would lead to safer vessels and vessel
operations?
a. No, the current regulations that are in place are sufficient, they just need to be
enforced properly.
b. Currently only larger companies follow the industry regulations, allowing smaller
towing companies, which usually do not follow the industry regulations, to
outbid bigger companies.
7) What are some of the ways to lower the amount of human error that occurs?
a. Training crew members properly for the work that they will be doing and having
routine drills and exercises to ensure crew members know how to respond in an
emergency situation.
b. Smaller companies tend not to train their crew as well, pay them less, and have
less safety equipment on board.
8) What are the most common accidents and what usually causes them?
a. Injuries to crew members and property damage
b. Normally caused by crew members slipping and falling, or getting caught in a
towing line. As well as a lack of training and/or experience.
c. Equipment failure also occurs, but less commonly than human error.
d. To prevent equipment failure companies have Quality of Safety Management
systems and perform regular maintenance on their vessels to ensure that they
are in operable order.
9) What is considered a “smaller company?”
a. Companies that only own a few towing vessels and or a few construction barges.

72
Appendix E: Calculating Risk-Reduction Value Sub-system Calculations:
Sub-system Severity Scale:
Human Casualty Scale is a measure of the likely human casualty during an accident because of
the sub-system not performing as it should. The severity can be based on injury level and/or
deaths, or equivalent measures.
No Impact 0
Minor to Moderate Injury (no professional medical treatment required) 1
2
Severe Injury, Possible Death 3
4
Severe Casualty, Multiple Deaths 5 Figure 14: Human Casualty Scale
Environmental Impact Scale is a measure of the likely environmental impact during an accident
because of the sub-system not performing as it should. The impact can be measured as a
quantity of oil spilled or equivalent environmental damage.
No Impact 0
Minor, Small Scale Impact (<10 gal oil spilled in water) 1
2
Moderate Impact (100 – 500 gal oil spilled in water) 3
4
Severe, Large Scale Impact (>1000 gal oil spilled in water) 5
Figure 15: Environmental Impact Scale
Property Damage Scale is a measure of the likely cost of property damage due to an accident
because of the sub-system not performing as it should. The damage can be quantified by cost
of property damaged, cost to repair, or a combination of factors.

73
No Impact 0
Minor Damage (<$50,000) 1
2
Moderate Damage ($100,000 - $200,000) 3
4
Severe Damage (>$250,000) 5 Figure 16: Property Damage Scale
Component Calculations:
√(
)
Component Severity Scale:
Component Impact is defined as the components potential to cause failure to the sub-system.
The scale below shows example values ranging from 0 to 10 based on the likely severity of
failure of the sub-system containing that component.
No Likely Impact 1
2
3
4
Moderate Impact 5
6
7
8
9
High Impact 10
Figure 17: Component Impact Scale
RRV Calculation:

74
Example Severity Scale sent to SMEs:
System: Communications
Table 8: Example Severity Scale to SMEs
Sub-system
Human Casualty
(1-5)
Environmental Impact
(1-5)
Property Damage
(1-5)
Alarms/ Indicators
Components Impact Value (1-10)
Abandon Ship Alarm
Autopilot Alarm
Ballast Alarm
Bilge Alarm
Collision Alarm
Engine RPM Gauge/Indicator
Engineers' Assistance-needed Alarm
Fire Alarm
General Alarm

75
Appendix F: Calculating Accident Value
Table 9, filled with 5 years of hypothetical data, shows the first step in calculating the
Accident Value, which involves gathering necessary data from spreadsheets obtained through
CGBI. The values shown are fairly straightforward. For property damage and environmental
damage, there are number of incidents which fall into the ranges displayed, and the average
value within each range. The center column contains the number of each type of human
casualty for the set of data. These numbers are used in a separate table to calculate the
Accident Value.
Table 9: AV Severity Scale Components
Number of Incidents 5530
Property Damage ($) Human Casualty Environmental Impact (gal oil spilled)
Count
Total Persons Dead Count
<$50000 5000 0 <10 gal 4600
$50001 - $250000 380 Total Persons Missing 11 - 1000 gal 900
>$250000 150 1 >1000 gal 30
Average Total Persons Injured Average
<$50000 3200 7 <10 gal 3
$50001 - $250000 110000 Total Persons at Risk 11 - 1000 gal 90
>$250000 4030000 120 >1000 gal 20500
After the data is collected from the raw spreadsheets, it goes through several steps in
order to generate the final Accident Value, as shown in Table 10. Each of the three subsets of
consequence are separated and run through separate, but similar calculations. Human
casualties have the simplest calculations. The incidents per year are multiplied by the assigned
weight to produce the weighted values.

76
The sum of these weighted values is divided by the total incidents per year to generate
the result, which in the example is 2.3.
∑
Property damage and environmental impact both have the same calculation steps, the
only difference being the numbers entered and the ranges used to divide them. The incidents
per year for each range are calculated as is the total, just as in human casualties. The weights,
however, are calculated instead of assigned. The weights are the proportion of incidents per
year of that range.
This is done in order to balance out the effect of infrequent, high-impact incidents which
would otherwise dominate the overall value. This weight is then multiplied by the average
value for its respective range, resulting in the weighted values.
These values are added together to produce a total, which is then compared back to
the scale originally used to separate the incidents and the subset is assigned a value from 1 to 3
accordingly. If the value falls in the low range, it is assigned a 1, in the middle range a 2, or in
the high range a 3. In the example table, both total weighted values fall in the middle range,
meaning both are assigned results of 2. The Accident Value (AV) is the sum of the three results
which, for the example data, is 6.3.

77
This value on its own bears little meaning, as there is technically no maximum value
within this model; however it will provide a single, quantitative method to compare the average
severity of types of accidents.
Table 10: AV Example Calculation
Accident Type: All Total Incidents: 5530 Vessel Type: Towing
Human Casualty: Incidents Per Year Weight Weighted Value
Death 0 0 1000 0
Missing Person 1 0.2 100 20
Injury 7 1.4 10 14
At Risk 120 24 1 24 Result
Total: 25.6 Total: 58 2.3
Property Damage ($) Incidents Per Year Weight (inc./yr./total)
Avg. Property Damage Weighted Value
0 - 50,000 5000 1000 0.90 3200 2880
50,001-250,000 380 76 0.07 110000 7700
250,001 or more 150 30 0.03 4030000 120900 Result
Total: 1106 Total: 131480 2
Environmental Impact (gal. oil spilled) Incidents Per Year
Weight (inc./yr./total)
Avg. Env. Damage Weighted Value
0-10 gallons spilled 4600 920 0.83 3 2.49
11-1000 gallons spilled 900 180 0.16 90 14.4
1,001 or more gallons spilled 30 6 0.01 20500 205 Result
Total: 1106 Total: 221.89 2
Accident Value: 6.3

78
Appendix G: RRV Assistant User Guide
The RRV Assistant makes it easier to calculate the RRV for a set of systems. Once the list
of deficiencies is imported into the database and the lists of components are in the database,
all that the user needs to do to calculate the RRV is to enter the severity values for the
components and sub systems.
Once the application is started, the process to start creating RRVs is quite simple. First
select the year range from the combo boxes labeled “Starting Year” and “Ending Year,” as seen
in Figure 18 below. This range is inclusive and will determine which years data is pulled from.
For example, if you were to select 2008 for the starting year and 2011 for the ending year, it will
include all deficiencies found in the years 2008, 2009, 2010, and 2011.
Figure 18: RRV Ending Year dropdown example

79
After the year range is selected, press the “Update” button to retrieve data about all of
the components and their respective system and sub system. The systems and sub systems will
populate the combo boxes labeled “System” and “Sub System” respectively. The tables below
will also be populated with a list of sub systems that exists in the selected system, as well as the
list of components that exist in the selected sub system, as seen below in Figure 19.
Figure 19: RRV Sub System dropdown example
From these tables, the user can enter severity values for both components and sub
systems. This can be done by double clicking on the “Severity” column for the item that you
wish to update the severity for, as seen below in Figure 20. You will notice that as you change
the severity, the program automatically updates the RRVs for all of the affected components
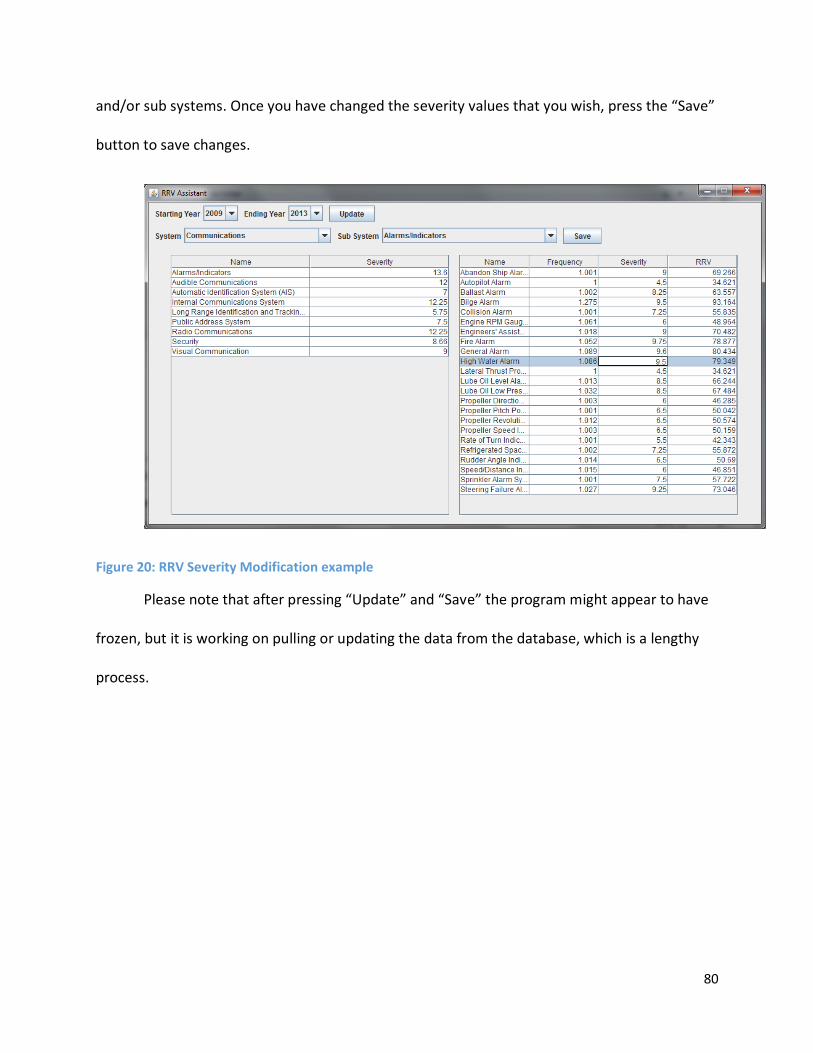
80
and/or sub systems. Once you have changed the severity values that you wish, press the “Save”
button to save changes.
Figure 20: RRV Severity Modification example
Please note that after pressing “Update” and “Save” the program might appear to have
frozen, but it is working on pulling or updating the data from the database, which is a lengthy
process.

81
Appendix H: RRV Assistant Developer Guide
The RRV Assistance is structured into 3 separate components, the user interface / view,
the data objects, and the database interface.
The database interface consists of a MyBatis mapper and a manager. The MyBatis
mapper contains all of the queries that are used to fetch data from the database. The manager
is an interface between the frontend of the program and the database side, which allows the
database implementation to differ without changing the frontend.
Currently, the database implementation and queries are not optimized and take a long
time to populate the data with large data sources. This is due to the limited capability of the
database that was used as a backend for the program, Microsoft Access. There is no easily
available open source JDBC Driver for a Microsoft Access database, and the default ODBC-JDBC
bridge does not allow the use of an object-oriented approach with MyBatis.
The data objects are the objects representing the Components, Sub Systems and
Systems. These are the objects that contain the data that the user interface displays, as well as
contain the logic to make the calculations regarding the RRVs. The manager will create all of
these objects using data from the mapper and return them to the user interface.
The database format follows a very similar format to the one used in MISLE. For
calculating RRVs, the necessary tables are DEFS, SYSTEMS, SUB_SYSTEMS, and COMPONENTS.
The DEFS table mirrors the table which contains vessel deficiencies in MISLE; however the only
fields that are used are CALENDAR_YEAR, COMPONENT, SUB_SYSTEM, and SYSTEM. As for the
SYSTEMS, SUB_SYSTEMS, and COMPONENTS, these tables store a list of all of the different
components and their respective sub system and system. These tables allow for the use of an

82
Object Oriented approach; however, due to limitations in the ODCB-JDBC bridge, they are not
currently being used in this manner. The specification of the tables can be seen below
Table 11: SYSTEMS Table specification
Column Name Data Type Column Description
SYS_ID LONG The unique ID of the system
SYS_NAME TEXT The name of the System
Table 12: SUB_SYSTEMS Table specification
Column Name Data Type Column Description
SUB_SYS_ID LONG Unique ID of the sub system
SUB_SYS_NAME TEXT Name of the sub system
SUB_SYS_SEV DOUBLE Severity of the sub system
SYS_ID LONG ID of the system which this sub system belongs to
SYS_NAME TEXT The name of the system which this sub system belongs to
SUB_SYS_RRV DOUBLE The calculated RRV of the sub system
Table 13: COMPONENTS Table specification
Column Name Data Type Column Description
COMP_ID LONG Unique ID of the component
COMP_SUB_SYS TEXT Name of the sub system this component belongs to
COMP_SYS TEXT Name of the System this component belongs to
COMP_NAME TEXT Name of the component
COMP_SEV DOUBLE The severity of this component
COMP_RRV DOUBLE The calculated RRV for this component
COMP_RRV_SCALED DOUBLE The scaled RRV for this component
SUB_SYS_ID LONG The ID of the sub system this component belongs to

83
Appendix I: Excel Program User Guide
The manual and image below describe the excel program and the process used to
calculate the RRVs.
The RRVs are organized by critical systems, moving from left right in the document, with
sub-systems and their respective components listed down the rows.
In the given example, five years’ worth of all vessel data is used, as seen in cell D2. The
cell D1 above it reflects the total number of deficiencies discovered during inspection over this
time period. The sub-system severity value is found in cell B5, and is based on the sum of the
three factor ratings of its potential impact on human casualties, property damage and the
environment in case of failure.
Figure 21: Excel Example
The ratings of the sub-system components are seen in cells D8-D13. The frequencies are
calculated in cells B8-B13 as:
)

84
The value of “1” is added to give a default value to deficiencies that have not yet been
discovered during inspections to ensure RRV is not calculated to be 0. The square root of the
frequency is taken in order to dampen its effect on the final RRV and give higher priority to
component’s “Severity” rating.
The “Value” column in D8-D13 is the product of Frequency and Severity. Finally, the
RRVs by component are calculated by multiplying “Value” column product by the sub-system
Severity value. These RRVs are the final outputs of the program and can be found in cells E8-
E13.
Finally, column F contains normalized RRV values, based on the maximum RRV across all
existing subsystems. Each RRV in column E is then divided through by this maximum to produce
a normalized value within the scale of 1-100.