risk-based assessment of climate change impacts on coastal
TRANSCRIPT
1
Risk-based assessment of climate change impacts on coastal zones: the case study of
the North Adriatic Sea.
International Conference Deltas in Times of Climate Change
Rotterdam, 30 September 2010
Torresan S., Critto A., Rizzi J., Zabeo A.,
Gallina V., Rianna F., Giove S., Marcomini A.
1
GLOBAL vs REGIONAL SCALE
Development of a GIS based DSS (DESYCO) for climate change impact assessment and
management on coastal zones at the REGIONAL SCALE.
Appropriate methods are needed to assess the impacts and risks at the fine scale where impacts happen as a consequence of changed weather
conditions.
• Climate change impacts on coastal zones (e.g. sea level rise inundation, coastal erosion, water quality variations and biodiversity loss) are very dependent on regional geographical features, climate and socio-economic conditions;
• Impact studies should therefore be performed at the local or at most at the regional level.
Based on downscaled numerical models and
on site-specific environmental and socio-
economic data.
CMCC
project
Useful for the implementation of ICZM
strategies.

1
2
DESYCO(DEcision support SYstem for COastal
climate change impact assessment)OBJECTIVES: 1) Improve our understanding about the effects of climate change on coastal environments
at the regional scale;2) Apply innovative interdisciplinary approaches and adequate methodologies for a sound
assessment and communication of climate change-related-risks;3) Provide policy planners and decision makers with appropriate information to define
adaptation strategies;4) Provide results for further scientific research and to stimulate the debate of scientific and
technical networks.
3
DESYCO: functionalities
• Source-Pathway-Receptor-Consequence risk assessment approach;
• Provide regional scale scenarios using the output of numerical models simulations,
downscaling techniques and time series analysis;
• Transfer information about climate change impacts and risks that is relevant to and usable by different sectors of society (policymakers, industry, cities, etc.);
• Provide a platform for responding to stakeholders needs and challenges related to Climate Change;
• Enable various stakeholders, governmental and non-governmental bodies and
communities to start the implementation of appropriate adaptation actions;
• Use of automated GIS tools to facilitate the visualization and the identification of coastal areas and receptors exposed to the risk of Climate Change;
• Help to identify significant impacts and risks related to ecological and human systems exposed to Climate Change impacts;
• Provide a base for coastal zoning and land use planning considering long-term scenarios in a ICZM perspective.

1
4
DESYCO: structure
The structure of DESYCO comprises 3 major components:
• A GEODATABASE with bio-physical and socio-economic data for the coastal area of the North Adriatic Sea.
• Multi-scale SCENARIOS provided by numerical models simulations or time series analysis.
• A Relative Risk Model (RRM) for the application of the Regional Risk Assessment (RRA) methodology.
55
DESYCO Software architecture
PostgresPostgresModels
txt
Raster Shapefile
OGR / GDAL modulesOGR / GDAL modules
Python functionsPython functions
C# command line classesC# command line classes
New interfaces New interfacesIntegration in
existing application
Integration in existing application
Open source software
Graphical User Interfaces
DESYCO PROTOTYPE
Web-based Desktop
Da
ta t
ier
Lo
gic
tie
rP
rese
nta
tio
n tie
r
CMCC software

1
6
Regional Risk Assessment (RRA) conceptual framework
CLIMATE CHANGEHAZARD ANALYSIS
(identification of Hazard Metrics)
EXPOSURE SCENARIOS(exposure functions)
climate models(e.g. global, subcontinental
scale)
high resolution numerical
models (e.g. hydrodynamic, hydrological,
biogeochemical)
observations
time series and
extreme events
analysis
VULNERABILITY
ASSESSMENT(non climatic factors)
SUSCEPTIBILITY FACTORS
(geophysical, ecological
or anthropic)
VALUE FACTORS(environmental or socio-
economic resources)
PATHWAY FACTORS
(physical factors
determining the
impact area)
RRAmodel
ranking of impacts,
targets, areas at risk and
damage evaluation
MC
DA
functionsE
xper
t
judgem
ent
GHG emissions
scenarios(e.g. A1, A1B)
GIS
(vulnerability
functions)
Climate change impacts on coastal zones
Flooding-InundationStorm surge
Sea water quality
Establishment of low-drainage sectors
Surface water stagnationSaltwater intrusioninto groundwater
Change in hydraulics of estuaries
Sedimentationoffshore
Coastal erosion
Altered productivity in
estuarine ecosystem
Impacts on aquaticbiodiversity
Aquatic habitat change/loss(Sea grass bank,
Altered productivity) Impacts on fisheries
and aquaculture
Invasion by exotic/pest
speciesAquatic habitat change/loss(Sea grass bank,
Altered productivity) Impacts on fisheries
and aquaculture
Invasion by exotic/pest
species
Change in carrying Capacity for shore birds
Terrestrial habitat change/loss
(Wetland, Dunes, Hard rock)
Change in carrying Capacity for shore birds
Terrestrial habitat change/loss
(Wetland, Dunes, Hard rock)
Change in carrying
Capacity for shore birds
Terrestrial habitat change/loss
(Wetland, Dunes, Hard rock)
Change in carrying
Capacity for shore birds
Terrestrial habitat change/loss
(Wetland, Dunes, Hard rock)

1
8
ECHAM4 model
World scale: 1,125°°°°- 2°°°° Med scale: 0,2°°°° - 0,25°°°°EBU-POM model
Adriatic North Adriatic Lagoon
from 2,5 km in the open sea to 50 m inside the Venice lagoon
High resolution models:
EXPOSURE SCENARIOS
Global climate simulations Mediterranean climate simulations
Output EBU-POM:Meteoclimatic factors:
− Air/sea temperature;
− Rainfall;
− Winds;
− Atmospheric pressure;
− Relative humidity;
− Cloudiness;
− Salinity.
Output SWAN, ROMS, SHYFEM:Hydrodynamic factors:
• Wave climate (height, period, direction and energy);
• Nearshore circulation patterns;
• Sediment transport and bottom stress;
• Estuarine hydrology/morphology.Output ADRI-2CB/POP:Chemical factors:
� C02;
� Nutrients and contaminants;
� Salinity;
� pH.
RECEPTORS
IMPACTS
BEACHES RIVER MOUTHS WETLANDS HYDROLOGICAL
SYSTEMS
HYDRODYNAMIC
IMPACTS
SLR Inundation
- Elevation - Elevation - Elevation - Elevation
- Protection level - Protection level - Protection level - Water body configuration
- Urban typology - Extension of wetlands - Protection level
- Agricultural typology
Storm surge flooding
- Elevation - Elevation - Elevation - Elevation
- Distance from coastline - Distance from coastline - Distance from coastline - Distance from coastline
- Artificial protections - Artificial protections - Artificial protections - Water body configuration
- Vegetation cover - Vegetation cover - Vegetation cover - Protection level
- Coastal slope - Coastal slope - Extension of wetlands
- Geomorphology - Geomorphology - Protection level
- Dunes - Protection level
- Protection level - Urban typology
- Agricultural typology
VULNERABILITY ASSESSMENT
Based on the considered IMPACT, the RVA require
the identification of
VULNERABILITY FACTORS
for each analyzed RECEPTOR.
� Hydrodynamic impacts
� Impacts on soil and groundwater
� Impacts on water
� Impacts on biodiversity
� Beaches and Dunes
� Estuaries and Deltas
� Wetlands
� Hydrological systems� Terrestrial and Marine Biological systems
� Protected areas
� Fisheries and aquaculture
� Urban areas
� Agricultural areas
IMPACTS
RECEPTORS
VULNERABILITY
FACTORS
VULNERABILITY MATRIX
1
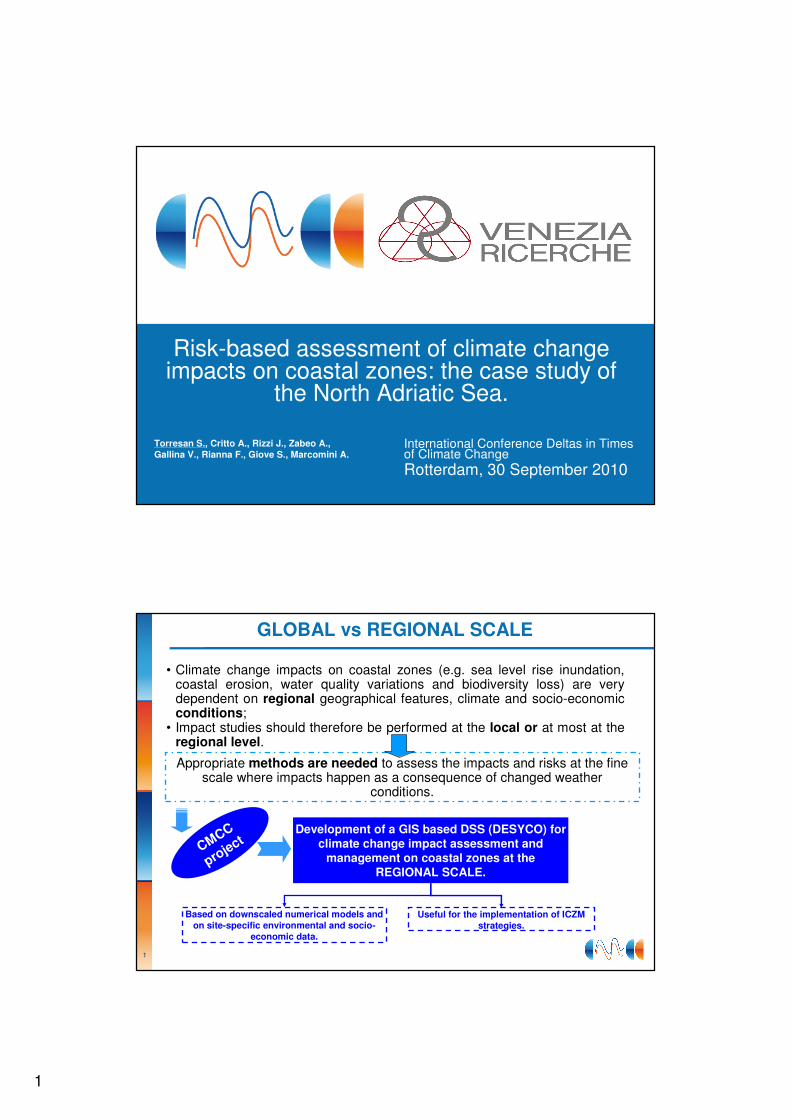
VULNERABILITY FACTORS
Pathway factors: � Elevation� Distance from coastline
Susceptibility factors: � Artificial protections � Vegetation cover
� Coastal slope
� Geomorphology
� Dunes
� Wetland extension� Water body configuration
� Sediment budget
� Mouth typology (estuary, delta)
� Seagrasses
Value factors:� Protection level
� Urban typology (commercial buildings)
� Agricultural typology� Fish farms
� Mariculture and musselculture
� Tegnue
� Fishing prohibited areas
DATASET:Contour lines 1:5000
Digital Elevation Model (DEM)
Coastline
DATASET:Corine Land Cover 2000
Coastline variations
Bathymetric pointsGeomorphological maps
Relevant areas of environmental interest (ARIA)
River and Channels maps
Site of community importance (SCI) and Special
Protection Areas (SPA)
DATASET:Protected areas maps
Fish farming data
Corine Land Cover 2000
Vulnerability factors and available dataset
11
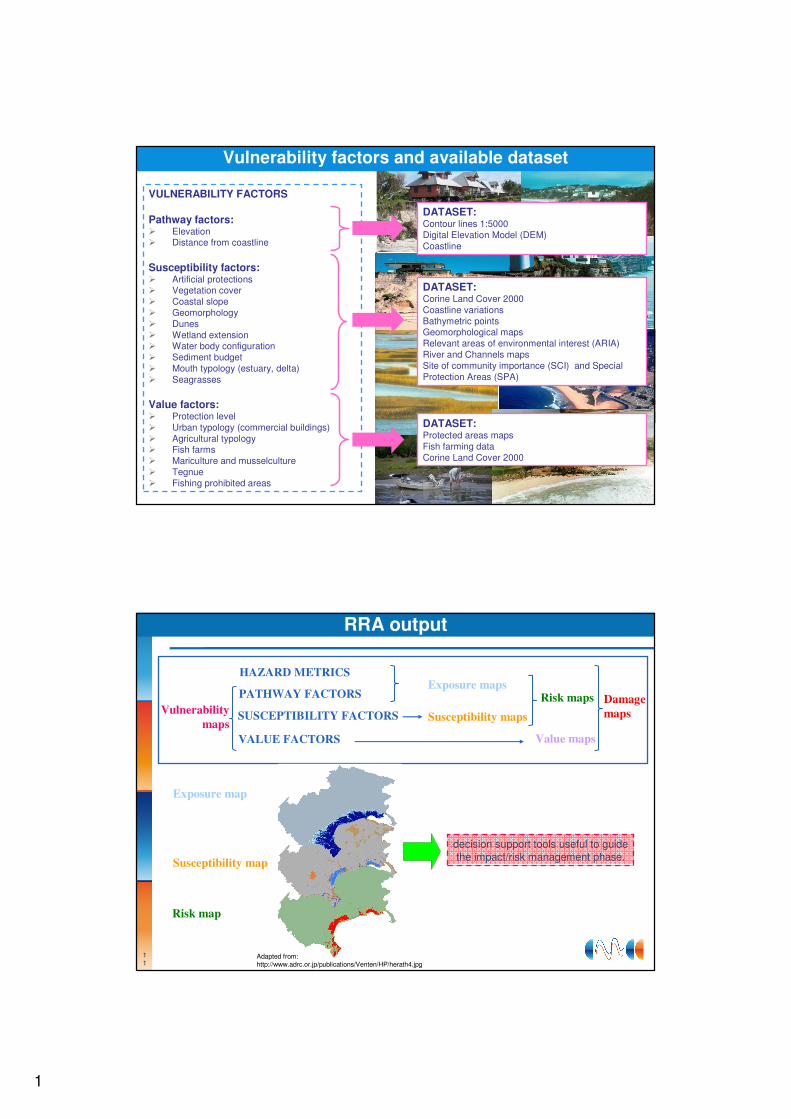
RRA output
decision support tools useful to guide the impact/risk management phase.
Exposure map
Susceptibility map
Risk map
PATHWAY FACTORSExposure maps
Susceptibility maps
Value maps
Risk maps Damage
mapsVulnerability
mapsSUSCEPTIBILITY FACTORS
VALUE FACTORS
Adapted from: http://www.adrc.or.jp/publications/Venten/HP/herath4.jpg
HAZARD METRICS

1
12
DESYCO CASE STUDY AREA: coast of the North Adriatic Sea
13
Climate change issues
Relative sea level rise causes an increase of high tide events that flood the city of Venice which is a very important international monument.
Relative sea level rise in the last 100 years: 1,2- 2, 5 mm/year(Antonioli et al., 2007)
30 high tide events ≥ 110 cm from 2000 to 2009.(Municipality of Venice, 2008)
Erosion has been active both on the coastal sea floor and on the beach
since the beginning of the 20th century and especially after 1960 (Bondesan et al. 1995).
ca. 14 % of Northern Adriatic coasts are eroding.(Augelli et al., 2007)
Coastal areas located below sea level and affected by natural or man-induced subsidence are very frequent.
Po Plain subsidence: 1-2 mm/year. (Carminati and Martinelli, 2002)
Venice subsidence: 1,3 mm/year. (Carbognin et al., 2009)
Trieste subsidence: 0,25 mm/year. (Furlani et al., 2010)
Changes in wetland extent, position and type can be expected as accelerated sea-level rise increases forcing on wetland system (McFadden
et al., 2007).2,242 km2 Ramsar areas.

1
14
Sea Level Rise inundation impact: data sources
SHYFEM hydrodynamic model.
The resolution varies from 2,5 km in the open sea to 50 m inside the Venice lagoon.
Digital Elevation Model (DEM) 25 m.
Elevation
The risk function for the sea level rise inundation impact aggregates data provided by
regional hydrodynamic models forced with climate change scenarios and
topographical data coming from Digital Elevation Models in order to calculate coastal
areas and targets at risk from inundation.
North Adriatic data sources:
15
Risk map for the Low Sea Level Rise scenario (17 cm)
Relative risk score
Data Source:
SHYFEM MODEL (emission scenario A1B for the year 2100).Boundary condition:
20 cm SLR at Otranto.
Low SLR scenario: 17 cm along the North
Adriatic shoreline.
0 – 12
12 – 24
24 – 36
36 – 48
> 48
SLR (cm)
1
16
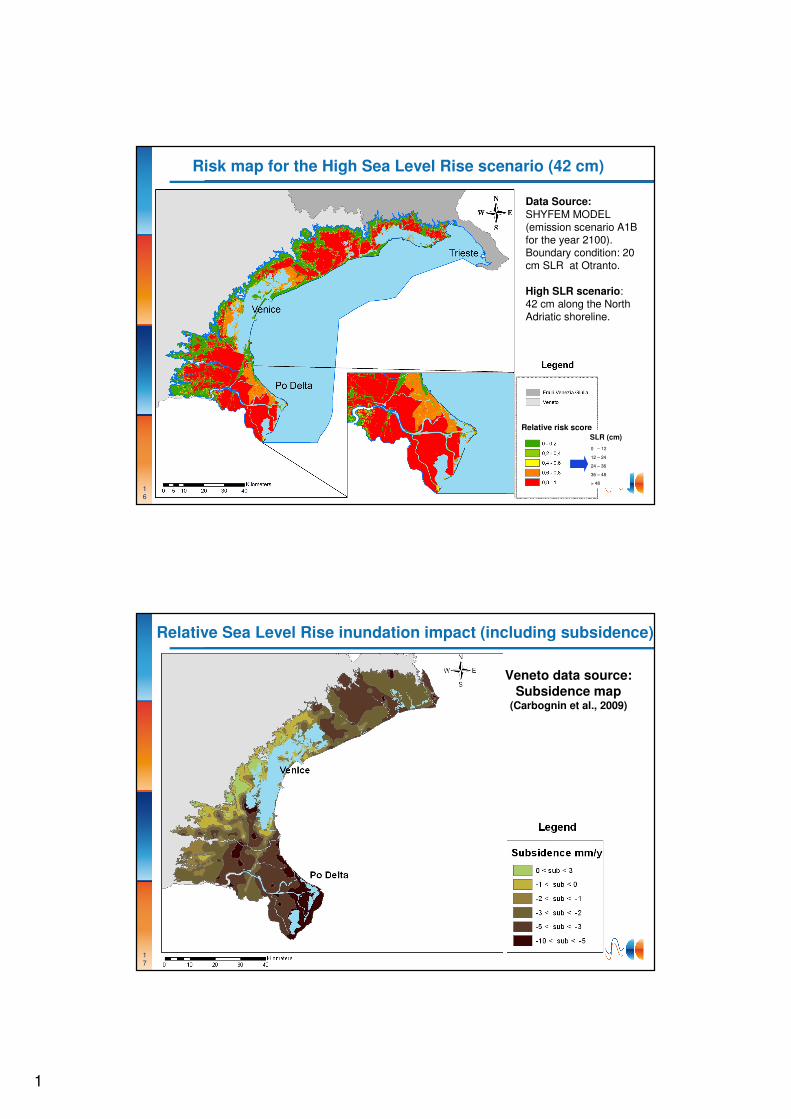
Risk map for the High Sea Level Rise scenario (42 cm)
scoreRelative risk score
Data Source:
SHYFEM MODEL (emission scenario A1B for the year 2100).Boundary condition: 20 cm SLR at Otranto.
High SLR scenario: 42 cm along the North Adriatic shoreline.
0 – 12
12 – 24
24 – 36
36 – 48
> 48
SLR (cm)
17
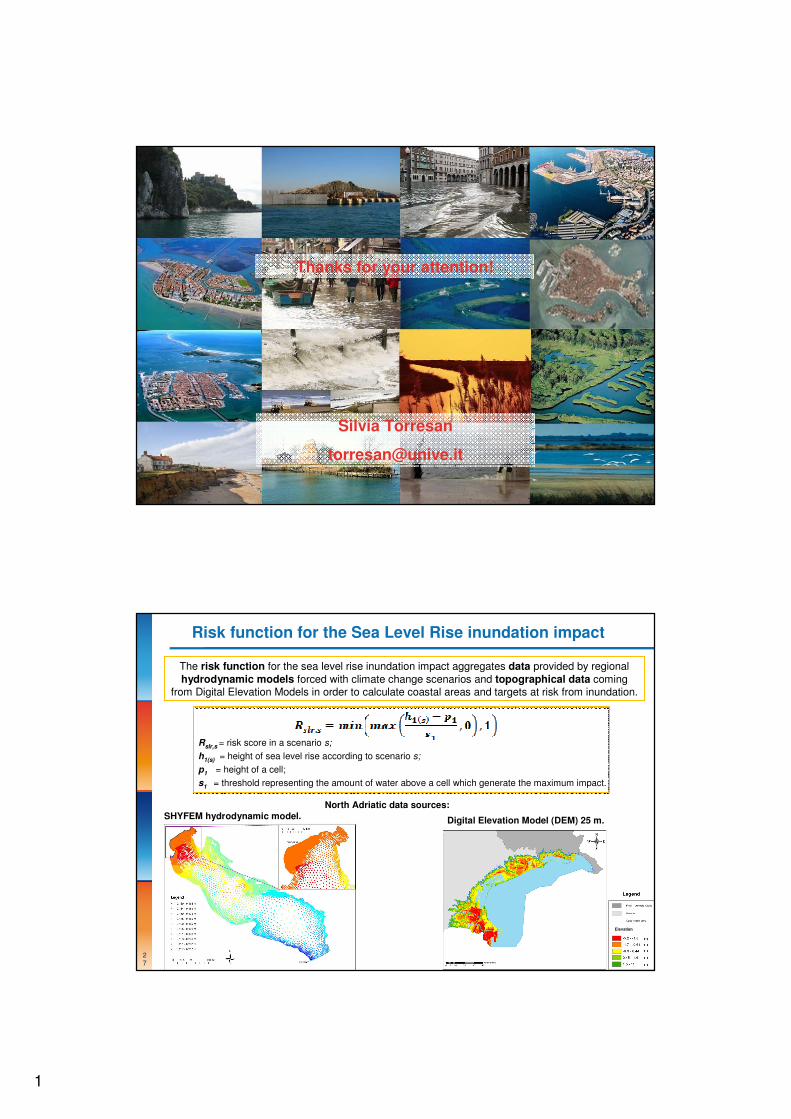
Veneto data source: Subsidence map
(Carbognin et al., 2009)
Relative Sea Level Rise inundation impact (including subsidence)

1
Risk map for the High Relative Sea Level Rise scenario (42 cm)(including subsidence)
0 – 12
12 – 24
24 – 36
36 – 48
> 48
SLR (cm)
Risk scenario: based on SHYFEM MODEL
(emission scenario A1B for the year 2100).
Low scenario: 42 cm
along the shoreline.
Relative risk score
Relative risk score
19
Risk map of wetlands to High RSLR scenario (including subsidence)
50%
Data Source:
SHYFEM MODEL (emission
scenario A1B for the year
2100).
Boundary condition: 20 cm SLR at Otranto.
High SLR scenario:
42 cm along the North Adriatic
shoreline.
Subsidence map: Carbognin
et al., 2009.
Total area of wetlands: ~ 279 km2
Number of wetlands where part of the areais interested by a score ≥ 0,8
Total wetlands = =
71
243
29 %

1
20
Risk map of the Po river Delta to High RSLR scenario (including subsidence)
Relative risk score
Total area of river mouths: 714,82 km2
Risk score
% o
f D
elt
a T
err
ito
ry
Relative risk score
Relative risk score
Data Source:
SHYFEM MODEL (emission
scenario A1B for the year
2100).
Boundary condition: 20 cm
SLR at Otranto.
High SLR scenario:
42 cm along the North Adriatic shoreline.
Subsidence map: Carbognin
et al., 2009.
21
Risk map of beaches to High RSLR scenario(including subsidence)
70
71
50%
Total area of beaches: ~ 12km2
Number of beaches where part of the area
is interested by a score ≥ 0,8
Total beaches = =
70
71
99%
Relative risk score
Data Source:
SHYFEM MODEL (emission
scenario A1B for the year
2100).
Boundary condition: 20 cm SLR at Otranto.
High SLR scenario:
42 cm along the North Adriatic
shoreline.
Subsidence map: Carbognin
et al., 2009.

1
22
DESYCO: participative approach
It is broadly recognised that a DSS can be successful if there is an involvement of the potential end users during the development of the tool (Van Kowen et al. 2007; Matthies,
2005; Uran and Janssen, 2002).
1. Stakeholder analysis: to identify the potential DSS end users.
Main fields investigated:
• climate change impacts on coastal zone;
• ICZM strategy and implementation;
• DSS functionalities.
2. Administrator and analysis of the questionnaire.
23
Result presentation
• 37 institution contacted, all of them replied to the questionnaire;
• 19 questions both open and close format.
In your opinion who is responsible to cope with Climate Change in North Adriatic Coastal areas?
%
Ranking of coastal zone receptors on the base of the respondents perceptions on receptors vulnerability.
What adaptation action could be useful in the North Adriatic Coastal area?
%

1
24
• The survey allowed to gain information that both confirmed the validity of the methodology choices (e.g. the validity of the set of receptors investigated by
DESYCO; functionalities offered by DESYCO);
• The survey supplied some useful contribution to the framework (e.g. suggestions for other receptors to be considered in the vulnerability assessment);
• Knowledge of public institutions about ICZM is really low;
• Public institutions ask for short time frame hazard scenarios while the DESYCO, depending on the available information supplied by models, con supply only long term scenarios.
Result presentation
• DESYCO and the RRA approach are innovative tools to study climate change
impacts on coastal zones at the regional scale and support the development of
effective adaptation strategies and sustainable ICZM, taking into account the increasing issues related to climate change.
• Regional vulnerability/risk classifications should not attempt to provide absolute predictions about the impacts of climate change. Rather, they should be relative indiceswhich provide information about the areas within a region likely to be affected more
severely than others.
• DESYCO can be a useful tool to investigate the impacts associated to different climate change scenarios in sensitive areas (e.g. river deltas, coastal lagoons and estuaries)
and to support the development of sustainable policies, taking into account the risksassociated to future climate change projections.
• DESYCO can be used to prioritize areas more vulnerable to relative sea level rise and
coastal erosion due to climate change and can support the identification of more
suitable areas for the construction of artificial coastal protections and for the
nourishment of beaches and wetlands.
Conclusions
1
Thanks for your attention!
Silvia Torresan
27
Risk function for the Sea Level Rise inundation impact
SHYFEM hydrodynamic model. Digital Elevation Model (DEM) 25 m.
Elevation
The risk function for the sea level rise inundation impact aggregates data provided by regional
hydrodynamic models forced with climate change scenarios and topographical data coming from Digital Elevation Models in order to calculate coastal areas and targets at risk from inundation.
Rslr,s = risk score in a scenario s;
h1(s) = height of sea level rise according to scenario s;
p1 = height of a cell;
s1 = threshold representing the amount of water above a cell which generate the maximum impact.
North Adriatic data sources:

1
28
Veneto data source: Subsidence map (Carbognin et al., 2009)
Rrslr,s= risk score in a scenario s;
h1(s) = height of sea level rise according to scenario s;
p1 = height of a cell;
p2 = uplift/subsidence;
∆∆∆∆t = (ts
– t0), where t
sis the year of the
considered scenario s and t0
is the year of the
measured subsidence:
s1 = threshold representing the amount of
water above a cell which generate the
maximum impact.
Risk function for the Relative Sea Level Rise inundation impact