risk assessment workshop hudson county, nj - … risk assessment and awareness information to local...
TRANSCRIPT

Risk Assessment Workshop Hudson County, NJ
FEMA REGION II April 12, 2012 10:00 am

2
Agenda
Welcome and Introductions
Objectives
Risk MAP Non-Regulatory Products & Datasets
FEMA’s Coordinated Needs Management Strategy
(CNMS)
New Jersey Coastal Flood Study
• Status Update
• Risk Communications and Coastal Outreach Strategy
Questions
Risk Assessment – HazUS Demonstration

3
Introductions
Local – Hudson County (Host) & Communities
New Jersey Association for Floodplain Management (NJAFM)
State – New Jersey Department of Environmental Protection
(NJDEP)
Supervising Engineer: John Scordato
GIS III: Chris Gould
FEMA Region II
Risk Analysis Outreach Lead: Bill McDonnell
Risk Analysis Risk Assessment Engineer: Robert Schaefer
Flood Management & Flood Insurance Lead: Kim Rizzo
Risk Analysis Risk Assessment Technical Support: Thomas Song
Risk Analysis Risk Assessment Technical Support: Seymour Smith

4
Objectives
Engage Hudson County communities and promote local
ownership to reduce their vulnerability to risk
Provide risk assessment and awareness information to local
officials to effectively manage and communicate flood risk for
residents and businesses
Provide an update on the current status of Hudson County’s
Coastal Flood Study
Encourage partnerships and collaborations to leverage and
advance risk management and mitigation measures

Risk MAP Non-Regulatory Products & Datasets

6
The Paradigm Shift: Map Mod to Risk MAP
7
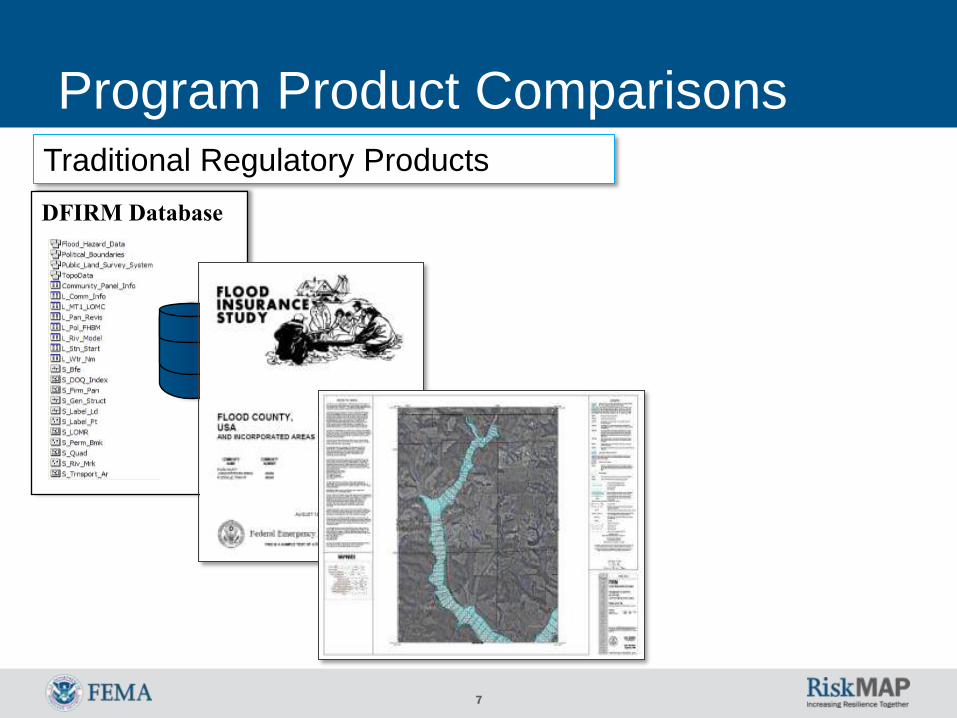
Program Product Comparisons
DFIRM Database
Traditional Regulatory Products

8
Program Product Comparisons
DFIRM Database
Non-Regulatory Flood Risk Products

9
Flood Risk Products and Datasets
Flood Risk Products
• Flood Risk Database
• Flood Risk Report
• Flood Risk Map
Flood Risk Datasets
• Changes Since Last FIRM
• Flood Depth & Analysis Grids
• Flood Risk Assessments
• Areas of Mitigation Interest
Flood Risk Datasets Flood Risk Report Flood Risk Map Flood Risk
Database

10
Required and Optional Flood Risk Datasets
Standard Coastal Flood Risk Datasets (Required)
• Changes Since Last FIRM
• 1% Annual Chance Depth Grid
• Flood Risk Assessments (HazUS Loss Analysis)
Enhanced Coastal Flood Risk Datasets (Optional)
• Areas of Mitigation Interest
• Coastal Increased Inundation Areas
• Coastal Wave Height Grid
• Primary Frontal Dune Erosion Areas
• Eroded Dune Peak

Risk MAP Non-Regulatory Datasets
Areas of Mitigation Interest (Enhanced)
12
Areas of Mitigation Interest Purpose and Intended Uses
Identify areas that may be affecting flood risk that
would benefit from a raised local awareness
Raise awareness by local stakeholders of areas within
and upstream of the watershed that may be
contributing to flood risk and associated
interrelationships
Provide input to local mitigation plans

13
Overview - Areas of Mitigation Interest
Items that may have an impact (positive or
negative) on the identified flood hazards
and/or flood risks
Examples include:
Riverine and coastal flood control structure
At risk essential facilities and emergency
routes that could overtopped
Stream flow constrictions (e.g. undersized
culverts and bridge openings, etc.)
Previous assistance and claims “Hot Spots”
(clusters of IA and PA claims, RL, SRL)
Significant land use changes
Significant riverine or coastal erosion
Locations of successful mitigation projects
14
Broome County, NY
Frank Evangelisti’s testimonial video for the 2011 ASFPM
town hall meeting
http://youtu.be/4p3cu8eTV7s
Example Area of Mitigation Interest

15
Re-designed everything when the developer (Keystone
Associates) saw the new Broome County preliminary
maps and raised the site in City of Binghamton two feet
putting the finished floor of the building two feet above the
new 1% (100-year) event
Broome County, NY Example Area of Mitigation Interest
Due to the new flood
maps and a developer
making prudent risk
management decision,
the new development was
saved from the 2011
floods

16
Areas of Mitigation Interest Features and Benefits
Informs decisions makers on where mitigation actions or
additional building code requirements are needed
Useful in formulating building code enhancements and
prioritizing mitigation actions and identifying needed
resources
Helps visually communicate flood risk to the public
Allows neighboring communities in a watershed study area to
see factors that may impact them, fostering collaboration

Risk MAP Non-Regulatory Products
Changes Since Last FIRM Dataset

18
Purpose of Changes Since Last FIRM
Identify Areas and Types of Flood Zone Change:
• Compares current effective (previous) with proposed (new) flood
hazard mapping. (all inputs must be digital)
• Flood zone changes are categorized and quantified
Provide Study/Reach Level Rationale for Changes Including:
• Methodology and assumptions
• Changes of model inputs or parameters
(aka Contributing Engineering Factors)
Offer Stakeholders Transparency and Answers to:
• Where have my flood hazards increased or decreased?
• Why may have my flood hazards increased or decreased?
• Which communities are subject to new BFEs or ordinance
adjustments.
19
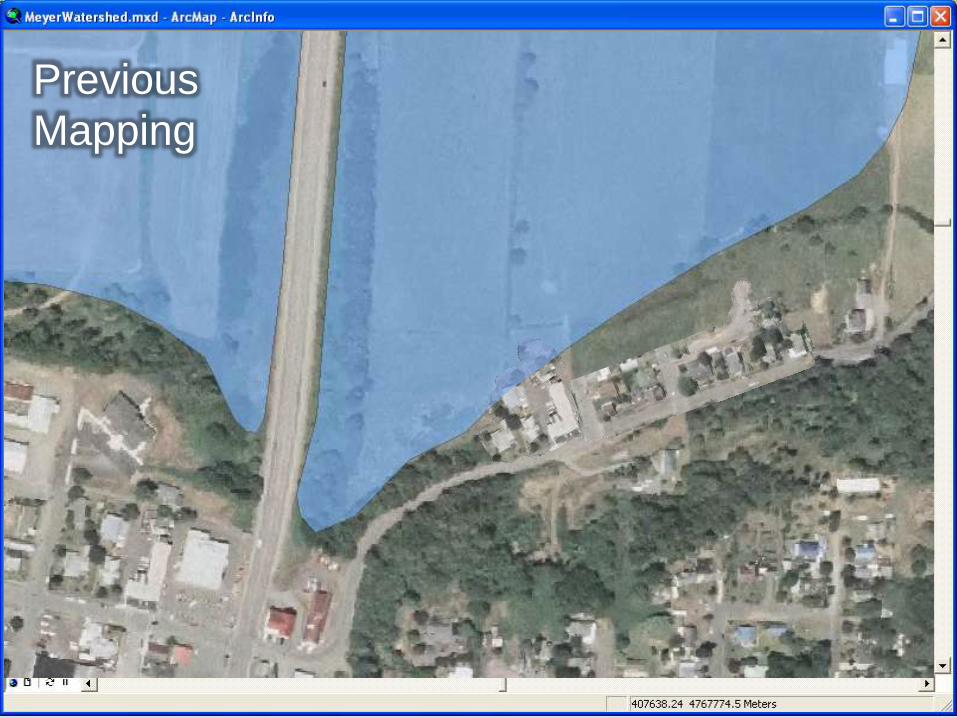
Previous
Mapping

20 20
New
Mapping

21 21
Changes Since
Last FIRM
SFHA Decrease
Unchanged
Unchanged SFHA Increase
Unchanged
SFHA Increase

22
Changes Since Last FIRM (CSLF) Features and Benefits
Makes it easy for communities and homeowners to identify
the impacts of new maps on the regulatory floodplain
• Identifies new at risk properties eligible for Preferred Risk Policy
Assists in prioritizing mitigation actions
• Essential in determining where flood risk mitigation strategies
are needed
• New areas may be found at risk to flooding
• Mitigation might be focused on slowing, or reducing future
increases in flooding
Helps identify reasons for changes

23
Changes Since Last FIRM (CSLF) Features and Benefits
Preferred Risk Policy – annual cost & savings
Pre-Firm Residential Structure With a Basement
Amount of
Coverage
PRP
Preferred Risk Policy
B,C,X Zone
A Zone
Savings per
year
Structure / Contents
Purchased before
map becomes
effective
Grandfathered New rate
the first time PRP is
renewed after new map
becomes effective
Structure Only
Purchased after map
becomes effective
Structure Only
$50,000 / $20,000 $ 236 $ 535 $ 515 0
$100,000 / $40,000 $ 304 $ 765 $ 948 $ 183
$150,000 / $60,000 $ 343 $ 930 $ 1,388 $ 458
$200,000 / $80,000 $ 378 $ 1,095 $ 1,828 $ 733
$250,000 / $100,000 $ 405 $ 1,259 $ 2,253 $ 994

Risk MAP Non-Regulatory Products
Flood Depth & Analysis Grids (DAGs)

25
Purpose of Flood Depth & Analysis Grids
Communicate / ‘Show’ Flood Inundation as Function of
Event’s Magnitude or Severity
Serve as Key Inputs to HAZUS Risk Assessment
Analyses
Serve as pre-screening criteria for mitigation project
potential
Increase Flood Risk Awareness as Acknowledged from
Varied Contexts (Depth, Probability, Velocity, etc.)
Communicate that Hazard, and by extension Risk, varies
within the mapped floodplain

26
Flood Depth Grids Flood Depth Grid Creation Process
XS
XS

27
Flood Depth Grids Water Surface Elevations (WSE) Calculated and WSE Grid Produced
XS
XS
WSE
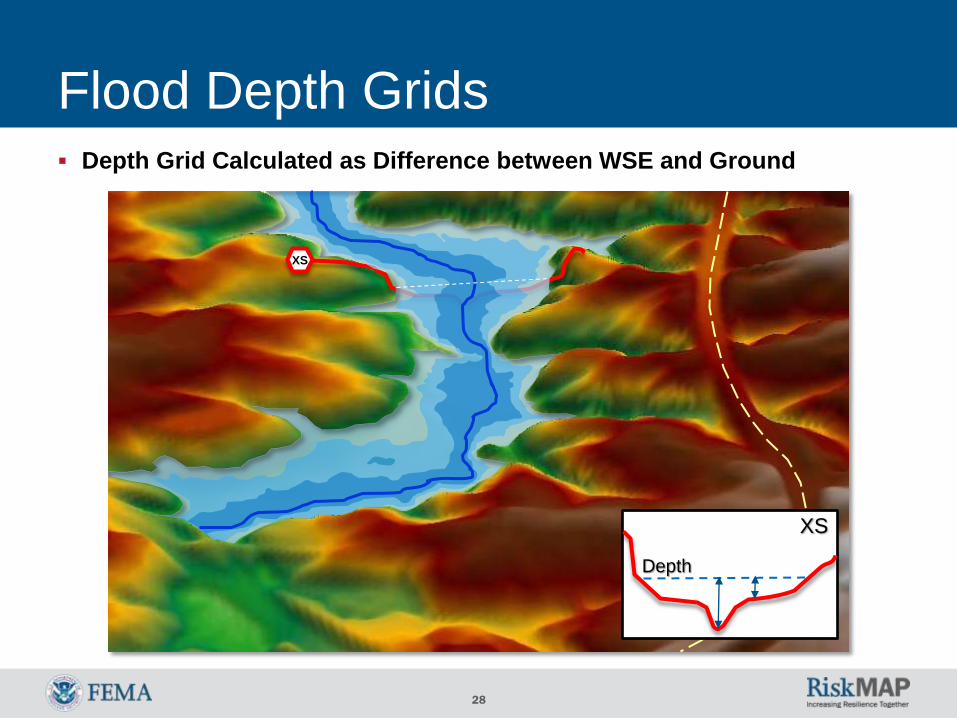
28
Flood Depth Grids Depth Grid Calculated as Difference between WSE and Ground
XS
XS
Depth

29
1% Depth
(100-Year)
4.7 ft
0.1 ft
0.0 ft
30
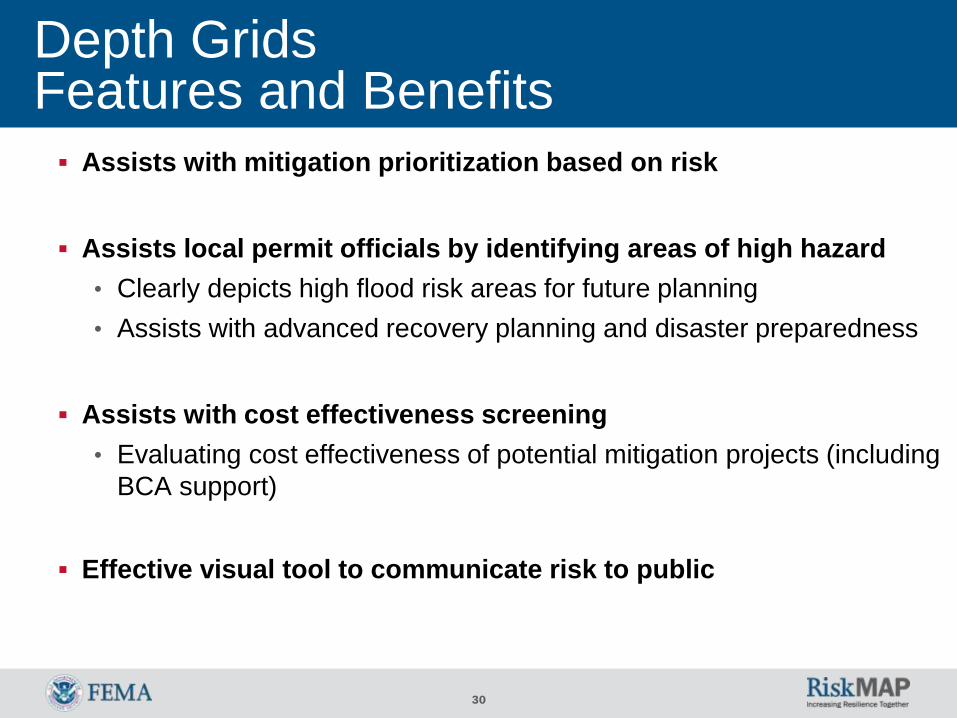
Depth Grids Features and Benefits
Assists with mitigation prioritization based on risk
Assists local permit officials by identifying areas of high hazard
• Clearly depicts high flood risk areas for future planning
• Assists with advanced recovery planning and disaster preparedness
Assists with cost effectiveness screening
• Evaluating cost effectiveness of potential mitigation projects (including
BCA support)
Effective visual tool to communicate risk to public

Risk MAP Non-Regulatory Products
Flood Risk Assessment Data

32
Risk Assessment
Identify Hazards -Earthquake, Floods (Riverine &
Coastal), and Hurricane (Wind & Surge)
Profile Hazard Events -Attributes based on return
period of hazard event
Inventory Assets -Building Stock, Population,
Critical Facilities, etc…
Estimate Losses -The “What Ifs” based on the
previous 3 items

33
Bayonne City: 1% (100 Year) Flood
Block A
Block A
•$6,658,000 total loss from
building damage
•622 tons of debris
Block B
Block B
•$5,000 total loss from
building damage
•1.3 tons of debris
Sources: •HAZUS-MH 2.0 Level 1 Loss Estimation Analysis •Census 2000 data for population and housing stock & Census 2010 TIGER roads file •Parcel Data was developed during the Parcels Normalization Project in 2008-2011 by •NJ Office of Information Technology, Office of Geographic Information Systems (OGIS)
FOR INORMATION PURPOSES ONLY therefore the results displayed can significantly
differ from actual flooding events. Any
determination of floodplains are NOT official.
Legend
Bayonne City Limits
Land Parcel
1% (100 yr) Flood
ValueHigh : 11.0149
Low : 0.0001

34
Bayonne City: 0.2% (500 Year) Flood
Block A
Block A
•$16,836,000 total loss
from building damage
•1,323 tons of debris
Block B
Block B
•$363,000 total loss from
building damage
•8 tons of debris
Sources: •HAZUS-MH 2.0 Level 1 Loss Estimation Analysis •Census 2000 data for population and housing stock & Census 2010 TIGER roads file •Parcel Data was developed during the Parcels Normalization Project in 2008-2011 by •NJ Office of Information Technology, Office of Geographic Information Systems (OGIS)
FOR INORMATION PURPOSES ONLY therefore the results displayed can significantly
differ from actual flooding events. Any
determination of floodplains are NOT official.
Legend
Bayonne City Limits
Land Parcel
0.2% (500 yr) Flood
ValueHigh : 12.6191
Low : 0.0001
35
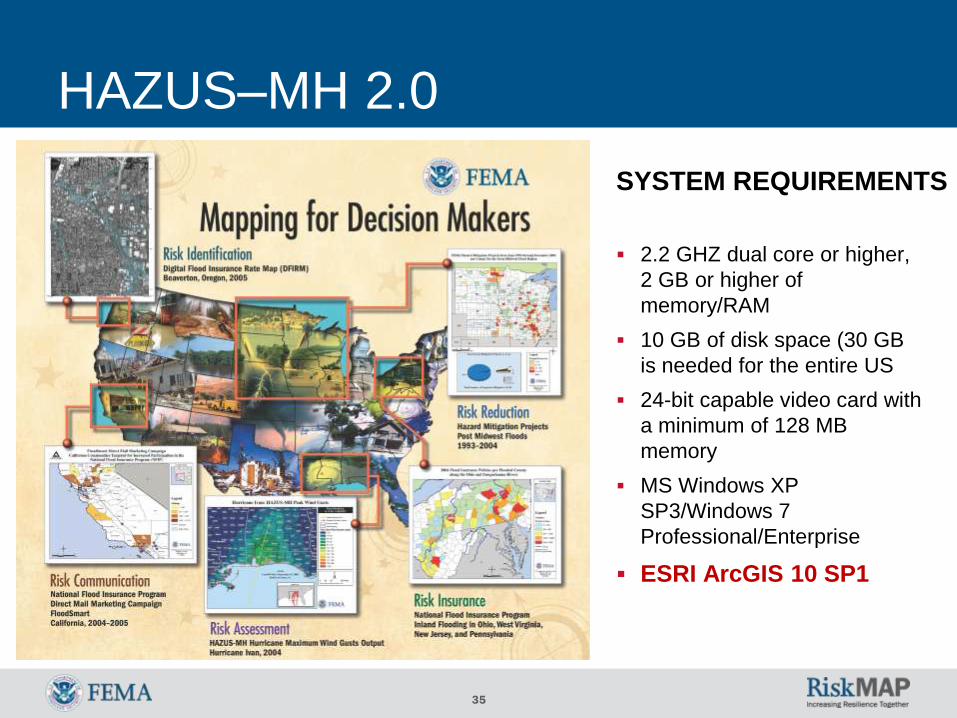
HAZUS–MH 2.0
2.2 GHZ dual core or higher,
2 GB or higher of
memory/RAM
10 GB of disk space (30 GB
is needed for the entire US
24-bit capable video card with
a minimum of 128 MB
memory
MS Windows XP
SP3/Windows 7
Professional/Enterprise
ESRI ArcGIS 10 SP1
SYSTEM REQUIREMENTS

36
HAZUS Outputs
Direct Damage
Induced Damage
Direct Losses
Indirect Losses
General Building Stock
Essential Facilities
High Potential Loss Facilities
Transportation Systems
Utility Systems
Fire Following
Hazardous Materials Release
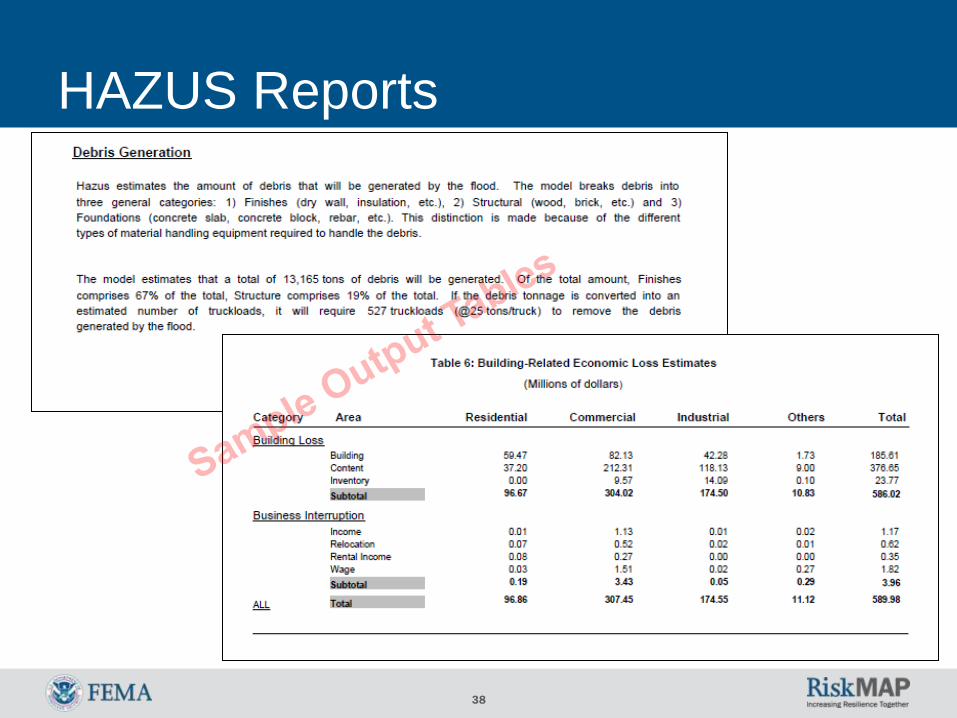
Debris Generation
Cost of Repair
Income Loss
Crop Damage
Casualties
Shelter Needs
Generic Output
Earthquake Ground Shaking Ground Failure
Flood Frequency Depth
Discharge Velocity
Hurricane Wind Pressure | Missile | Rain
Supply Shortages
Sales Decline
Opportunity Costs
Economic Loss

37
How HAZUS-MH estimates losses
Analyzes physical
landscape
Identifies hazard
Considers what is at risk
Analyzes social and
economic impacts
Produces maps, tables,
and reports
38
HAZUS Reports

39
Other Outputs
Identify Areas and Communicate Relative Flood Risk:
• Flood prone areas.
• Vulnerable people and property.
Provide Flood Risk $:
• Potential damage severity for different flood frequencies.
• Identify locations with possible cost effective mitigation options.
Shelter requirements
• Help communities and organizations to determine how many people
they may need to shelter.
At Risk Critical Facilities
• Helps emergency managers to plan for alternatives and mitigation
actions.

40
FOR INORMATION PURPOSES ONLY therefore the results displayed can significantly
differ from actual flooding events. Any
determination of floodplains are NOT official.
10% (10 Year) Flood 0.2% (500 Year) Flood
BAYONNE CITY

41
Max water level encountered:
~5 ft
FOR INORMATION PURPOSES ONLY therefore the results displayed can
significantly differ from actual flooding events.
Any determination of floodplains are NOT
official.
Max water level encountered:
~2 ft
Max water level encountered:
~1.5 ft
Navigating Through Flooded Areas
Sources: •HAZUS-MH 2.0 Level 1 Loss Estimation Analysis •Census 2000 data for population and housing stock & Census 2010 TIGER roads file •Parcel Data was developed during the Parcels Normalization Project in 2008-2011 by •NJ Office of Information Technology, Office of Geographic Information Systems (OGIS)
BAYONNE CITY 0.2% (500 Yr Flood) 10% (10 Yr Flood)
Navigating Through Flooded Areas
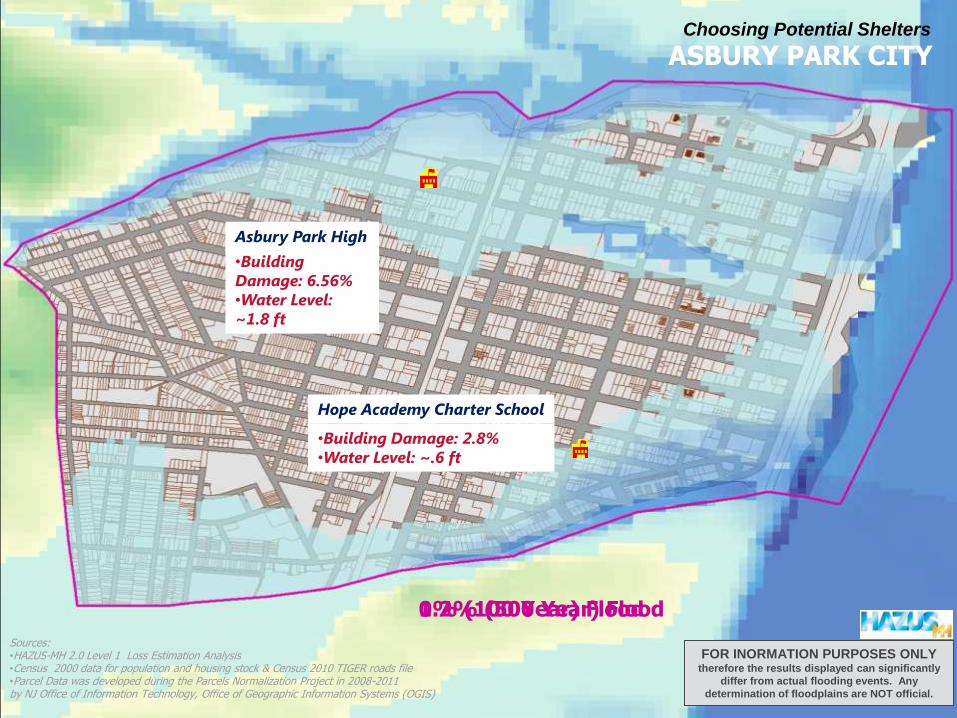
42
k
k
•Building
Damage: 6.56%
•Water Level:
~1.8 ft
Asbury Park High
Hope Academy Charter School
•Building Damage: 2.8%
•Water Level: ~.6 ft
ASBURY PARK CITY
1% (100 Year) Flood 0.2% (500 Year) Flood
FOR INORMATION PURPOSES ONLY therefore the results displayed can significantly
differ from actual flooding events. Any
determination of floodplains are NOT official.
Sources: •HAZUS-MH 2.0 Level 1 Loss Estimation Analysis •Census 2000 data for population and housing stock & Census 2010 TIGER roads file •Parcel Data was developed during the Parcels Normalization Project in 2008-2011 by NJ Office of Information Technology, Office of Geographic Information Systems (OGIS)
Choosing Potential Shelters

43
Levels Of Analysis
Input
of detailed engineering data
Combination of local and default information
Default hazard, inventory and damage information
User effort
and
proficiency

44
DEMO
Getting Started

45
HAZUS will redirect you to the
USGS for DEM download
Default DEM
Equals 30 Meters or
approximately 98.5
Feet

46
Some Drawbacks
The uncertain nature of natural hazards.
Analysis relies on the completeness of the data
on inventory.
• Ex: Default data is 10 years old.
Estimation is a result of approximations and
simplifications.
• Ex: flood models are done on a census block level that
is makes it more susceptible to rounding errors.

47
Risk Assessment Conclusion Features and Benefits
Identifies areas of higher flood risk by census block
Quantifies potential future flood losses to existing
structures
Improves ability to identify effective mitigation actions, or
areas requiring higher building code requirements, or use
of flood resilient designs and construction materials
Supports mitigation plan updates through improved risk
quantification
Supports disaster recovery planning by showing areas of
highest expected damages

48
Ordering HAZUS-MH 2.0
Contact FEMA’s Map Service Center (MSC)
http://msc.fema.gov
Call: Email:
1-877-336-2627 [email protected]
The MSC is the official government distribution center for digital and paper flood
hazard mapping products created by FEMA. Customer Service Representatives are
available to answer any questions.
49
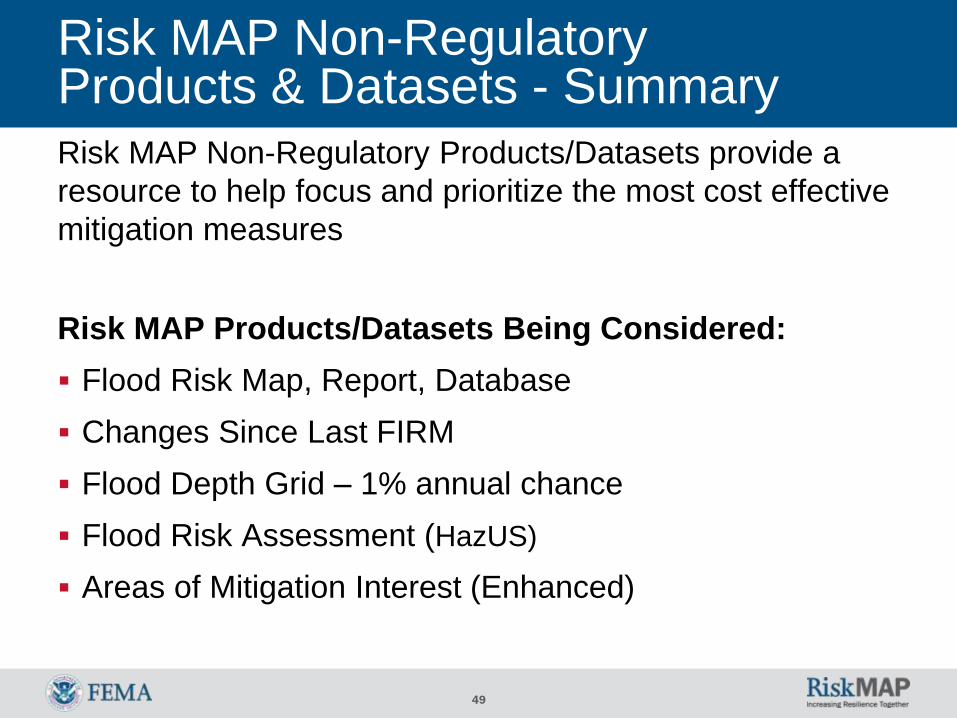
Risk MAP Non-Regulatory Products & Datasets - Summary
Risk MAP Non-Regulatory Products/Datasets provide a
resource to help focus and prioritize the most cost effective
mitigation measures
Risk MAP Products/Datasets Being Considered:
Flood Risk Map, Report, Database
Changes Since Last FIRM
Flood Depth Grid – 1% annual chance
Flood Risk Assessment (HazUS)
Areas of Mitigation Interest (Enhanced)

50
Mitigation Planning
Hazard Mitigation Plans:
• Guides your decisions on mitigation activities for all hazards you
face
• Are an important resource for responding to disasters
• Facilitates access to federal assistance for mitigation
We reviewed your mitigation plans and found that:
• Hudson County: 2009 Mitigation Plan:
Approved multi-jurisdictional plan
Adopted by all the communities
Expires on August 25, 2014

51
Hudson County, NJ Mitigation Plan Update

52
Mitigation Action
Risk MAP products/datasets will help identify new
mitigation actions or advance existing ones
Example Mitigation Actions
Land Use Ordinances
Zoning, Setbacks,
Floodplain Management, etc.
Local Building Codes
IBC, IRC, Local
Regulations, etc.
Mitigation Projects
Acquisition, Elevation,
Floodproofing, etc.
Community Identified Mitigation Programs
Management Best Practices
Integration of natural hazards into other
planning mechanisms

53
National Tool
The National Flood
Mitigation Data Collection
Tool (NFMDCT or NT) was
developed to gather
detailed specific
information about flood
prone structures in order
to determine appropriate
long-term mitigation
measures and mitigation
alternatives for flood
prone properties.

54
National Tool
Provides standardized,
systematic approach to collecting
and interpreting property data
and mitigation project
development.
Can gather flood risk, building
construction and building value
for any structure.
Provides ability to change to
information and correct errors
that are currently recorded within
the National Flood Insurance
Program (NFIP) dataset.
55
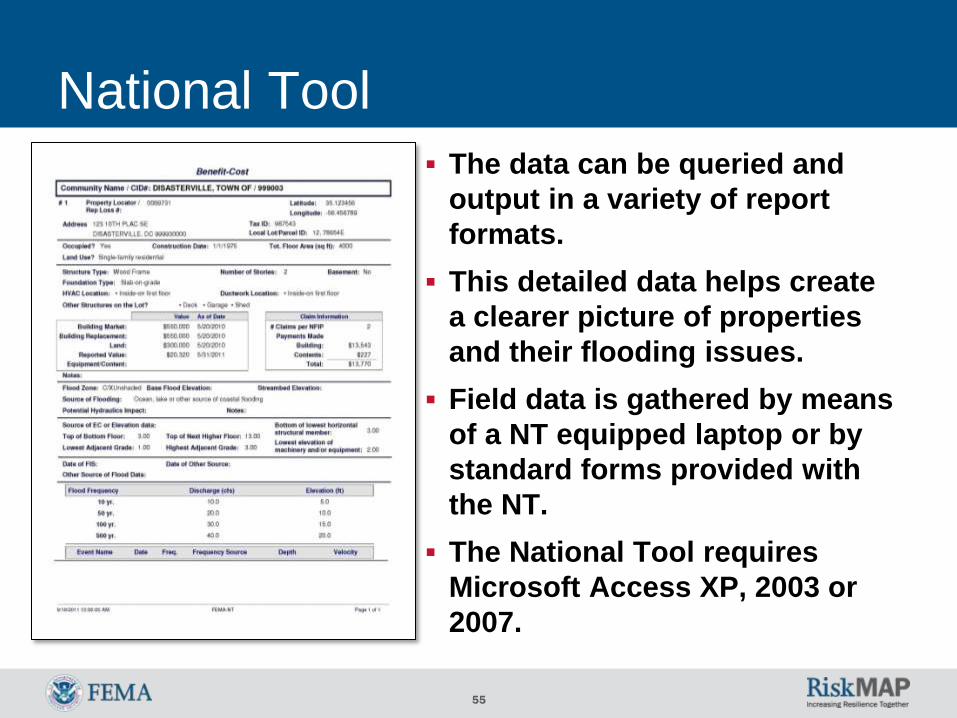
National Tool
The data can be queried and
output in a variety of report
formats.
This detailed data helps create
a clearer picture of properties
and their flooding issues.
Field data is gathered by means
of a NT equipped laptop or by
standard forms provided with
the NT.
The National Tool requires
Microsoft Access XP, 2003 or
2007.

56
Substantial Damage Estimator (SDE)
Substantial Damage
Estimator (SDE) offers a
formalized approach to
develop reasonable
estimates of building
values and the cost to
repair or reconstruct
buildings.
SDE is designed for use by
local officials or others
having some knowledge of
construction costs and
practices.
57
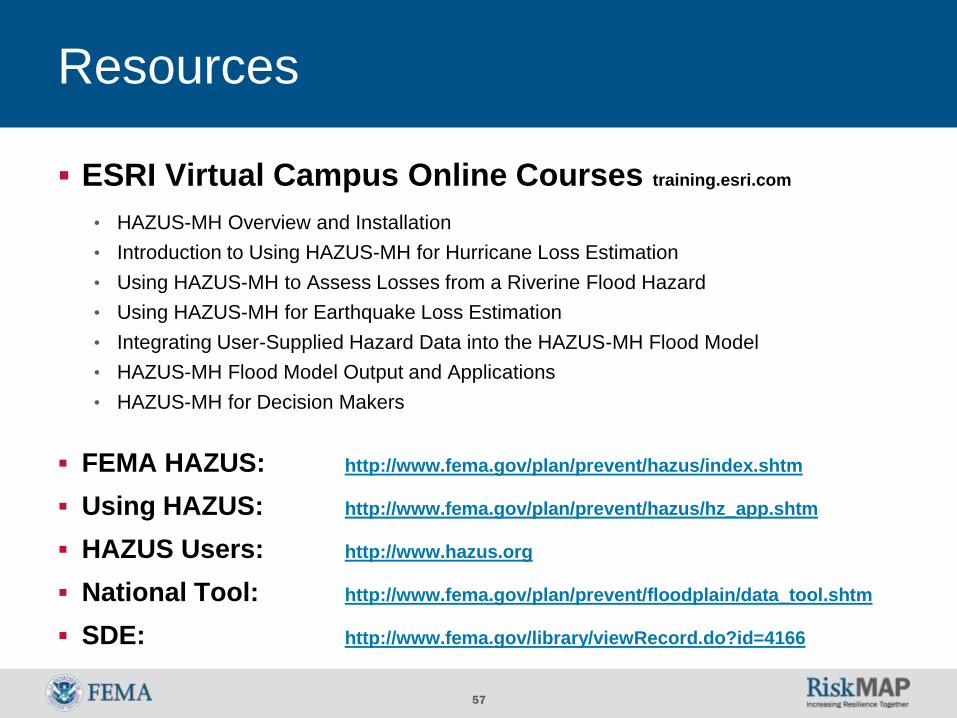
Resources
ESRI Virtual Campus Online Courses training.esri.com
• HAZUS-MH Overview and Installation
• Introduction to Using HAZUS-MH for Hurricane Loss Estimation
• Using HAZUS-MH to Assess Losses from a Riverine Flood Hazard
• Using HAZUS-MH for Earthquake Loss Estimation
• Integrating User-Supplied Hazard Data into the HAZUS-MH Flood Model
• HAZUS-MH Flood Model Output and Applications
• HAZUS-MH for Decision Makers
FEMA HAZUS: http://www.fema.gov/plan/prevent/hazus/index.shtm
Using HAZUS: http://www.fema.gov/plan/prevent/hazus/hz_app.shtm
HAZUS Users: http://www.hazus.org
National Tool: http://www.fema.gov/plan/prevent/floodplain/data_tool.shtm
SDE: http://www.fema.gov/library/viewRecord.do?id=4166

58
Substantial Damage Estimator (SDE)
Benefits and Limitations of the SDE Software
Benefits
• Provides a formalized approach to estimating SD
• Can be used for single-family homes, manufactured homes and
common non-residential structures
• Provides reasonable and defendable building values and damage
estimates
• Is a FEMA-acceptable method
Limitations
• Does not provide exact answers
• Does not provide a consistent approach for determining SD on a
community-wide basis (output depends on the local official using
the software)

NJ Disaster Recovery Efforts
Post-Irene
60
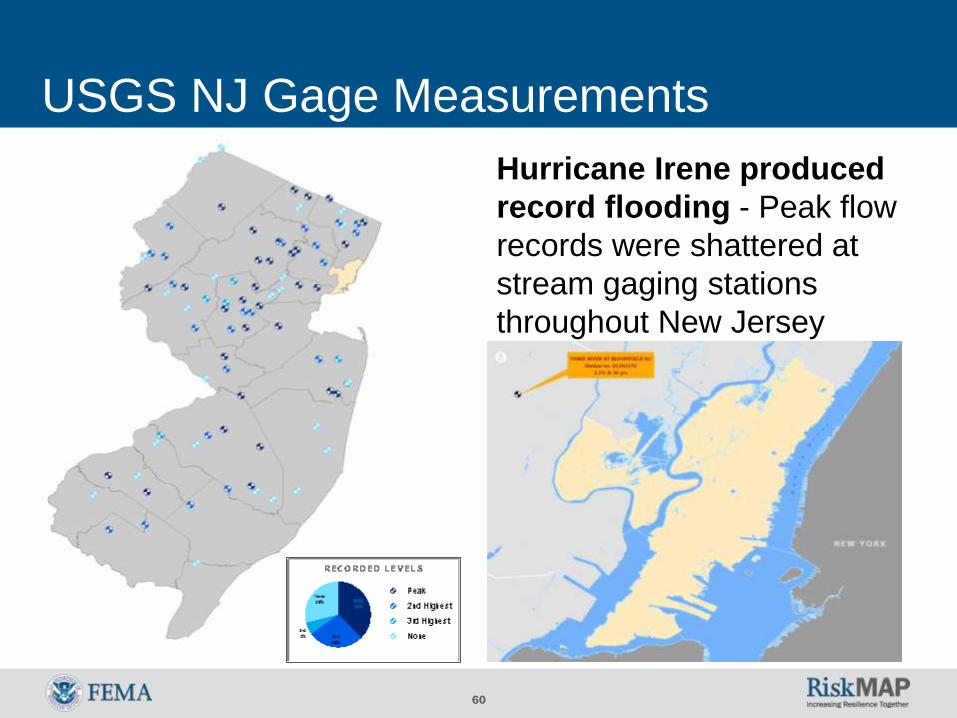
USGS NJ Gage Measurements
Hurricane Irene produced
record flooding - Peak flow
records were shattered at
stream gaging stations
throughout New Jersey

61
Hurricane Irene - Record Stream Gage Event
•Peak flow records were shattered at 38 of 93 gaging stations with
over 20 years of record including 7 gaging stations with 90 or
more years of record.
•30 gages recorded peaks greater then the 100 year event.
•10 of those 30 gages recorded peaks greater then the 500 year
event.

FEMA’s CNMS Program
Coordinated Needs Management Strategy

63
Coordinated Needs Management Strategy (CNMS) Overview
• FEMA’s geospatial flood hazard mapping
“inventory”
• Organizes, stores, and analyzes flood hazard
mapping needs information
• Influences map update funding allocation
decisions
• Standardizes how we collect map update data
before, during, and after map production
64
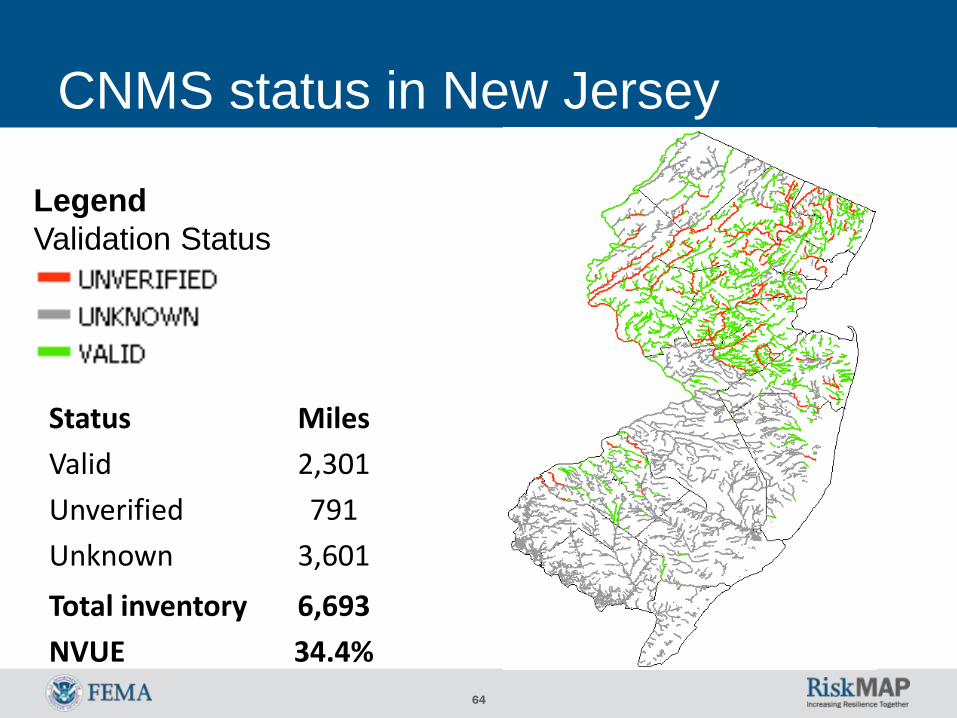
CNMS status in New Jersey
Legend
Validation Status
Status Miles
Valid 2,301
Unverified 791
Unknown 3,601
Total inventory 6,693
NVUE 34.4%

65
CNMS Request Website
RAMPP CNMS Request Creation:
• http://requests.rampp-cnms.com/
• Temporary Username: cnmsrequests
• Temporary Password: mapupdate

66
CNMS Data Viewer

67
Create CNMS Request Record

NJ / NYC Coastal Study
Status Update

69
Coastal and riverine analysis to be completed by the end
of 2012
Project Team
• Local Officials
• New Jersey Department of Environmental Protection
(Cooperating Technical Partner)
• FEMA
Risk Assessment, Mapping, and Planning Partners
(RAMPP), a joint venture of Dewberry, URS, and ESP
Regional Support Center
Hudson County Flood Study – Overview

70
Field survey for the approximately 11 miles of detailed
analysis for Passaic River has been completed.
Hydrology and Hydraulics processes are under way;
Coastal analyses are currently ongoing. Transect
(Coastal Cross Sections) layouts have been defined.
Obstructions have been modeled. Field reconnaissance
and surge has been completed. Overland analysis is in
progress
Hudson County Flood Study - Update On the Current Status

71
Hudson County Flood Study - Paneling Scheme
•Restudy of all coastal hazard zones
and Passaic River

72
Hudson County – Transect Layout

NJ / NYC Coastal Study
Risk Communications and Coastal Outreach Strategy

74
Risk Assessment:
• April, 2012: Hudson
• Feb, 2012: Monmouth & Middlesex & Union
• Dec, 2011: Atlantic & Cape May
NFIP & CRS:
• March, 2012: Ocean
Mitigation Planning:
• Dec, 2011: Ocean & Monmouth
Hazard Mitigation Assistance (HMA)
• Dec, 2011: Middlesex & Union
Introduction to Risk MAP
• July, 2011: Cape May, Atlantic, Ocean, Monmouth
• August, 2011: Middlesex, Union, Hudson
• Early 2011: Cumberland, Salem
• 2010: Morris, Bergen, Somerset, Essex, Passaic
NJ/NYC Coastal Outreach – Recent Activities

75
Coastal Study Technical Advisory Panel (TAP) Technical Advisory Panel (TAP) was established to engage subject
matter experts in coastal engineering analysis process
Meetings were held on:
4/14/2011
5/10/2011
11/10/2011
Some of the Members:
Academics:
Cousteau Institute under Rutgers University
Stevens Institute of Technology
Richard Stockton College of NJ
State and Local Governments
Other Federal Agencies

76
Coastal Outreach Advisory Team (COAT) The Coastal Outreach Advisory Team is being
established to support the New Jersey and New York City
Coastal Flooding Outreach and Education Program
Technical Advisory Panel (TAP) is focused on technical
aspects of the flood risk program
COAT will focus on the outreach elements of the program

77
Risk Communications
Federal/State/Local goals:
• To create safer communities and reduce risk to lives and
property
• To effectively communicate risk and increase public
awareness, leading citizens to make informed decisions
regarding their risk
Key factors contributing to successful achievement of these
goals are:
• Community engagement and exchange of flood risk
information
• Effective collaboration through partnerships
• Strategic communications plan development

78
Risk Communication Strategy Resources
Region II Coastal Website:
• www.Region2Coastal.com
Region III Coastal Website:
• www.R3Coastal.com
Region IV Coastal Website:
• http://www.southeastcoastalmaps.com
Region VI Coastal Website:
• http://www.txchart.com

79
Risk MAP Outreach Activities Schedule
Past:
• August, 2011: Introduction to Risk MAP
Current: April, 2012
• Risk Assessment
Future:
• July, 2012: Technical Details of the Study
• August, 2012: Hazard Mitigation Planning
• September, 2012: Hazard Mitigation Assistance (HMA)
• October, 2012: Risk Communication

80
Resources FEMA: www.fema.gov
Floodsmart, the official site of the National Flood Insurance Program
(NFIP): www.floodsmart.gov
Risk Assessment, Mapping and Planning Partners: www.RAMPP-team.com
NFIP Reform: www.fema.gov/business/nfip/nfip_reform.shtm
Hazus-MH software: http://www.fema.gov/plan/prevent/hazus/index.shtm
Hazus User Groups: http://www.fema.gov/plan/prevent/hazus/hz_users.shtm#4
National Tool software:
http://www.fema.gov/plan/prevent/floodplain/data_tool.shtm
Substantial Damage Estimator (SDE):
http://www.fema.gov/library/viewRecord.do?id=4166
Risk MAP Non-Regulatory Products: Appendix N and O
New Jersey Department of Environmental Protection - NFIP Coordinator
New Jersey State Office of Emergency Management

81
Questions & Feedback Please complete your survey. Your feedback is very important to us.
This presentation & hand-outs will be posted at: www.RAMPP-TEAM.com
Please explore the NJAFM website at: www.NJAFM.org
Contact Information
NJDEP
Joseph Ruggeri
NJDEP, Bureau of Dam Safety & Flood Control
Phone: 609-292-2296
NJDEP website: www.nj.gov/dep/floodcontrol
FEMA
Risk Analysis Risk Assessment / Engineer: Robert Schaefer / 212-680-8808 / [email protected]
Communications and Outreach Lead: William McDonnell / 212-680-3636 / [email protected]
Flood Insurance & Management: Kim Rizzo / 212-680-3637 / [email protected]
HAZUS & GIS: Brian Shumon / 212-680-3631 / [email protected] or
Thomas Song / 212-680-8519 / [email protected]
National Tool & SDE: Rich Einhorn / 212-680-8503 / [email protected] or
Seymour Smith / 212-680-8824 / [email protected]
HazUS Demonstration