risk assessment of - europa
TRANSCRIPT

European UnionRisk Assessment Report
hydrogen fluoride
EINECS No.: 231-634-8CAS No.: 7664-39-3
Institute for Health andConsumer Protection
EuropeanChemicalsBureau
Existing Substances
1st Priority List
Volume: 8EUROPEAN COMMISSIONJOINT RESEARCH CENTRE
EUR 19729 EN

European Union Risk Assessment Report
HYDROGEN FLUORIDE
CAS-No.: 7664-39-3
EINECS-No.: 231-634-8
RISK ASSESSMENT

LEGAL NOTICE
Neither the European Commission nor any personacting on behalf of the Commission is responsible for the use which might
be made of the following information
A great deal of additional information on the European Unionis available on the Internet.
It can be accessed through the Europa server(http://europa.eu.int).
Luxembourg: Office for Official Publications of the European Communities, 2001
ISBN 92-894-0485-X
European Communities, 2001Reproduction is authorised provided the source is acknowledged.
Printed in Italy
Cataloguing data can be found at the end of this publication
HYDROGEN FLUORIDE
CAS-No.: 7664-39-3
EINECS-No.: 231-634-8
RISK ASSESSMENT
Final report, October 2001
The Netherlands Rapporteur for the risk evaluation of Hydrogen Fluoride is the Ministry of Housing, Spatial Planning and the Environment (VROM) in consultation with the Ministry of Social Affairs and Employment (SZW) and the Ministry of Public Health, Welfare and Sport (VWS). Responsible for the risk evaluation and subsequently for the contents of this report, is the rapporteur. The scientific work on this report has been prepared by the Netherlands Organisation for Applied Scientific Research (TNO) and the National Institute of Public Health and the Environment (RIVM), by order of the rapporteur. Contact point: Chemical Substances Bureau P.O. Box 1 3720 BA Bilthoven The Netherlands

Date of Last Literature Search : 1998 Review of report by MS Technical Experts finalised: December 1999 Final report: October 2001
V
Foreword We are pleased to present this Risk Assessment Report which is the result of in-depth work carried out by experts in one Member State, working in co-operation with their counterparts in the other Member States, the Commission Services, Industry and public interest groups. The Risk Assessment was carried out in accordance with Council Regulation (EEC) 793/93
1 on
the evaluation and control of the risks of “existing” substances. “Existing” substances are chemical substances in use within the European Community before September 1981 and listed in the European Inventory of Existing Commercial Chemical Substances. Regulation 793/93 provides a systematic framework for the evaluation of the risks to human health and the environment of these substances if they are produced or imported into the Community in volumes above 10 tonnes per year. There are four overall stages in the Regulation for reducing the risks: data collection, priority setting, risk assessment and risk reduction. Data provided by Industry are used by Member States and the Commission services to determine the priority of the substances which need to be assessed. For each substance on a priority list, a Member State volunteers to act as “Rapporteur”, undertaking the in-depth Risk Assessment and recommending a strategy to limit the risks of exposure to the substance, if necessary. The methods for carrying out an in-depth Risk Assessment at Community level are laid down in Commission Regulation (EC) 1488/94
2, which is supported by a technical guidance document
3.
Normally, the “Rapporteur” and individual companies producing, importing and/or using the chemicals work closely together to develop a draft Risk Assessment Report, which is then presented at a Meeting of Member State technical experts for endorsement. The Risk Assessment Report is then peer-reviewed by the Scientific Committee on Toxicity, Ecotoxicity and the Environment (CSTEE) which gives its opinion to the European Commission on the quality of the risk assessment. If a Risk Assessment Report concludes that measures to reduce the risks of exposure to the substances are needed, beyond any measures which may already be in place, the next step in the process is for the “Rapporteur” to develop a proposal for a strategy to limit those risks. The Risk Assessment Report is also presented to the Organisation for Economic Co-operation and Development as a contribution to the Chapter 19, Agenda 21 goals for evaluating chemicals, agreed at the United Nations Conference on Environment and Development, held in Rio de Janeiro in 1992. This Risk Assessment improves our knowledge about the risks to human health and the environment from exposure to chemicals. We hope you will agree that the results of this in-depth study and intensive co-operation will make a worthwhile contribution to the Community objective of reducing the overall risks from exposure to chemicals.
1 O.J. No L 084 , 05/04/199 p.0001 – 0075
2 O.J. No L 161, 29/06/1994 p. 0003 – 0011
3 Technical Guidance Document, Part I – V, ISBN 92-827-801 [1234]

VII
0 OVERALL RESULTS OF THE RISK ASSESSMENT
CAS-No. 7664-39-3 EINECS-No. 231-634-8 IUPAC-name hydrogen fluoride Environment ( ) There is need for further information and/or testing ( ) There is at present no need for further information and/or testing or for risk reduction
measures beyond those which are being applied (X) There is a need for limiting the risks: risk reduction measures which are already being
applied shall be taken into account Conclusion iii) is reached because: - for a number of HF producing and HF using sites the local environmental risk
characterisation points to risks for either 1) the aquatic compartment, or 2) the atmospheric compartment or 3) livestock and wildlife exposed via air.
Man indirectly exposed via the environment ( ) There is need for further information and/or testing ( ) There is at present no need for further information and/or testing or for risk reduction
measures beyond those which are being applied (X) There is a need for limiting the risks: risk reduction measures which are already being
applied shall be taken into account
Conclusion iii) is reached because: - for one HF using site the local environmental risk characterisation indicates a significant
risk for humans indirectly inhalatory exposed via the environment Consumers ( ) There is need for further information and/or testing ( ) There is at present no need for further information and/or testing or for risk reduction
measures beyond those which are being applied (X) There is a need for limiting the risks: risk reduction measures which are already being
applied shall be taken into account Conclusion iii) is reached because of concerns for skin irritation and/or corrosivity, depending on concentration, as a consequence of single exposure to the hydrogen fluoride liquid arising from the use of HF containing rust cleaning and stone and wood cleaning agents.

VIII
Workers ( ) There is need for further information and/or testing ( ) There is at present no need for further information and/or testing or for risk reduction
measures beyond those which are being applied (X) There is a need for limiting the risks: risk reduction measures which are already being
applied shall be taken into account Conclusion iii) is reached because: - the general warnings on (1) the formation of H2 by reaction of HF solutions of less than
65% with metals, and (2) on the violent behaviour upon dilution of concentrated HF with water, should be included in all MSDSs.
- concerns for skin and respiratory tract irritation and/or corrosivity, depending on concentration, as a consequence of repeated exposure to gaseous hydrogen fluoride at production and use as an intermediate in the chemical industry and use of aqueous HF-solutions.
- concerns for general systemic toxicity as a consequence of repeated inhalatory exposure arising from the use of aqueous HF-solutions.
- concerns for skin irritation and/or corrosivity, depending on concentration, as a consequence of single exposure to the hydrogen fluoride liquid arising from the use of aqueous HF-solutions.
- concerns for respiratory tract irritation and/or corrosivity, depending on concentration, as a consequence of single exposure to gaseous hydrogen fluoride at production and use as an intermediate in the chemical industry and at the use of aqueous HF-solutions.

IX
Table 0.A Overview of conclusions with respect to occupational risk characterisation
End-point conclusions valid for the occupational scenario’s
scenario 1 scenario 2
MOS conclusion MOS conclusion
acute toxicity - dermal - inhalation (LC50, 1 hr, 280-1900 mg/m3)
na
>112
ii ii
na
>47
ii ii
irritation, single exposure, liquid HF - dermal
na
ii
na
iii
irritation, single exposure, gaseous HF - dermal - inhalation - eyes
na na na
ii iii ii
na na na
ii iii ii
irritation, repeated exposure, liquid HF - dermal
na
ii
na
ii
irritation, repeated exposure, gaseous HF - dermal (LOAEL 1.16 mg/m3, human study) - inhalation (LOAEL 1.16 mg/m3, human study) - eyes (LOAEL 1.16 mg/m3, human study)
0.5 0.5 0.5
iii iii iii
0.2 0.2 0.2
iii iii iii
sensitisation na ii na ii
repeated dose toxicity, systemic effects - dermal (NOAEL 0.48 mg/m3, epi-study workers) - inhalation (NOAEL 0.48 mg/m3, epi-study workers)
not relevant
1
ii ii
24 0.2
ii iii
Mutagenicity na ii na ii
Carcinogenicity na ii na ii
reproductive toxicity, developmental effects na ii na ii
reproductive toxicity, fertility effects - dermal (10 mg/kg b.w./d, oral 2-gen study with NaF) - inhalation (10 mg/kg b.w./d, oral 2-gen study with NaF)
not relevant
50
ii ii
15 10
ii ii
Flammability na ii na ii
explosive properties na ii na ii
oxidising properties na iiia na iiia
na = Not applicable aFormation of H2 by reaction of HF-solutions of less than 65% with metals, and violent behaviour upon dilution of concentrated HF with water


1
CONTENTS
1 GENERAL SUBSTANCE INFORMATION................................................................................................. 4
2 GENERAL INFORMATION ON EXPOSURE ............................................................................................ 6
2.1 PRODUCTION ........................................................................................................................................ 6
2.2 USE PATTERN........................................................................................................................................ 7 3 ENVIRONMENT ............................................................................................................................................. 8
3.1 EXPOSURE ASSESSMENT................................................................................................................... 8 3.1.1 General .......................................................................................................................................... 8 3.1.2 Aquatic compartment...................................................................................................................... 8
3.1.2.1 Release and fate ................................................................................................................ 8 3.1.2.2 Ambient and natural background concentrations.............................................................. 8 3.1.2.3 Accumulation.................................................................................................................... 9
3.1.3 Terrestrial compartment.................................................................................................................. 9 3.1.3.1 Release and fate ................................................................................................................ 9 3.1.3.2 Ambient and natural background concentrations.............................................................. 9 3.1.3.3 Accumulation.................................................................................................................... 10
3.1.4 Atmosphere..................................................................................................................................... 10 3.1.4.1 Release and fate ................................................................................................................ 10 3.1.4.2 Ambient and natural background concentrations.............................................................. 10 3.1.4.3 Accumulation.................................................................................................................... 11
3.1.5 Non compartment specific exposure relevant to the food chain ..................................................... 11 3.1.6 Emissions........................................................................................................................................ 12
3.1.6.1 General ............................................................................................................................. 12 3.1.6.2 Emission reduction during production and use................................................................. 18 3.1.6.3 Predicted Environmental Concentrations ......................................................................... 19
3.2 EFFECTS ASSESSMENT ...................................................................................................................... 27
3.2.1 Aquatic compartment...................................................................................................................... 27 3.2.1.1 Toxicity to fish.................................................................................................................. 27 3.2.1.2 Toxicity to aquatic invertebrates (e.g. Daphnia)............................................................... 28 3.2.1.3 Toxicity to algae ............................................................................................................... 29 3.2.1.4 Toxicity to micro-organisms............................................................................................. 30 3.2.1.5 PNEC for the aquatic compartment .................................................................................. 31
3.2.2 Terrestrial compartment.................................................................................................................. 32 3.2.2.1 Toxicity to soil organisms ................................................................................................ 32 3.2.2.2 Toxicity to micro-organisms............................................................................................. 33 3.2.2.3 PNEC for the terrestrial compartment .............................................................................. 33
3.2.3 Atmosphere..................................................................................................................................... 33 3.2.3.1 Toxicity to plants .............................................................................................................. 33 3.2.3.2 Toxicity to invertebrates ................................................................................................... 34 3.2.3.3 PNEC for the atmosphere ................................................................................................. 34
3.2.4 Non compartment specific effects relevant to the food chain......................................................... 35
3.3 RISK CHARACTERISATION .............................................................................................................. 37 3.3.1 General .......................................................................................................................................... 37 3.3.2 Aquatic compartment...................................................................................................................... 37 3.3.3 Atmosphere..................................................................................................................................... 39 3.3.4 Terrestrial compartment.................................................................................................................. 40 3.3.5 Non compartment specific effects relevant to the food chain......................................................... 41

2
4 HUMAN HEALTH .......................................................................................................................................... 42
4.1 HUMAN HEALTH (TOXICITY) .......................................................................................................... 42 4.1.1 Exposure Assessment ..................................................................................................................... 42
4.1.1.1 General discussion............................................................................................................ 42 4.1.1.2 Occupational exposure...................................................................................................... 42 4.1.1.3 Consumer exposure .......................................................................................................... 53 4.1.1.4 Indirect exposure via the environment.............................................................................. 53
4.1.1.4.1 Fluoride exposure from air.............................................................................. 53 4.1.1.4.2 Comparison of inhalatory exposure to fluoride with intake
via food and water........................................................................................... 56 4.1.1.5 Combined exposure .......................................................................................................... 57
4.1.2 Effect assessment............................................................................................................................ 57 4.1.2.1 Toxicokinetics, metabolism, and distribution ................................................................... 57 4.1.2.2 Acute toxicity ................................................................................................................... 59 4.1.2.3 Irritation............................................................................................................................ 61 4.1.2.4 Corrosivity ........................................................................................................................ 63 4.1.2.5 Sensitisation...................................................................................................................... 63 4.1.2.6 Repeated dose toxicity...................................................................................................... 64 4.1.2.7 Mutagenicity..................................................................................................................... 70 4.1.2.8 Carcinogenicity................................................................................................................. 72
4.1.3 Risk characterisation....................................................................................................................... 85 4.1.3.1 General aspects ................................................................................................................. 85 4.1.3.2 Workers ............................................................................................................................ 87 4.1.3.3 Consumers ........................................................................................................................ 96 4.1.3.4 Man exposed indirectly via the environment.................................................................... 96 4.1.3.5 Combined exposure ............................................................................................................ 99
4.2 HUMAN HEALTH (PHYSICO-CHEMICAL PROPERTIES) ............................................................ 99
5 RESULTS.......................................................................................................................................................... 100 6 References ........................................................................................................................................................ 103 GLOSSARY.......................................................................................................................................................... 112 EUSES Calculations can be viewed as part of the report at the website of the European ChemicalsBureau: http://ecb.ei.jrc.it Annex 1 The occurrence of HF in products according to the Swedish product register (KEMI, 1995) ... 115 Annex 2 Measured Occupational exposure levels of HF measured ............................................................ 116 Annex 3 Establishment of the minimal MOSs used for the risk characterisation by the Netherlands.... 118 Annex 4 Information from the Anti-poison Centre in Belgium on accidents with HF containing
products (as annexed to SZV&W, 1999) ........................................................................................ 120

TABLES
Table 0.A Overview of conclusions with respect to occupational risk characterisation ........................................................... IX Table 2.1 Production sites of HF in the EU (CTEF 1995) ........................................................................................................ 6 Table 2.2 HF production plant size distribution for 1994 (source: fax CEFIC 11-12-1995) ..................................................... 6 Table 2.3 Industrial and use categories of HF ......................................................................................................................... 7 Table 2.4 Users of HF in organofluor compound and inorganic fluorides production (CTEF 1995) ........................................ 7 Table 3.1 Aquatic emissions from HF industry and major users of HF in the EU .................................................................... 13 Table 3.2 Atmospheric gaseous F emissions (mainly HF) from HF industry and major users of HF in the EU....................... 15 Table 3.3 Fluoride emissions in The Netherlands in 1992 in kg/year (VROM 1992) ............................................................... 17 Table 3.4 Distribution (in %) of F-emissions in The Netherlands in 1992 (VROM 1992)........................................................ 18 Table 3.5 Calculated local water concentrations (F-) and corresponding data for each HF plant............................................ 21 Table 3.6 Calculated local atmospheric HF concentrations for each production and end use plant ....................................... 24 Table 3.7 Measured HF concentrations in air around emission sources in Canada (CEPA 1993) ......................................... 25 Table 3.8 Short-term toxicity data of fluoride for freshwater fish.............................................................................................. 27 Table 3.9 Short-term toxicity data of fluoride for freshwater invertebrates .............................................................................. 28 Table 3.10 Short-term toxicity of fluoride to marine invertebrates ............................................................................................. 28 Table 3.11 Long-term toxicity of fluoride to freshwater invertebrates ........................................................................................ 29 Table 3.12 EC50-values of fluoride for freshwater algae ............................................................................................................ 29 Table 3.13 NOEC-values of fluoride for freshwater algae ......................................................................................................... 30 Table 3.14 Toxicity of fluoride to marine algae .......................................................................................................................... 30 Table 3.15 Toxicity of fluoride to micro-organisms .................................................................................................................... 31 Table 3.16 Long-term toxicity of fluoride to soil organisms........................................................................................................ 32 Table 3.17 Toxicity data of fluoride to soil microbial processes................................................................................................. 33 Table 3.18 NOEC-values for HF (in mg/m3) for plants............................................................................................................... 34 Table 3.19 NOEC values (in mg F/kg dry weight) for cattle with respect to the fluoride content of feed (total diet) .................. 36 Table 3.20 Local PEC-values and PEC/PNEC-ratios for the aquatic compartment .................................................................. 38 Table 3.21 Local PEC-values and PEC/PNEC ratios for the atmosphere ................................................................................. 40 Table 4.1 Conclusions of the occupational exposure assessment .......................................................................................... 52 Table 4.2 Summary of measured local .................................................................................................................................... 54 Table 4.3 Summary of calculated local atmospheric PEC-values and actual intakes ............................................................. 55 Table 4.4 Fluoride exposure through food and water .............................................................................................................. 56 Table 4.5 Estimates of total daily fluoride intake of adults ....................................................................................................... 56 Table 4.6 Acute inhalatory toxicity of Hydrgen Fluoride........................................................................................................... 59 Table 4.7 Repeated dose toxicity............................................................................................................................................. 64 Table 4.8 Exposure levels to workers ...................................................................................................................................... 66 Table 4.9 Concentrations of air contaminants in an aluminium smelter .................................................................................. 67 Table 4.10 Genotoxicity of Hydrogen Fluoride........................................................................................................................... 70 Table 4.11 Genotoxicity of Sodium Fluoride .............................................................................................................................. 71 Table 4.12 Reproductive and developmental toxicity ................................................................................................................ 76 Table 4.13 Occupational risk characterisation of HF for local effects on respiratory tract and skin after repeated ................... 89 exposure to gaseous HF ......................................................................................................................................... 89 Table 4.14 Occupational risk characterisation of HF for repeated dose toxicity (systemic effects) ........................................... 93 Table 4.15 Occupational risk characterisation of HF for reproduction effects ........................................................................... 95 Table 4.16 Margin of Safety (from measured data) ................................................................................................................... 96 Table 4.17 Margin of safety (from calculated data).................................................................................................................... 98 Table 5.1 Overview of conclusions with respect to occupational risk characterisation ............................................................ 102 Table A1 Trades that use products containing HF and product functions ............................................................................... 115 Table A2 Measured occupational exposure levels of HF measured ....................................................................................... 116 Table A3 Assessment factors applied for the calculation of the minimal MOS for local .......................................................... 118 effects on skin and respiratory tract due to single exposure to gaseous HF............................................................ 118 Table A4 Assessment factors applied for the calculation of the minimal MOSs for chronic inhalation and dermal................. 118 exposure applicable on the NOAEL from the epidemiological study........................................................................ 118 Table A5 Assessment factors applied for the calculation of the minimal MOSs for inhalation and dermal exposure ............. 119 applicable on the NOAEL from the reproduction study ............................................................................................ 119

4
1 GENERAL SUBSTANCE INFORMATION Identification of the substance CAS-No.: 7664-39-3 EINECS-No.: 231-634-8 IUPAC name: hydrogen fluoride Synonyms: hydrofluoric acid anhydrous hydrofluoric acid Molecular formula: HF Structural formula: H - F Molecular weight: 20.01 Purity/impurities, additives Purity: >99.9% (w/w) Impurity: <1% water Additives: none Physico-chemical properties Physical state: liquid/gas Melting point: - 83oC Boiling point: 19.5oC at 1013 hPa Relative density: 1.016 g/cm3 at 0oC (liquid) 0.901 g/cm3 at 22oC (liquid) Vapour pressure: 1033 hPa at 20oC Water solubility: miscible in all proportions Partition coefficient n-octanol/water (log-value): - 1.4 Granulometry: not applicable Flammability: non-flammable
4
Explosive properties: non-explosive 1 Oxidising properties: not oxidising in the sense of reaction with oxygen1 Conversion factors: 1 mg/m3 = 1.22 ppm (101 kPa, 25oC) 1 ppm = 0.82 mg/m3 (101 kPa, 25oC) Odour threshold: 30 �g/m3 These data are based on references as mentioned in the HEDSET and Van Gemert and Nettenbreijer (1977). Remark 1 Hydrofluoric acid with concentrations of less than about 65% reacts with metals (e.g. iron from steel drums or from reactors) under the formation of H2. Mixtures of H2 in air can be explosive.
4See remark 1

CHAPTER 1. GENERAL SUBSTANCE INFORMATION
5
Remark 2 High heat of dilution may cause violent behaviour upon dilution of concentrated HF with water. Remark 3 There are no R- and S-sentences appropriate for the properties as mentioned in remark 1 and 2. Therefore it is recommended to include these remarks in the Material Safety Data Sheets. Classification Classification according to Annex I Symbol T+, C R-phrases: 26/27/28 - 35 S-phrases: 7/9 - 26 - 36/37/39 - 45 Proposal of the rapporteur: agreement with Annex I (see above), with the addition of R54 (Toxic to plants). It must be noted that HF is very toxic to plants and is a possible candidate for R54 (toxic to plants). Since no criteria have been established yet this R-phrase cannot be assigned yet.

6
2 GENERAL INFORMATION ON EXPOSURE 2.1 PRODUCTION The production of HF is located at different sites in the European Union (see Table 2.1). Table 2.1 Production sites of HF in the EU (CTEF 1995)
Company Location
ICI Chemicals & Polymers Limited Runcorn (Cheshire), United Kingdom
Laporte Fluorides Rotherham, United Kingdom
Bayer AG Leverkusen, Germany
Rhone-Poulenc Chimie Salindres, France
Rhodia LTD Avonmouth, United Kingdom
Ausimont Porto Marghera, Italy
Derivados del Fluor S.A. Onton/Bilbao, Spain
Elf Atochem Pierre Benite, France
Solvay Fluor und Derivate GmbH Bad Wimpfen, Germany
Allied Signal Europe bv Weert, the Netherlands
Fluorchemie Dohna* Dohna, Germany
Fluorchemie Stulln* Stulln, Germany
SICNG Thessaloniki, Greece
Soderec* Pierre Latte, France
Riedel-de Haën AG Seelze, Germany
*Company which did not provide a Hedset (production <1000 t/a?) Table 2.2 HF production plant size distribution for 1994 (source: fax CEFIC 11-12-1995)
Tons Number of reporting companies
Production size
30,000-35,000 1 30,000 - 35,000
25,000-30,000 2 50,000 - 60,000
20,000-25,000 3 60,000 - 75,000
15,000-20,000 0 -
10,000-15,000 1 10,000 - 15,000
5,000-10,000 3 15,000 - 30,000
Less than 5,000 6 unknown - 30,000
Total 16 >165,000 - 245,000 The maximum total production of HF in the European Union for 1994 is 245,000 tonnes (see Table 2.2). There are no import or export data available. The raw material for the production of HF is the mineral fluorspar (30-60% CaF2), which is treated with acids to the so-called acid spar quality (about 97% CaF2). HF is produced by the conversion of dried acid spar with concentrated

CHAPTER 2. GENERAL INFORMATION ON EXPOSURE
7
sulphuric acid at elevated temperatures. The volatile HF formed is condensed and purified by distillation (VDI 1987). 2.2 USE PATTERN Table 2.3 shows the industrial and use categories of HF. Anhydrous HF and hydrofluoric acid is used for the production of organofluor compounds and inorganic fluorides, as well as a catalyst of alkylation reactions in the petrochemical industry. It is also used for etching of glass and pickling of stainless steel. The two main types of use categories for HF can be characterised as use in closed systems and non dispersive use. Paragraphs 4.1.1.0 and 4.1.1.1 contain more detailed information on the usages of HF. The quantitative estimate currently available for the industrial and use category distribution of HF is 60% for the synthesis of organofluor compounds, 30% as intermediate in chemical synthesis of inorganic fluorides, 4% as pickling agent of metal surfaces, 3% for etching of glass surfaces, and 2% as catalyst in alkylation reactions in the petrochemical industry (CTEF 1995). Data of one factory showed a different pattern for the industrial and use category distribution: 10% as pickling agent for metal surfaces, 10% for etching glass surfaces, 10% as catalyst in petrochemical industry, and 70% of the produced quantity as intermediate in chemical synthesis. In Sweden more than 99% of the imported HF is used for pickling of steel (Kemi 1995). Table 2.3 Industrial and use categories of HF
Industrial category EC No. Use category EC No.
Chemical industry: basic chemicals 2
Chemical industry: used in synthesis 3 Intermediates 33
Mineral oil and fuel industry 9 Process regulators (catalysts) 43
Metal extraction, refining and processing 8 Others: descaling and pickling of steel 55
Others: mining industry 15 Other: special metal extraction 55
Others: electrotechnical industry 15 electroplating agents 17
Others: Glass industry 15 Others: frosting, etching and polishing 55 Major users of HF as an intermediate for the production of organofluor compounds and inorganic fluorides are shown in Table 2.4.
Table 2.4 Users of HF in organofluor compound and inorganic fluorides production (CTEF 1995)
Company Location
Dupont Dordrecht, the Netherlands
Ausimont Porto Marghera/Spinetta Marengo, Italy
Elf Atochem Pierre Benite, France
Hoechst (owned by Solvay now) Frankfurt, Germany
ICI Runcorn, United Kingdom
Solvay Tavaux, France
8
3 ENVIRONMENT 3.1 EXPOSURE ASSESSMENT 3.1.1 General HF may enter the environment from both natural (volcanoes, weathering of minerals and marine aerosols) and anthropogenic sources. The latter includes production of HF itself, but HF is also formed as a by-product during other industrial processes (phosphate fertiliser, aluminium and steel production, ceramic industry etc.). The contribution of HF emissions from the HF industry is limited compared to those from other industrial sources (see paragraph 3.3.1). Once released in the environment HF is unlikely to remain in its original form for very long. In air, water and soil HF is transformed to a variety of other F-compounds. This transformation of HF in the environment will be discussed in more detail in the subsequent paragraphs. An extensive overview of the fate of fluorides is given in the RIVM Criteria Document on Fluorides (Slooff et al. 1988). 3.1.2 Aquatic compartment 3.1.2.1 Release and fate HF (F) enters the aquatic environment via industrial waste water, atmospheric deposition or runoff from fertilisers and F-containing sludge. Freshwater In fresh water at pH above 5, the free ion is the main fluoride species. At lower pH, the proportion of fluoride ion decreases, while HF2
- and non-dissociated HF increase. In the presence of phosphate insoluble fluorapatite is formed, a large part of which is transferred to the bottom sediments (Sloof et al. 1988). Seawater In seawater fluoride belongs to the macrocomponents; the total fluoride content is divided in 51% F-, 47% MgF+, 2% CaF+, and traces of HF and HF2
- (Sloof et al. 1988). 3.1.2.2 Ambient and natural background concentrations The concentration of fluoride in natural waters depends on the geological, physical and chemical characteristics at the location. In surface waters that are not influenced by F-containing rock formations, the natural F-concentration is between 0.01 and 0.3 mg/l (Sloof et al. 1988). In surface waters influenced by F-containing rock formations the natural F-concentration is considerably higher. Water of small rivers in the highlands of Germany (e.g. Black Forest) contain up to 4.7 mg/l (Geochemischer Atlas 1985). High fluoride levels (>20 mg/l) are also reported in natural waters from other European countries (WHO 1970). Mean F-concentrations in the Netherlands are 0.2 mg/l (Rhine-IJssel) and 0.2 to 1.7 mg/l in the river Meuse with seasonal variations. In waters in the Dutch province Zeeland, concentrations vary between 1.0 and 9.5 mg/l (Slooff et al. 1988).

CHAPTER 3. ENVIRONMENT
9
In seawater, F-concentrations are higher than in freshwater with an average of 1.4 mg/l (Slooff et al. 1988). 3.1.2.3 Accumulation Bioaccumulation Freshwater In aquatic organisms fluoride accumulates primarily in the exoskeleton of crustacea and in the bones of fish. No F accumulation was reported in edible tissues. In fish, BCF-values of 53-58 (d.w.) and <2 (w.w.) were found (Slooff et al. 1988). In crustacea BCF-values based on whole body fluoride content are found to be < 1 (based on dry weight). The highest reported BCF-values for mollusca and aquatic macrophyta were 3.2 and 7.5 (w.w.), respectively (Chaisemartin). Seawater In an experimental marine ecosystem with fish, crustaceans and plants, F was found to accumulate in all species. The highest value, 149, was found in fish. BCF-values for crustacea range from 27 to 62 (Hemens and Warwick 1972). Fluoride concentrations up to 30 mg F/kg were found in consumption fish (Slooff et al. 1988). 3.1.3 Terrestrial compartment 3.1.3.1 Release and fate Besides naturally occurring fluoride, fluoride may enter the terrestrial environment via atmospheric deposition, fluoride containing sludge or phosphate fertilisers. The dry deposition for the whole Netherlands is calculated to be 30 and 1 mg/m2 per year for gaseous and aerosol fluoride, respectively. Corrected for the whole area, this is 1300 tonnes per year. The wet deposition in the Netherlands is calculated to be 13 and 4 mg/m2 for gaseous and aerosol fluoride, respectively. The total wet deposition ranges from 700 to 1100 tonnes per year (Slooff et al. 1988). In soils (pH<6) fluor is predominantly found in bound form in fluoride containing minerals as fluorspar, cryolite and apatite, and clay minerals. Therefore fluoride is immobile in soils, but leaching to the B horizon is possible in soils with a low clay content. A direct consequence of the strong complex forming properties of fluoride is that with increasing F concentrations in pore water or groundwater, the Al and Fe concentrations also increase. In addition, a positive correlation was found between the concentration of fluoride and that of organic carbon in the soil solution, which may indicate that fluoride also forms complexes with carbon. At a pH above 6, the fluoride ion is the dominant species. 3.1.3.2 Ambient and natural background concentrations The mean fluoride content of mineral soils is 200-300 mg/kg, whereas that of organic soils is usually lower (97). In the Netherlands fluoride concentrations in clay soils range from 80 to

EU RISK ASSESSMENT – HYDROGEN FLUORIDE FINAL REPORT, OCTOBER 2001
10
700 mg/kg (d.w.). In soils with higher pH values a higher amount of soluble F-complexes is found. In the USA average soil fluoride concentrations are 340 mg/kg in the east and 410 mg/kg in the west. The F-concentration increases with the soil depth; at a depth of 0-8 cm 190 mg/kg and at a depth of 8-25 cm averages of 292 mg/kg are found (Slooff et al. 1988). Fluoride content in groundwater depends on many factors such as geological, chemical and physical characteristics of the water-supplying area, the consistency of the soil, the temperature, the pH, the depth of the well etc. Groundwater concentrations range within wide limits, from <1 to 25 mg or more per litre in India, Kenya and South Africa (97). Mean F-concentrations in Dutch groundwater are <0.01-1.5 mg/l (pH > 6) and < 0.01-0.58 mg/l (pH <6) (Stuyfzand 1991). In Germany concentrations of 0.07-0.13 mg/l are measured in the riverbank groundwater of the Rhine (Slooff et al. 1988). In the USA fluoride levels in groundwater range from 0.02 to 1.5 mg/l. 3.1.3.3 Accumulation Bioaccumulation Earthworms collected from F-polluted sites reflected F contamination very well. At the highest polluted sites the F content in worms reached values of up to 135 mg/kg (without gut), whereas worms from unpolluted sites showed contents of 6-14 mg/kg. The F content in the whole worm from unpolluted sites was found to be much higher and reached values up to 150 mg/kg. This was due to the fluoride content of soil contained in the gut (Breimer et al. 1989). Woodlice (Oniscus asellus, Porcellio scaber) from different sites in the vicinity of a F-producing plant showed F-contents ranging from 90 to 1800 mg/kg (d.w.) in O. asellus and from 240 to 1360 mg/kg (d.w.) in P. scaber. F levels in animals collected from control site were 35 and 180 mg/kg, respectively (Janssen et al. 1989). The most important F exposure route for plants is uptake from the atmosphere. Atmospheric accumulation is described in 3.1.3.3. Fluoride uptake by plants from soil may also occur, but the (bio)availability of fluoride in soil is usually low. The application of fluoride containing sludge or phosphate fertilisers may lead to considerable increase of F-concentrations in plants, dependent on soil characteristics and pH (Slooff et al. 1988). 3.1.4 Atmosphere 3.1.4.1 Release and fate Fluorides are emitted to the atmosphere as gaseous compounds (75%) or as solids in the form of aerosols (25%). In the Netherlands the atmospheric F-concentrations originate for approximately 70% from outside the country. Gaseous fluorides in the atmosphere are predominantly HF (and SiF4). HF is removed relatively rapidly from the atmosphere by both wet and dry deposition. Gaseous fluoride is eliminated from the atmosphere by both dry and wet deposition with a half-life of ca. 14 hours and ca. 12 hours for dry and wet deposition, respectively. Fluoride aerosol is eliminated slowly predominantly (65%) by wet deposition with a half-life of 50 hours. For dry deposition of fluoride aerosol a half life of 12 days is reported (Slooff et al. 1988).

CHAPTER 3. ENVIRONMENT
11
3.1.4.2 Ambient and natural background concentrations
The natural occurring background concentration of fluoride is calculated to be 0.0005 µg/m3.Taking into account the anthropogenic emissions the world-wide background concentration isestimated to be 0.003 µg/m3 (Slooff et al. 1988).
Air concentrations measured in the Netherlands for 1982-1983 range from 0.03-0.1 µg/m3 with thehighest concentrations in the south-west. Mean concentration for the whole country is 0.07 µg/m3
(Slooff et al. 1988).
For the area of Greater Cologne (671 km2) in Germany measurements of fluorides (as F-) in theair showed values between 0.3 and 1.0 µg/m3 (data from 1980; Luftreinhaltplan RheinschieneSud 1982-1986). In urban air samples in the USA a maximum F-content of 1.89 µg/m3 isfound, in rural samples the F-levels are lower.
Background F-levels in rainwater in the USA are usually between 2-20 µg/l with a mean of 8.1µg/l (Barnard and Nordstrom 1982). Rainwater F-levels in India are 6.5, 16.0, 6.1, 3.3, and 21.3-40.0 µg/l in marine, unpolluted coastal, inland, deep inland and industrial samples, respectively(Mahdevan et al. 1986). In the Netherlands an average F-concentration in rainwater of 0.027mg/l is measured (Stuyfzand 1991).
3.1.4.3 Accumulation
Bioaccumulation
The most important exposure route of F for plants is uptake from the atmosphere.
Grass species have in comparison to other plant species a relatively high uptake rate. Theequilibrium between the concentration in the atmosphere and in the grass is generally reachedwithin 24 hours. In a period without rainfall the half-life of fluoride in grass is ca. 4 days in thesummer and ca. 12 days in the winter (Slooff et al. 1988).
Consumption of fluoride containing plants may lead to elevated fluoride levels in both humansand animals. Fluoride concentrations in grass range from 1-10 mg/kg (dry weight) in areas withlow fluoride emissions to 10-150 mg/kg (dry weight) in areas with high fluoride emissions.Fluoride concentrations in consumer crops range from 0.1-1.8 mg/kg. In other consumerproducts (tea, beer, wine, meat, eggs and milkproducts) fluoride concentrations of 0.05 (milk) to6 mg/kg (wine) were measured (Slooff et al. 1988). Near an aluminium factory in the USA, thefluoride content in the foliage of cherry and peach trees raised from 13 mg/kg to 65 and 76mg/kg, respectively. The highest values, 196 and 186 mg/kg, respectively, were found 2 yearsafter the factory began operating (Slooff et al. 1988).
3.1.5 Non compartment specific exposure relevant to the food chain
Aquatic environment
In the RIVM Criteria Document on Fluorides (Slooff et al. 1988) it was concluded that thelimited data available indicate that accumulation through food chains (biomagnification) is oflittle significance in the aquatic environment.

EU RISK ASSESSMENT – HYDROGEN FLUORIDE FINAL REPORT, OCTOBER 2001
12
Terrestrial environment
Fluorides accumulate in the skeletal tissues of terrestrial animals, both vertebrates andinvertebrates, depending on their feeding habit. Data on a variety of invertebrates, collected fromF-polluted sites, indicate that the lowest fluoride levels are found in cambial region feeders andherbivores, followed by omnivores, and were highest in predators, scavengers and pollinators.The relatively high levels in the latter three indicate possible biomagnification. For exampleaccumulation factors (= level in organisms in polluted zone: level in organisms in control zone)of 1.5, 25, 21, and 54 were found for casebearer Coleophora laricella, predatory spiders(arachnida), the honeybee Apis mellifera and bumblebees (Bombus sp.), respectively. Vertebratesstore most of the fluoride retained in the body bones and, to a lesser content in the teeth.
This was demonstrated in herbivorous field voles Microtus agrestis and wood mice Apodemussylvaticus and insectivorous common shrews Sorex araneus collected near an aluminiumreduction plant. In moles Talpa europaea higher fluoride levels were found in consistency withfluoride levels in earthworms, their main food source. Higher fluoride levels were also found infoxes, ungulates and birds collected from polluted areas. Field voles and wood mice with grosschanges in their teeth showed bone fluoride levels of 2500 to 15000 mg/kg (d.w.), which levelswere 15- to 90-fold those in animals from unpolluted areas. Bone fluoride levels increased withage and were, as in invertebrates, dependent on feeding habit, with the lowest levels inherbivores and somewhat higher levels in omnivores and carnivores (Janssen et al. 1989).
From the above-mentioned examples for the terrestrial environment it can be concluded that invertebrates and invertebrates a similar food-dependent relationship was found for fluorideaccumulation: the lowest levels in herbivores and (somewhat) higher levels in predators. Therelatively high fluoride concentrations in predators indicate a moderate degree ofbiomagnification for fluoride in the terrestrial environment (Slooff et al. 1988).
3.1.6 Emissions
3.1.6.1 General
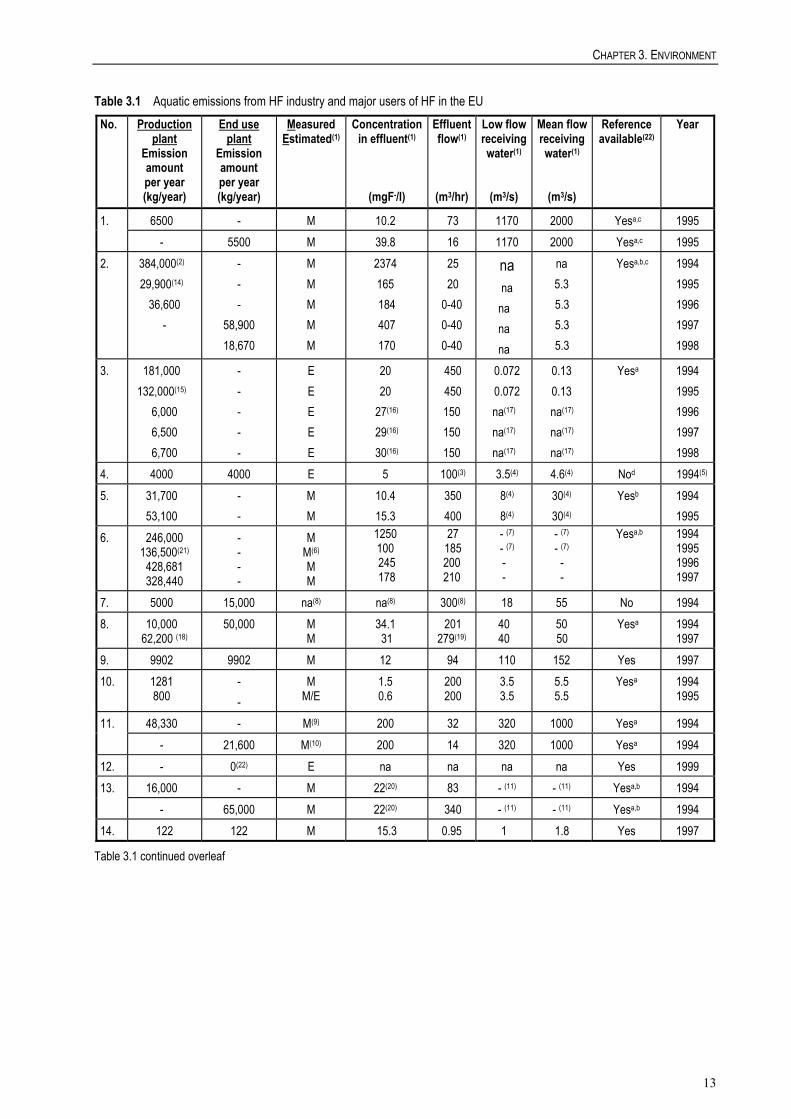
The emission data and other relevant information of HF producing and using (inorganic andorganofluor compounds) plants are listed in Tables 3.1 and 3.2 (Note: the plant numbers in thistable do not correspond with the production and use companies in Tables 2.1 and 2.2). Thesedata are the building blocks for the exposure assessment. The emission data represent about 85%of the total emissions in the EU from HF producers and users (CTEF 1995).
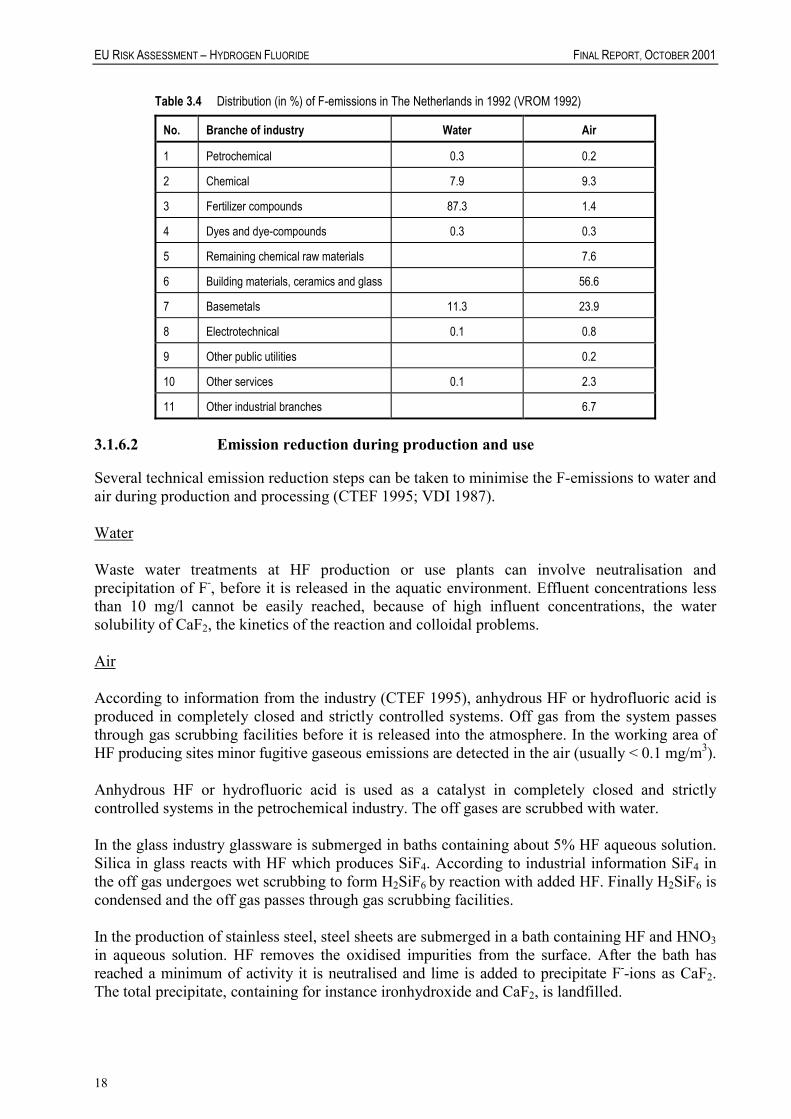
Fluorides are also emitted by other industries than the HF-producing and -using industries. Theemissions of these industry categories for The Netherlands in 1992 are given in Table 3.3. Thedistribution of all fluoride emissions to water and air over the different branches of industry inThe Netherlands is given in Table 3.4.
CHAPTER 3. ENVIRONMENT
13
Table 3.1 Aquatic emissions from HF industry and major users of HF in the EU No. Production
plant Emission amount per year (kg/year)
End use plant
Emission amount per year (kg/year)
Measured Estimated(1)
Concentration in effluent(1)
(mgF-/l)
Effluent flow(1)
(m3/hr)
Low flow receiving water(1)
(m3/s)
Mean flow receiving water(1)
(m3/s)
Reference available(22)
Year
1. 6500 - M 10.2 73 1170 2000 Yesa,c 1995 - 5500 M 39.8 16 1170 2000 Yesa,c 1995 2. 384,000(2)
29,900(14)
36,600 -
- - -
58,900 18,670
M M M M M
2374 165
184 407 170
25 20
0-40 0-40 0-40
na na
na na na
na 5.3
5.3 5.3 5.3
Yesa,b,c 1994 1995 1996 1997 1998
3. 181,000 132,000(15)
6,000 6,500 6,700
- - - - -
E E E E E
20 20
27(16) 29(16)
30(16)
450 450
150 150 150
0.072 0.072
na(17) na(17)
na(17)
0.13 0.13
na(17) na(17)
na(17)
Yesa 1994 1995 1996 1997 1998
4. 4000 4000 E 5 100(3) 3.5(4) 4.6(4) Nod 1994(5) 5. 31,700
53,100 - -
M M
10.4 15.3
350 400
8(4) 8(4)
30(4) 30(4)
Yesb 1994 1995
6. 246,000 136,500(21)
428,681 328,440
- - - -
M M(6) M M
1250 100
245 178
27 185
200 210
- (7) - (7)
- -
- (7) - (7)
- -
Yesa,b 1994 1995 1996 1997
7. 5000 15,000 na(8) na(8) 300(8) 18 55 No 1994 8. 10,000
62,200 (18) 50,000 M
M 34.1
31 201 279(19)
40 40
50 50
Yesa 1994 1997
9. 9902 9902 M 12 94 110 152 Yes 1997 10. 1281
800 - -
M M/E
1.5 0.6
200 200
3.5 3.5
5.5 5.5
Yesa 1994 1995
11. 48,330 - M(9) 200 32 320 1000 Yesa 1994 - 21,600 M(10) 200 14 320 1000 Yesa 1994 12. - 0(22) E na na na na Yes 1999 13. 16,000 - M 22(20) 83 - (11) - (11) Yesa,b 1994 - 65,000 M 22(20) 340 - (11) - (11) Yesa,b 1994 14. 122 122 M 15.3 0.95 1 1.8 Yes 1997
Table 3.1 continued overleaf

EU RISK ASSESSMENT – HYDROGEN FLUORIDE FINAL REPORT, OCTOBER 2001
14
Table 3.1 continued No. Production
plant Emission amount per year (kg/year)
End use plant
Emission amount per year (kg/year)
Measured Estimated(1)
Concentrationin effluent(1)
(mgF-/l)
Effluent flow(1)
(m3/hr)
Low flow receiving water(1)
(m3/s)
Mean flowreceiving water(1)
(m3/s)
Reference available(22)
Year
14. 122 122 M 15.3 0.95 1 1.8 Yes 1997
a - 900 na na na na na No 1994 b - 13,100 E 110(12) 14 300 na No 1994 c - 11,030
10,850 M E
0.22 0.28
4000 4000
na na
na na
Yesa,b 1994 1995
d - 53,000 na na na na na No 1994 e - 173 M 14 1.5 na 0.3 No 1994
Total 918,741 260,303 1994 455,160 260,123 1995(13)
- = Not applicable na = Not available or not submitted (1)Data is only applicable to production plants, except for end use plants (a-e) or mentioned otherwise (2)To effluent plants (precipitation plant under construction) (3)Total effluent flow for production and use is 200 m3/hr (4)Canal system with outflow to a tidal estuary (lagoon) (5)Same for 1995 (6)Monitoring data in receiving environment: 200 mg/l. STP influent and effluent concentrations are respectively 2500 mg/l and 100 mg/l (7)The dilution factor according to industrial information is 200 (=(effluent/day)/(river-flow/day)). Estuarial discharge (8No industrial monitoring for only the HF production site, all waste waters are treated in a common sewage treatment plant with an effluent flow of 7200 m3/d (9)According to industrial information the F--concentration in receiving water is 1.52.10-3 mg/l (calculated with dilution factor) (10)According to industrial information the F--concentration in receiving water is 0.7.10-3 mg/l (calculated with dilution factor) (11)Ocean (12)Production effluent (13)When there is no data for 1995 available, the amount of 1994 has been used (14)Precipitation plant in operation (15)21,000 kg/yr emission after treatment in the central waste water treatment plant (16)This concentration is due basically to the fertiliser activity of the factory (83% of the total amount of F- emissions) (17)Outflow canal to the sea (18)Total value for production and end use plants (19)Based on a total waste water flow of 2,006,430 m3/year and 300 production days/year (20)22 mg/l is the value at the emission point before reaching the ocean. 4.24 mg/l is measured just on the ocean surface at the falling point and mixing zone of the effluent to the ocean (21)A later submitted emission is 444,795 kg/year for 1995 (22)References are known at the rapporteur aReference available for monitoring/analysis techniques bReference available for the emissions controlled by local law or other authorities cInternal industrial report available for the emission values (not required by authorities) dMonitoring and measurement methods discribed without an acknowledgement or a reference (23)No aquatic discharge. All waste removed from this site for treatment and disposal elsewhere

CHAPTER 3. ENVIRONMENT
15
Table 3.2 Atmospheric gaseous F emissions (mainly HF) from HF industry and major users of HF in the EU
No. Production plant: Emission amount
per year (kg/year)
End use plant: Emission amount
per year (kg/year)
Measured Estimated(1)
Hight source (i.e. chimney)(1)
(m)
Detection limit
(mg/m3)
Reference available(16)
Year
1. 65 - M 25 na Yesa,b 1994
- 55 M 25 na Yesa,b 1994
2.
1360 376 359
-
- - -
347 78
M M M M M
15(2) 15(2) 15 15 15
0.01 0.01 0.01 0.01 0.01
Yesa,c
1994 1995 1996 1997 1998
3. 3100 2100 1300 1200 1260
- - - - -
E (3) E (3) M/E M/E M/E
28 28 28 28 28
na na na na n/a
Yesc 1994 1995 1996 1997 1998
4. 114(11)(12) 86.6
200(11) <120
M M
37 37
na na
Yesa 1995 1997
5. 177 159
- -
M M
21/25/30(5) 21/25/30(5)
0.2 0.2
No 1994 1995
6. <31 <31
- -
M M(6)
27 27
0.001 0.001
Yesb 1994 1995
7. 17.5 - E na 3 No 1994
8. 150 60(13)
250 M M
23 23
0.03 0.03
Yesa 1994 1997
9. 0(4) 0(4) M 35 - Yes 1997
10. 2020(7)
39.2 - -
M/E(7)
M 22 -
1 -
Yesc
Yesc 1994(8)
1998
11. 0.4 30 M(9) 25 0.5.10-3 Yesa 1994
12. 30 - na na na No 1994
13. 50 44
289 1000
M M
20 20
na na
Yesa,b 1994 1996
14. 172 147(14)(15)
172 M M
39 39
mg/m3:±5% Yes ? 1997
Table 3.2 continued overleaf

EU RISK ASSESSMENT – HYDROGEN FLUORIDE FINAL REPORT, OCTOBER 2001
16
Table 3.2 continued
No. Production plant: Emission amount
per year (kg/year)
End use plant: Emission amount
per year (kg/year)
Measured Estimated(1)
Hight source (i.e. chimney)(1)
(m)
Detection limit
(mg/m3)
Reference available(16)
Year
a. - 40 na na na No 1994
b. - 4200(17) na na na Yesc 1998
c. - -
20.9 15.5
M M
70 70
0.1 0.1
Yesa,b 1994 1995
d. - 5 na na na No 1994
e. - 13 M 35 na No 1994
Total 7137 903 1994
6119 898 1995 (10)
- = Not applicable. na = Not available or not submitted. (1)Data is only applicable to production plants, except for end use plants (a-e) or mentioned otherwise (2)On average (3)Monitoring data in receiving environment: 50 mg/m3 (production) 20 mg/m3 (use) (4)Gas-washer installation (5)Three chimneys (6)Monitoring data in the receiving environment: <0.001 mg/m3 (7)HF emitted via the central chimney is measured at a level of about 20 kg/year Diffuse emissions of 2000 kg HF/year resulting from loading/unloading activities, tank valves, pumps etc. are calculated by TNO using emission factors. According to industrial information the emission factors used by TNO are very high, mainly as a result of different valve emissions and emission duration. The actual diffuse emissions are not known at the moment (8)Same for 1995 (9)Monitoring data in the receiving environment: < 0.5.10-3 mg/m3 (10)When there is no data for 1995 available, the amount of 1994 has been used (11)Emissions expressed as F- (12)The also submitted upper bound of the emission amount at production is 2900 kg/year (13)Equal to 6.83 g/h. Total value for production and end use plants (14)Total value for production and end use plants (15)Based on emission of 20.4 g/h (=0.49 kg/day) and 300 production days per year (16)References are known at the rapporteur aReference available for monitoring/analysis techniques bReference available for the emissions controlled by local law or other authorities cInternal industrial report available for the emission values (17)Total atmospheric HF emission from plant amounts to 4200 kg/a in 1998. According to industry, however, this HF release is due to formation of HF during production of organofluor compounds (by-product). HF release due to handling of HF itself during the processes is assumed to be 0. At the plant an emission of 959 t/a of various organofluor compounds is reported

CHAPTER 3. ENVIRONMENT
17
Table 3.3 Fluoride emissions in The Netherlands in 1992 in kg/year (VROM 1992)
No Industry Water Air
1 Fertilizer compounds 19,100,000 19,100
2 Other raw chemicals 101,000
3 Ceramics, glass and building materials 758,000
4 Basemetals 2,470,000 319,000
5 Electrotechnical 10,200
6 Storage and trans-shipping, metal products, building trades, coal using power plants, public utilities
30,800
7 Other (fabrication of coach-works, trailers, semi-trailers, aeroplanes, bicycles and accessories, contractor companies)
89,600
Total 21,570,000 1,327,700 For water the total EU emission is about 1,390 tonnes for 1994 (1180 tonnes from Table 3.1 a. is about 85%, thus 100% is 1,390 tonnes) for the HF-industry, whereas only in The Netherlands more than 21,000 tonnes have been emitted to water in 1992 by other F emitting industries (Table 3.3). In The Netherlands the fertiliser industry (87%) is responsible for the largest F emission to water (Table 3.4). For 1992 the water emissions as a result of phosphate ore processing (fertiliser compounds) amounted 19,100 tonnes in The Netherlands (Tables 3.3 and 3.4). About 80% of the fluoride emissions from phosphate industries are in the form of insoluble fluorapatite. For the basemetal industry it is assumed that all the fluoride emissions are soluble. The situation in The Netherlands can be extrapolated to a European situation, with a factor of 0.2 for the soluble fluoride fraction of the phosphate industry and with a factor of 10 (extrapolation from region to EU, TGD) for effluent discharged in surface water for both the phosphate and basemetal industry. The calculated European load of soluble fluorides to surface water is 19,100.0.2.10 = 38,200 t/a for the phosphate industry and 2,470.1.10 = 24,700 t/a for the basemetal industry. With these calculated loads, the total European load is about 63,000 t/a. Hence, it can be concluded that the European fluoride emission from the HF industry only amounts to about 2% of the total industrial fluoride emission to surface water. The difference between the HF industry and the other industry categories is even larger for the emissions to air (Tables 3.3 and 3.4). In The Netherlands the ceramic industry is responsible for the largest F emissions to air (Table 3.4; 57%). More than 1,300 t/a are emitted in The Netherlands by other fluoride emitting industries than the HF industry, which is estimated to be 13,000 t/a for the EU. It can be concluded that the atmospheric emission of the HF industry (>9 t/a, Table 3.2) accounts for less than 0.1% of the total European emission. Overall, it can be concluded that F-emissions from HF industry and HF users are far below those from other fluoride emitting industries.
EU RISK ASSESSMENT – HYDROGEN FLUORIDE FINAL REPORT, OCTOBER 2001
18
Table 3.4 Distribution (in %) of F-emissions in The Netherlands in 1992 (VROM 1992)
No. Branche of industry Water Air
1 Petrochemical 0.3 0.2
2 Chemical 7.9 9.3
3 Fertilizer compounds 87.3 1.4
4 Dyes and dye-compounds 0.3 0.3
5 Remaining chemical raw materials 7.6
6 Building materials, ceramics and glass 56.6
7 Basemetals 11.3 23.9
8 Electrotechnical 0.1 0.8
9 Other public utilities 0.2
10 Other services 0.1 2.3
11 Other industrial branches 6.7 3.1.6.2 Emission reduction during production and use Several technical emission reduction steps can be taken to minimise the F-emissions to water and air during production and processing (CTEF 1995; VDI 1987). Water Waste water treatments at HF production or use plants can involve neutralisation and precipitation of F-, before it is released in the aquatic environment. Effluent concentrations less than 10 mg/l cannot be easily reached, because of high influent concentrations, the water solubility of CaF2, the kinetics of the reaction and colloidal problems. Air According to information from the industry (CTEF 1995), anhydrous HF or hydrofluoric acid is produced in completely closed and strictly controlled systems. Off gas from the system passes through gas scrubbing facilities before it is released into the atmosphere. In the working area of HF producing sites minor fugitive gaseous emissions are detected in the air (usually < 0.1 mg/m3). Anhydrous HF or hydrofluoric acid is used as a catalyst in completely closed and strictly controlled systems in the petrochemical industry. The off gases are scrubbed with water. In the glass industry glassware is submerged in baths containing about 5% HF aqueous solution. Silica in glass reacts with HF which produces SiF4. According to industrial information SiF4 in the off gas undergoes wet scrubbing to form H2SiF6 by reaction with added HF. Finally H2SiF6 is condensed and the off gas passes through gas scrubbing facilities. In the production of stainless steel, steel sheets are submerged in a bath containing HF and HNO3 in aqueous solution. HF removes the oxidised impurities from the surface. After the bath has reached a minimum of activity it is neutralised and lime is added to precipitate F--ions as CaF2. The total precipitate, containing for instance ironhydroxide and CaF2, is landfilled.

CHAPTER 3. ENVIRONMENT
19
3.1.6.3 Predicted Environmental Concentrations General As stated before, not only the HF industry, but also other industrial and natural sources contribute to the regional and the continental fluoride emissions. At these regional and continental levels the fluoride emissions from the HF industry are limited compared to other sources. They cannot be considered to contribute significantly to the fluoride concentrations in the aquatic, terrestrial or atmospheric compartment. For this reason the exposure assessment will be focused on the local level close to HF producing and end use plants. The exposure assessment is based both on calculations according to the EU-Technical Guidance Document (1996) and on actual measured concentrations near HF emitting plants. For the aquatic and atmospheric compartment the available emission data and effluent concentrations from the HF industry and major end users (see Tables 3.1 and 3.2) are used as a starting point for calculating the PEC values in the various environmental compartments. Aquatic compartment Calculated local concentrations (F-) For all HF production and use plants in the EU site-specific effluent concentrations or emission data are used for calculating the aquatic PEC values. For some sites the PECs are calculated both with a mean value and a low value for the receiving water flow (Table 3.5). For the HF plant numbers a and d it is assumed that they discharge their final effluent to the surface water without neutralisation, precipitation or filtration. Only for these two plants the receiving water concentration is calculated with the emission amount and a default effluent flow of 2000 m3/day, because local effluent concentrations were not submitted. Local surface water concentration for the HF plants number 3, 13, a, c and d are calculated with a default dilution factor of 10, because no receiving water flows or dilution factors were submitted. For all other plants receiving water concentrations are calculated with actual measured effluent concentrations and dilution factors. The dilution factor is calculated with the submitted effluent discharge rate of the STP and the flow rate of the river (Table 3.5) according to the following equation:
STP
STP
calEFFLUENTloFLOWcalEFFLUENTloD �
�
D: dilution factor EFFLUENTlocalSTP: effluent discharge rate of local STP (m3/d) FLOW: flow rate of the receiving river (m3/d) The daily releases to water are the input for the calculations of the PECs, only if no site specific effluent concentrations are available. In this case the concentration of fluoride in the effluent of an STP is calculated with the equation:
/d)(mwastewatervolume(kg/d)rateemission)(kg/mSTPC 3
3effluent �

EU RISK ASSESSMENT – HYDROGEN FLUORIDE FINAL REPORT, OCTOBER 2001
20
Subsequently, from the effluent concentration in the STP the local concentration in the receiving water surface water during the emission episode can be calculated with the equation:
D)CKp(1STPC
PEClocalsuspsusp
effluentwater
���
�
PEClocalwater: local predicted environmental concentration in water during emission
episode (kg/m3) Kpsusp: solids-water partition coefficient of suspended matter (m3/kg) Csusp: concentration of suspended matter in river water (0.015 kgdwt/m3) D: dilution factor (default = 10) For the final PEC calculations it is assumed that the solids water partition coefficient of suspended matter (Kpsusp) for the fluoride ion (F-) in water is very low. All data for calculating the receiving water concentrations are presented in Table 3.5. It should be noted that the calculated surface water concentrations are actually contributions to the receiving water. The range of calculated local PEC values is 7.9.10-4 - 237 mg/l for 1994, 8.8.10-5 - 9.8 mg/l for 1995 and 2.24.10-3 - 2.9 mg/l for 1996/1997 (Table 3.5). For 1997 and 1998 a rather limited number of PEC-values are available (see also risk characterisation). Measured data For a HF producing site a value of 200 mgF-/l is submitted for the waters of the adjacent estuary. For other sites the reported concentration of the effluent receiving river is 1.52.10-3 mgF-/l for a production plant and 0.7.10-3 mg for an end use plant. At a distance of 100-150 meters from a HF production and end use plant the measured concentration in the receiving ocean is not higher than 1.4 mgF-/l, this is about the environmental background concentration according to the industry. Sediment In paragraph 3.1.1.1 it is mentioned that fluoride can be transformed to insoluble fluorapatite in the presence of phosphates in surface water. Fluorapatite, but also other insoluble fluoride complexes, precipitate to sediment. There are no data available on fluoride levels in sediment

CHAPTER 3. ENVIRONMENT
21
Ta
ble
3.5
Cal
cula
ted
loca
l wat
er c
once
ntra
tions
(F- )
and
corre
spon
ding
dat
a fo
r eac
h H
F pl
ant
No.
Prod
uctio
n an
d en
d us
eEm
issi
on a
mou
ntEf
fluen
tflo
wC
once
ntra
tion
in e
fflue
ntLo
w fl
owre
ceiv
ing
wat
erM
ean
flow
rece
ivin
g w
ater
Dilu
tion
fact
or(lo
w)
Dilu
tion
fact
or(m
ean)
Con
cent
ratio
nre
ceiv
ing
wat
er(lo
w fl
ow)
Con
cent
ratio
nre
ceiv
ing
wat
er(m
ean
flow
)
Year
N
ote
(k
g/ye
ar)
(kg/
day)
(m3 /d
ay)
(mg
F- /l
) (m
3 /s)
(m3 /s
)
(mg
F- /l
) (m
g
F- /l)
1 -
-
175
2 1
0.2
11
70
2000
57
700
986
30 1.77
.10-4
1.
03.1
0-4
1995
(a)
-
-
384
39.
8
1170
20
00 2
6325
0 4500
00
1.51
.10-4
8.
84.1
0-5
1995
(b)
2 -
- 60
048
048
048
048
0
2374
165
184
407
170
na(1
)
na na na na
na(1
)
5.3
5.3
5.3
5.3
- -10 95
595
595
595
5
- - - -
237.
40.
170.
190.
430.
18
1994
1995
1996
1997
1998
(a)(c
)
(a)
(a)
(b)
(b)
3 -
-
1080
036
0036
0036
00
20 27 29 30
0.07
2na na na
0.13 na na na
1.58 - - -
2.04 10 10 10
12.7 - - -
9.80 2.7
2.9 3
1994
(2)
1996
1997
1998
(a)
(a(c
)
(a)(c
)
(a)(c
)
4 -
-
240
0
5
3.5(3
) 4.
6(3)
127(3
) 16
6.6(3
) 0.
039(3
) 0.
030(3
) 19
94(2
)(a
)(b)
5 -
-
840
096
0010
.415
.38 8
30 3083 73
310
271
- -0.
034
0.05
619
9419
95
(a)
(a)
6 -
-
648
4440
4794
5048
1250
100
245
178
-(5)
-(5)
-(5)
-(5)
-(5)
-(5)
-(5)
-(5)
-(5)
-(5)
-(5)
-(5)
200(5
)
200(5
)
200(5
)
200(5
)
- - - -
6.25
(5)
0.50
(5)
1.23
(5)
0.89
(5)
1994
1995
1996
1997
(a)
(a)
(a)
(a)
7 20
000(6
) 66
.67
720
0(7)
9.26
18
55
21
7
661
0.
043
0.
014
19
94(a
)(b)
(c)(d
)
8 -
-
482
466
8834
.131
40 4050 50
717
518
897
647
0.04
80.
060
0.03
80.
048
1994
1997
(a)(b
)
(a)(b
)
9 -
-
225
6
12
110
15
2
4214
58
22 2.
85.1
0-3
2.06
.10-3
19
97(a
)(b)
10
-
- 4
800
4800
1.5
0.6
3.5
3.5
5.5
5.5
64 6410
010
00.
023
0.00
90.
015
0.00
619
9419
95
(a)
(a)
Ta
ble
3.5
cont
inue
d ov
erle
af

EU RISK ASSESSMENT – HYDROGEN FLUORIDE FINAL REPORT, OCTOBER 2001
22
- = N
ot a
pplic
able
na =
Not
ava
ilabl
e or
not
sub
mitt
ed(a
) Dat
a fo
r pro
duct
ion
plan
ts(b
) Dat
a fo
r end
use
pla
nts
(c) C
once
ntra
tion
rece
ivin
g wa
ter i
s ca
lcula
ted
with
def
ault
dilu
tion
fact
or o
f 10,
no
rece
iving
wat
er fl
ow o
r dilu
tion
fact
or is
ava
ilabl
e(d
) Con
cent
ratio
n re
ceiv
ing
wate
r is
calc
ulat
ed w
ith th
e em
issio
n am
ount
, no
efflu
ent c
once
ntra
tion
avai
labl
e. T
he fi
nal e
fflue
nt is
em
itted
to th
e su
rface
wat
er w
ithou
t neu
tralis
atio
n, p
reci
pita
tion
or fi
ltrat
ion
(e) E
miss
ion
data
is n
ot a
vaila
ble.
The
con
cent
ratio
n of
the
rece
ivin
g wa
ter i
s ca
lcula
ted
with
a e
stim
ated
pro
duct
ion
volu
me
of 5
,000
-10,
000
t/a a
ccor
ding
a g
ener
ic s
cena
rio(1
) Onl
y th
e riv
er n
ame
is a
vaila
ble.
The
def
ault
dilu
tion
fact
or is
use
d fo
r cal
cula
ting
the
rece
ivin
g wa
ter c
once
ntra
tion
(2) S
ame
for 1
995
(3) C
anal
sys
tem
. Em
issi
on in
to c
anal
sys
tem
with
clo
se o
utflo
w to
a ti
dal e
stua
ry(4
) Can
al s
yste
m to
sea
lago
on, n
o re
ceiv
ing
wate
r flo
w or
dilu
tion
fact
or a
vaila
ble
for c
anal
sys
tem
. Con
cent
ratio
n re
ceiv
ing
wate
r (se
a) c
an n
ot b
e ca
lcul
ated
. With
a d
efau
lt di
lutio
n fa
ctor
of 1
0 fo
r rive
rs, t
he c
alcu
late
dre
ceiv
ing
wate
r con
cent
ratio
n is
1.04
and
1.5
3 m
g F- /l
(5) E
stua
rial d
isch
arge
. The
dilu
tion
fact
or a
ccor
ding
to in
dust
rial i
nfor
mat
ion
is 2
00(6
) Tot
al a
mou
nt fo
r pro
duct
ion
(500
0) a
nd e
nd u
se p
lant
(15,
000)
, bec
ause
all
wast
e wa
ters
are
trea
ted
in a
com
mon
sew
age
treat
men
t pla
nt(7
) Effl
uent
wat
er n
ot o
nly
from
HF
prod
uctio
nsit
e, a
ll ef
fluen
t wat
er is
trea
ted
in a
com
mon
sew
age
treat
men
t pla
nt. T
he H
F pr
oduc
tion
site
is n
ot m
onito
red
sepe
rate
ly.(8
) Acc
ordi
ng to
indu
stria
l info
rmat
ion
the
conc
entra
tion
in th
e riv
er is
1.5
2.10
-3 m
g/l f
or th
e pr
oduc
tion
plan
t and
0.7
.10-3
mg
F- /l fo
r the
end
use
pla
nt. A
ccor
ding
to la
ter r
ecei
ved
info
rmat
ion
the
conc
entra
tion
at th
eem
issio
n en
d po
int i
s 2.
77 m
g/l f
orth
e pr
oduc
tion
plan
t and
1.3
3 m
g F- /l
for t
he e
nd u
se p
lant
(9) O
cean
, no
dilu
tion
fact
or a
vaila
ble.
Con
cent
ratio
n re
ceiv
ing
wate
r can
not
be
calcu
late
d. 4
.24
mg/
l is
mea
sure
d ju
st o
n th
e oc
ean
surfa
ce a
t the
falin
g po
int a
nd m
ixin
g zo
ne o
f the
effl
uent
to th
e oc
ean.
With
a d
efau
lt
dilu
tion
fact
or o
f 10,
the
calc
ulat
ed re
ceiv
ing
wate
r con
cent
ratio
n is
0.4
2 m
g F- /l
(10)
At a
dist
ance
of 1
00-1
50 m
eter
s fro
m p
oint
sou
rce
the
mea
sure
d co
ncen
tratio
n is
not h
ighe
r tha
n 1.
4 m
gF-/l
, thi
s is
abou
t the
env
ironm
enta
l bac
kgro
und
conc
entra
tion
acco
rdin
g to
the
indu
stry
Ta
ble
3.5
con
tinue
d
No.
Prod
uctio
n an
d en
d us
eEm
issi
on a
mou
ntEf
fluen
tflo
wC
once
ntra
tion
in e
fflue
ntLo
w fl
owre
ceiv
ing
wat
erM
ean
flow
rece
ivin
g w
ater
Dilu
tion
fact
or(lo
w)
Dilu
tion
fact
or(m
ean)
Con
cent
ratio
nre
ceiv
ing
wat
er(lo
w fl
ow)
Con
cent
ratio
nre
ceiv
ing
wat
er(m
ean
flow
)
Year
N
ote
(k
g/ye
ar)
(kg/
day)
(m3 /d
ay)
(mg
F- /l
) (m
3 /s)
(m3 /s
)
(mg
F- /l
) (m
g
F- /l)
11
-
-
768
20
0
320
10
00
3600
0 11
2500
5.56
.10-3
1.
78.1
0-3(8
) 19
94(a
)
-
-
343
200
32
0
1000
806
10
2519
00 2.48
.10-3
7.
94.1
0-4(8
) 19
94(b
)
12
-
0
-
-
-
-
-
-
-
0
1998
(b)
13
-
- 1
992
22
-(9
) -(9
) -(9
) -(9
) -
0.
42(9
)(10)
19
94(a
)
-
-
8160
22
-(9
) -(9
) -(9
) -(9
) -
0.
42(9
)(10)
19
94(b
)
14
-
-
22.8
15
.3
1
1.8
37
90 6
822
4.0
4.10
-3
2.24
.10-3
19
97(a
)(b)
a 90
0
3.00
200
0
1.50
na
na
-
10
-
0.
15
1994
(b)(c
)(d)
b -
-
328
.8 1
10
300
na
78
830
-
1.
40.1
0-3
- 19
94(b
)
c -
-
9600
096
000
0.22
0.28
na nana na
- -10 10
- 0.
022
0.02
819
9419
95
(b)(c
)
(b) (
c)
d 53
,000
17
7
2000
88
.3
na
na
-
10
-
8.83
19
94(b
)(c) d
)
e -
-
36
14
na
0.
3
-
721
-
0.
0194
19
95(b
)

CHAPTER 3. ENVIRONMENT
23
Atmospheric compartment Calculated local concentrations For every HF producing and end use plant the annual average local atmospheric PEC value at a distance of 100 meters is calculated with EUSES (OPS model) from the daily amounts released to air (TGD, 1996). Atmospheric emission values during production and end use are added, when they are available for one plant (Table 3.6). The total daily emission of each plant has been used as an input for the OPS-model. All calculated annual local atmospheric HF concentrations at a distance of 100 meters of each plant are listed in Table 3.6. The range of calculated local PEC values is 0.01 – 2.36 �g/m3 for 1994. When available, calculated values for 1995, 1996, 1997 are slightly lower (Table 3.6), except for plant No. 13. For 1998 only a limited number of atmospheric PECs could be calculated (see also risk characterisation) To bring the above mentioned data into a broader perspective: for the major coarse ceramic industries in The Netherlands local concentrations of 6.1 - 16.0 �g/m3 were calculated based on HF emissions of 8-21 t/a (Huizinga et al. 1995). Acidification After atmospheric deposition, HF may lead to acidification of the receiving soil or surface water. The contribution of locally emitted HF to acidification can be determined by comparison of all acidifying components in air. The most important acidifying components are ammonia, sulphur dioxide, nitrogen oxides and their reaction products. The total deposition flux of acidifying compounds in the Netherlands is estimated to be 4200 mol H+/ha.y (RIVM, personal comm.) The critical deposition fluxes for forest and surface water are 1400 and 400 mol/ha.y, respectively. The maximum HF concentration in air calculated with a site-specific emission amount for production plant b would be 3.2 �g/m3 (=3.2.10-9 kg/m3). The deposition velocity of HF is 2 cm/s = 1728 m/d. Corresponding deposition fluxes are: plant : 3.2.10-9 kg/m3.1728 m/d = 5.53.10-6 kg/m2 in moles/ha/y: (1 kg/m3.d = (1/20) mol/ (0.0001ha.1/86400 y) = 4.32.107 mol/ha.y) plant b: 5.53.10-6 kg/m2.4.32.107 = 238 mol/ha.y It can be concluded that for plant b the deposition flux is lower than the critical fluxes for forest and surface water. Compared to the total deposition flux of acidifying compounds in the Netherlands (4200 mol/ha.y) the relative contribution of plant No. 3 is 6%.
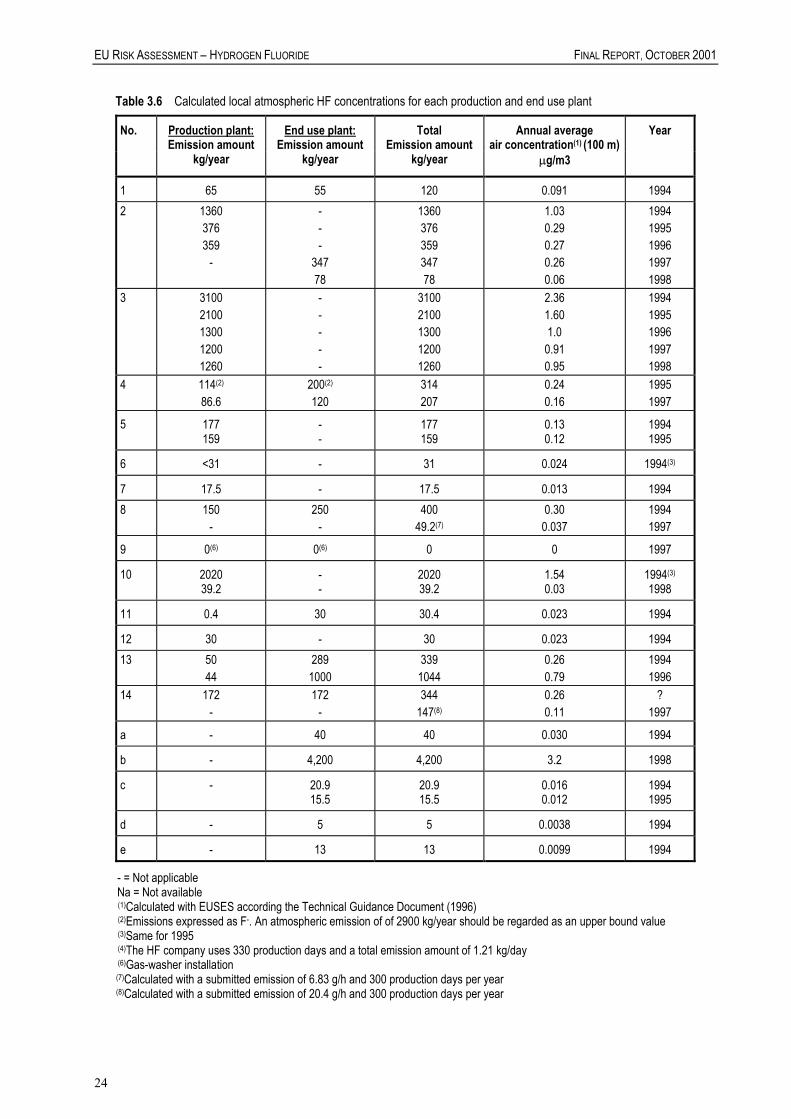
EU RISK ASSESSMENT – HYDROGEN FLUORIDE FINAL REPORT, OCTOBER 2001
24
Table 3.6 Calculated local atmospheric HF concentrations for each production and end use plant
No. Production plant: Emission amount
End use plant: Emission amount
Total Emission amount
Annual average air concentration(1) (100 m)
Year
kg/year kg/year kg/year �g/m3
1 65 55 120 0.091 1994 2 1360
376 359
-
- - -
347 78
1360 376 359 347 78
1.03 0.29 0.27 0.26 0.06
1994 1995 1996 1997 1998
3 3100 2100 1300 1200 1260
- - - - -
3100 2100 1300 1200 1260
2.36 1.60 1.0 0.91 0.95
1994 1995 1996 1997 1998
4 114(2) 86.6
200(2) 120
314 207
0.24 0.16
1995 1997
5 177 159
- -
177 159
0.13 0.12
1994 1995
6 <31 - 31 0.024 1994(3)
7 17.5 - 17.5 0.013 1994 8 150
- 250
- 400
49.2(7) 0.30 0.037
1994 1997
9 0(6) 0(6) 0 0 1997
10 2020 39.2
- -
2020 39.2
1.54 0.03
1994(3)
1998
11 0.4 30 30.4 0.023 1994
12 30 - 30 0.023 1994 13 50
44 289 1000
339 1044
0.26 0.79
1994 1996
14 172 -
172 -
344 147(8)
0.26 0.11
? 1997
a - 40 40 0.030 1994
b - 4,200 4,200 3.2 1998
c - 20.9 15.5
20.9 15.5
0.016 0.012
1994 1995
d - 5 5 0.0038 1994
e - 13 13 0.0099 1994
- = Not applicable Na = Not available (1)Calculated with EUSES according the Technical Guidance Document (1996) (2)Emissions expressed as F-. An atmospheric emission of of 2900 kg/year should be regarded as an upper bound value (3)Same for 1995 (4)The HF company uses 330 production days and a total emission amount of 1.21 kg/day (6)Gas-washer installation (7)Calculated with a submitted emission of 6.83 g/h and 300 production days per year (8)Calculated with a submitted emission of 20.4 g/h and 300 production days per year

CHAPTER 3. ENVIRONMENT
25
Measured data (CTEF 1995) Concentrations of 2-4 mg/m3 are regularly measured in a chimney from a HF plant in The Netherlands, with a yearly emission of 50 kg fluorides. At a distance of 500 metres from this site, the measured atmospheric fluoride concentration varies between 0.1 and 1 �g/m3 (mean 0.3-0.4 �g/m3). In Germany, around a HF production facility, the mean value (three year average) measured within 1 km of this site was 0.2 �g/m3, with a value of 1.3 �g/m3 as 98 percentile (1993). Near another HF plant in Germany a mean (yearly) fluoride concentration of 0.3 �g/m3 was measured, with a 98 percentile of 2.4 �g/m3. Fluoride emissions are routinely measured around a HF production site in the UK. Annual averages at several farms within a distance of 0.5 to 4 km of this site vary between 0.06 and 0.23 �g/m3 (1991-1994). At the boundaries of another HF site in the UK ambient air concentration of fluorides are measured of 2.31-5.36 �g/m3 for 1988 and 1.12-3.14 �g/m3 for 1995 (industry report). For the same site are in 1984 daily fluoride concentration measured of 0.03-1.71 �g/m3 (mean=0.58 �g/m3) and of 0.01-1.01 �g/m3 (mean=0.24 �g/m3), respectively measured at a distance of 1000 meters and 500 metres of the production plant. European data for another HF end-use site of various chemical synthesis show general F-concentrations (measured over 6 months) below the (large) detection limit of 0.01 �g/m3, with peak levels of 0.05-0.06 �g/m3 at a distance of 700 meters downwind. The total gaseous emissions of this site amounted to 14 g HF/day. For two other plants the concentrations in air were measured below the detection limit of 1 �g/m3 and 0.5 �g/m3. Very recently (2001) additional monitoring data have become available for plant no. 13. Atmoshpheric concentrations amounted to 1.0 and 0.7 �g/m3 for the years 1999 and 2000, respectively. When these measured data are compared with the calculated data (range 0.01 - 3.2 �g/m3), they are found to be in the same order of magnitude. There are also local fluoride concentrations known of other industrial activities than the HF industry. F-levels measured downwind an Al-plant that emitted 34 kg F/hour were found to be about 0.66 �g/m3 (Slooff et al. 1988). Other HF concentrations in air around emission sources in Canada are usually less and are summarised in Table 3.7. Table 3.7 Measured HF concentrations in air around emission sources in Canada (CEPA 1993)
Type of installation Concentration measured (�g/m3) Remark
Aluminium production 0.1 - 0.71 0.79 - 0.85 0.43
up to 8 km 1.6 km from site 4 km from site
Steel production 0.17 - 0.24 close to the site
Phosphate fertilisers 0.4 - 0.59 less than 5 km
Phosphorous production 0.14 - 0.15 close to the site
Brick production 0.73 less than 1 km
EU RISK ASSESSMENT – HYDROGEN FLUORIDE FINAL REPORT, OCTOBER 2001
26
Soil Model calculations The concentration F- in waste water from HF production or use can be reduced by adding lime to form CaF2. Solid CaF2 from these industrial waste water cleaning operations are generally not used for the amendment of soil, but are landfilled or recycled for re-use. Percolation of CaF2 (insoluble) from these landfills to groundwater is assumed to be low under normal conditions. One European HF producer (non-EU) stated that their CaF2 from the neutralisation process is discharged directly to waste water. The total quantity of discharged F- at this plant was 300 tonnes in 1996. Measures are planned to reduce this discharge at this plant. From 1998/1999 the CaF2-waste will be landfilled. For the HF industry only the atmospheric deposition is used for calculating the concentrations in soil and the contribution of STP sludge applied on agricultural soils is not taken into account. A soil concentration is calculated for the plant with the highest emission to air (use plant b, 11.5 kg/d) with EUSES. The maximum calculated fluoride concentration in soil would be about 0.5 �g/kg for this plant. In addition an EUSES calculation is carried out with a higher deposition velocity (1.4 cm/s) (Slooff et al. 1988), which results in a soil concentration of about 1.5 mg/kg for the same plant. From this it is clear that the soil concentrations for all other plants will be lower than either 0.5 �g/kg or 1.5 mg/kg. Measured data In the neighbourhood of an HF emitting factory (2.8 kg/day as HF) accumulation of F was restricted to the upper 40-50 cm in calcareous soils (CTEF 1995). In the most heavily polluted area around the factory the mean content of HCl-extractable F-compounds decreased from 446 mg/kg at a depth of 0-20 cm, 194 mg/kg at a depth of 20-40 cm, 102 mg/kg at a depth of 40-60 cm, to 58 mg/kg at depths below 60 cm. In groundwater around the factory a concentration of 0.5 mg F/l was measured. In the USA F-concentrations in the range of 265 to 1840 mg/kg were found in the top 0.5 inch of soil near a P-extraction facility (Slooff et al. 1988). Vegetation Monitoring of fluoride levels in vegetation samples is performed routinely (12-year program) around a German HF producing and using (chemical synthesis) plant at a distance of about 1 km. The mean F-levels comprise between 20 and 50 mg/kg d.w. with peak values up to 150-200 mg/kg (Solvay unpublished data). Peak levels could be linked to particular operations at the plant (e.g. chimney cleaning) or to small incidents. Fluoride concentrations in grass from uncontaminated areas ranges from 1-10 mg/kg d.w. (see paragraph 3.1.3.3). Another vegetation fluoride monitoring programme is running around site b (HF end use plant). Fluoride levels in grass are being measured both at a distance of 150-500 m from the emission source and at 1500-2000 m. Data are available for the period 1988-1998. Annual average grass

CHAPTER 3. ENVIRONMENT
27
fluoride levels in that period range from 10 to 90 µg/g dwt at 150-500 m and 10 to 25 µg/g d.w.t at 1500-2000m. 3.2 EFFECTS ASSESSMENT 3.2.1 Aquatic compartment All reported tests with aquatic organisms were performed with NaF. Because HF occurs in the aquatic compartment mainly as fluoride ion, the NaF tests can be used for the evaluation of HF effects in aquatic organisms. All reported test results were corrected for the fluoride ion.
It has to be noted that there is a clear relation between toxicity and water hardness. Tests performed in soft water (< 50 mg CaCO3/l) showed a higher toxicity than those performed in hard water (> 50 mg CaCO3/l), due to the precipitation of fluoride as CaF2.
Ecotoxicity data for sediment are not available. 3.2.1.1 Toxicity to fish
The short-term toxicity studies with fluoride for freshwater fish are summarised in Table 3.8. Table 3.8 Short-term toxicity data of fluoride for freshwater fish
No. Species Duration (h)
LC50 (mg/l)
Method Hardness (mg CaC03/l)
References
1 Leuciscus idus melanotus 48 299
other 25 (Juhnke and Ludemann 1978)
2 Oncorhynchus mykiss 96 51 other 17 (Janssen et al. 1989)
3 Oncorhynchus mykiss 96 108 other 22 (Camargo and Tarazona 1991)
4 Salmo trutta 96 165 other 21 (Camargo and Tarazona 1991)
5 Gasterosteus aculeatus 96 340 other 78 (Janssen et al. 1989)
The short-term LC50-values for fish range from 51 to 340 mg/l. All tests were carried out in soft water. The LC50-values of test no. 1, 3, and 5 are based on nominal concentrations, the values of test no. 2 and 4 on actual concentrations. In the Integrated Criteria Document Fluoride (Slooff et al. 1988) more short-term fish data were reported, ranging from 128 to 460 mg/l.
The RIVM document (Slooff et al. 1988) also contained short-term toxicity data for marine fish. However, as all reported values were above the solubility of NaF in seawater (100 mg/l) they were not considered suitable for the evaluation of the risk of fluoride in the aquatic environment.
In addition to the base set information for fish, also a long-term NOEC-value is available. In a 21-days test with Oncorhynchus mykiss a LC5 value of 4 mg/l was reported (actual concentration) (Slooff et al. 1988). This value is considered to be equivalent to the NOEC for mortality. The test was conducted in very soft (12 mg CaCO3/l) natural water with daily renewal of the test water.
Long-term toxicity data for marine fish are not available.

EU RISK ASSESSMENT – HYDROGEN FLUORIDE FINAL REPORT, OCTOBER 2001
28
The NOEC-value of 4 mg/l may be taken into consideration with the test results of other taxonomic groups for the derivation of PNEC for the aquatic environment. It should be borne in mind, however, that this test was carried out in very soft water. 3.2.1.2 Toxicity to aquatic invertebrates (e.g. Daphnia)
The short-term toxicity studies with fluoride for freshwater aquatic invertebrates are summarised in Table 3.9. Table 3.9 Short-term toxicity data of fluoride for freshwater invertebrates
No. Species Duration (h)
EC50 (mg/l)
Method Hardness (mg CaCO3/l)
References
1 Benthic macroinvert.
96 26-48 other 12-19 (Camargo and Tarazona 1990)
2 Daphnia magna 48 97 other 250 (Janssen et al. 1989)
3 Daphnia magna 48 153 other 173 (LeBlanc 1984)
4 Daphnia magna 24 352 DIN 38411 L 11 250 (Kühn et al. 1988)
5 Daphnia sp. 48 270 Bringman & Kühn, 1959 204 (Bringman and Kühn 1959)
The EC50-values for daphnids range from 97 to 352 mg/l and are based on nominal concentrations. Benthic insect larvae were found to be more sensitive with EC50-values ranging from 26 to 48 mg/l (actual concentrations), but these tests were carried out in soft water. In the RIVM Criteria Document on Fluorides (Slooff et al. 1988) more short-term invertebrate data were reported, ranging from 109 to 340 mg/l. The short-term toxicity studies with fluoride for marine invertebrates are summarised in Table 3.10. Table 3.10 Short-term toxicity of fluoride to marine invertebrates
No. Species Duration (h)
EC50 (mg/l)
Method Salinity (0/00)
References
1 Mysidopsis bahia 96 10.5 other unknown (LeBlanc 1984)
2 Perna perna (1.5-2.5 cm)
120 39 other 20 (Hemens and Warwick 1972)
3 Perna perna (4.5-7 cm)
120 20 other 20 (Hemens and Warwick 1972)
The EC50-values for marine invertebrates range from 10.5 to 39 mg/l. The EC50-values for Perna perna were derived from the reported effect concentrations using the Spearmann-Karber environmental scenario (Hamilton et al 1977). In the RIVM Criteria Document on Fluorides (Slooff et al. 1988) more short-term marine invertebrate data were reported, ranging from 30 to 500 mg/l.
In addition to the base set information, also long-term toxicity studies for freshwater invertebrates are available. These tests are summarised in Table 3.11.

CHAPTER 3. ENVIRONMENT
29
Table 3.11 Long-term toxicity of fluoride to freshwater invertebrates
No. Species Duration (d)
NOEC (mg/l)
Method Hardness (mg CaCO3/l)
References
1 Daphnia magna 21 3.7 other 250 (Janssen et al. 1989)
2 Daphnia magna 21 14.1 Kühn, 1988 250 (Kühn et al. 1988)
In both long-term tests with daphnids the NOEC is based on effects on reproduction. Test concentrations were only analysed in the second test. The arithmetic mean of both test gives a value of 8.9 mg/l. In the RIVM document (Slooff et al. 1988) more long-term invertebrate data were reported, ranging from 10 to 48 mg/l. Long-term toxicity studies for marine invertebrates are not available. The calculated NOEC-value of 8.9 mg/l will be taken into consideration with the results of other taxonomic groups for the derivation of the PNEC for the aquatic environment. 3.2.1.3 Toxicity to algae The short-term toxicity studies with fluoride for freshwater algae are summarised in Table 3.12. Table 3.12 EC50-values of fluoride for freshwater algae
No. Species Duration (h)
EC50, biomass (mg/l)
Method Hardness (mg CaCO3/l)
References
1 Scenedesmus sp. 96 43 Other unknown (Slooff et al. 1988)
2 Selenastrum capricornutum
96 122 Other unknown (LeBlanc 1984)
The EC50-values for freshwater algae range from 43 to 122 mg/l (nominal concentrations). Data on test conditions are not available. For marine algae only one 96 hour EC50-value is available, i.e. 81 mg/l for Skeletonema costatum. Further data on test conditions are lacking (LeBlanc 1984). In addition to the base set information, also NOEC-values for freshwater algae are available.
These tests are summarised in Table 3.13.

EU RISK ASSESSMENT – HYDROGEN FLUORIDE FINAL REPORT, OCTOBER 2001
30
Table 3.13 NOEC-values of fluoride for freshwater algae
No. Species Duration (d)
NOEC (mg/l) biomass
Method Hardness (mgCaCO3/l)
Reference
1 Ankistrodesmus braunii 7 50 other unknown (Janssen et al. 1989)
2 Cyclotella meneghiniana 7 50 other unknown (Janssen et al. 1989)
3 Oscillatoria limnetica 7 50 other unknown (Janssen et al. 1989)
4 Scenedesmus quadricauda 7 50 other unknown (Janssen et al. 1989)
5 Stephanodiscus minutus 7 50 other unknown (Janssen et al. 1989)
6 Synechococcus leopoldiensis
7 50 other unknown (Janssen et al. 1989)
7 Scenedesmus quadricauda 8 249 Bringmann & Kühn, 1977
28.7 (Bringmann and Kühn 1977)
The NOEC-values for freshwater algae range from 50 to 249 mg/l. The values reported in tests 1 to 6 are based on actual concentrations. Hardness information is lacking.
The toxicity studies for marine algae are summarised in Table 3.14. The exposure time in the tests mentioned in Table 3.14 was 2 to 3 weeks. In general, after such a (relatively) long exposure period algae are not in the exponential growth-phase any more, but have already reached the lag-phase. Furthermore, it is expected that the bioavailability of the test substance would probably have been low at that time. For these reasons the results of these marine tests will only be used as supportive information. Table 3.14 Toxicity of fluoride to marine algae
No Species Duration (d)
NOEC, biomass (mg/l)
Method Salinity (0/00)
References
1 Amphidinium carteri 14-21 50-100 Other 15-26 (Janssen et al. 1989)
2 Chaetoceros gracilis
14-21 200 Other 15-26 (Janssen et al. 1989)
3 Dunaliella tertiolecta
14-21 200 Other 15-26 (Janssen et al. 1989)
4 Pavlova lutheri 14-21 50 Other 15-26 (Janssen et al. 1989)
The lowest EC50-value of 43 mg/l derived for Scenedesmus sp. will be taken into consideration with the test results of other taxonomic groups for the derivation of the PNEC for the aquatic environment. 3.2.1.4 Toxicity to micro-organisms The toxicity studies with fluoride for micro-organisms are summarised in Table 3.15. The table contains data for both bacteria and protozoa.
The long-term NOEC-values for micro-organisms range from 7.1 to 510 mg/l. Only the test with activated sludge was performed according to international accepted guidelines. In this test the given EC10-value for respiration inhibition is considered to be an equivalent for a NOEC.

CHAPTER 3. ENVIRONMENT
31
Endpoints for viability measured in the tests with Escherichia coli and Microregma heterostoma are inhibition of acid formation from glucose and inhibition of feed uptake, respectively.
The NOEC-values for protozoa (tests No. 2, 3, 5 and 6) are only used as supportive information for the derivation of the PNEC. The same is true for E.coli bacteria. Table 3.15 Toxicity of fluoride to micro-organisms
No. Species Duration (h)
NOEC (mg/l)
Method Hardness (mg CaCO3/l)
References
1 Activated sludge 3 510 OECD 209 unknown (Bayer AG 1987) 2 Chilomonas
paramaecium 48 83 Bringmann &
Kühn, 1981 42.3 (Bringmann and Kühn
1981) 3 Entosiphon
sulcatum 72 101 Bringmann &
Kühn, 1981 35.3 (Bringmann and Kühn
1981) 4 Escherichia coli 48 180 Bringmann &
Kühn, 1959 unknown (Bringmann and Kühn
1959) 5 Uronema parduczi 20 7.1 Bringmann &
Kühn, 1981 35.3 (Bringmann and Kühn
1981) 6 Microregma
heterostoma 28 226 Bringmann &
Kühn, 1981 204 (Bringmann and Kühn
1981) 7 Pseudomonas
putida 16 231 Bringmann &
Kühn, 1977 42.5 (Bringmann and Kühn
1977)
3.2.1.5 PNEC for the aquatic compartment Freshwater The PNEC for the freshwater compartment is extrapolated from the calculated mean NOEC-value for Daphnia magna (8.9 mg/l) using an extrapolation factor of 10. This factor is chosen because long term NOEC-values for more than three trophic levels are available. The extrapolation leads to a PNEC for the freshwater environment of 0.9 mg/l (PNECaqua). (A short term EC50 of 43 mg/l for Scenedesmus sp. was found to be the lowest value for the algae group. The corresponding NOEC-value will probably be a factor 3 lower, i.e. about 14 mg/l, which is still higher than the NOEC for D.magna. On top of that, there is also no information on hardness conditions in this test). The set of aquatic ecotoxicity data consists of test results based on both actual and nominal concentrations. The assumption is made that this PNEC already includes a background fluoride level. One should further realise that the PNEC of 0.9 mg/l is based on daphnid tests carried out under hard water conditions. Given the clear relation between toxicity and water hardness, this PNEC may underestimate soft water conditions. There are no long-term daphnid tests in soft water, but there is one very soft water test (12 mg/l CaCO3) with Oncorhynchus mykiss. Using this fish test and applying an assessment factor of 10 would result in a PNEC of 0.4 mg/l for soft water conditions. Another important issue in this context is that natural background fluoride levels may vary substantially within the EU. Under natural conditions elevated natural background F levels can be encountered in certain regions (see paragraph 3.1.1.2). This means that the above-mentioned PNEC is therefore not directly applicable to those regions with high natural F-levels. An option
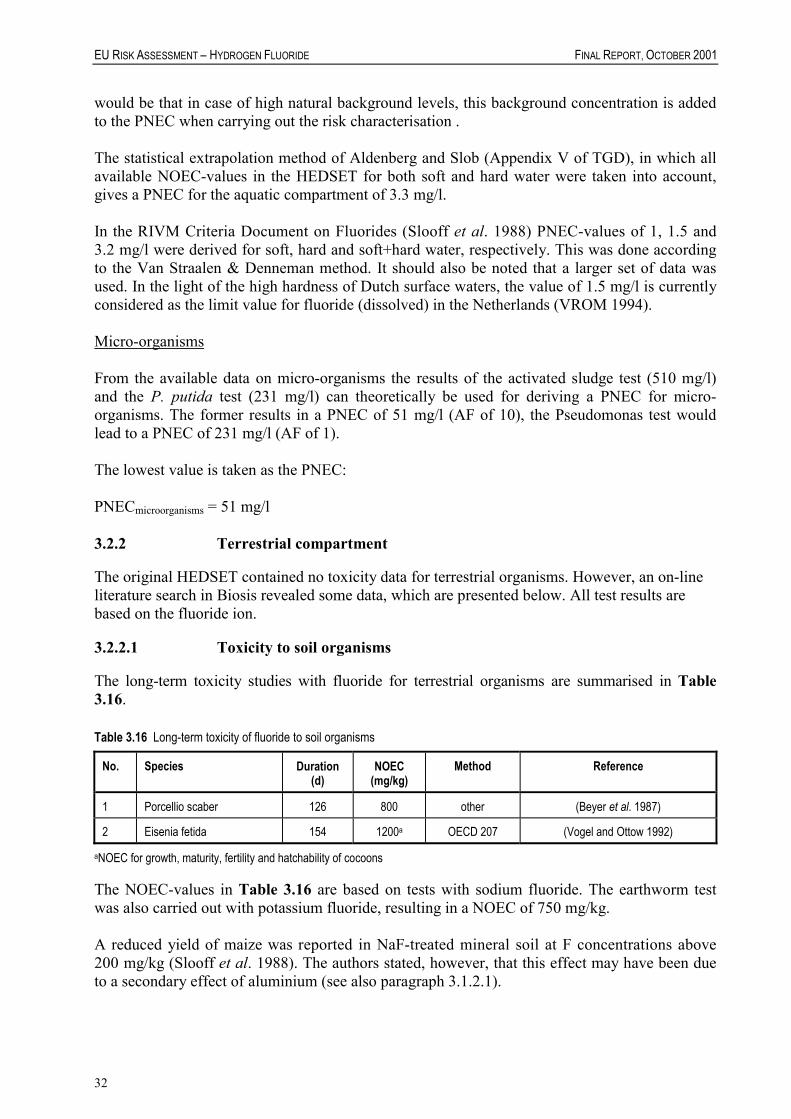
EU RISK ASSESSMENT – HYDROGEN FLUORIDE FINAL REPORT, OCTOBER 2001
32
would be that in case of high natural background levels, this background concentration is added to the PNEC when carrying out the risk characterisation . The statistical extrapolation method of Aldenberg and Slob (Appendix V of TGD), in which all available NOEC-values in the HEDSET for both soft and hard water were taken into account, gives a PNEC for the aquatic compartment of 3.3 mg/l. In the RIVM Criteria Document on Fluorides (Slooff et al. 1988) PNEC-values of 1, 1.5 and 3.2 mg/l were derived for soft, hard and soft+hard water, respectively. This was done according to the Van Straalen & Denneman method. It should also be noted that a larger set of data was used. In the light of the high hardness of Dutch surface waters, the value of 1.5 mg/l is currently considered as the limit value for fluoride (dissolved) in the Netherlands (VROM 1994). Micro-organisms From the available data on micro-organisms the results of the activated sludge test (510 mg/l) and the P. putida test (231 mg/l) can theoretically be used for deriving a PNEC for micro-organisms. The former results in a PNEC of 51 mg/l (AF of 10), the Pseudomonas test would lead to a PNEC of 231 mg/l (AF of 1). The lowest value is taken as the PNEC: PNECmicroorganisms = 51 mg/l 3.2.2 Terrestrial compartment The original HEDSET contained no toxicity data for terrestrial organisms. However, an on-line literature search in Biosis revealed some data, which are presented below. All test results are based on the fluoride ion. 3.2.2.1 Toxicity to soil organisms The long-term toxicity studies with fluoride for terrestrial organisms are summarised in Table 3.16. Table 3.16 Long-term toxicity of fluoride to soil organisms
No. Species Duration (d)
NOEC (mg/kg)
Method Reference
1 Porcellio scaber 126 800 other (Beyer et al. 1987)
2 Eisenia fetida 154 1200a OECD 207 (Vogel and Ottow 1992)
aNOEC for growth, maturity, fertility and hatchability of cocoons The NOEC-values in Table 3.16 are based on tests with sodium fluoride. The earthworm test was also carried out with potassium fluoride, resulting in a NOEC of 750 mg/kg. A reduced yield of maize was reported in NaF-treated mineral soil at F concentrations above 200 mg/kg (Slooff et al. 1988). The authors stated, however, that this effect may have been due to a secondary effect of aluminium (see also paragraph 3.1.2.1).
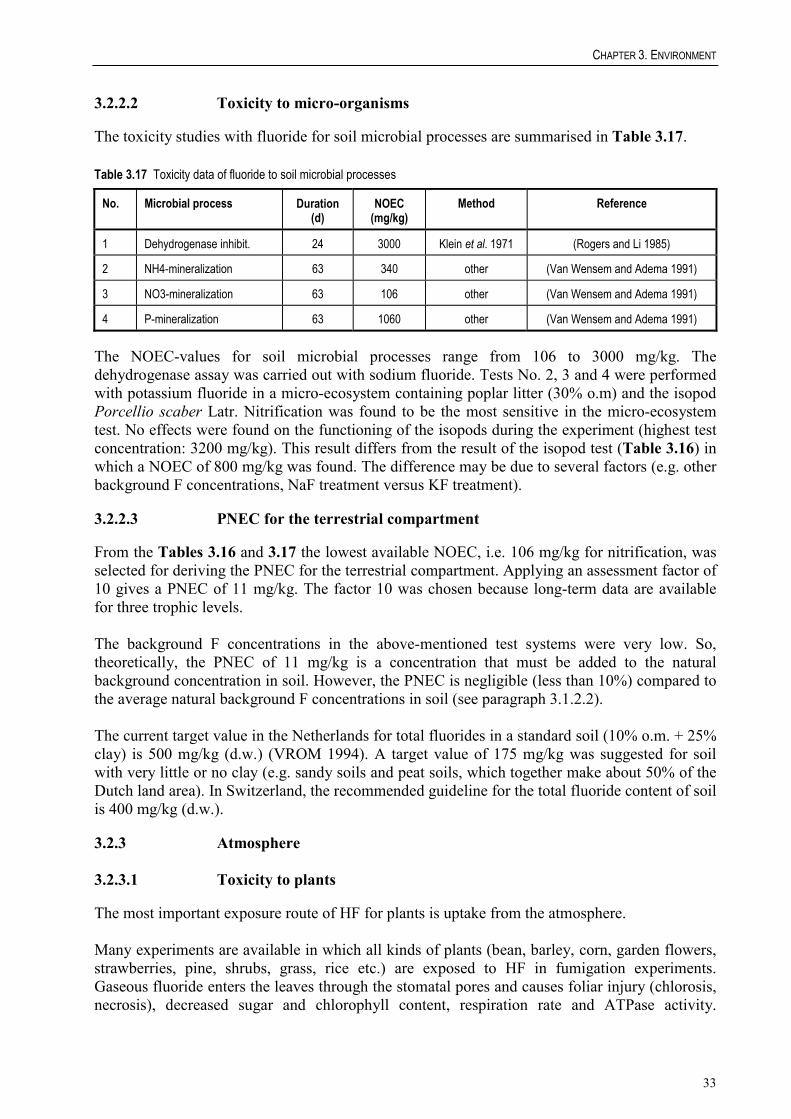
CHAPTER 3. ENVIRONMENT
33
3.2.2.2 Toxicity to micro-organisms The toxicity studies with fluoride for soil microbial processes are summarised in Table 3.17. Table 3.17 Toxicity data of fluoride to soil microbial processes
No. Microbial process Duration (d)
NOEC (mg/kg)
Method Reference
1 Dehydrogenase inhibit. 24 3000 Klein et al. 1971 (Rogers and Li 1985)
2 NH4-mineralization 63 340 other (Van Wensem and Adema 1991)
3 NO3-mineralization 63 106 other (Van Wensem and Adema 1991)
4 P-mineralization 63 1060 other (Van Wensem and Adema 1991) The NOEC-values for soil microbial processes range from 106 to 3000 mg/kg. The dehydrogenase assay was carried out with sodium fluoride. Tests No. 2, 3 and 4 were performed with potassium fluoride in a micro-ecosystem containing poplar litter (30% o.m) and the isopod Porcellio scaber Latr. Nitrification was found to be the most sensitive in the micro-ecosystem test. No effects were found on the functioning of the isopods during the experiment (highest test concentration: 3200 mg/kg). This result differs from the result of the isopod test (Table 3.16) in which a NOEC of 800 mg/kg was found. The difference may be due to several factors (e.g. other background F concentrations, NaF treatment versus KF treatment). 3.2.2.3 PNEC for the terrestrial compartment From the Tables 3.16 and 3.17 the lowest available NOEC, i.e. 106 mg/kg for nitrification, was selected for deriving the PNEC for the terrestrial compartment. Applying an assessment factor of 10 gives a PNEC of 11 mg/kg. The factor 10 was chosen because long-term data are available for three trophic levels. The background F concentrations in the above-mentioned test systems were very low. So, theoretically, the PNEC of 11 mg/kg is a concentration that must be added to the natural background concentration in soil. However, the PNEC is negligible (less than 10%) compared to the average natural background F concentrations in soil (see paragraph 3.1.2.2). The current target value in the Netherlands for total fluorides in a standard soil (10% o.m. + 25% clay) is 500 mg/kg (d.w.) (VROM 1994). A target value of 175 mg/kg was suggested for soil with very little or no clay (e.g. sandy soils and peat soils, which together make about 50% of the Dutch land area). In Switzerland, the recommended guideline for the total fluoride content of soil is 400 mg/kg (d.w.). 3.2.3 Atmosphere 3.2.3.1 Toxicity to plants The most important exposure route of HF for plants is uptake from the atmosphere. Many experiments are available in which all kinds of plants (bean, barley, corn, garden flowers, strawberries, pine, shrubs, grass, rice etc.) are exposed to HF in fumigation experiments. Gaseous fluoride enters the leaves through the stomatal pores and causes foliar injury (chlorosis, necrosis), decreased sugar and chlorophyll content, respiration rate and ATPase activity.

EU RISK ASSESSMENT – HYDROGEN FLUORIDE FINAL REPORT, OCTOBER 2001
34
Reduced yield and smaller fruits are also observed. Sensitive species are tulip, gladiolus, fruit crops, conifers and grasses, which are affected at concentrations ranging from 0.4 to 1.0 �g/m3 after exposure for several days. On the basis of a large number of fumigation experiments with plants (ornamental crops, fruit crops and conifers) exposed to HF, a relationship was derived between the no-effect-concentration and exposure time (Slooff et al. 1988). In the RIVM report NOEC values were calculated with this formula for several exposure times. In Germany (VDI 1989) NOEC-values have been calculated for highly sensitive, sensitive and slightly sensitive plant species. The Dutch Health Council (Gezondheidsraad 1990) also gave NOEC-values for all plant species and different exposure periods. A compilation of the NOEC-values is given in Table 3.18. Table 3.18 NOEC-values for HF (in mg/m3) for plants
Plant species Exposure 1 day
Exposure 1 month
Exposure 7 months
Reference
All plant species 0.76 0.34 0.27 3 month exp.
(Slooff et al. 1988)
Highly sensitive species 1.0 0.3 0.2 (VDI 1989)
Sensitive species 2.0 0.6 0.4 (VDI 1989)
Slightly sensitive species 7.5 2.5 1.2 (VDI 1989)
All plant species 2.8 0.8 0.4 (Gezondheids-raad) The lowest NOEC-value for 7-month exposure of highly sensitive plant species will be taken into consideration for the derivation of the PNEC for the atmospheric compartment. 3.2.3.2 Toxicity to invertebrates Exposure of Drosophila melanogaster to gaseous HF at 6.3 mg/m3 was lethal to all animals within 3 days (Slooff et al. 1988). Exposure to lower levels (1.5 and 3.3 mg/m3) for 3 or 6 weeks adversely affected egg production, hatchability and male fertility. 3.2.3.3 PNEC for the atmosphere The NOEC-value mentioned in 3.2.3.1 is derived from a large set of toxicity data for different sensitive and highly sensitive plant species. Because of the size and diversity of the data set and the character of the experimental set-up (ecosystem-like; 7 months exposure) the application of an extrapolation factor is considered not to be necessary. As no other trophic levels than plants are taken into account and as there are at this moment no TGD guidelines for deriving a PNEC atmosphere, the term PNECplant-air is preferred. PNECplant-air = 0.2 �g/m3 It should be borne in mind that the atmospheric NOECs are based on results of fumigation experiments in which plants were exposed to HF, the most phytotoxic F compound. This is a worst case situation, because under field conditions fluoride may also be present in the form of other, less phytotoxic compounds. For the current risk assessment report, however, this HF-

CHAPTER 3. ENVIRONMENT
35
based PNEC is directly relevant as local gaseous emissions from producers or users are mainly HF (see Table 3.2). 3.2.4 Non compartment specific effects relevant to the food chain Invertebrates Three invertebrate species were chronically exposed to fluoride via two different routes. Exposure via fluoride treated leaves adversely affected egg production and survival in flour beetles (Tribolium confusum), reproduction in fruit flies (Drosophila melanogaster) and food consumption, growth and development in cabbage looper (Trichoplusia ni), respectively. Dietary fluoride exposure via HF fumigated leaves resulted in much less pronounced adverse effects in the same species. Two generations of Mexican bean beetle (Epilachna varivestis) that were cultured on HF fumigated plants, showed an adversely affected growth, development and reproduction. The leaves contained 1000 mg F/kg. After transferring the animals to non-fumigated plants the effects were found to be reversible. Irreversibility of the reproductive effects occurred when five consecutive generations were exposed. The 72-hour LD50 values for three species of leaf eating insects ranged from 46 to 118 mg F/kg body weight. Exposure of the honeybee Apis mellifera and the silkworm Bombix mori to several soluble inorganic fluoride compounds resulted in oral LD50-values of 50 to 400 mg/kg body weight. With less soluble compounds (CaF2 and MgF2) the LD50-values were found to be above 540 mg/kg body weight (Slooff et al. 1988). Livestock Absorbed fluoride can induce various types of effects in livestock: - impairment of the rumen flora and reduced enzyme activity in the gastro-intestinal tract. As result, digestion and consequently food utilisation are inhibited. - the enamel being formed during the period of tooth development is of inferior quality,
resulting in an increased rate of wear, sub-optimal mastication and impaired (pre-)digestion. - enhanced bone dissolution and delayed bone formation. The tissues formed are deficient in
calcium and phosphorus. Symptoms include stiffness, lameness and reluctance to stand. - All these effects eventually lead to a loss of body weight and diminished meat and milk
production. Cattle were shown to be the most sensitive of domestic animals to dietary fluoride, particularly young animals. In the RIVM report (Slooff et al. 1988) NOEC values for cattle have been derived in relation to the F content of the total diet (Table 3.19).

EU RISK ASSESSMENT – HYDROGEN FLUORIDE FINAL REPORT, OCTOBER 2001
36
Table 3.19 NOEC values (in mg F/kg dry weight) for cattle with respect to the fluoride content of feed (total diet)
Atmospheric NOECs for livestock (and plants) of 0.8 �g and 0.3 �g/m3 (daily averages) were calculated for the grazing season and winter season, respectively (Slooff et al. 1988, 177: see Appendix 3). These NOEC values have been derived from the relationship between F content of animal feed and (the absence of) effects on the one hand, and from the relationship between F contents of feed (grass) and atmospheric F concentrations on the other. Both values are based on a maximum acceptable F level in feed of 55 mg/kg dry weight. No allowance has been made for a possible increase in F intake from drinking water, because the ingestion of F from feed contributes by far the largest amount to the total F intake of animals. The Dutch Health Council (Gezondheidsraad 1990) suggested the above-mentioned atmospheric NOECs may underestimate the effects of fluoride in cattle. In the Netherlands a limit concentration of 2 mg fluoride per liter has been set for drinking water for ruminants and poultry (Stoop et al. 1994). Wild-life In white-tailed deer (Odocoileus virginianus) mottling of the enamel of the incisors, distinct large areas of enamel hypoplasia and periosteal hyperosteosis of the metacarpal bones was observed at dietary fluoride concentrations of 25 mg/kg (24 months).
In feeding studies with different species of birds, the observed effects included thicker egg shells, depressed weight gain and increased mortality rate. For Sturnus vulgaris, intubated with fluoride doses up to 160 mg/kg body weight for 16 days, a NOEC of 10 mg/kg body weight was derived for mortality; the LD50 was calculated to be 17 mg/kg body weight.
In an area near an aluminium plant fluorosis was seen in black-tailed deer Odocoileus hemionus columbianus due to high fluoride levels in their forage (10-146 mg/kg in grasses and 44-333 mg/kg in browse species).
In areas with fluorosis in mule deer, elk and bison, fluoride levels of vegetation and water were up to 430 mg/kg and 24 mg/l, respectively (Janssen et al. 1989).
Foxes fed a diet containing 98 to 136 mg F/kg showed reduced milk production which caused mortality of kits (Janssen et al. 1989).
The RIVM report (Slooff et al. 1988) concluded that wild herbivores are or may be more susceptible to fluoride toxicity than domestic live stock, on a dietary F content basis. This greater susceptibility is probably due to the larger variation in F intake by wild animals, in conjunction with the influence of other stress-inducing factors in the environment. This conclusion was supported by the Dutch Health Council (1990).
Thus the atmospheric NOECs derived for livestock may provide an insufficient guarantee for the protection of wild fauna.
Criterion mg F/kg of feed (dry weight)
Annual average 30
2-Monthly average 45
Maximum 55
CHAPTER 3. ENVIRONMENT
37
3.3 RISK CHARACTERISATION 3.3.1 General In paragraph 3.1.5.3 it was stated that not only the HF industry, but also other industrial and natural sources contribute to regional and continental fluoride emissions. At these regional and continental levels the fluoride emissions from HF industry are small compared to other sources. They cannot be considered to contribute significantly to the fluoride concentrations in the aquatic, terrestrial or atmospheric compartment at a larger scale. For this reason the environmental exposure assessment was restricted to local levels close to HF producing and end-use plants. As a consequence, also the risk characterisation is only performed for the local situation. Additional information on the whole range of other F release sources in the European Union (e.g. NaF industry) is needed for an in-depth risk evaluation of fluorides. 3.3.2 Aquatic compartment The local PEC-values and the corresponding PEC/PNEC ratios for water are summarised in Table 3.20. The PNEC for aquatic organisms is 0.9 mg/l (see paragraph 3.2.1.5). For the risk characterisation the ambient background F concentration in water has been added to the PEC-values of Table 3.5 as they only represent the contribution to the receiving water. For this ambient F background concentration a value of 0.2 mg/l is chosen (see paragraph 3.1.1.2). Strictly speaking this value is known to be too low for those plants (No. 3, 5, 6 and 13) releasing their effluent streams into a marine environment (background of 1.4 mg/l; paragraph 3.1.1.2). Table 3.20 shows that based on the most recent information of each plant for two plants (No. 3 and d) the local aquatic PEC/PNEC values were larger than 1 (conclusion iii). In case of plant 3 it should be borne in mind that according to industry 83% of the fluoride emissions originate from the fertiliser production activity of this plant. In addition, the risk assessment is still based on a default dilution factor of 10 for emission into sea. This factor is used as no site-specific alternative for this default value has been submitted to the rapporteur. For plant d industry has indicated that monitoring data will become available. Since these data were not submitted within the agreed deadline, conclusion iii) is applicable. For the remaining plants the PECs in water do not exceed the PNEC (conclusion ii). The above-described risk characterisation is based on the 'hard water' PNEC of 0.9 mg/l as probably the greatest part of the receiving waters for plants 1-12/a-e is characterised by hard water conditions. However, there may be some waters with soft water conditions. If the PNEC of 0.4 mg/l for soft water would have been used in this risk characterisation the relative outcome (either PEC/PNEC >1 or PEC/PNEC <1) would have been the same (PEC/PNEC ratios in Table 3.20 should be multiplied by a factor 2.25). An exception must be made for the plants number 6 and 13 for which a PEC/PNEC of larger than 1 would be reached with the soft water PNEC of 0.4 mg/l. However, it is known that the plants number 6 and 13 discharge their effluent into a marine environment (in any case no 'soft water').

EU RISK ASSESSMENT – HYDROGEN FLUORIDE FINAL REPORT, OCTOBER 2001
38
Table 3.20 Local PEC-values and PEC/PNEC-ratios for the aquatic compartment
Plant No. PEC PEC/PNEC Year (mg F-/l)
1 0.2(L)
0.2(L) 0.2 0.2
1995(a) 1995 (b)
2 237 0.4 0.4 0.6 0.4
263 0.4 0.4 0.7 0.4
1994(a) 1995(a) 1996(a) 1997(b) 1998(b)
3 13(L) 2.9 3.1 3.2
14 3.2 3.4 3.6
1994(a)(1) 1996 1997 1998
4 0.2(L) 0.2 1994(a)(1)
5 1.2 0.2 1.7 0.2
1 0.2 2 0.2
1994(a) 1995 (a)
6 6.5 0.7 1.4 1.1
7 1 1 1
1994(a)
1995(a) 1996 1997
7 0.2(L) 0.2 1994(a)
8 0.2(L)
0.26(L) 0.2 0.3
1994(a) 1997(a)
9 0.2 0.2 1997(a)
10 0.2(L)
0.2(L) 0.2 0.2
1994(a)
1995(a)
11 0.2(L) 0.2(L)
0.2 1994(a)
1994(b)
12 0.2 0.2 1994(a)
13 0.6 0.6
0.7 0.7
1994(a)
1995(b)
14 0.2 0.2 1997
a 0.3 0.3 1994(b)
b 0.2(L) 0.2 1994(b)
c 0.2 0.2
0.2 1994(b)
1994(b)
d 9 10 1994(b)
e 0.2 0.2 1995(b)
(L)Low river flow value (1)Same for 1995 (a)Production plant (b)Use plant

CHAPTER 3. ENVIRONMENT
39
If the risk characterisation would have been based on the PNECaquatic of 3.3 mg/l according to the Aldenberg and Slob method, there are still a number of plants for which the PEC exceeds the PNEC (No. 2, 3, 6, and d in 1994, and no. 3 in 1995). Sediment As there are no measured data for fluoride levels in sediment and no ecotoxicity data for the sediment compartment, no quantitative risk characterisation is carried out for the sediment compartment. The bioavailability of fluorides in sediment is expected to be low. 3.3.3 Atmosphere The local PEC-values and the corresponding PEC/PNEC ratios for air are summarised in Table 3.21. The PNEC for plant-air is 0.2 �g/m3 (see paragraph 3.2.3.3). For the risk characterisation the ambient background F concentration in air has been added to the PEC-values of Table 3.6. For this ambient F background concentration a value of 0.07 �g/m3 is chosen (see paragraph 3.1.1.2). From Table 3.21 it can be concluded that based on the most recent emission data for each plant for two HF producing plants (no.3 and 13) and one HF using plant (No. b) the calculated PEC in atmosphere exceeds the PNEC. In case of plant 13 additional monitoring data for the years 1999 and 2000 have not removed the concern for this plant (conclusion iii). The PEC for plant No. 3 is based on the most recent (1998) emission data (conclusion iii). Conclusion (iii) is also drawn for site No. b (end use plant). The potential risk for this plant (PEC/PNEC of 17) is supported by the fact that during the 1988-1998 monitoring programme fluoride levels in grass in the vicinity of this plant were found to exceed the maximal acceptable level of 55 µg/g dw. On the other hand it should be stated that according to industry most of their HF emissions originate as a by-product during the production of organofluor compounds. In addition, industry has indicated that important reduction measures have been taken in 1998 which are expected to reduce releases substantially. For the remaining plants the PECs in air do not exceed the PNEC (conclusion ii). In addition to the PEC values in Table 3.21 that are calculated with the OPS model, 1994-1995 monitoring data are available for seven EU plants (see paragraph 3.1.5.3). For four of these plants the PEC/PNEC ratios indicate a significant risk of HF for the local atmospheric compartment (conclusion iii). Those ratios ranged from 1.2 to 12.0. The risk characterisation based on the monitoring data seems to support the one on the OPS-calculations for the years 1994-1995. At present it is not clear, however, whether the same plants are involved.

EU RISK ASSESSMENT – HYDROGEN FLUORIDE FINAL REPORT, OCTOBER 2001
40
Table 3.21 Local PEC-values and PEC/PNEC ratios for the atmosphere
Plant No. PEC PEC/PNEC Year
(�g/m3)
1 0.16 0.8 1994
2 1.1 0.36 0.34 0.33 0.13
6 1.8 1.7 1.7 0.7
1994 1995 1996 1997 1998
3 2.43 1.67 1.1 0.98 1.02
12 8
5.5 5 5
1994 1995 1996 1997 1998
4 0.31 0.22
2 1
1995 1997
5 0.2 0.19
1 1
1994 1995
6 0.09 0.5 1994(1)
7 0.08 0.4 1994
8 0.37 0.1
2 0.5
1994 1997
9 0.07 0 1997
10 1.61
0.10
8
0.5
1994(1)
1998
11 0.09 0.5 1994
12 0.09 0.5 1994
13 0.33 0.86
2 4
1994 1996
14 0.18
0.9
1997
a 0.1 0.5 1994
b 12.3 3.3
62 17
1994 1998
c 0.09 0.08
0.5 0.4
1994 1995
d 0.07 0.4 1994
e 0.08 0.4 1994
(1)Same for 1995

CHAPTER 3. ENVIRONMENT
41
3.3.4 Terrestrial compartment
Maximal local PEC values for the terrestrial compartment were calculated from deposition of HF(see paragraph 3.1.5.3). Levels were found to be negligible compared to backgroundconcentrations (conclusion ii). Measured data are only available for one HF emitting plant. Soilconcentrations in the vicinity of this plant were in the range of natural and ambient backgroundconcentrations (see paragraph 3.1.2.2).
3.3.5 Non compartment specific effects relevant to the food chain
For a number of plants the fluoride surface water concentrations (see Table 3.20) exceed theDutch drinking water limit concentration of 2 mg/l for ruminants and poultry (see paragraph3.2.4). Local air concentrations (see paragraph 3.3.3) around a number of plants exceed theatmospheric NOECs for livestock of 0.8 µg and 0.3 µg/m3 for the grazing season and winterseason, respectively (conclusion iii). It is emphasised that wild-life is probably more susceptibleto fluorides than livestock.

42
4 HUMAN HEALTH 4.1 HUMAN HEALTH (TOXICITY) 4.1.1 Exposure Assessment 4.1.1.1 General discussion At room temperature hydrogen fluoride is a liquid/gas (b.p. 19.5�C) and therefore inhalation and dermal contact are the predominant routes of exposure for the human population. Oral exposure to fluoride occurs, indirectly via the environment, via drinking water and food. An overview of the uses of HF (industrial and uses categories) is given in Table 2.2. More specified uses of HF are (see also 4.1.1.1): - as pickling agents (metal) - as intermediates (raw material) - as metal surface treatment agents - as etching agents for glass The main part of the population which is likely to be exposed to HF are workers involved in production and industrial manufacture such as workers in ceramic industry and aluminium and steel production. The producers are not aware of any direct consumer use of HF (CTEF 1995). In Sweden HF has been found in 76 products 3 of which are available to consumers. Total registered volume for 69 products amounted in 1993 to 2235-2297 tonnes (Kemi 1995). 4.1.1.2 Occupational exposure Hydrogen Fluoride (HF) is or may be produced or used in the following chemical industries (CTEF 1995; EPA 1993): - basic chemicals: production of HF; - basic chemicals: starting chemical or catalyst in the production of a variety of products such
as: * inorganic fluorides for pharmaceuticals and personal care products, nuclear fuel processing (e.g. UF6), wood preservatives, flotation agents, aluminium production * organofluoro compounds for fabric and fiber treating, surface-active agents, fluoropolymers * electronic grade inert fluorinated liquids and fluorinated gases for etching * refrigerants * pesticides - oil refineries and fuel processing: HF is used as a catalyst in the production of gasoline Occupational exposure is possible in industries where anhydrous HF is used (see 4.1.1.0) and in industries where hydrofluoric acid solution is used (see also section 2.1). Approximately 65% of produced HF is used by the producers (e.g. for the synthesis of organofluoro compounds or inorganic fluorides) (CTEF 1995).

CHAPTER 4. HUMAN HEALTH
43
Solutions of HF (hydrofluoric acid) may further be used in the following industries (EPA 1993; CTEF 1995): - metal industry: stainless steel pickling - glass industry: glass etching, polishing agents, quartz purification - electrotechnical industry: production of electronic components (etching) - mining and ore industry: special metals extraction (e.g. Nb, Ta) Further use is mentioned in corrosion inhibitors (Derivados del Fluor SA 1994; HEDSET 1994), and cleaning/washing agents, disinfectants, and polishing agents (Riedel de Haën 1994; Kemi 1995). This includes cleaning agents for facades of buildings, high pressure cleaning agents for trucks, cleaning agents for tanks and aircraft surfaces (EPA 1993; Luijk et al. 1989). Mentioned use of HF in rust removers (including consumer products) may be discontinued (CTEF 1995; Luijk et al. 1989). HF is also used in preparations used in dentistry to etch teeth before filling with composites (KEMI 1997). Results from the Swedish product register are reported in Annex 1 (Kemi 1995). The use of HF, HF solutions and products containing HF may include: - transfer of liquids by means of a transfer line and pumping; - manual transfer of liquids; - manual use of cleaning/washing agents and disinfectants and etching preparations. In the following applications, exposure to HF is possible, though in some cases to only very small amounts. Fire-fighting Exposure may occur due to the use of modern fire fighting foams containing organic fluorine compounds and due to the decomposition of fluorine compounds in the materials present in the fire (Jankovic et al. 1991). Brazing and welding During brazing and welding some HF may be formed by decomposition of fluorine compounds in welding rods or fluxes (Thorne and Hewitt 1988; Hodge and Smith 1970). Pyrolysis of fluoropolymers During the pyrolysis of fluoropolymers small amounts of HF may be formed. These activities are usually done under controlled conditions (Echt et al. 1993). Production of fertiliser In the production of fertilisers HF is formed during the reaction of the mineral with sulfuric acid (Hodge and Smith 1970; (Hery et al. 1990). Routes of exposure to HF in all the mentioned situations are by inhalation and in a minority of situations also by skin contact.

EU RISK ASSESSMENT – HYDROGEN FLUORIDE FINAL REPORT, OCTOBER 2001
44
Relevant populations potentially exposed are workers in the above mentioned industries, specifically those workers that may have more or less direct contact with the substance, being: - workers involved in the production and transferal of HF; - workers producing and drumming products containing HF (e.g. pickling agents, polishing
agents, cleaning/washing agents); - maintenance and (specialised) cleaning workers in production facilities of HF and of products
containing HF; - workers using products containing HF in the above mentioned industries; - workers exposed to decomposition products of materials containing fluorine The exposure is assessed using the available information on substance, processes and work tasks. More detailed information on these parameters may lead to a more accurate exposure assessment. In this part of the assessment, external (potential) exposure is assessed using relevant models and other available methods in accordance with the Technical Guidance Documents and agreements made at official Meetings of Competent Authorities. Internal dose depends on external exposure and the percentage of the substance that is absorbed (either through the skin or through the respiratory system). The exposure is assessed without taking account of the possible influence of personal protective equipment (PPE). If the assessment as based on potential exposure indicates that risks are to be expected, the use of personal protective equipment may be one of the methods to decrease actual risks, although other methods (technical and organisational) are to be preferred. This is in fact obligatory following harmonised European legislation. Knowledge of effectivity of PPE in practical situations is very limited. Furthermore, the effectivity is largely dependent on site-specific aspects of management, procedures and training of workers. A reasonably effective use of proper PPE for skin exposure may reduce the external exposure with 85%. For respiratory protection the efficiency depends largely on the type of protection used. Without specific information, a tentative reduction efficiency of 90% may be assumed, equivalent to the assigned protection factors for supplied-air respirators with a half mask in negative pressure mode (NIOSH, 1987). Better protection devices will lead to higher protection. Imperfect use of the respiratory protection will lower the practical protection factor compared to the assigned factor. These estimations of reduction are not generally applicable "reasonable worst case" estimations, but indicative values based on very limited data. They will not be used directly in the exposure and risk assessment. Furthermore, the reduction of external exposure does not necessarily reflect the reduction of absorbed dose. It has to be noted, that the use of PPE can result in a relatively increased absorption through the skin (effect of occlusion), even if the skin exposure is decreased. This effect is very substance-specific. Therefore, in risk assessment it is not possible to use default factors for reduction of exposure as a result of the use of PPE. In some specific situations the model estimates with normal assumptions for input parameters in the assessed exposure scenarios are expected not to lead to a reasonable assessment of exposure. For situations with high risk of direct acute effects, such as manual handling of corrosive substances and hot materials, or possible inhalation exposure of substances with severe acute effects on the respiratory tract, the total level of containment given by all exposure control measures is assumed to be higher than for similar scenarios with other substances. For estimating a single day exposure an extra protection is assumed, reducing exposure with 90%. The extra

CHAPTER 4. HUMAN HEALTH
45
protection can be reached by a combination of technical and organisational control measures and personal protective equipment. If the extra protection is reached (mainly) by using personal protective equipment, this is an unwanted situation that should be changed by further technical and organisational control measures. Repeated exposure to corrosive concentrations will not normally occur. Some exposure to non-corrosive exposure may however still occur, e.g. to highly diluted concentrations after decontamination of surfaces. The estimate of repeated dermal exposure depends on the knowledge of the concentration that probably does not cause corrosive effects. If such a concentration can be estimated, this concentration will be used in estimating repeated dermal exposure. Otherwise the estimate for single day exposure will be used. The following data (if available) are used for occupational exposure assessment: - physico-chemical data of HF and products containing the substance: physical appearance,
vapour pressure at room temperature, percentage of HF in products; - data regarding methods of use and use pattern of the substance and products potentially
containing HF and exposure control pattern in the relevant industries (from the HEDSET or other sources);
- exposure data for HF from the HEDSET and other sources (literature, exposure databases); - results from exposure models if applicable (EASE model); in the exposure models the above
mentioned types of data are used. For the occupational exposure assessment the exposure situations can be clustered into three scenarios based on the type of use of HF. In the first scenario use of mostly anhydrous HF in almost completely closed systems is considered. The second scenario considers use of hydrofluoric acid solutions. The third scenario indicates possible exposure levels in situations where HF is not used, but is produced as a result of heating fluor containing components. Occupational scenario 1 Production and use as an intermediate or catalyst (chemical
industry). Occupational scenario 2 Electronics manufacturing and other use of aqueous HF
(use of hydrofluoric acid solutions). Occupational scenario 3 Exposure not resulting from the use of HF (indirect
exposure). Occupational scenario 1: Chemical industry This scenario includes the production of HF and its use as an intermediate (e.g. for fluorocarbons) or catalyst (e.g. production of alkylates for gasolines). HF is mainly used as anhydrous HF in this scenario, although some hydrofluoric acid solutions are used in the production of inorganic fluorides. It has been known for many years that HF is (very) toxic and has a high vapour pressure (boiling point � 19�C). Therefore production, transferal and subsequent use as a catalyst or intermediate occur in closed systems. Transferal may involve flexible hosing, pumping and cylinders that may lead to some leakage of HF. Some processes in which HF is used also require pumping. However, equipment and working methods are generally chosen to minimise possible losses of HF (EPA 1993). For certain activities, such as checking the level of HF catalyst and sampling for analytical purposes, valves may have to be opened manually and some HF will evaporate. These activities
EU RISK ASSESSMENT – HYDROGEN FLUORIDE FINAL REPORT, OCTOBER 2001
46
are usually performed applying strict protective measures to keep exposure levels to a minimum. High exposures may occasionally be encountered by maintenance workers (Brown 1985). A small number of exposure data regarding this type of use has been provided by the producers or was found in a literature search (see Annex 2). Exposure data gathered previous to 1970 are considered to be out-dated. In the abstract of a Health Hazard Evaluation Report (HHE) by NIOSH, short term workplace concentrations well below the NIOSH Short Term Exposure Limit (STEL) of 2.5 mg/m3 are reported (Markel and Slovin 1982). The abstract of another HHE by NIOSH reports one sample approaching the same value (Gunther and Thoburn 1982). In an alkylation unit, plant operators and maintenance workers were exposed to < 0.005 to 0.18 mg/m3 of fluoride (4 to 6 hours time weighted averages). The highest level was measured for a maintenance worker. All other levels were below 0.04 mg/m3 (Brown 1985). A fourth publication mentions accidental peak exposure to HF mist of 150 to 200 ppm (100-133 mg/m3) during 2 minutes (Lee et al. 1993). Confidential data from producers all show exposure levels below 1 mg/m3 or exposure is described as being "below the occupational exposure limit" (3 ppm or 5 mg/m3) (ICI 1994; Riedel de Haën 1994; Bayer AG 1994). For inhalation exposure to vapours of highly volatile substances in closed systems the EASE model estimates (reasonable worst case estimates): - without breaching: 0-0.1 ppm (0-0.08 mg/m3); - with breaching (= non dispersive use with LEV): 100-200 ppm (80-160 mg/m3). The limited exposure data found indicate that normal short term (10-15 minutes) inhalation exposure levels are generally below 2.5 mg/m3. The EASE model results for "non dispersive use with LEV" appear to be excessively high, while the results for "closed systems, full containment" underestimate potential exposure levels. This is probably due to the fact that even closed systems that are not intentionally breached will still exhibit small, unintended leaks, leading to evaporation of relatively small amounts of HF. If larger leaks occur, toxic concentrations of HF can soon be reached, as shown by the reports on accidental exposures (Lee et al. 1993; Braun et al. 1984). For normal working conditions a short term exposure level of 2.5 mg/m3 will be used as a reasonable worst case estimate for this scenario. Full shift exposure levels will be lower. They are estimated to be up to about 0.5 mg/m3 (calculated from a concentration of 2.5 mg/m3 during somewhat less than 2 hours and no exposure during the remainder of the day) which may be reached if several activities that lead to exposure occur on one day. Skin exposure to HF in this scenario is rather uncommon. Actual exposure to anhydrous HF or hydrofluoric acid solutions in high concentrations is very dangerous. The use of engineering controls to prevent leakage of HF is normal procedure. However, as shown by several case reports, accidental leakage of HF occurs occasionally, leading to inhalation as well as skin exposure (Braun et al. 1984; Chan et al. 1987). Furthermore, some activities require manual handling, in which case precautions will be taken to limit potential contact and the use of protective clothing is required. The commonly used skin exposure models are considered inapplicable for this substance. Skin exposure is considered to occur only accidentally in this scenario.

CHAPTER 4. HUMAN HEALTH
47
The duration of exposure to HF cannot be concluded from the reported data. Generally exposure will occur through small leakages and occasional opening of valves and other manual handling. It is estimated that duration of inhalation exposure due to specific activities is low (1-2 hour/day), whereas 4-8 hours per day exposure to background concentrations may be possible. Frequency of exposure depends on work patterns, but daily exposure is possible. Occupational scenario 2: Use of hydrofluoric acid solutions This scenario includes several rather different exposure situations. Included are: - the use of solutions for etching in the metal and glass industries; - the use of products for rust removal and/or cleaning facades; - the use of special products for other (small scale) uses, such as in dentistry. Hydrofluoric acid solutions are used in the manufacture of electronic components for surface treatment (etching). It is usually purchased in concentrations of typically 49% and diluted to solutions of 1 to 10%. In a typical process it is pumped from drums through etching basins (EPA 1993). Other processes in which aqueous HF is used are metal pickling, glass etching and similar processes (EPA 1993). The use of HF in industrial cleaning (e.g. in acid baths or cleaning products for facades of buildings) is mentioned in some sources (Luijk et al. 1989; Sheehy and Jones 1985; Marquart 1990; Van de Laar et al. 1994). The use of HF for etching will mainly be in baths, tanks etc. Exposure is possible due to evaporation of HF from the baths, during dilution of concentrated preparations and during preparation of the baths with higher concentrated HF. In cleaning activities, such as cleaning the facades of buildings, products in the form of liquids or pastes are used and are often removed after some time by washing with (copious amounts) of water. In some cases, e.g. in the cleaning of facades, the water may be applied by (high pressure) spraying. This may lead to the formation of aerosols. Skin contact is possible during the preparation of solutions, loading and unloading baths and equipment and during cleaning activities. Some exposure data, mainly regarding etching, have been found in literature. Exposure levels (probably short term measurements) of up to more than 7.5 ppm (6 mg/m3; = arithmetic mean + standard deviation) have been measured during etching of metal and glass in Finland (Finnish Registry 1995). Kono et al. (1987; 1990; 1992) report averages for several workshops of up to 5 ppm (4 mg/m3). Another source reports levels up to 3 ppm (2.4 mg/m3) (Burr et al. 1990). Levels from stationary full shift sampling by the INRS are up to 1.8 mg/m3 (2.25 ppm) in usual conditions (INRS 1995). Measurements of HF by area sampling around acid baths have been reported. One sample was taken at the edge of a bath containing 13% HF. The concentration was 2.7 mg/m3. At the edge of another bath (in a different facility) containing an unknown percentage of HF, 0.14 to 0.19 mg/m3 was measured in 4 measurements. Duration of measurements was 2 to 8 hours (Sheehy and Jones 1985). The applicable choices in the EASE model for this scenario are: non dispersive use and local exhaust ventilation. For estimating the exposure level, the vapour pressure of HF in the diluted solutions should be known. According to the HEDSET, a 40% solution has a vapour pressure of 6 hPa. Extrapolating from the data in the HEDSET, a solution of 10% has a vapour pressure of

EU RISK ASSESSMENT – HYDROGEN FLUORIDE FINAL REPORT, OCTOBER 2001
48
approximately 26 Pa, whereas a solution of 1% has a vapour pressure of approximately 10 Pa. Solutions of less than 40% are clearly of "low volatility" in the EASE model. The estimated exposure level for non dispersive use and local exhaust ventilation is therefore 0.5-3 ppm (0.4-2.4 mg/m3). If aerosol formation is to be expected, the model estimates an exposure level of 100-200 ppm (80-160 mg/m3). The EASE model estimations (disregarding the formation of aerosols) are in the same range as the results presented in the literature. The presented measured data mostly represent short term exposure levels, while the EASE model estimates full shift levels. From the measured data it is estimated that reasonable worst case short term exposure levels in this scenario are up to 7.5 ppm (6 mg/m3), while full shift levels may be up to 3 ppm (2.4 mg/m3). In these estimates it is assumed that most measured exposure levels were short term levels. The data on full shift stationary sampling under typical conditions by INRS are in reasonable agreement with the estimate for full shift levels. Typical full shift levels are expected to be about 1/2 of the reasonable worst case levels (expert judgement). The exposure during use of facade cleaners containing HF cannot be estimated. The EASE model results are probably overestimating exposure levels, since they are based on indoor measurements, while the cleaning of facades usually is outdoors, where ventilation is much higher. Furthermore, this type of use consists of manually applying pastes containing acids and (after some time) removing the pastes by means of high pressure cleaning. It is not clear whether this activity will lead to aerosols containing HF or whether all the hydrofluoric acid will have reacted with the components on the facades. The use of HF for this type of activity probably only constitutes a (very) minor use. However, under worst case conditions (e.g. cleaning virtually enclosed facades) this type of use may lead to relatively high exposure levels, depending on methods of use and amounts and percentages used. The use of HF in dentistry concerns preparations with a percentage of up to 9% of HF. It is probably a very small scale use involving very small amounts of HF per day (KEMI 1997). Exposure will be substantially below the values estimated for other activities in this scenario. Some skin contact cannot be excluded. Duration of inhalation exposure may be up to 8 hours per day for certain operations, whereas in other cases duration of exposure will be less. Frequency of exposure may be up to 100 days per year. Skin exposure to dilute solutions of HF is possible due to preparation of solutions, filling and emptying of baths, contact with treated objects and cleaning activities. It is generally known that even dilute solutions can lead to effects. Workers using solutions of HF daily will be aware of the potential effects and will thus try to prevent routine skin exposure. However, occasional skin and eye exposure does occur and is mentioned in several sources (El-Saadi et al. 1989; Burns and Paterson 1989; Stencel and Tobin 1987; LaDou 1991). Due to the irritating and corrosive properties of HF solutions workers must rely on protective clothing to prevent actual exposure, since potential exposure levels may be considerable, e.g. when handling material that has been in an acid bath. Incidentally workers may receive actual exposure due to faulty protective equipment, faulty work procedures or failure of the protective equipment. In The Netherlands 16 cases of acute effects due to clearly identified skin contact with HF have been reported in a period of 9 months in 1993, mainly in cleaning activities for facades and metal products. The study was restricted to accidents due to the manual use of etching, cleaning and disinfecting agents. In 8 of these cases no personal protective equipment (gloves) were used

CHAPTER 4. HUMAN HEALTH
49
during (part) of the activities, mainly due to lack of knowledge regarding the products and its possible effects, or due to severe underestimation of the risks. In three of these cases the worker involved was aware of the dangers, but was not aware of some of the exposure sources (e.g. contaminated surfaces). Working under strict deadlines contributed to some of these cases. In 5 cases the personal protective equipment used was inadequate (holes, liquid getting inside of short gloves, wrong material). These data clearly show that there is a high potential of dermal contact if workers are not fully aware of the risks and if adequate personal protective equipment is not properly used. No quantitative information on exposure was available, except for data on the concentration of HF in the liquids. Mentioned concentrations were between 35 and 350 g/L (approximately 3.5-35%) (Van de Laar et al. 1994). Since measured exposure data are lacking, exposure has to be estimated by modelling. Potential exposure is estimated using the EASE model for dermal exposure with the following assumptions. Exposure in the etching of metal and glass will be non-dispersive use with direct handling and incidental contact. The area potentially exposed due to preparation of solutions (1-49% HF) and filling and emptying of baths is estimated to be a part of the fingers of a hand (100 cm2). This leads to the following potential exposure levels (non-dispersive use, incidental contact): - solution 49%: 0-5 mg/day; - solution 1%: 0-0.1 mg/day. Manual handling of 49% HF in this scenario is not considered to be a normal procedure. The area potentially exposed due to the handling of wet surfaces (1-10% HF) will be higher. The estimated area (part of the fingers and palms of two hands) is 450 cm2, leading to the following potential exposure levels (non-dispersive use, incidental contact): - solution 10%: 0-4.5 mg/day; - solution 1%: 0-0.45 mg/day. Potential exposure due to manual cleaning (e.g. facades, metal parts of tank trucks and other objects) will be considerably higher. Unexperienced and not fully trained workers sometimes do not take sufficient precautions against direct and intensive contact with products containing HF. As shown in the Dutch study, reported above, this often leads to severe acute effects. Even when personal protective equipment is used, this may not be adequate, since the contamination of the inside of gloves is reported in several cases (Van de Laar et al. 1994). Assuming the use of products containing 3.5-35% HF, extensive contact, non-dispersive use and a contact area of 650 cm2 (one hand and part of the forearms) the potential exposure is estimated to be approximately 23-1100 mg/day (1-5 mg/cm2/day.650.0.035-0.35%). In this scenario the exposure to a corrosive substance or a substance with acute serious effects on the respiratory tract is assessed. The models used to estimate the exposure levels are not specifically aimed at estimating exposure levels for such a situation. The total containment, a combination of technical and organisational measures and personal protective equipment, is in such a situation usually considerably better than average. Therefore, the results of the exposure estimate by the model are for this situation (by default) multiplied by a factor of 0.1 for use in risk characterisation. This factor is based on expert judgement. For this scenario the reasonable worst case exposure for a single day is calculated to be 0.5 mg/day for etching and 110 mg/day

EU RISK ASSESSMENT – HYDROGEN FLUORIDE FINAL REPORT, OCTOBER 2001
50
for manual cleaning and facade cleaning using this default estimation method. Repeated exposure to concentrations that lead to corrosive effects is not to be expected. However, repeated contact with (very) diluted solutions, by penetration of protective equipment, or by contact with slightly contaminated surfaces is considered possible. The concentration that will not lead to corrosive effects is unknown. Therefore, the lower limit of the range given above for single day exposure, including a factor of 0.1 for extra total containment, will also be used as an upper bound estimate of repeated dose exposure due to manual cleaning and facade cleaning: 0.2 mg/day (expert judgement). This level relates to concentrations of up to 3.5%, that lead to severe local effects. The upper bound estimate is therefore assumed to be a (severe) overestimation of true repeated dermal exposure levels. The activities possibly leading to dermal exposure are expected to be done up to 100 days per year, with actual dermal exposure (even to low concentrations) probably being less frequent. Scenario 3: exposure not resulting from the use of HF (indirect exposure) This "scenario" consists of a group of very different work situations, practices and possible exposures that have one thing in common: exposure to HF is not the result of using HF or a product containing HF. Although these scenarios may not have to be evaluated for the purposes of the existing substances regulations, some data are included for comparison with the other scenarios. In all of the work situations in this scenario HF is formed by heating of fluoride containing substances. The exact composition of the substances, the heating energy, duration of heating and exposure control measures will influence levels of inhalation exposure to HF. The work situations and exposure levels gathered in this scenario are given below. Fertiliser production Exposure is continuous, due to the processes used. Measured exposure levels are <1 to >10 mg/m3 (probably short term measurements) (Hodge and Smith 1970; Hery et al. 1990). Aluminium industry Exposure is continual, due to the processes used. Measured exposure levels are <1 to >10 mg/m3 and "levels above exposure limits" (Hodge and Smith 1970; Miszke et al. 1984). Magnesium foundries and melting The exposure is probably due to similar processes as in the aluminium industry. Measured exposure levels are <1 to >10 mg/m3 (Hodge and Smith 1970). Fire fighting Exposure depends on the materials present in the fire. The use of fluorine containing fire-fighting foams is probably not very important for the exposure levels. Exposure levels measured are potential exposure levels. Actual exposure levels (inside respirators) will be very much lower. The use of personal protective equipment in fire fighting is standard procedure due to the possible presence of life threatening concentrations of several substances as well as the lack of
CHAPTER 4. HUMAN HEALTH
51
oxygen. Potential exposure levels measured are < 0.1-6.4 mg/m3 (Jankovic et al. 1991). HF is not a very important risk factor in fire fighting compared to other factors. Very low levels of HF were measured in: - polymer treatment: <0.01 mg/m3 (short term) (Echt et al. 1993); - brazing, soldering and welding: <1 mg/m3 (Hodge and Smith 1970). These low levels are explained by the (very) small amount of fluorine that is available for conversion to HF and by the use of engineering controls, such as local exhaust ventilation. HF does not appear to be an important risk factor in these two situations. The results presented by Hodge and Smith (Hodge and Smith 1970) are from measurements before 1970 and may not be valid for present conditions. However, from the scarce results it can be seen that in some situations where HF is not used, but is a pollutant resulting from the heating of fluoride containing components, exposure levels can be at least as high as in the other two scenarios. Skin exposure in this scenario cannot be estimated. Some deposition of vapours or aerosols containing HF is to be expected. However, concentrations of HF on contacted surfaces and skin exposures due to contact with these surfaces are expected to be considerably below the values mentioned in scenario 2. Duration and frequency of exposure depend on the frequency of heating of fluoride containing components leading to the production of fumes containing HF. In the fertiliser industry and the aluminium industry frequency may be daily and duration up to 8 hours per day.

EU RISK ASSESSMENT – HYDROGEN FLUORIDE FINAL REPORT, OCTOBER 2001
52
aFu
ll sh
ift e
xpos
ure
calc
ulat
ed fr
om 1
.6 h
our a
t 2.5
mg/
m3 a
nd n
eglig
ible
exp
osur
e du
ring
the
rem
aini
ng 6
.4 h
ours
. In
pra
ctic
e th
e ba
ckgr
ound
exp
osur
e m
ay b
e hi
gher
, but
for c
ompe
nsat
ion
the
dur
atio
n o
f hig
h ex
posu
re m
ay b
e lo
wer
b Exp
ert j
udge
men
t bas
ed o
n st
atio
nary
mea
sure
men
ts a
nd o
nm
easu
red
data
that
are
pro
babl
y sh
ort t
erm
dat
ac T
he in
hala
tion
expo
sure
for m
anua
l cle
anin
g an
d po
lishi
ng is
pro
babl
y be
low
the
leve
l of e
tchi
ng, d
ue to
the
low
vol
umes
han
dled
. The
inha
latio
n ex
posu
re d
ue to
faca
de c
lean
ing
cann
ot b
e e
stim
ated
with
the
avai
labl
e in
form
atio
n an
d m
etho
dsd T
he re
peat
ed e
xpos
ure
is a
n up
per b
ound
est
imat
e th
at p
roba
bly
(sev
erel
y) o
vere
stim
ates
true
exp
osur
e le
vels
e The
se a
re ro
ugh
estim
ates
bas
ed o
n m
easu
red
data
that
wer
e lim
ited
in q
uant
ity a
nd q
ualit
y an
d ar
e on
ly p
rese
nted
for c
ompa
rison
with
the
othe
r 2 s
cena
rios
f Can
not b
e es
timat
ed, b
ut a
re c
onsi
dere
d to
be
clea
rly b
elow
the
leve
ls in
sce
nario
2
Con
clus
ions
Tabl
e 4.
1 C
oncl
usio
ns o
f the
occ
upat
iona
l exp
osur
e as
sess
men
t
Scen
ario
/su
bsce
nario
Act
ivity
Freq
uenc
y(d
ay/y
ear)
Dur
atio
n(h
r/day
)Es
timat
ed in
hala
tion
expo
sure
leve
l; R
WC
Estim
ated
inha
latio
n ex
posu
rele
vel;
typi
cal
Estim
ated
ski
n ex
posu
re le
vel
(mg/
m3 )
Met
hod
(m
g/m
3 ) M
etho
d (m
g/cm
2 /day
) do
se
(mg/
day)
1: c
hem
ical
indu
stry
gene
ral
peak
act
iviti
esfu
ll sh
ifta
100-
200
100-
200
6-8
1-2
6-8
very
low
2.5
0.5
EASE
,m
easu
red
mea
sure
dca
lcul
ated
not e
stim
ated
acci
dent
al
acci
dent
al
2: u
se o
fhy
drof
luor
ic a
cid
solu
tions
etch
ing:
prep
arin
g an
dcl
eani
ng b
aths
etch
ing:
full
shift
;
man
ual c
lean
ing/
faca
de c
lean
ing:
full
shift
50-1
00
50-1
00
50-1
00
2-3
6-8
6-8
6.0
2.4
nec
Mea
sure
dan
d EA
SE
Expe
rtb1.
2
not e
stim
ated
Expe
rtb
not e
stim
ated
not e
stim
ated
0.5
(sin
gle
day)
110
(sin
gle
day)
0.2
(repe
ated
d )
3: in
dire
ctex
posu
rese
vera
l 10
0-20
0
6-8
<1 -
ca. 1
0eM
easu
red
not
es
timat
edca
nnot
be
estim
ated
f

EU RISK ASSESSMENT – HYDROGEN FLUORIDE CHAPTER 4. HUMAN HEALTH
53
4.1.1.3 Consumer exposure The producers of HF stated that there is no consumer exposure since the historic uses for aqueous hydrogen fluoride e.g. rust cleaning agents have been discontinued (CTEF 1995). It appeared that consumer use only occurs in accidental cases e.g. workers use industrial products in private life or HF containing products are reformulated and/or marketed as consumer products. However, Velvart (Velvart 1993) mentioned the use of aqueous HF in facade- and stone cleaning agents and in rust spot remover for textiles in concentrations of 10% and 10-15%, respectively, both products being available to consumers. In addition, in the Swedish product register 3 HF-containing products were mentioned as pickling agents (metal) for non-occupational uses (CTEF 1995). Accidents were reported in the Netherlands after non-occupational use of an HF containing cleaning agent (Van de Laar et al. 1994). Other Dutch information mentioned 2 products available to consumers (facade cleaning (25% HF) and stainless steel polishing paste (4.5% HF) (Bragt 1995). Recently information was obtained from the Anti-poison centre in Belgium which shows that the use of aqueous hydrogen fluoride in rust cleaning and stone and wood cleaning agents, all available and marketed to consumers, is still common practice in Belgium (SZV&W, 1999). A significant number of accidents through the use of these products have been reported. An overview of the information collected by the Anti-poison Centre is given in Annex 4. Details about the concentration of HF in the products are not available but it is mentioned that solutions up to 75% are available in certain hardware stores. 4.1.1.4 Indirect exposure via the environment As mentioned in previous sections hydrogen fluoride may enter the environment from both natural and anthropogenic sources. It is concluded in section 3.3.1 that the contribution of HF emissions from the HF producing and processing industry is limited compared to those from other industrial sources. In air, water and soil HF is transformed to a variety of other fluoride anion containing compounds. 4.1.1.4.1 Fluoride exposure from air Local fluoride concentrations (PEC's) are calculated for the atmospheric compartment for 13 HF-producing plants (some are both producer and user) and 5 end-user plants (a-e). The data are listed in Tables 3.6. In addition to the calculated atmospheric HF concentrations monitoring data are available for some plants. The measured data are listed in Table 4.2 and range from 0.05 - 2.4 �g/m3. The calculated local atmospheric HF concentrations for each production and end use plant are given in Table 4.3 and range from 0 -3.2 �g/m3.

EU RISK ASSESSMENT – HYDROGEN FLUORIDE FINAL REPORT, OCTOBER 2001
54
Table 4.2 Summary of measured local
aFor specific data see section 3.1.5.3 These data are of the same order of magnitude as the measure data. In both tables the actual inhaled amount in �g/day is calculated assuming an average respiration rate in an adult person of about 20 m3 per day. The concentrations presented in Table 4.3 are strictly related to local plant sites and are exclusive the background concentration.
Plant Air concentration a Actual intake �g/m3 �g/d
NL 0.1 1
2 20
D I 1.3 26
D II 2.4 48
UK I
0.06 0.23
1.2 4.6
EU 0.05-0.06 1-1.2

CHAPTER 4. HUMAN HEALTH
55
Table 4.3 Summary of calculated local atmospheric PEC-values and actual intakes
Plant No. Annual average Air concentration (1)(2) (100 m)
Actual intake Year
�g/m3 �g/d 1 0.091 1.82 1994 2 1.03
0.29 0.27 0.26 0.06
20.6 5.8 5.4 5.2 1.2
1994 1995 1996 1997 1998
3 2.36 1.60 1.0 0.91 0.95
47.2 32 20
18.2 19
1994 1995 1996 1997 1998
4 0.24 0.16
4.8 3.2
1995 1997
5 0.13 0.12
2.6 2.4
1994 1995
6 0.024 0.48 1994(3) 7 0.013 0.26 1994 8 0.30
0.037 6.0 0.74
1994 1997
9 0(4) 0 1997 10 1.54
0.03 30.8 0.7
1994(3)
1998 11 0.023 0.46 1994 12 0.023 0.46 1994 13 0.26
0.79 5.2 15.8
1994 1996
14 0.26 0.11
5.2 2.2
? 1997
a 0.03 0.6 1994 b 12.2
3.2 244 64
1994 1998
c 0.016 0.012
0.32 0.24
1994 1995
d 0.0038 0.076 1994 e 0.0099 0.20 1994
(1)Calculated with OPS (operational atmospheric transport model Priority Substances), which is also the air-model in the Technical Guidance Document (2)Concentrations are strictly related to local plant sites and the ambient background concentration is not included (3)Same for 1995 (4)Gas-washer installation

EU RISK ASSESSMENT – HYDROGEN FLUORIDE FINAL REPORT, OCTOBER 2001
56
4.1.1.4.2 Comparison of inhalatory exposure to fluoride with intake via food and water To get an impression of the relevance of the actual additional intake of fluoride via air in Table 4.4 an overview is given of the fluoride exposure via food and drinking water. The fluoride intake by adults from food and drinking-water has been estimated in several studies. In Table 4.4 estimations of the average daily intake of inorganic fluoride via food and water are given for low and high fluoride areas with drinking water containing 400 �g F/l and about 1000 �g F/l, respectively. In the Netherlands where the drinking water is not fluoridated, fluoride drinking water levels range from 1180 - 5640 �g/l (Slooff et al. 1988). Table 4.4 Fluoride exposure through food and water
Reference Intake (low fluoride area) mg F/day
Intake (high fluoride area) �g F/day
WHO/IPCS (1984) 430 - 910 990 - 5400
CEPA (1993) 2212 - - 3981
The concentration of 0.048 mg F/day for both the measured and calculated PEC-values (see Tables 4.2 and 4.3) rounded to 50 �g F/day is used as a realistic worst case situation of inhalatory exposure to fluoride of the population at large. With respect to the intake via food and water the highest value of 5640 �g F/day has been taken into account as a worst case situation (see Table 4.5). Human intake of fluoride may also include iatrogenic sources. Dental products that contain fluoride, such as toothpaste have been identified as significant sources of inorganic fluoride (CTEF 1995). It is assumed that 10% of toothpaste is ingested. At a daily consumption of 2.25 g of toothpaste, the ingested fluoride amounts to 0.2 - 0.3 mg F/day (Slooff et al. 1988). For the comparison 300 �g F/day is used. The estimates for the total human fluoride exposure via all routes in fluoridated and non-fluoridated areas is given in Table 4.5. Table 4.5 Estimates of total daily fluoride intake of adults
Route Intake (�g F-/day)
Food & drinking water 5640
Air (HF) 50
Toothpaste 300
Total intake 5990
From the data in Table 4.5 it is concluded that HF contribution to total daily fluoride intake is negligible.
CHAPTER 4. HUMAN HEALTH
57
4.1.1.5 Combined exposure See section 4.4.3.4 4.1.2 Effect assessment 4.1.2.1 Toxicokinetics, metabolism, and distribution This section of the document is primarily concerned with the hazards associated with exposure to HF rather than exposure to inorganic fluoride. However, it should be noted that in studies aiming at the description of kinetic aspects of fluoride or HF it is always the F- ion which is finally determined, usually by ion-selective electrodes or incidentally by highly sophisticated systems like flame-ionisation chromatography. None of these methods can discriminate between the nature of the original source of the determined fluoride. Kinetics of fluoride have been extensively reviewed (e.g. WHO 1984; Thiessen 1988). Absorption of any inorganic fluoride is thought to be a passive process. Inorganic fluoride of any source is thought to be transported across biological membranes primarily as molecular (non-ionic thus uncharged) HF. At physiological pH (in blood, intercellular fluid, mucus) free fluoride (thus not associated with e.g. proteins or lipids) exists primarily as fluoride ion (F-); only 0.01% of the total free fluoride concentration exists as molecular HF in equilibrium with the ionic form (Anonymus 1996). The fate or effects of absorbed inorganic fluoride are independent of the fluoride source (Thiessen 1988). Absorption Inhalation Experiments in which rats were head-only exposed to HF gas, demonstrated that over 99% of the inhaled HF does not reach the lungs but is rapidly absorbed via the lining of the upper respiratory tract. A linear relationship was observed between the HF concentration to which the rats were exposed and the plasma fluoride level. The virtually complete absorption of HF in the upper airways was determined in an experiment in which HF contents of the inhaled air was analyzed via an endotracheal tube (Morris, Smith 1982). Inhalatory uptake of fluoride has also been observed in humans and rabbits (Dinman 1976; Kirk-Othmer 1980; Largent 1960). For instance, human volunteers who breathed 1.16 to 3.9 mg HF/m3 for period of 15 to 30 days excreted F- in their urine in average daily amounts of 3.44 to 19.9 mg over the entire period of exposure. Lund et al. exposed human volunteers for 1 hour to constant concentrations of HF, ranging from 0.2 to 5.2 mg HF/m3. From 0.7 mg/m3 upwards, a linear relationship between exposure and increase in plasma fluoride levels was observed. Maximum plasma levels (ca. 18-80 ng/ml) were seen at 60 to 120 minutes after the start of the exposure (Lund et al. 1997). Dermal Dermal uptake of F- from liquid HF in humans has been reported by Burke et al. (1973). A man, accidentally exposed to about 5 g of HF excreted 404 mg F- in the urine over the first three days following the accident (Burke et al. 1973). From the reported data it is impossible to quantify the rate of absorption of HF after dermal exposure.

EU RISK ASSESSMENT – HYDROGEN FLUORIDE FINAL REPORT, OCTOBER 2001
58
In rats which were dermally exposed to 2% HF (2 ml/kg b.w., under occlusion) in water for 1 or 4 hr, serum fluoride reached levels 3 to 6 times (0.78 - 1.42 mg/l) above the level in the controls (0.25 mg/l) at one hour after the exposure. The serum levels increased with exposure time and decreased to near normal values over the next 96 hr (Derenlanko et al. 1985). Oral Oral uptake of HF has not been studied. However, because of the rapid absorption of fluoride from the gastro-intestinal tract, it is conceivable that HF will be rapidly absorbed after oral administration (Wallace-Durbin 1954; Van Asten et al. 1996). The absorption of orally administered fluoride depends on the presence of fluoride-binding cations such as calcium, magnesium and especially aluminium (CEPA 1993; Janssen 1989; WHO 1984) and on the formulation of the fluoride [e.g. in pharmaceutical preparations (Van Asten et al. 1996)]. Distribution After uptake fluoride is transported in the blood. 75% of the total blood fluoride concentration is present in the plasma; the remainder is associated with the red blood cells. About 50% of the fluoride in serum is bound to organic molecules, mainly in perfluoro-fatty acids (WHO 1984) and thus in a non-ionic form. Fluoride distributes throughout all soft tissues, without particular accumulation in one of these. It may also cross the placenta and reach the unborn child. Sequestration of fluoride occurs in bone and teeth, in which it is incorporated into the mineral structures by exchange with hydroxyl groups. About half of the absorbed fluoride is deposited into bone structure. However, in younger humans and in the elderly, bone fluoride uptake is higher than in mid-age persons. Fluoride levels in plasma and in bone have been shown to be directly correlated to the level of exposure. (Morris, Smith 1982; WHO 1984; NTP 1990; Maurer et al. 1990; Maurer et al. 1993). Elimination The major route for excretion of fluoride is via the urine. In animals and humans excretion into urine occurs through the glomerular filtration after which reabsorption in the form of HF may occur in the renal tubules, especially after decreased urinary acidity. Minor routes of excretion are via faeces, saliva (partial re-absorption after ingestion) and perspiration. Excretion via the milk is no relevant route of elimination (Thiessen 1988). In humans plasma half-lives of 2 to 9 hr have been reported (WHO 1984). Because soft tissue fluoride levels are in equilibrium with plasma levels for these tissues similar half-lives may be assumed. After cessation of exposure, fluoride in bone will be released and eliminated from the body. In humans the half-live for bone fluoride is reported to be in the range of 8 to 20 years. (WHO 1984). Conclusion Inhaled gaseous hydrogen fluoride is virtually completely absorbed in the upper airways. The extent of absorption via the dermal route cannot be specified. Fluoride from any inorganic source is absorbed as HF and circulates in the body as F- or as organically bound fluoride. The distribution of this ion and its route of excretion do not depend on the way via which it enters the body. After oral, inhalatory or dermal exposure to HF, fluoride can be found in all tissues in the

CHAPTER 4. HUMAN HEALTH
59
body. Sequestration takes place in bone tissue in which about half of the absorbed fluoride is deposited. Secretion is mainly via the urine. In humans half-lives are in the range of 2 to 9 hr for plasma and in the range of 8 to 20 years for fluoride in bone deposits. Remark Although the form of fluoride to which one is exposed may influence the amount of fluoride which finally reaches the systemic circulation, the form of fluoride which circulates within the body is not dependent on the fluoride species one has contacted (e.g. Van Asten et al. 1996). Thus when data gaps for systemic effects are established for HF, these data gaps may be filled, using experimental results of other inorganic fluorides, even if these were administered via a route other than inhalation. Toxicity data on other inorganic fluorides will only be used for the hazard assessment of HF, when base set required data for HF are not available. 4.1.2.2 Acute toxicity Animal studies Several studies have been carried out with different species and with inhalatory and dermal exposure. The most relevant studies with inhalatory exposure to HF are summarised in Table 4.6. Table 4.6 Acute inhalatory toxicity of Hydrgen Fluoride
Species Protocol1 Results
mouse other 1 hr LC50: 279 mg HF/m3 (Wohlslagel et al. 1976)
rat other; GLP 1 hr LC50: 1828-1909 mg HF/m3 (Valentine 1990)
rat rat
other other
1 hr LC50: 1069 mg HF/m3 (Rosenholtz et al. 1963) 1 hr LC50: 792 mg HF/m3 (Vernot et al. 1977; MacEwan and Vernot 1976)
rat other 1 hr LC50: 1138 mg HF/m3 (Wohlslagel et al. 1976)
guinea pig other 15 min LC50: 3540 mg HF/m3 (Rosenholtz et al. 1963)
rhesus monkey
other 60 min LC50: 1470 mg/m3 (Darmer KI et al. 1972)
1For details see HEDSET LC50 values for inhalatory exposure to HF are about 279 mg/m3 (Wohlslagel et al. 1976) in mice and about 817 to 1900 mg/m3 in rats after exposure for 1 hr (Valentine 1990; Rosenholtz et al. 1963; Wohlslagel et al. 1976; Vernot et al. 1977; MacEwan and Vernot 1976). In the mouse study signs of toxicity were eye and mucous membrane irritation, corneal opacity, skin erythema and respiratory distress, pulmonary edema and haemorrhage were observed at necropsy. In rats severe damage to the upper respiratory tract, respiratory distress, ocular and nasal discharge, corneal opacity and weight loss were observed. Dermal corrosion (necrotic lesions of nose face and ears) were commonly seen. Upon pathological examination, pulmonary congestion, intra-alveolar edema and thymic haemorrhage were seen as well. Irritation to the eyes and nose, body weight loss and respiratory distress were toxic effects observed in guinea pigs, histopathology was not performed (Rosenholtz et al. 1963). In rhesus monkeys an LC50 of 1470 mg/m3 was determined after 60 minutes of exposure, further details were not reported (Darmer et al. 1972).
EU RISK ASSESSMENT – HYDROGEN FLUORIDE FINAL REPORT, OCTOBER 2001
60
In rats, besides damage at the site of application, dermal application resulted in decreases in spontaneous ventilation and movement, tremor, loss of co-ordination, loss of righting reflex and death. Blood analysis showed a marked decrease in serum Ca levels and an increase in parathyroid hormone, as a result of dermal uptake of F-. Simultaneously hyponatremia, hyperkalemia, an increase in serum phosphorus, a decrease in serum alkaline phosphatase accompanied by bradycardia were found. The authors stated that a dermal HF burn of only 1.7% of the total skin surface may result in fluoride poisoning and disturbances of calcium and other electrolyte homeostasis. Dermal application of 0.5 ml of a 50% HF solution for 5 min to rats (approx. 900 mg HF/kg b.w.) resulted in 80% mortality (Kono et al. 1982; Kono et al. 1988). Human data Fatalities with HF have occurred after accidental contact. Next to dermal contact in these cases inhalation of HF fumes will have occurred. In these studies severe dermal lesions and damage to the respiratory tract and lungs were reported (Kleinfeld 1965; Irving Sax 1984). It was noted that blood fluoride levels were comparable to those observed after fatal ingestion of fluorides (Greendyke, Hodge 1964). In two human volunteers, exposure to HF for periods of several minutes or shorter caused mild smarting in the nose and eyes and respiratory tract irritation at concentrations of 26 mg/m3. At 50 mg/m3 marked conjunctival and nasal mucosae irritation occurred, while at 100 mg/m3 also pain in the exposed skin was experienced with marked conjunctival and respiratory irritation. Indications of severe damage to the respiratory system were also reported in other studies (Machle et al. 1934). Conclusion The inhalatory 1 hr LC50 of HF amounts to about 280 mg/m3 in mice and to 817 to 1900 mg/m3 in rats. Oral and dermal LD50s cannot be derived. Inhalatory and dermal exposure to HF may result in severe damage to eyes and airway epithelia and to damage to the skin. Systemic F- results in disturbances in Ca and other electrolyte homeostasis and in cardiac arrhythmias. In humans, dermal contact with HF either liquid or gaseous produces severe dermal lesions. Dermal contact with HF may result in systemic (cardiac) effects eventually resulting in death. Inhalatory exposure may damage the respiratory tract. According to the EU guidelines HF is classified as Very Toxic (T+); R-phrases 26/27/28: very toxic by inhalation, in contact with skin and if swallowed. Although studies were not performed according to OECD or EU guidelines, the rapporteur considers the studies submitted to have sufficient quality to allow for a proper evaluation of acute toxicity.

CHAPTER 4. HUMAN HEALTH
61
4.1.2.3 Irritation Animal studies Dermal Severe damage to the skin (erythema, edema, blistering and coagulative necrosis down to the dermal muscular junction) was found in rats after application of 50 �l of a 70% solution of HF to the shaved skin for 60 s. The wound healed over the next 35 to 56 days (Bracken et al. 1985). In rabbits, application of 2 ml/kg b.w. of a 2% solution of HF in water (approx. 40 mg HF/kg b.w.) to the shaved back skin for 1 or 4 hours under occlusive conditions results in severe dermal changes. No damage to the skin was seen at 2% applied for 1 min. Exposure to 2 ml/kg of solutions of 0.01, 0.1, 0.5 or 2% HF under similar conditions for 5 to 60 min all caused dermal lesions, which are considered to be related to contact with HF. However, at the lower end of the exposure range the dose-response relationship was rather weak. Additionally, at the highest dose level (for 1 or 4 hours) organ weights were determined and histological examination was carried out. The only effect observed was a reduced testes weight (40%) as compared to controls after 4 hours of exposure (observation time: 96 h after exposure). This reduction of testes weight was not associated with significant microscopic alterations (Derenlanko et al. 1985). Skin irritation and corrosivity of HF has been studied in a test performed according to OECD Guideline 404. Application of 5 ml of a 5% solution to the rabbit's skin under a semi-occlusive patch for 4 h followed by a washing produced marked eschar formation and destruction of the underlying tissue, 24 hr after the exposure period. The lesions did not recover within the next 14 days. The lesions resulted in a Draize score of 4 in 2/3 animals (Bayer AG 1990). No corrosivity or irritation of HF was observed when it was applied to the rabbit's skin in concentrations of 0.13 or 1.06% in a quantity of 0.5 ml for 4 h under semi-occlusive conditions (Thyssen and Lorke 1980). Ocular Eye irritation has been investigated in two studies in which HF solutions of 0.13 or 1.06% (Thyssen and Lorke 1980) or HF solutions from 0.5 up to 20% (McCulley et al. 1983) were administered in the rabbit's eye. A dose of 100 �l of an aqueous solution of 1.06%, but not 0.13% HF, caused corneal opacity, iritis, conjunctival oedema and redness (Thyssen and Lorke 1980). A solution of 20% (quantity unknown) causes immediate and extensive ocular damage (McCulley et al. 1983). Inhalatory In an Alarie test according to ASTM E981 (Schorsch 1995) six groups of 4 mice were exposed (nose and mouth, only) for 30 minutes to HF in concentrations of 30, 80, 170, 180, 190 and 250 mg/m3 in air. From the time courses of the respiration rate an RD50 (for respiratory depression) of 110 mg/m3 was computed. Despite several inconsistencies in the report, it was stated that the test was performed according to GLP. In another Alarie-test (ICI 1990), an RD50 (for respiratory depression) of 151 ppm (123 mg/m3) was computed after inhalatory exposure of mice to gaseous HF in concentrations of 78 to 172 ppm. However, a full report of this test does not exist.

EU RISK ASSESSMENT – HYDROGEN FLUORIDE FINAL REPORT, OCTOBER 2001
62
Human data In patients exposed to HF, causing second and third degree skin burns in approx. 2.5% of the body surface, plasma fluoride levels less than 300 �g/100 ml were seen. Changes in electrocardiograms were reported, which were reversible within three days after exposure (Burke et al. 1973). In patients who came into contact with HF via the skin, skin burns may develop several days after the exposure, although severe pain is experienced shortly after exposure, already. These burns show a whitish discolouration after an erythematous stage, followed by rapid tissue destruction and necrosis. HF-wounds tend to heal very slowly (Moeschlin 1980; Irving Sax 1984). Van de Laar et al. (1994) reported 19 cases of people involved in various activities such as cleaning of walls and tiles, metal surfaces and cars, usually in some occupational setting. The cleaning agents contained 35 to 350 g HF/l. In most cases, dermal contact was on hands or fingers. Symptoms similar to the ones described above were reported. In two of the agents with low HF content (35 and 48 g/l) also other acids (phosphorus or nitric acid) were present, while in a third low HF formulation 50 g/l was present. However, the symptoms associated with HF-contact were seen in all cases (Van de Laar et al. 1994). Lund et al. (1997) exposed human volunteers for 1 hour to constant concentrations of HF, ranging from 0.2 - 0.6 mg/m3 (n = 9), 0.7 - 2.4 mg/m3 (n = 7) and 2.5 - 5.2 mg HF/m3 (n = 7). The following parameters were monitored by means of a questionnaire: eyes and upper airways (itching and soreness) and upper airways (chest tightness, soreness, expectoration, coughing and wheezing). Lung function was determined by measuring forced vital capacity (FVC), forced respiratory volume in 1 second (FEV1) with a spirometer according to a European standardized method. HF concentration of �2.5 mg/m3 resulted in increased symptoms scores of the upper airways (nose and throat). Significant increases in lower airways scores (chest tightness, soreness, coughing, expectoration and wheezing) were not observed. Lung function parameters (FVC and FEV1) were not dose relatedly affected by exposure to HF (Lund et al. 1997). Almost all symptoms had disappeared four hours after the end of exposure. Conclusion When applied to the skin or the eye, HF produces severe lesions, even at low concentrations. According to EU guidelines HF is classified as corrosive (C); R-phrase: R35: causes severe burns. One dermal irritation study was performed according to OECD guidelines and no test according to OECD- or EU- guidelines for eye irritation has been submitted. However, the rapporteur considers the submitted data set to have sufficient quality to allow a proper evaluation of irritation and/or corrosivity of HF to skin or eyes. In mice, exposure to HF in a concentration of 110-123 mg/m3 results in a respiratory depression of 50%. This range of exposure values was derived from two tests according to Alarie. Like in animals, in humans dermal contact with HF causes second and third degree skin burns. Severe pain is experienced shortly after exposure, already and these burns tend to heal very slowly. After dermal exposure to HF, changes in electrocardiograms were reported, which were reversible within three days after exposure. Largent et al. (see 4.1.2.6: human data) found some irritation of eyes, skin and nasal mucosa at average HF concentration as low as 1.16 mg/m3. In a study with human volunteers by Lund et al. (1997) increased upper airway symptoms (itching, soreness) were observed after one hour of exposure at 2.5 mg/m3 and above.
CHAPTER 4. HUMAN HEALTH
63
Remark It should be noted that in the studies mentioned under 4.1.2.2 "acute toxicity" severe damage to the skin was found when HF was applied dermally, too. Similarly, after inhalatory exposure extensive damage was found in the respiratory tract, especially in the nasal mucosa. In these studies, eye damage was found, similar to that observed after direct application of HF solutions to the eye. In humans an amount of about 5 g anhydrous HF, causing second and third degree skin burns in approx. 2.5% of the body surface, will result in plasma fluoride levels less than 300 �g/100 ml but even these were though to be high enough to result in a life-threatening systemic intoxication (Burke et al. 1973). Comparison of the ocular effects of HF with those observed after application of equivalent solutions of sodium fluoride, potassium fluoride or hydrogen chloride (pH equal to 8% HF) suggests that the severity of eye burns caused by HF depends on both pH and the toxicity of the F--ion. Initial damage to the eye as a result of the acidity of HF facilitates the penetration F- to the deeper tissue layers (McCulley et al. 1983) in which F- produces severe lesions. The same may be true for skin damage (Derenlanko et al. 1985). 4.1.2.4 Corrosivity Corrosivity of HF has been discussed under 4.1.2.3: Irritation. Conclusion It is concluded that HF is corrosive to skin and eyes. For classification see under 4.1.2.3: Irritation. 4.1.2.5 Sensitisation Sensitisation studies with HF either with animals or with humans are not available. Conclusion A sensitisation test was not submitted, although such a test is a base-set requirement. It was argued that an assessment of skin sensitisation potential could only be done at relatively low concentrations, at which practical experience with humans has shown no indication of sensitising potential. Although such experience is in general unsuitable to demonstrate the absence of a sensitising potential and data were not available to the rapporteurs, either, its is agreed that no sensitisation test need to be performed. Physico-chemical properties of HF or F- indicate that it is reasonable to assume that this substance is not sensitising. Furthermore, both Dutch legislation and international guidelines recommend not to perform experiments which would provoke extreme distress and pain by corroding effects of the test substance and which would most probably result in the intercurrent death or killing of the animals for reasons of humanity. Additionally it is generally accepted that gross lesions, as are indicated by the corrosive properties of a compound, alter the physiological state of the test animal and thus affects any other biological activity.

EU RISK ASSESSMENT – HYDROGEN FLUORIDE FINAL REPORT, OCTOBER 2001
64
4.1.2.6 Repeated dose toxicity Only inhalatory studies are available. Animal data The results of the most reliable studies are summarised in Table 4.7. Table 4.7 Repeated dose toxicity
Repeated dose toxicity
Species Protocol Results
Inhalatory Rat other: concentrations of 0 and 1 mg HF/m3; 6 hr/d; daily for 1 month
at 1 mg/m3 changes in dental enamel, airways; formation of irregular shaped bone cavities (Sadilova et al. 1974)
Rat like OECD 413; GLP; concentrations of 0, 0.082, 0.816 and 8.16 mg HF/m3; 6 hr/d; 5 d/wk; 91 days
nominal NOAEL 0.816 mg/m3 (actual value 0.72 mg/m3) clinical (incl. dental malocclusions) and haematological signs including death and body and organ weight changes at 8.16 mg/m3. (Placke and Griffin 1991)
Daily exposure of rats for 5 hr/d for 3 months to 1.6 �g HF/m3 resulted in histological and/or histochemical changes in liver, lungs, heart or stomach. However, these changes were not properly reported and therefore impossible to interpret, especially with respect to quantitative aspects. Therefore, this study is not taken into account for the overall effect assessment of HF (Humiczewska et al. 1989). Exposure of female rats of various age to 1 mg HF/m3 for 1 months, 6 hr/d resulted in damage to the dental enamel. This effect was especially seen in young animals and in animals of 17.6 to 18.6 months of age. The respiratory organs of the young animals showed atrophy and local oedema of the bronchial mucosa, whereas airways in the older animals showed peribronchial hyperplasia. In animals of about 12 months formation of irregular shaped cavities in their bones was observed (Sadilova et al. 1974). Other tissues were not evaluated. Study (Placke et al. 1990) is a range-finding test for study (Placke and Griffin 1991). This study was performed according to GLP standards. Inhalatory exposure of rats (both sexes) to 0, 0.816, 8.16, 20.4, 53.0 and 82 mg HF/m3 (nominal values; actual values were 0, 0.816, 7.06, 17.78, 53.04 and 93 mg/m3, respectively) for 6 hr/d and 5 d/wk for 14 days resulted in death of all female animals at 20.4 mg/m3 and above and of all male animals exposed to 53.0 mg/m3 and higher (Placke et al. 1990). At the lower levels of exposure no death occurred. At 0.816, and higher body weight changes and/or changes in absolute or relative organ weights (liver, heart, kidney, lungs) were reported as well as clinical signs of discomfort and nasal and ocular mucosal irritation. Dermal crust formation, ocular opacity and tremors were also observed. In a 91 days subchronic study (Placke and Griffin 1991), also performed according to GLP with similarity to OECD 413 guideline, female and male rats (20/group) were exposed to 0, 0.082, 0.816 and 8.16 mg HF/m3 (nominal concentrations; actual concentrations were: 0, 0.098, 0.72 and 7.52 mg/m3, respectively) for 6 hours/d, 5 days/week. Observations included clinical signs, body weight, organ weights of liver, kidneys, testes, ovaries, adrenals, heart, spleen, brain and lungs, haematology, blood biochemistry and complete
CHAPTER 4. HUMAN HEALTH
65
histopathology. In contrast to the range-finding study, death (five males, one female) was observed in the 8.16 mg/m3 group. Clinical signs in this group were red-coloured discharge from eyes and nose, ruffled fur, alopecia and hunched posture. Body weights were depressed and in 9 males and 2 females dental malocclusions were observed. Increases in number of segmented neutrophils was seen in the high dose male group. Platelets were increased in the high dose males. Mid and high dose group males showed decreased numbers of lymphocytes and RBC were depressed in high dose males and females. Biochemistry showed decreased serum glucose in the high dose males. Additionally, decreases were seen in serum albumin (high dose males and females), A/G -ratio (mid and high dose males), and increases were seen in K+ and P in both males and females of the high dose groups. Relative organs weights of kidneys, liver, lung, testes, spleen, brain, heart and adrenals were increased at the highest dose. Histopathological changes were not found. The decreases in serum A/G-ratio and lymphocytes in the male mid-dose group are too small to have a biological significance and are therefore not considered as adverse effects. Thus the NOAEL in this study is 0.72 mg/m3 (actual value). Human data Volunteer studies Largent et al. (1960) exposed 5 human volunteer to gaseous HF for 6 hr/d in concentrations ranging from 0.9 to 2 ppm (0.74 to 1.64 mg/m3) for 15 days to 2.7 to 8.1 ppm (2.21 to 6.64 mg/m3) for 50 days. Each individual was exposed to HF according to his or her own personal exposure schedule (time as well as concentrations). Systemic effects of any kind were not observed, but some discomfort in the form of a slight stinging sensation in eyes and facial skin and in slight irritation of the nasal mucosa were reported. No other effect was noted when the concentration of HF did not exceed 2 ppm (1.64 mg/m3). At concentrations of 3.39 ppm (average concentration for ten days; 2.78 mg/m3) and above, erythema and desquamation of the superficial epithelium of the facial skin were observed. Symptoms of discomfort disappeared after cessation of the exposure; while skin redness persisted only for a short time (Largent et al. 1960). The results of this study have also been discussed in another journal (Largent et al. 1961), in which it was stated that an average concentration of 1.42 ppm was tolerated without noticeable effects. Because these two reports (Largent et al. 1960) and (Largent et al. 1961) are somewhat contradictory it is assumed, for safety sake, that at the lowest exposure level (0.74 to 1.64 mg/m3; on average 1.16 mg/m3 = 1.42 ppm) still some effects were observed. Epidemiological data Bearing in mind the equivalence of HF and other inorganic fluorides with respect to systemic toxicity, as discussed in the section on kinetics (see 4.1.2.1) in the following paragraphs the relevant studies on HF and an overview of the epidemiology on NaF are presented. Exposure to HF At an average occupational exposure to 1.03 ppm HF (0.82 mg/m3) no alterations in pulmonary function were observed and no increase in respiratory complaints was noted among workers exposed to HF concentrations below 2.5 mg/m3. However, HF induced a minimal increase in bone density after exposure to less than 4.3 ppm (3.5 mg/m3; ACGIH 1984).

EU RISK ASSESSMENT – HYDROGEN FLUORIDE FINAL REPORT, OCTOBER 2001
66
A number of studies on the epidemiology of skeletal fluorosis, occurring either after oral or inhalatory exposure to fluoride (F- or other fluor-containing substances, among which HF), has been reviewed (CEPA 1993; ATSDR 1993). An early (pre-clinical) symptom in humans is an increase in bone mass. Sporadic pain and joint stiffness, chronic joint pain, osteosclerosis of cancellous bone, calcification of ligaments are symptoms of first and second clinical stages while in stage 3 limited movement of joints, skeletal deformities, intense calcification of ligaments, muscle wasting and neurological deficits are manifest (CEPA 1993: ATSDR 1993). A marginally elevated occurrence of fluoride-induced osteosclerosis was observed in workers exposed to 2.5 mg/m3 (duration corrected value: 600 �g/m3; equivalent to approximately 170 �g/kg b.w./d in a 70 kg adult; Hodge and Smith 1970, Hodge and Smith 1977 cited in Slooff et al. 1988). Chan-Yueng et al. (1983) studied health effects in 2066 workers in an aluminium smelter. The cohort comprised high and medium exposed potroom workers as well as low-exposed controls and a miscellaneous group. For each group exposure to particulate and gaseous fluoride and urinary fluoride excretion were determined. The number of workers in each group and the levels of exposure are presented in the table below: Table 4.8 Exposure levels to workers
Group Number exposed Average total airborne fluoride (mg/m3)
Average gaseous fluoride (mg/m3)
Average particulate fluoride (mg/m3)
controls 880 0.053 0.015 0.038
potroom/high 570 0.48 0.20 0.28
potroom/medium 332 0.12 0.057 0.062
miscellaneous 284 0.46 0.054 0.41 In addition an external control group of 372 railway repair workers was studied. Observations included musculoskeletal complaints and surgery, spine and sacroiliac joint examination, pelvic X-rays, urinary fluoride and blood haemoglobin, haematocrit, white cell count, total bilirubin, alkaline phosphatase, sASAT, total protein, BUN, creatinine, Ca2+ and phosphate. No overt signs of skeletal fluorosis were observed in workers exposed up to 0.48 mg F-/m3 (0.2 mg/m3 for gaseous F- and 0.28 mg/m3 for fluoride dust) for up to ten years (duration corrected value: 114.2 �g/m3; equivalent to 33 �g/kg b.w./d). The relevant blood biochemistry parameters did not indicate occurrence of hepatic or renal effects. Changes in haemoglobin and haematocrit and calcium, though (statistically) significant, were within the normal biological range. Serum calcium but not phosphate was increased in the highest exposure group (9.71 ± 0.44 mg% Ca2+ vs 9.62 ± 0.42 mg% in the controls). The changes in the respective blood parameters were considered of little relevance. Therefore, it is concluded that no overt signs of skeletal fluorosis or renal, hepatic or haematological effects were observed in workers exposed to 0.48 mg (total) fluoride/m3 for up to ten years. In a parallel study in the same aluminium smelter, as in the above study (Chan-Yeung et al. 1983), Chan-Yueng et al. (1983) reported on the association between working in potrooms and respiratory performance. The following respiratory parameters were studied: FEV15, FVC, 5FEV1 = forced expiratory volume in 1 second, FVC = forced vital capacity, FEF25-75% = maximum mid-expiratory flow
rate

CHAPTER 4. HUMAN HEALTH
67
FEF25-75%, chest X-ray and chest symptoms (cough, phlegm, wheeze, dyspnea, chronicbronchitis). Observations were corrected for smoking habits, age and duration of employment. Thecohorts consisted of a high exposed group (>50% of the working time in the potrooms, n = 495), amedium exposed group (<50% of the working time in the potrooms, n = 302) and a controlgroup (office and casting personnel, n = 713). The air in the smelter was analysed for thefollowing contaminants by personal sampling devices:
Table 4.9 Concentrations of air contaminants in an aluminium smelter (data taken from Chan-Yueng et al. 1983)
Air contaminant Potroom workers Control workers
Particulate matter 3.55 ± 2.26(n=22)*
1.45 ± 5.11(n=33)
Fluoride
total
gaseousparticulate
0.48 ± 0.35(n=1157)
0.20 ± 0.170.28 ± 0.03
0.05 ± 0.12(n=102)
0.02 ± 0.030.04 ± 0.1
Carbon monoxide 11.43 ± 5.49(n=47)
6.23 ± 2.95(n=45)
Sulfur dioxide 2.15 ± 1.66(n=121)
0.54 ± 0.74(n=29)
Benzo-[a]-pyrene 3.49 ± 7.11 µg/m3
(n=69)0.16 ± 0.29 µg/m3
(n=4)
*Values are mean ± standard deviation of n samples. Units are mg/m3 unless stated otherwise
High exposure workers showed a statistically significant decrease in FEV1 and FEF25-75% with 2and 5%, respectively and the incidence of cough and wheeze were statistically significantincreased in the high exposure group by each 7% as compared to control workers. No changes inFVC were observed. The medium exposure group did not statistically deviate from the controlgroup. Comparison of pre- and post shift respiratory parameters showed a similar decline in bothcontrol and high exposure workers. Most Chest X-radiographs were normal. Abnormalities (e.g.signs of previous pulmonary tuberculosis) did not show an association with any of the workergroups.
As potroom workers were exposed to several airway irritants at the same time, a definiteconclusion about the cause of the changes cannot be drawn. Possibly, the effects are caused bythe combined action of the air contaminants determined.
Exposure to NaF
Riggs et al. (1990) carried out a randomised placebo-controlled, double-blind clinical trial inpostmenopausal osteoporotic women. At an average dose level of 0.48 mg F-/kg b.w./d,administered orally as sodium fluoride for four years, an increase in the rate of non-vertebralbone fractures and a decrease in cortical bone density were observed. However, although anincrease in cancellous bone density was seen, only an insignificant trend towards a decrease inthe rate of vertebral bone fractures was found. Treated women reported significantly more sideeffects (gastric irritation, pain in lower extremities) than untreated women. Although wellperformed, this study may not be completely indicative for the risk of fluorosis resulting from

EU RISK ASSESSMENT – HYDROGEN FLUORIDE FINAL REPORT, OCTOBER 2001
68
oral administration of fluoride, because bone and calcium homeostasis, and thus sensitivity to fluoride, may differ from that in non-osteoporotic persons. CEPA (1993) cited various ecological studies in which the effects of fluoride intake via drinking water were investigated. According to this review, severe skeletal fluorosis has been reported in humans after prolonged intake of 15 mg/day (215 �g/kg b.w. day in an adult weighing 70 kg) and above. In one case, exposure to drinking water containing 8 mg/l fluoride for 37 years resulted in fluoride-induced bone changes, but not in clinical signs. In a community exposed to 4 mg fluoride/l in the drinking water (estimated to be equivalent to 72 �g/kg b.w/d) the relative risk for various bone fractures was 2.2 to 2.7 as compared to an "unexposed" control community which received 1 mg/l (Sowers et al. 1986). However, with respect to the latter study, CEPA (1993) stated that exposure in the high fluoride community was probably underestimated, while the calcium concentration in the drinking water of this community was about only 25% of that in the control group. Other aspects Numerous studies in the USA and in Europe have shown that a certain level of fluoride consumption, especially when it is continuous from earliest childhood, affords considerable protection for both permanent and milk teeth against carries, without exerting any unfavourable influence on the appearance of the teeth or on the periodontium. Fluoride is usually offered by the fluoridation of drinking water (about 1 mg F-/l) or by fluoride dentifrices (Wagner et al. 1993). Fluoride continues to deposit into the calcified structures after the other constituents of bone have already reached a steady state. Thus the major constituents - calcium, phosphorus, magnesium, carbonate, citrate - reach their maximum concentration early in life and remain essentially unchanged, even after administration of large amounts of the ion in question. Fluoride, on the other hand, showed a tenfold increase in bone following ingestion of drinking water with fluoride concentrations of <1.0 up to 4 mg/l. Calcification of bone is preceded by a nucleation process in the early deposition of calcium and phosphorus on the chief organic matrix of bone and collagen to form the mineral phase, generically called hydroxyapatite or Ca10(PO4)6(OH)2. The hydroxyl groups of apatite in calcified structures may be partially or completely substituted isomorphically by fluoride. Thus mixed crystals of hydroxyapatite and fluorapatite may be present (Wagner et al. 1993). Conclusion The available animal data set for HF permits the derivation of a NOAEL for repeated sub-chronic inhalatory exposure. No suitable studies are available for HF, for other routes of exposure. The over-all NOAEL for repeated inhalatory exposure is taken from the 91-day GLP study with female and male rats and amounts 0.72 mg HF/m3 (actual value) for a 6 h per d 5 d per week exposure regimen. At this exposure no adverse effects were observed. At the next exposure level death, tissue irritation, dental malformations, haematological and biological changes and changes in several organ weights were observed. Like in animals, in humans prolonged intake of fluoride results in skeletal fluorosis, an effect for which indications were found after both oral and inhalatory exposure. Skeletal effects have been reported in some but not all studies of workers in aluminium plants who were exposed to levels of airborne inorganic fluoride considerably higher than those in the
CHAPTER 4. HUMAN HEALTH
69
general environment. Based on consideration of the collective data available from studies involving aluminium smelter workers, Hodge and Smith (Hodge and Smith 1970) concluded that the occurrence of fluoride induced osteosclerosis was elevated if workers were exposed to levels of airborne fluoride greater than 2.5 mg/m3. In a more recent cohort study with workers in an aluminium smelter no overt signs of skeletal fluorosis or renal, hepatic or haematological effects were observed after exposure to 0.48 mg (total of which 0.20 mg gaseous and 0.28 mg particulate) fluoride/m3 for up to 10 years. In a parallel study in the same plant signs of airway irritation were observed at the same exposure level, but this effect may have been caused by other (than HF) airway irritants as well. In humans exposure to 1.16 mg HF/m3 for 6 hr/d may result in some discomfort in the form of a slight stinging sensation in eyes and facial skin and in slight irritation of the nasal mucosa. This concentration can be considered as a LOAEL for inhalatory exposure. Beneficial effects There are indications that fluoride is an essential nutrient, which in any case plays a role in the dentition and the development of the skeleton, but conclusive evidence is still lacking. The question whether fluoride is an essential element cannot be satisfactorily answered because attempts to develop a diet which is sufficiently low in fluoride are hampered by the widespread occurrence of fluorides in dietary ingredients. The essentiality of fluoride can only be determined if such a low fluoride diet is available (Slooff et al. 1988, WHO 1984; National Academy of Sciences 1971). Beneficial effects (prevention of dental carries, particularly in children) after low fluoride intake have been observed. On the other hand, excessive fluoride intake can cause dental fluorosis (dental lesions) and osteofluorosis (bone structural changes) as described above (Slooff et al. 1988). Remark It should be noted that many of the epidemiological studies (ecological or cohort studies) provide limited insight in actual exposure to fluoride via nutrition and other routes and that confounding factors (e.g. interfering exposure to other substances, extent of physical labour) are usually poorly characterised. The clinical studies focused on beneficial effects of fluoride, rather than adversity (cf. ref CEPA 1993).

EU RISK ASSESSMENT – HYDROGEN FLUORIDE FINAL REPORT, OCTOBER 2001
70
4.1.2.7 Mutagenicity With HF only a limited number of genotoxicity tests is available (see Table 4.10). Table 4.10 Genotoxicity of Hydrogen Fluoride Genetic toxicity Species/system Protocol Results
4.1.2.7 In vitro gene mutations (Ames) Salmonella typhymurium other1; GLP negative; with and without S9 (Bayer AG 1987)
In vivo
cytogenic effects rat other1 positive increase in chromosomal aberrations (predominantly hyperploidy) (Voroshilin et al. 1975)
dominant lethality mouse other1 inconclusive; improperly reported (Voroshilin et al. 1975)
SLRL test Drosophila melanogaster other1 reduced fertility in F1 after HF-exposure of F0; inconclusive (Gerdes et al. 1971; Gerdes 1970; Gerdes 1971)
RL test Drosophila melanogaster other1 reduced viability of F2 homozygous for chromosome II after HF-exposure of F0; inconclusive (Mohamed 1971)
1See HEDSET for full description of the protocol In vitro tests An Ames test with HF, performed according to GLP, provided negative results (Bayer AG 1987). In vivo tests The in vivo tests with HF are either chromosomal aberration tests (Voroshilin et al. 1975; Zeiger et al 1994) or tests which may reveal the genesis of inheritable defects. The test for chromosomal aberrations in rats (Voroshilin et al. 1975) was positive, especially in older animals. It demonstrated that HF may induce hyperploidy. However, deletions were not counted. The dominant lethal test with mice (Voroshilin et al. 1975) could not be interpreted because of poor description of methodology and results. HF was shown to induce sex-linked recessive lethality in Drosophila melanogaster, but the tests were not properly reported and their significance cannot be evaluated (Gerdes et al. 1971; Gerdes 1970; Gerdes 1971. In another test (Mohamed 1971) HF was shown to reduce the viability in F2-offspring of Drosophila melanogaster when these were homozygous for chromosome II. The results of this test cannot be interpreted in terms of genotoxicity. The data set on genotoxicity of HF is limited. Therefore it is difficult to reach a conclusion on the genotoxicity of this substance. However, because in toxicity tests, whether in vivo or in vitro, HF will reach its possible targets only as (partly organically bound) F-, studies with other inorganic fluoride, such as NaF, will provide insight in fluoride genotoxicity also applicable for HF. This has been treated in the section on the kinetics of fluoride (see 4.1.2.1). Some representative mutagenicity assays with NaF have been summarised in Table 4.11.

CHAPTER 4. HUMAN HEALTH
71
In vitro tests An Ames test with sodium fluoride did not reveal a potential of the fluoride ion to induce gene mutations (NTP 1990). In in vitro tests with eukaryotic cell systems, sodium fluoride has shown a potency to induce gene mutations (NTP 1990) and chromosomal aberrations (NTP 1990; Tsutsui et al. 1984; Aardema et al. 1989; Aardema et al. 1989; Khalil 1995) as well as sister chromatid exchanges (NTP 1990) and DNA-repair (Tsutsui et al. 1984; Tsutsui et al. 1984). The substance was negative in a test for chromosome aberrations in human fibroblasts (Tsutsui et al. 1995). In four studies (Tsutsui et al. 1984; Aardema et al. 1989; Aardema et al. 1989; Khalil 1995) information was provided as to the nature of the aberrations. Especially gaps, breaks and deletions were observed. Table 4.11 Genotoxicity of Sodium Fluoride
Genetic toxicity Species/system Protocol1 Results
In vitro
gene mutations (Ames) Salmonella typhymurium other negative; with and without S9 (NTP 1990)
gene mutations Mouse lymphoma assay other positive; with and without S9 (NTP 1990)
SCE-test CHO-cells other positive; with and without S9 (NTP 1990)
UDS-test human oral keratinocytes other positive; without activation (Tsutsui et al. 1984)
UDS-test human fibroblasts other positive; without activation (Tsutsui et al. 1984)
chromosomal aberrations human fibroblasts other positive; without activation (Tsutsui et al. 1984)
chromosomal aberrations CHO-cells other positive; with and without S9 (NTP 1990)
chromosomal aberrations CHO-cells other positive; with and without S9 (Aardema et al. 1989)
chromosome aberrations bone marrow cells other positive; without activation (Khalil 1995)
chromosome aberrations human fibroblasts other negative; without activation (Tsutsui et al. 1995)
In vivo
cytogenic effects mouse other negative for micronuclei in erythrocytes and for chromosome aberrations in bone marrow (Zeiger et al 1994)
1For "other" see details in HEDSET In vivo tests Zeiger et al. (1994) have exposed mice to NaF in their drinking water for 1 or 6 weeks, in a well-performed test for chromosomal aberrations. At 200 and 400 mg/l reduced body weight gain was observed, while in the 400 mg/l group several animals died, as well. Erythrocytes and other bone marrow cells were analysed for micronuclei or chromosomal aberrations. No indications for cytogenetic action of fluoride were obtained. Jackson et al. (1994) found no increase in number of SCEs in a case-control study with osteoporotic women receiving as therapy 23 mg elemental F/d on average for approximately 18 months.

EU RISK ASSESSMENT – HYDROGEN FLUORIDE FINAL REPORT, OCTOBER 2001
72
Additionally, the results of various other mutagenicity tests with fluoride have been reviewed (Li et al. 1988). These authors discussed the outcome of positive and negative in vitro and in vivo tests and reached the conclusion that no firm statement could be made as to the genotoxicity of fluoride. More recently, Zeiger et al. (1993) re-evaluated old and new literature data and concluded that the information as to fluoride's genotoxicity in vivo is still too incomplete to reach a final decision. It was further mentioned that in a number of in vivo tests, in which anaphase cells were studied positive results for cytogenic effects were obtained, while in tests studying metaphase cells no positive results were found. To their opinion (Zeiger et al. 1993), especially information is needed about the underlying mechanisms of action and the way F- might have interacted in the in vitro studies with DNA and/or with DNA related proteins, enzymes or other cellular systems (Zeiger et al. 1993). It has been argued that genotoxicity in in vitro test systems occurs at levels above 4.5 mg F-/l medium, a level which is higher than the steady state concentration found in human plasma and that F- has no capacity to interact with DNA via a direct mechanism (Janssen and Knaap 1994). Conclusion The test results show that HF and NaF are both negative in a bacterial test system. In eukaryotic systems in vitro NaF induces SCE, UDS and chromosomal aberrations at levels of 4.5 mg F-/l and above. Four in vivo tests with HF are available in which genotoxicity was studied. However, these four tests are inconclusive as a result of poor reporting or invalidated tests system. For reasons of similarity of toxicokinetics, there is no need to perform additional in vivo mutagenicity tests with HF because a well-performed in vivo assay with NaF is available. This test showed that fluoride did not cause chromosomal damage in mice. However, positive in vivo results were scored in anaphase cells, indicating a possible indirect effect. Since it is unlikely that F- binds to DNA covalently, a prerequisite for DNA-adducts, the DNA damage observed in in vitro studies is probably not caused by a direct interaction of fluoride with DNA. It is concluded that inorganic fluoride does not induce chromosomal damage in vivo. Remark Although the CEPA (1993) recognised that the data on genotoxicity of fluoride are conflicting, it has been stated that fluoride is apparently not genotoxic when administered via an appropriate physiological route (i.e. orally). For inhalatory exposure no data are available but given the fact that fluoride does not interact with DNA in a direct way, it can be concluded that the substance is not genotoxic after inhalatory exposure either. 4.1.2.8 Carcinogenicity Carcinogenicity studies with HF are not available
6. Because in carcinogenicity studies HF will
reach its possible targets only as (partly organically bound) F-, studies with other inorganic fluoride, such as NaF, will provide insight in the possible (systemic) carcinogenicity of fluoride in general and thus in the carcinogenicity of HF. This has been treated in the section on the kinetics of fluoride (see 4.1.2.1). Four carcinogenicity studies performed with NaF are available. 6 IARC (1992) has evaluated the carcinogenicity of mists of strong inorganic acids. From several occupational studies it was concluded that sufficient evidence was available to consider strong-acidic mists containing sulfuric acid to be a human carcinogen. HF was not included in this evaluation. It should be noted that HF is not a strong acid (pKa = 3.5; the pKa values of sulfuric and hydrochloric acid are � 0) and that IARC concluded that for carcinogenicity HCl was not classifiable because of insufficient evidence in both animals and humans. Thus from this IARC evaluation no conclusion can be drawn as to the carcinogenicity of HF.

CHAPTER 4. HUMAN HEALTH
73
Animal data Mice Mice were exposed to NaF in their drinking water daily for two years in concentrations of 0, 25, 100 or 175 mg/l (NTP 1990). These concentrations were equal to average dose levels of 0, 1.27 , 5.11 and 8.50 mg F-/kg b.w./d for the females and to 0, 1.08, 4.34 and 7.55 mg F-/kg b.w./d for the males. The diet contained 8.66 mg F-/kg (equivalent to 1.23 mg/kg b.w./d). Observations included clinical status, body and organ weights (liver, kidneys and brain at interim sacrifices), urinalysis, haematology, clinical chemistry (limited), and complete histopathology. Teeth showed dose-related discolouration and mottling in all groups including the controls, but at higher incidences and earlier in time in the exposed groups. Dental attrition was enhanced in the 175 mg/l dose groups; in the males slightly more pronounced than in the females. Dentine dysplasia was significantly increased in the 175 mg/l males group. Other non-neoplastic lesions were not found. Some neoplastic lesions (lymphomas, hepatocellular neoplasms, harderian gland adenomas, pituitary adenomas) were seen, but these lesions were either not treatment-related or of no biological significance (NTP 1990). In a combined toxicity/carcinogenicity diet study, Maurer et al. (1993) exposed mice for two years to nominally 0, 4.0, 10, and 25 mg NaF/kg b.w./d (equal to 0, 1.79, 4.43 and 11.17 mg F- /kg b.w./d, respectively). Through the (low-fluoride) diet the animals received 0.45 mg F-/kg b.w./d. Observations included clinical status, body and organ weights (extensive) and histopathology (extensive). Dose related changes in teeth were found at 4 mg/kg b.w. and above comprising a.o. fractures, attrition and discolouration, which were accompanied by ameloblast dysplasia, cystic hyperplasia, degeneration and vacuolation. Various skeleton malformations (enostosis, osteosclerosis, hyperostosis) were observed at 10 mg/kg b.w./d and above. Ossification or mineralisation of stifle joints, occasionally together with arthritis were seen in males and females at 10 and 25 mg/kg b.w./d. Soft tissue lesions, though looked for were not reported. The dental and bone lesions were considered to be related to exposure to fluoride. Other changes in relative organ weights or tissues (including testes) were not found, but quantitative data were not provided. Especially in the high dose group an enhanced number of benign osteomas were observed in which a high density of retroviral particles were seen. The authors concluded that with respect to the occurrence of the osteomas the study is inconclusive because the presence of the retroviral infection might have enhanced the genesis of these tumours (Maurer et al. 1993). Rats Rats were exposed to NaF in their drinking water daily for two years in concentrations of 0, 25, 100 or 175 mg/l (NTP 1990). These concentrations were equal to average dose levels of 0, 0.59, 2.48, 4.29 mg F-/kg b.w./d for the females and to 0, 0.50, 2.35 and 3.89 mg F-/kg b.w./d for the males. The diet contained 8.66 mg F-/kg (equivalent to 0.43 mg/kg b.w./d). Observations included clinical status, body and organ weights (liver, kidneys and brain at interim sacrifices), urinanalysis, haematology, clinical chemistry (limited), and complete histopathology. Teeth showed whitish discolouration and mottling with increasing incidences from 25 mg/l. At 100 mg/l and higher these colour changes were accompanied by dental attrition, deformities and malocclusion. In males at 25 mg/l and higher and in females at 100 mg/l and above increases in dentine dysplasia and ameloblast and odontoblast degeneration were found. The effects were more pronounced in male animals. In the females of the 175 mg/l group an increased incidence in osteosclerosis was observed. In male animals osteosarcomas were observed with incidences of 0/80, 0/51 1/50 and 3/80 in the 0, 25, 100 and 175 mg/l groups, respectively. Osteosarcomas

EU RISK ASSESSMENT – HYDROGEN FLUORIDE FINAL REPORT, OCTOBER 2001
74
were not reported for the females. The authors considered the results equivocal with respect to the carcinogenic potential of NaF. No other indications for the formation of neoplastic lesions were obtained; neither were other treatment-related lesions found (NTP 1990). In a combined toxicity/carcinogenicity study, Maurer et al. (1990) exposed rats for two years to 0, 4.0, 10, and 25 mg NaF/kg b.w./d (equal to 0, 1.81, 4.52 and 11.24 mg F- /kg b.w./d, respectively). Through the (low-fluoride) diet the animals received 0.16 mg F-/kg b.w./d. Observations included clinical status, body and organ weights (extensive) and histopathology (extensive), clinical chemistry (not specified), and urinalysis (not specified). Dental aberrations (ameloblast dysplasia and enamel hypoplasia) were dose-relatedly increased in all groups. Dental fractures and malocclusions were enhanced at 10 and 25 mg/kg b.w./d. The females were no less sensitive than the males. Subperiosteal hyperostosis was observed in particular in the bones of the skulls of males at 10 mg/kg b.w./d and above. In the females this effect was less pronounced. Relative and absolute stomach weight were significantly increased at 10 mg/kg b.w./d and above. Mononuclear cell infiltration of the glandular epithelium was dose-relatedly increased from 4 mg/kg b.w./d in the male and from 10 mg/kg in the females. Chronic inflammation and regeneration of the glandular mucosa occurred in the males at 10 mg/kg and above. In the females these effects were seen at 4 mg/kg and above and at 25 mg/kg b.w. respectively. In 24 other tissues (including testes) no lesions were reported, but quantitative data were not provided. In some animals neoplastic bone lesions were seen (sarcoma, osteosarcoma,chordoma, chondroma) but these lesions were incidental and randomly distributed among the groups. In the stomach of one control male a papilloma was found. Other soft tissue neoplasms were not reported in detail but it was stated that "there was no evidence that fluoride altered the incidence of preneoplastic and neoplastic lesions at sites of fluoride toxicity or at any other site in rats of either sex" (Maurer et al. 1990). Human data Based on epidemiological data IARC (1982) concluded that the evidence for carcinogenicity of orally taken fluoride in humans is inadequate. Several organisations have reviewed ecological studies into a relationship between oral exposure to fluoride (via fluoridated drinking water) and cancer mortality in humans. No reliable evidence of an association between consumption of fluoridated drinking water and increased incidence of mortality due to cancer could be established (CEPA 1993; Janssen and Knaap 1994). US-EPA, reviewing the epidemiological data for fluoride, stated that no conclusion can be drawn as to the carcinogenicity of fluoride after inhalatory exposure, because in all studies available, humans were exposed to other substances as well (Thiessen 1988). Conclusion Carcinogenicity studies, in which HF has been tested, are not available
7. Studies with NaF may
provide insight in the carcinogenicity of HF, especially for systemic tumours. With the latter substance 4 animal studies have been performed, 2 in which NaF was supplied in the drinking water to rats and mice, and two in which NaF was administered via the diet, again to rats and mice. In the rat drinking water study, equivocal indications for osteosarcomas in males were obtained, but the rat diet study was negative, despite clear indications of fluoride intoxication. The mouse 7 IARC (1992) has evaluated the carcinogenicity of mists of strong inorganic acids. From this IARC evaluation no conclusion can be drawn with respect to the inhalatory carcinogenicity of HF.

CHAPTER 4. HUMAN HEALTH
75
drinking water study was also negative. The mouse diet study was confounded by the presence of a retrovirus which may have (co)-induced the growth of benign osteomas thus thwarting the interpretation of the study. In the diet studies (Maurer et al. 1990; Maurer et al. 1993) bone fluoride levels were higher than in the drinking water studies (NTP 1990), while in the diet studies no indications for osteosarcomas were obtained. Furthermore, the osteomas were considered to be reminiscent of hyperplasias rather than true bone neoplasms. It was concluded that the available data is sufficient to suggest that fluoride is not a carcinogenic substance in animals (Janssen and Knaap 1994). Based on epidemiological data IARC (1982) concluded that the evidence for carcinogenicity of orally taken fluoride in humans is inadequate. Recent studies (cited in CEPA 1993; Janssen and Knaap 1994) did not supply evidence of a relationship between fluoride in drinking water and cancer mortality, either. US-EPA, reviewing the epidemiological data for fluoride, stated that no conclusion can be drawn as to the carcinogenicity of fluoride after inhalatory exposure, because in all studies available, humans were exposed to other substances as well (Thiessen 1988). Remark It is especially noted that in none of the animal carcinogenicity studies effects on morphology of any of the reproductive organs were found. 4.1.2.9 Toxicity for reproduction No reproduction studies are available for HF. However, effects on reproduction are systemic and HF occurs in the systemic circulation only as free ionic or as organically bound fluoride rather than as HF or NaF. This has been treated in the section on the kinetics of fluoride (see 4.1.2.1). Data on NaF that provide insight in the reproductive toxicity of fluoride may, therefore, also provide insight in the reproductive toxicity of HF. Animal data Studies with respect to reproduction and development/teratogenicity with NaF are summarised in Table 4.12.

EU RISK ASSESSMENT – HYDROGEN FLUORIDE FINAL REPORT, OCTOBER 2001
76
Table 4.12 Reproductive and developmental toxicity
Reproduction & developmental toxicity
Species Protocol Results
4.1.2.9 A: fertility studies
oral mouse Other; dose levels 0, 10, 20 mg NaF/kg b.w. for 30days
LOAEL; 10 mg NaF/kg b.w. (~4.52 mg F-/kg b.w.); Reversible decreased sperm motility and sperm count and infertility. Abnormal sperm morphology. (Chinoy and Sequeira 1992)
LOAEL; 10 mg NaF/kg b.w. (~4.52 mg F-/kg b.w.); Reversible histological changes in testis, epididymis and vas deferens. (Chinoy and Sequeira 1989)
rat Other; dose levels 0, 100, 200 mg F-/kg diet for 60 days
LOAEL: 100 mg F-/kg; (~5 mg F-/kg b.w./d) dental fluorotic lesions, changes in seminiferous tubules. decreased serum testosterone levels n.s, trend in decreased average litter size, (Araibi et al 1989)
rat Other; dose levels: 0, 5 and 10 mg NaF/kg b.w. /d for 30 days.
LOAEL : 5 mg/kg b.w./d (~2.26 mg F-/kg b.w.) reduction of fertility, decreased sperm counts and motility, biochemical changes in testes, epididymis and prostate. (Chinoy et al. 1991)
rabbit Other; dose level 0, 20 and 40 mg NaF/kg b.w./d for 30 days
LOAEL: 20 mg NaF/kg b.w./d (9 mg F-/kg b.w.); count, biochemical, morphological, numerical and motility changes in sperm cells. Irreversible loss of fertility. (Chinoy et al. 1992)
B: generation studies
rat Similar to OECD 416; dose level 0, 25, 100, 175 and 250 mg NaF/l.
NOAEL: 250 mg NaF/l; highest dose tested estimated to be about 10 mg F-/kg b.w./d in adults. (Collins et al. 2001a, 2001b)
rat Other; dose level 0, 25, 100, 175 and 250 mg NaF/l.
NOAEL: 250 mg NaF/l; highest dose tested estimated to be about 10 mg F-/kg b.w./d in adults. (Sprando et al. 1997, 1998; sub-study of Collins et al. 2001a, 2001b with special attention for male fertility)
rat Other; dose level 0, 25, 100, 175 and 250 mg NaF/l.
NOAEL: 250 mg NaF/l; highest dose tested estimated to be about 10 mg F-/kg b.w./d in adults. (Sprando et al. 1997)
C: embryo- and fetotoxicity/ teratogenicity studies
rat Similar to OECD-414; 0, 50, 150 and 300 mg NaF/l drinking water from days 6 - 15 of gestation.
NOAEL for maternal effects: 150 mg NaF/l (~ 8.4 mg F-/kg b.w./d). NOAEL for developmental effects: 300 mg NaF/l (~12.3 mg F-/kg b.w./d) (Heindel et al. 1996)
rat Similar to OECD-414; 0, 10, 25, 100, 175 and 250 mg NaF/l drinking water daily throughout gestation
NOAEL for maternal toxicity and developmental effects: 175 mg NaF/l (~11.12 mg F-/kg b.w./d) (Collins et al. 1995)
rabbit Similar to OECD-414; 0, 100, 200, and 400 mg NaF/l drinking water daily from days 6 - 19 of gestation
NOAEL for maternal effects: 200 mg NaF/l (~ 8.2 mg F-/kg b.w./d. NOAEL for developmental effects: 400 mg NaF/l (~13.2 mg F-/kg b.w./d) (Heindel et al. 1996)
CHAPTER 4. HUMAN HEALTH
77
Effects on male fertility Chinoy et al. (1989; 1991; 1992 ; 1992) studied the effects of fluoride on the testes of mice, rats and rabbits with respect to reproductive impairment. In none of these studies the F--content of the control diet was stated. Male Swiss mice were exposed to 0, 10 and 20 mg NaF/kg b.w. (~ 4.52 or 9.05 mg F-/kg b.w.) by gavage for 30 days. Observations included morphology and histocytometry of all male sex organs, electron microscopic evaluation of sperm cells and a fertility test. Reversible changes in sperm motility and counts and testis (decreased germinal epithelial cell height), epididymis (decreased epithelial cell height and absence or reduction in sperm cells) and histoarchitecture of vas deferens were observed. Sperm cells showed abnormalities in head, midpiece and tail, including deflagelation. No effects were found in seminal vessels and prostate gland. In a fertility test the males showed reversible loss of fertility. The LOAEL in these studies is 10 mg NaF/kg b.w./d (~ 4.52 mg F- /kg b.w./d) (Chinoy and Sequeira 1992; Chinoy and Sequeira 1989). Rats were orally dosed with 0, 5 or 10 mg NaF/ kg b.w. for 30 days. Impairment of fertility with decreased sperm motility and counts were seen at both exposure levels. Testicular succinate dehydrogenase was diminished in both exposure groups. The concentration of sialic acid as well as ATP-ase levels in both caput and caudal epididymis were lowered in the treated animals. At 10 mg/kg acid phosphatase and protein were increased in the ventral prostate. The LOAEL in this study is 5 mg NaF/kg b.w. ~ 2.26 mg F-/kg b.w.) (Chinoy et al. 1991). Rabbits received 0, 20 and 40 mg NaF/kg b.w./d for 30 days via the diet and were subsequently mated with untreated females. A satellite group receiving 40 mg NaF/kg b.w./d for 30 days was withdrawn from treatment and kept for another month. After 30 days of exposure, body weights were decreased in all dose groups. A complete loss of fertility was seen at 40 mg/kg b.w. and at 20 mg/kg a 70% reduction of fertility rate was found. This was accompanied by reduced sperm counts and motility at both dose levels. Decreases in seminal ATP-ase, succinate dehydrogenase, acid phosphatase, total protein Na+ and K+ levels were seen at both dose levels. None of the parameters returned to normal values after the period of recovery. The LOAEL in this studies is 20 mg NaF/kg b.w./d (~ 9.05 mg F-/kg b.w.) (Chinoy et al. 1992). Araibi et al. (1989) administered fluoride (as NaF) via the diet at levels of 0, 100 and 200 mg/kg to groups of male rats for 60 days. Serum testosterone levels, testes histology and male fertility were determined at the end of the study. Peritubular membrane thickness of seminiferous tubules, and relative numbers of sperm cell containing sperm tubes were significantly reduced at 200 mg/kg, while mean seminiferous tubular diameter was decreased in both exposure groups. At the highest dose numbers of pregnant females and newborns were reduced and a tendency to a decreased average litter size was observed at both levels. Serum testosterone was decreased at 200 mg/kg. The authors did not clearly state whether the fluoride levels in the food were calculated as free fluoride ion or as NaF. If it is assumed that the dose levels refer to F- the LOAEL in this study is 100 mg F-/kg feed (~5 mg F-/kg b.w./d). The study was poorly reported and the F--content of the control diet was not stated. Shusheela and Kumar (1991) dosed male rabbits with 0 or 10 mg NaF/kg b.w./d for 18 or 29 months. Seven animals/group were killed after 18 months and the remaining 3 animals after 29 months of exposure. Testis, caput epididymis and vas deferens were examined by light and electron microscopy. After 29 months the spermatogenic cells in the seminiferous tubules were

EU RISK ASSESSMENT – HYDROGEN FLUORIDE FINAL REPORT, OCTOBER 2001
78
disrupted, degenerated and devoid of spermatozoa. After 18 as well as after 29 months in the epididymis and vas deferens effects on the epithelial cilial cells were observed. The F--content of the control diet was not stated. It is hard to believe that up to the 18th month of the experiment no effects were observed (in 7 animals) and that from month 18 through 29 spermatogenesis has ceased (as determined in three animals). Given the low number of animals and the rather time pattern of the changes, no credibility can be attached to this finding. In the light of the above mentioned fertility studies, the US-FDA studied the effects of intratesticular injections of NaF (Sprando et al. 1996). The study was of proper design. Sodium fluoride (0, 50, 175 or 250 �g/�l) dissolved in saline, was injected once (50 �l/injection) in the left testicle. These levels were equivalent to 0, 0.71, 3.1 and 3.53 mg F-/g testes tissue. The right testicle served as an intact control. Tissues were collected 24 h and 1, 2 and 3 weeks after treatment. Data on fluoride contents of the feed were not provided. According to the authors the exposure to the highest amount of injected fluoride was at least 100 times greater than that under normal conditions. Observations included testis and epididymal weights, various morphological aspects of interstitial tissue, seminiferous tubules, Sertoli and germ cells, spermacytogenesis and meiosis. The only effects observed were signs of mechanical damage and occasional leucocyte infiltration which were related to the injections themselves rather than the exposure to fluoride. Other effects on testes morphology or on spermiogenesis were not seen. Although the study may indicate that direct exposure of testicular tissue to fluoride has no pronounced effect on testis morphology and sperm quality, is results cannot be interpreted in terms of safe or unsafe oral exposure to sodium fluoride, because extrapolation from direct testicular dosing to oral exposure is impossible. Generation studies In a 2-generation study female mice receiving 0, 50, 100 or 200 mg F-/l as NaF in their drinking water were mated with untreated males. Control diet contained 0.1 to 0.3 mg F-/kg. In the control group a progressive decline in litter production with successive litters occurred in both generations. By 6 weeks of exposure 50% of the females had died in the highest dose group and by week 17 of exposure all females in this group had succumbed. Also in the 100 mg/l dose group only nine litters were born over a 10 weeks period. Although the study is performed according to a limited design, it suggests that 50 mg F-/l (approximately 7.5 mg F-/kg b.w./d) is more adequate to maintain reproductive capacity than the low fluoride control diet without extra fluoride in the drinking water (Messer et al. 1973). In a 3-generation study female mice of the first generation were orally exposed to 0 and 2 mg F-/kg diet as NaF, equivalent to 0 and 0.3 mg F-/kg b.w./d, respectively and mated with untreated males. The second and third generation females received 0, 2 and 100 mg F-/kg diet. The control diet contained less than 0.5 mg F-/kg. Relevant observations included among others, growth, reproductive response, litter size, pup weight and incidence of stillbirth. No compound-related effects on reproduction were observed. With respect to reproductive toxicity of fluoride, the protocol of this study is considered incomplete and an occurring kidney infection may have disturbed the sensitivity of the test. Therefore this study is not taken into account in the over-all assessment (Tao and Suttie 1976). Aulerich et al. (1987) fed mink (6/sex/group) for 4.5 months up to 1 year diets to which 0, 33, 60, 108 , 194 or 350 mg F- (as NaF)/kg were added (equivalent to 0, 8, 15, 27, 50 or 90 mg F-/kg b.w.). After 4.5 months 5 male animals per group were sacrificed and in the high dose group brittle

CHAPTER 4. HUMAN HEALTH
79
skull bones were observed. After another 3.5 months females were mated with the one male belonging to their respective dose group. In the control and low dose group 80 and 50% of the females became pregnant, while in the other dose groups all of the females became pregnant. No substance-related effects on mean litter size, mean kit body weight at birth and kit growth were observed, but at 6 weeks post-partum in the high-dose group decreased pup survival (down to 14%) was seen. Female animals were kept until 382 days of age, after which in the high dose group only one animal survived. Survival in the other groups was not affected by fluoride exposure. In several females of the high dose group enlarged or deformed sagittal crests were noticed. Serum alkaline phosphatase was increased at 108 mg/kg and significantly increased at 194 mg/kg. (The one remaining female in the 350 mg/kg group had elevated alkaline phosphatase as well). Urinary fluoride was increased in all dose groups and bone fluoride was increased from 60 mg/kg onwards (both parameters dose related). Dental mottling, broken canine teeth and exostosis of jaws were observed in kits from the 194 and 350 mg/kg groups (Aulerich et al. 1987). The study is considered too incomplete for derivation of an overall NOAEL. US-FDA has performed a two-generation study in rats in which NaF was administered via the drinking water. The results of this study have been published in four different papers, two by Collins et al. (2001a, 2001b) in which attention is paid to the conventional end points of such a study, and two by Sprando et al. (1997, 1998) in which attention is paid to the results of special incvestigations into the functionality of the sex organs of the males that were used in this two generation study. These four papers are discussed below in chronological order. In a two-generation study in rats NaF was administered via the drinking water.at concentrations of 0 (<0.2), 25, 100, 175 and 250 mg NaF/l (Sprando et al. , 1997). Based on the reported average body weights of the adult P0 males and an assumed daily water intake of 50 ml/d these concentrations are equivalent to approximately 0, 1.1, 4.4, 7.5 and 10 mg F-/kg b.w./d, respectively. The low fluoride diet contained 7.95 mg F-/kg (equivalent to 0.4 mg/kg b.w./d). Twenty-two days old P0 males and females (Sprague-Dawley rats 12/sex/group) received fluoride for about 14 weeks (10 weeks pre-mating, 3 weeks mating and 1 week post-mating periods) and pregnant P0-females continued to be exposed until the end of lactation. The F1 generation remained within the same treatment groups as their parents. F1 animals received F- in utero, via lactation and via the drinking water to approximately 14 weeks after weaning. In the male rats the following parameters were monitored (both P0 and F1 generations): testes weight and histology (Leydig cell morphology, composition of interstitial cell population, seminiferous tubule morphology, Sertoli cell morphology, spermatid development), homogenisation-resistant spermatid counts, sperm cell production and production rate (per gram of testis tissue), secondary sex organ weights, serum LH, FSH and testosterone concentrations, body, liver, spleen, heart and adrenal weights. Only isolated statistical differences in various organ weights between treated and control groups or between P0 and F1 generations were observed. These differences were not treatment related and do not indicate toxicologically relevant effects. Testicular histological examination did not reveal any abnormalities. The NOAEL for effects on male reproductive organs and cells in this study is 250 mg NaF/l which is equivalent to approximately about 10 mg F-/kg b.w./d. In an additional paper (Sprando et al, 1998) the authors described the results of an electronmicroscopical morphometric analysis of testicular tissue of F1 generation males (5/group). The animals were taken from the same experiment as described above. Seminiferous tubules comprised 89%, 87%, 88%, 88% and 88% of the total testis volume while the interstitial space occupied 9.3%, 11.2%, 10.2%, 9.8% and 9.9% of the total testis volume for

EU RISK ASSESSMENT – HYDROGEN FLUORIDE FINAL REPORT, OCTOBER 2001
80
the 0, 25, 100, 175 and 250 mg NaF/l treatment groups, respectively. Statistically significant differences between control and NaF-treated rats were not observed with respect to absolute volume of the seminiferous tubules, interstitial space, Leydig cells, blood vessels boundary layer, lymphatic space, macrophages, tubular lumen or absolute tubular length and absolute tubular surface area, mean Sertoli cell nucleoli number per tubular cross-section, mean seminiferous tubule diameter and the mean height of the seminiferous epithelium. A statistically significant decrease in the absolute volume and volume percent of the lymphatic endothelium was observed in the 175 and 250 ppm NaF-treated groups and in the testicular capsule in the 100 ppm NaF-treated groups. The significance of this finding is unknown at the present time. Overall, the quantitative information obtained suggests that exposure to NaF at the doses used in the present study does not adversely affect testis structure or spermatogenesis in the rat. A two-generation study according to a randomized design, with mating protocol and treatment in compliance with the OECD-416 guideline, performed under GLP, has been reported by Collins et al. (2001a). For the P generation, 48 rats per sex (strain: CD CRL:CD-BR) were assigned to groups receiving 0 (<0.2 mg F-/l), 25, 100, 175 or 250 mg NaF/l via the drinking water. The animals were kept on a low fluoride diet containing 7.95 mg F-/kg. P animals were treated for 10 weeks before mating and subsequently mated (1:1) within each group until either pregnancy was determined by the presence of a sperm plug or for three consecutive weeks. After the mating P males were transferred to a follow up study for effects on the male reproductive system (see Sprando et al. (1997, 1998)). At day 20 of gestation 8 P females of each group were sacrificed. These dams and their offspring were examined in a separate study (Collins et al. 2001b). The remaining dams were allowed to litter. On postnatal day 4 the litters were culled to 10 pups per group by random procedure. The F1 animals remained within their respective treatment groups and at postnatal day 21, 36 F1 animals from each sex were randomly selected for further breeding. These F1 animals were kept for another 10 weeks and subsequently mated according to the same procedure as the P animals. At gestation day 20, F1 females were sacrificed and dams and their fertility and offspring was examined. The following observations were made:
- feed and drinking water consumption, clinical observations, and growth and development in and F1 animals,
- pathology: 10 males and females from each group (P generation, F1 weanlings, F1 adults) gross lesions, body weights, organ weights of 14 tissues (among which male sex organs and ovaries), histopathology of 41 tissues in all animals and in addition histopathology of 17 extra tissues in the animals of the control and highest dose groups,
- reproductive performance: date of birth, litter size, mating-, gestation-, fertility- and viability-indices pup survival. Indicators for embryo/foetal toxicity and effects on foetal development (both skeletal and visceral) were reported separately (Collins et al. 2001b).
No dose-related clinical effects were observed. During the 10-week periods before mating, P males in the highest dose group consumed statistically significant less feed than the control P males. In the F1 females a negative dose-related trend in feed consumption was seen, but statistical significance was not reached. In the same period, P and F1 males and females consumed less drinking water than the control animals, possibly due to decreased drinking water palatability. P females and males showed a negative dose-related trend in body weight gain, but only in the males of the 250 mg/l group the reduction in body weight gain became statistically

CHAPTER 4. HUMAN HEALTH
81
significant. No effects on body weights were observed in the F1 animals. Absolute and relative organ weights of any of the organs studied were not affected. F1 males and F1 females showed dose-related and statistically significant mild dental whitening at 100, 175 and 250 mg NaF/l but not at 25 mg NaF/l. Dental staining or mottling was not observed. In the 250 mg/l dose group, in all adult males and females of the P and F1 generations and in 8 female and 10 male F1 weanlings, an increase in the development of prominent growth lines (basophilic lines in dentin and dental enamel) was observed. In the same exposure group, dentin deposition in de pulpal cavity was observed in one P male and one P female and in four F1 males. Hyperkeratosis of the limiting ridge of the forestomach was observed in one P male and three P females of 100 mg/l group, in one P male of the 175 mg/l group, in one P male of the 250 mg/l group and in two F1 males and two F1 females of the 250 mg/l group. No effects were observed on any of the following parameters indicative for reproductive performance or pup viability: mating index, fertility index, time to mating, and for the F1 generation number of implants, litter size, number of stillborn pups per litter, and pup survival and lactation indices. Runts were randomly distributed among control and treatment groups. For the detection of developmental toxicity 8 pregnant P dams per group were sacrificed and their offspring was examined for gross appearance (Collins et al. 2001b). For each treatment group, 29 to 34 pregnant F1 dams were sacrificed and their offspring was studied extensively for skeletal and visceral abnormalities. Neither in the 8 P dams nor in the F1 dams clinical signs of toxicity were observed during gestation. In the P dams and in the F1 dams at 100 mg/l and above a reduced average intake of drinking water was observed, which reached statistical significance in the P dams at 250 mg/l and in the F1 dams at 175 and 250 mg/l. Although in all treatment groups in both generations a reduced feed intake was observed, this effect showed no dose-response relationship. No dose response relationship was observed in body weight gain during pregnancy or in gravid uterine weight. In both P and F1 generations, no effects were observed on female fertility parameters, or on parameters indicative for embryo- or foetotoxicity. Foetal body weights and lengths were not affected. No gross external malformations in the offspring of both generations were observed. Upon examination for skeletal defects, in the offspring of the F1 dams no effects were observed with respect to sternebral variations. An increased incidence of retarded ossification of the hyoid bone in the 250 mg/l group was observed when the data were analysed on a total number of pups basis, but not on a per litter basis. In none of the other skeletal elements any indication for retarded ossification due to treatment with NaF was observed. No irreversible structural changes, neither in the skeleton nor in the soft tissues were found. From the study (Collins et al. 2001a, 2001b) it can be concluded that no fertility effects occurred in rats exposed to NaF in the drinking water at concentrations up to 250 mg/l. The dose levels (expressed on a mg/kg b.w./d basis) for P and F1 animals were about equal, and based on drinking water consumption data and body weights, the exposure level of 250 mg/l is on average equal to 10.7 mg F-/kg b.w./d or 12.5 mg F-/kg b.w./d for males and non-pregnant females respectively. The NOAEL for developmental toxicity in this study is 250 mg NaF/l drinking water, which is equal to 11.7 mg F-/kg b.w./d for the P generation and equal to 12.7 mg/l for the F1 generation. (dose level representative for the period of gestation).

EU RISK ASSESSMENT – HYDROGEN FLUORIDE FINAL REPORT, OCTOBER 2001
82
Embryo-, feto- and developmental toxicity As part of a more extended study into the kinetics and toxicity of fluoride administered as various salts, pregnant rats received 0, 51, 124 and 200 mg NaF/kg diet (equivalent to 0, 1.13, 2.74 or 4.41 mg F-/kg b.w./d) from day 1 to day 20 of gestation. Observations with respect to reproduction included number of viable fetuses/litter, fetal and placental weight and resorptions. No effects were observed. This study is incomplete with respect to reproductive toxicity of fluoride because the offspring was not appropriately examined (Theuner et al 1971). In another study, pregnant female rats (20/group) were exposed to 0 or 30 mg F-/l as NaF (~ 0 or 3.36 mg F-/kg b.w./d) through day 6-15 of gestation and killed at day 20. It was stated that in a preliminary study with 30, 40 and 50 mg F-/l no maternal toxicity was observed at 30 mg/l. Observations included maternal weight, verification of fetal life, sex, macroscopic deformities, resorptions, corpora lutea, fetal histopathology and bone malformations. Enhanced numbers of congenital deformities (equimosis, bone formation deficiencies of sternum and skull bones) and runts were observed. The histological examination were reported to be normal, but specification about techniques and tissues were not given. The LOAEL in this study is 30 mg F-/l (~ 3.36 mg/kg b.w./d. (Larez et al 1980). The study is inadequately reported and maternal toxicity was tested in an indirect way (no effect on maternal weight change in a pilot study). The relevance of the effect denoted by the term "equimosis" cannot be assessed. Collins et al. (1995) have investigated the oral developmental toxicity of NaF in rats in an assay similar to OECD-414. The substance was administered via the drinking water (ultra pure) in concentrations of 0, 10, 25, 100, 175 and 250 mg NaF/l, daily throughout gestation. Groups of 33 to 37 females were mated with untreated males. Actual dose levels were 0, 0.63, 1.76, 7.06, 11.12 and 11.35 mg F-/kg b.w. All animals received a low fluoride diet containing 7.95 mg F-/kg feed which results in an additional exposure to approximately 0.6 F- mg/kg b.w./d. The observations included maternal toxicity (behavioral and clinical signs including dental mottling, feed and drinking water intake, body weight) and toxicity in the off-spring (numbers of live and dead foetuses, implantations, resorptions, numbers of corpora lutea, sex, weight, external examination, skeletal abnormalities and soft tissue abberations). Clinical signs of toxicity in the dams were not seen, but at the highest two dose levels drinking water consumption and at the highest dose level feed intake were diminished. At 250 mg/l dams showed reduced growth. At the highest level of exposure, a slight reduction in corpora lutea, and number of implants per dam were seen but these observations were no effect of fluoride. No signs of retarded foetal development were obtained. At the highest dose level a limited but statistically significant increase in the number of foetuses with skeletal variations was found. The number of litters affected was not significantly increased. Thus this study did not reveal relevant reproductive or developmental toxicity resulting from fluoride at dose levels up to 250 mg/l. At this level maternal toxicity was observed. The NOAEL for maternal toxicity and developmental effects in this study is 11.12 mg F-/kg b.w./d. (Collins et al. 1995).
In another study by NTP, similar to OECD-414, sodium fluoride was administered via the drinking water to rabbits and rats.
Groups of 26 female rats received 0 (�0.6), 50, 150 or 300 mg NaF/l in deionised water from day 6 through day 15 of gestation. The feed contained about 12.4 mg/kg fluoride (average value). Actual intake of fluoride via the drinking water amounted to �0.3, 3.0, 8.4 and 12.3 mg F-/kg b.w./d. Fluoride in feed resulted in an additional exposure of 1.0 mg F-/kg b.w./d. With the

CHAPTER 4. HUMAN HEALTH
83
highest dose administered the authors aimed at the induction of some maternal toxicity while avoiding dehydration effects due to reduced water intake resulting from bad palatability of NaF solutions. Observations included maternal toxicity (clinical signs, weight gain, water and feed consumption, liver and kidney weights) and toxicity in the offspring (number of litters, corpora lutea, implantation sites, resorptions, late death, live fetuses, fetal body weights, sex ratio, external and skeletal and soft tissue malformations. The only significant effect on the dams was a reduced water intake in the high dose group during the treatment. No indications for embryo-, feto- or developmental toxicity were obtained. The NOAEL in this study for developmental of fetotoxicity is therefore equal to the highest level tested being 12.3 mg/kg b.w./d (Heindel et al. 1996).
In the same study report (Heindel et al. 1996), the results of exposure of groups of 26 rabbits to 0 (�0.6), 100, 200 and 400 mg NaF/l in the drinking water for day 6 through 19 of gestation have been described. Exposure via the drinking water amounted to �0.1, 4.7, 8.2 and 13.2 mg F-/kg b.w./d, whereas exposure via food contributed about 0.8 mg F-/kg b.w./d to the total fluoride intake. As with the rats observations included maternal toxicity (clinical signs, weight gain, water and feed consumption, liver and kidney weights) and toxicity in the offspring (number of litters, corpora lutea, implantation sites, resorptions, late death, live fetuses, fetal body weights, sex ratio, external and skeletal and soft tissue malformations. Dams exposed to the highest fluoride level demonstrated reduced water intake during the exposure period and a reduced feed intake on days 6 through 8 of gestation resulting in a reversible loss of body weight over these days. No (other) signs of maternal toxicity were obtained. Examination of uteri and offspring did not reveal any sign of embryo-, feto- or developmental toxicity. The NOAEL for reproductive effects in this study is therefore 13.2 mg/kg b.w./d (highest level tested).
In a preliminary study, only reported as an abstract, I.P. injection of 0 or 15 mg NaF/kg b.w. in rats (~ 0 or 6.79 mg F-/kg b.w.) through days 7-14 or days 14-20 of gestation resulted in skeletal malformations and retardations in sternebrae and thoracic vertebrae with increased occurrence of 14th rib. These aberrations were mainly observed in the 14-20 day dose group. Maternal toxicity was not observed. For a proper evaluation, the whole report should be made available. (Horvath 1989). NaF was intraperitoneally or subcutaneously injected into pregnant rats from days 10 through 18 of gestation. A more or less dose-related increase in the frequency of necrotic placentas and dead fetuses was observed. Even the lowest dose level (1 mg NaF/kg b.w./d; equal to 0.45 mg F-/kg b.w./d) elicited these effects, which were more pronounced after IP than after SC administration of NaF. Up to 9 mg F-/kg b.w./d. no maxillo-facial malformations were seen. Other effects were not studied. (Deveto et al. 1972). From the two generation studies by Collins et al. (2001a, 2001b; see section generation studies) a NOAEL for developmental toxicity of 250 mg NaF/l drinking water can be derived (highest dose tested). Human data A study into the impact of fluoride in drinking water on human fertility showed a decrease in total fertility rate (determined as number of birth per 1000 women) associated with increasing fluoride drinking water concentrations (Freni 1994). However, this epidemiological study was performed at population level, and a causal relationship between fluoride exposure and reduced fertility rate was not demonstrated. Too many confounding factors, which were not taken into
EU RISK ASSESSMENT – HYDROGEN FLUORIDE FINAL REPORT, OCTOBER 2001
84
account, may be involved in the association between fluoride intake and the biological phenomenon. This study is unsuitable to derive a NOAEL. Conclusion No specific data with respect to the reproductive, developmental or embryo/feto-toxicity of HF have been reported. However, these effects are systemic and thus, because of similar kinetics and dynamics, data on sodium fluoride are used to give insight in the reproductive toxicity of HF. Human data on reproductive toxicity of fluoride are inconclusive. The available information from repeated dose toxicity studies as well as reproductive toxicity studies do not indicate a hazard for female reproduction in relation to exposure to fluoride. In several studies indications were obtained that oral exposure to fluoride may damage testicular tissue and reduce male fertility. The LOAEL for these effects was 2.26 mg F-/kg b.w./d. In a study in which F- (as NaF) was administered directly into the testes of rats no substance related effects were seen. In another recently completed two-generation study of high quality (US-FDA) which specifically focussed on damage to the male reproductive system, no testicular effects were seen at an exposure level of 250 mg NaF/l (equivalent to about 10 mg F-/kg b.w./d). The available results of the long-term studies, the test for the effects of F- on testes after intratesticular injection and the reports of the two-generation study by US-FDA contradict the results of the tests which indicate that F- may damage testes tissue. For the establishment of an overall NOAEL/LOAEL the following considerations are taken into account: - In all animal studies in which fertility effects were reported, NOAELs could not be found. It
cannot be excluded that this is the result of some unknown contaminant. - In these studies dose levels are generally below back-ground exposure, while concentrations
in food or drinking water have not explicitly been determined. Therefore the relevance of the findings is highly questionable.
- These studies are very limited in design and technical realisation and of considerable less quality than the studies performed by US-FDA, their weight of evidence is therefore far less. In contrast, the US-FDA studies are technically well performed according to modern standards, while high maximum dose levels were used, with well-described background fluoride exposure.
- In a dermal irritation study (Derelanko et al. 1985) a reduced testes weight (with 40%) was found after 4 hours of exposure to 2% HF (~40 mg HF/kg b.w.) under occlusion (observation time: 96 h after exposure) without significant microscopic alterations, however, dermal lesions were already observed at 0.01 % HF (0.2 mg/kg b.w.).
- In the 90-days inhalatory toxicity test with HF in rats no specific effects on reproductive organs were seen up to the highest level of exposure (7.52 mg/m3) which roughly corresponds to a systemic daily dose of 0.856 mg F-/kg b.w.
8
- In the NaF drinking water carcinogenicity studies by NTP (1990) with rats and mice weights of reproductive organs were not determined. However, at histopathology no effects on testes
8Calculated as follows: 0.856 mg/kg bw/d = Cair.t/24.d/7.Rr/bw, in which Cair = 7.52 mg/m3, t = hours of
exposure/day, d = exposure days/week, Rr = respiration rate = 0.223 m3/d and bw = body weight = 0.35 kg. This calculation assumes 100% inhalatory bioavailability.

CHAPTER 4. HUMAN HEALTH
85
or ovaries were observed in these studies. In the NaF diet study on carcinogenicity with mice (Maurer et al. 1993) no changes in reproductive organ weights were seen; histopathology data were not available. In an identical study with rats (Maurer et al. 1990) neither weight changes nor histological changes of the reproductive organs were seen. (see 4.1.2.8). In none of these studies it was mentioned that sperm characteristics were evaluated.
Consequently, the NOAEL from the US-FDA two-generation study (250 mg NaF/l, equivalent to about 10 mg F-/kg b.w./d) is used as a NOAEL for effects on fertility. In the available studies on embryo- and developmental toxicity, some embryotoxicity was observed. From three studies similar to OECD-414, for NaF a NOAEL of 11.12 mg F-/kg b.w./d for maternal toxicity and developmental effects is established, which was further confirmed in a two-generation study in compliance with the OECD-416 guideline. In this two generation study the observed maternal toxicity, if any, was limited to mild dental whitening, and changes in dentin and enamel structure, next to some hyperkeratosis in the upper gastrointestinal tract. 4.1.3 Risk characterisation 4.1.3.1 General aspects The human population may be exposed to hydrogen fluoride, and indirectly to fluoride, predominantly at the workplace and indirectly via the environment (sections 4.1.1.1 and 4.1.1.3), but also via consumer products (section 4.1.1.2). In the data set for HF animal as well as human studies were available. With respect to reproduction toxicity (base set requirement), mutagenicity and carcinogenicity data from studies carried out with sodium fluoride have been taken into account, since these studies provide insight in the possible hazard of fluoride and thus HF as has been explained in the sections on toxicokinetics. Inhaled gaseous hydrogen fluoride is virtually completely absorbed in the upper airways. Fluoride circulates in the body as F- and in association with proteins and lipids and its distribution and elimination do not depend on its place of entry into the body. Fluoride can be found in all tissues in the body and sequestration takes place in bone tissue in which about half of the absorbed fluoride is deposited. Secretion is mainly via the urine. In humans half-lives are in the range of 2 to 9 hr and in the range of 8 to 20 years for fluoride in plasma and bone deposits, respectively. In animals HF is very toxic by inhalation, in contact with skin and if swallowed. According to the EU guidelines HF is classified as Very Toxic (T+). When applied to skin and eye HF produces severe lesions, even at low concentrations. According to EU guidelines HF is classified as corrosive (C). Signs of acute fluoride intoxication in humans resemble those observed in animals. Dermal contact with HF either as liquid or as gas produces severe dermal lesions. Dermal contact with HF may result in systemic (cardiac) effects including death. Inhalatory exposure is highly damaging to the respiratory tract. Exposure to HF in a concentration of 1.16 mg/m3 will possibly result in some irritation. Sensitisation studies with HF are not available. Although such a test is a base-set requirement it was agreed that based on the physico-chemical properties of HF and F-, it is reasonable to assume that the substance has no sensitising properties.

EU RISK ASSESSMENT – HYDROGEN FLUORIDE FINAL REPORT, OCTOBER 2001
86
The available animal data set for HF permits the derivation of a NOAEL for repeated subchronic inhalatory exposure. No suitable studies are available to derive a NOAEL for HF for other routes of exposure. In a study with rats, changes in body and organ weights as well as haematological and clinical signs and death were seen at actual concentrations of 7.52 mg/m3; 6 hr/d; 5 d/w for 90 days. This value is equal to a duration corrected value (DCV
9) of 1280 �g/m3. Based on
actual exposure levels a NOAEL of 0.72 mg/m3 is established. Because at higher dose levels apart from irritation also systemic effects occur, a duration corrected equivalent of this NOAEL is calculated. This duration corrected value (NOAEL) amounts to 128 �g/m3. In humans, prolonged oral intake of excess fluoride results in skeletal fluorosis, an effect for which indications were also found after inhalatory exposure. In epidemiological studies with workers exposed to 0.48 mg total fluoride/m3 (of which 0.2 mg gaseous fluoride) no fluorosis was observed. This level can be considered as an inhalatory NOAEL for fluoride in humans. The data set on genotoxicity of HF is limited, while carcinogenicity studies with HF are not available
10 at all. However, because in toxicity tests, whether in vivo or in vitro, HF will reach its
possible targets only as (partly organically bound) F-, studies with other inorganic fluoride, such as NaF, will provide insight in fluoride genotoxicity and carcinogenicity and will also be applicable to HF.
From genotoxicity studies with both HF and NaF, it is concluded that fluoride does not induce chromosomal damage in vivo. However, genetic damage is observed in in vitro studies. From carcinogenicity studies with NaF in rats and mice it is concluded that fluoride is not considered to be carcinogenic in animals. Reproduction studies with HF are not available. In some incomplete studies fluoride (as NaF) has elicited effects on male fertility in mice, rats and rabbits. The LOAEL for these effects was 2.26 mg F-/kg b.w./d. In a two-generation study (leading to a NOAEL of 250 mg NaF/l; equivalent to about 10 mg F-/kg b.w./d) and in an intratesticular injection study, fluoride did not induce any sign of impaired testicular functioning. In this two-generation study fluoride did not affect male or female fertility. The NOAEL of about 10 mg/kg b.w./d derived from the two-generation study will be used in the risk assessment. From three well-performed embryo- and developmental toxicity studies with NaF an overall NOAEL for maternal toxicity and developmental effects of 11.12 mg F-/kg b.w./d can be derived. The duration corrected NOAEL of 128 �g/m3 from the 90 days rat study will be used for the characterisation of the risk of human inhalatory exposure for the population at large. The NOAEL of 0.48 mg total F/m3 for systemic effects which was found in an epidemiological study is used as starting point for the occupational risk assessment.
9DCV: calculated as: Cair.h / 24.d / 7; in which h and d are hours of exposure per day (=6) and number of days of
exposure per week (=5), respectively 10
IARC (164) has evaluated the carcinogenicity of mists of strong inorganic acids. From this IARC evaluation no conclusion can be drawn with respect to the inhalatory carcinogenicity of HF

CHAPTER 4. HUMAN HEALTH
87
It should be noted that in most studies background exposure to fluoride (e.g. control diet or/and drinking water fluoride level) has not been determined. This is especially problematic in oral studies in which systemic effects were investigated. Basically it would be correct to take this background exposure into account in the risk assessment for fluoride. An appropriate correction can only be carried out when sufficient data on bioavailability and concentrations in animal feed and drinking water are available. Animal feed for routine toxicity testing may contain as much as 20 mg fluoride/kg diet (approx. 1 mg/kg b.w./d). On the other hand, human diet will contain fluoride from natural sources as well. The risk-evaluation for the workers and population at large for systemic effects reflects only the additional risk resulting from exposure to fluoride above oral background. In this approach it is assumed that oral effects of fluoride in the diet are equally likely to occur in humans and in experimental animals. 4.1.3.2 Workers Assuming that oral exposure is prevented by personal hygienic measures, the risk characterisation for workers is limited to the dermal and respiratory routes of exposure. Furthermore, it is assumed that adequate risk reduction measures are taken to prevent accidental exposure. For risk characterisation, local effects of HF and systemic effects of the fluoride-ion after uptake of HF should be distinguished. Actually, for risk regarding systemic effects the total intake of F - should be taken into account, i.e. F --uptake via food and drinking water and the F --uptake due to occupational exposure to HF. Data on background levels in the toxicity studies are not always reported. For occupational risk characterisation it is assumed that the impact of oral background uptake of F - in the studies and for workers are comparable. Therefore, the estimated risk with regard to systemic effects reflects only the additional risk resulting from exposure to HF above oral background levels, unless data are available which allow a refinement (see 4.1.3.0). Acute toxicity Because it is generally known that HF is a very toxic and very strongly corrosive agent, high inhalation and dermal exposure levels are avoided in practice and the use of protective measures were taken into account in the exposure estimates. The LC50-values (1 hr values 280-1900 mg/m3) are much higher than the estimated short-term inhalation exposure levels (2.5 mg/m3 in scenario 1, 6 mg/m3 in scenario 2, up to circa 10 mg/m3 in scenario 3). Risk reduction measures, additional to those already taken to prevent accidental exposure, are not indicated (conclusion ii). Irritation and corrosivity Exposure to HF is possible by dermal contact, and via the respiratory tract and the eyes. The risk for workers is characterised for exposure via these routes to liquid and to gaseous HF, and account is made for single as well as repeated exposure. It is noted that local effects to the skin might be caused by simultaneous exposure to gaseous and liquid HF Skin, single exposure, liquid HF HF is a strongly corrosive agent. A 5% solution of HF is corrosive to the skin of rabbits. Skin lesions were observed even after exposure of rabbit's skin to 0.01% solutions for 5 minutes. In scenario 1 (chemical industry) dermal exposure will be limited to accidental events. As for scenario 2 dermal exposure levels to HF solutions with concentrations up to 35% cannot be

EU RISK ASSESSMENT – HYDROGEN FLUORIDE FINAL REPORT, OCTOBER 2001
88
excluded. Because it is generally known that HF and HF solutions cause caustic skin effects, the exposure estimates for these two scenarios assume the use of protective measures. Dermal exposure levels cannot be estimated for scenario 3 (indirect exposure). According to the information submitted by industry extensive risk reduction measures have been taken in industrial premises using HF (scenario 2) (Additional information of industry 1997). Despite this fact that risk reduction measures are taken to prevent accidental exposure, contact to the skin cannot be excluded in scenarios 2 and 3. Because of the strong corrosive properties, it is concluded that additional risk reduction measures are indicated for these scenarios (conclusion iii). It is possible that adequate worker protection measures are already being applied in (some) industrial premises. Skin, single exposure, gaseous HF In the LC50-studies skin erythema and skin corrosion were reported. In these studies animals were exposed to high levels. In the human volunteer study of Lund et al. (1997) no skin effects were reported after exposure to concentrations up to 5.2 mg/m3, but it is unclear whether skin observations were performed. The data available do not allow a risk estimation for local skin effects after single exposure to gaseous HF in occupational circumstances (conclusion ii). Skin, repeated exposure, liquid HF There are no data on local skin effects due to repeated dermal exposure to HF liquid (solutions). Given the corrosive properties, repeated exposure to concentrations that lead to corrosive effects is not expected (conclusion ii). Skin, repeated exposure, gaseous HF Exposure of human volunteers to gaseous HF in concentrations of 0.74 to 1.64 mg/m3, average 1.16 mg/m3, for 6 hr during 15 days resulted in slight facial irritation and slight irritation of the nasal mucosa. After exposure to 2.78 mg/m3 and above during 50 days, erythema and desquamation of the skin were observed. Starting-points for the risk characterisation for workers repeatedly exposed to gaseous HF with respect to local dermal effects are (a) the LOAEL of 1.16 mg/m3, and (b) the inhalation occupational levels (see chapter 4.1.1.1. and Table 4.1). Given the nature of effects it is reasonable to start with short-term exposure levels. The MOS between the LOAEL and these levels varies between 0.2 and 1.2 (see Table 4.13). These MOSs can be evaluated by comparison with the minimal MOS (2). In Annex 3 this method is explained and assessment factors used to establish the minimal MOS are given (Table A3 in this Annex). If this method is used, then there is concern when the MOS is lower than the minimal MOS.
Given the risk assessment presented in Table 4.13 it is concluded that workers are at risk with regard to local skin effects due to occupational exposure to gaseous HF and conclusion iii) is considered to be applicable for all scenarios. According to the information submitted by industry extensive risk reduction measures have been taken in industrial premises producing and/or using HF (scenario 1 and 2) (Additional information of industry 1997). It is noted that exposure levels in scenarios 1 and 2 are estimated for situations with protective measures. According to the industry (CTEF 1996), workplace experiences do not reveal adverse irritating effects in scenario 1. It is possible that in some industrial premises adequate risk reductions measures are already applied to avoid irritation.

CHAPTER 4. HUMAN HEALTH
89
Table 4.13 Occupational risk characterisation of HF for local effects on respiratory tract and skin after repeated exposure to gaseous HF
Risk characterisation for exposure to gaseous HF
Occupational scenario Estimated inhalation exposure (mg/m3) , short-term
MOSa Conclusionb
1: Chemical industry 2.5 0.5 iii
2: Use of HF acid solutions 6 0.2 iii
3: Indirect exposure ca. 10c 1.2 iii
aBased on a human LOAEL of 1.16 mg/m3 bThe conclusion is reached by considering the magnitude of the MOS, taking into account a number of additional parameters as described in the TGD. An approach to do so is given in Annex 3 cRough estimate Inhalation, single exposure In the Alarie test an RD50-value for mice of 151 ppm (124 mg/m3) was established. However, the suitability of this test as starting-point for risk assessment is doubted (Bos et al. 1992). Apart from questions as reproducibility and interpretation of the time- and concentration-response curves of the Alarie test, for corrosive substance as HF the toxic effects probably interfere with nervus trigeminus stimulation. Respiratory effects due to exposure to gaseous HF have been described in case reports (accidental exposure) and in volunteer studies. In the volunteer study of Lund et al. (1997) exposure to levels >2.5 mg/m3 for 60 minutes resulted in subjective symptoms of the upper airways. Because of the estimated short-term occupational exposure levels (2.5 mg/m3 in scenario 1, 6 mg/m3 in scenario 2, up to circa 10 mg/m3 in scenario 3) a risk cannot be excluded and risk reduction measures, additional to those already taken to prevent accidental exposure, are indicated (conclusion iii). According to the information submitted by industry extensive risk reduction measures have been taken in industrial premises using HF (scenario 2) (Additional information of industry 1997). Inhalation, repeated exposure In workers exposed to average concentrations of 0.82 mg/m3 no alteration in pulmonary function were observed and no increases in respiratory complaints were recorded. The highest HF concentrations were below 2.5 mg/m3. These data are in correspondence with the results from the human volunteer study of Largent et al. (1960) (described and used in the chapter ‘skin, repeated exposure, gaseous HF’) in which irritation of the nasal mucosa was observed after exposure to 1.16 mg/m3 (average) for 15 days. Starting-points for the risk characterisation for workers repeatedly exposed to gaseous HF with respect to local respiratory effects are (a) the LOAEL of 1.16 mg/m3, and (b) the inhalation occupational levels (see chapter 4.1.1.1. and Table 4.1). Given the nature of the effects it is reasonable to start with short-term exposure levels. The MOS between the LOAEL and these levels varies between 0.2 and 1.2 (see Table 4.13). These MOSs can be evaluated by comparison with the minimal MOS (2). In Annex 3 this method is explained and assessment factors used to establish the minimal MOS are given (Table A3 in this annex). If this method is used, then there is concern when the MOS is lower than the minimal MOS.

EU RISK ASSESSMENT – HYDROGEN FLUORIDE FINAL REPORT, OCTOBER 2001
90
Given the risk assessment presented in Table 4.13 it is concluded that workers are at risk with respect to local respiratory effects due to occupational exposure to gaseous HF in all scenarios. Conclusion iii) is reached. According to the information submitted by industry extensive risk reduction measures have been taken in industrial premises producing and/or using HF (scenario 1 and 2) (Additional information of industry 1997) and workplace experiences do not reveal adverse irritating effects in scenario 1. It is possible that in (some) industrial premises adequate risk reduction measures are already being applied to avoid irritation. Eye Exposure to the eyes is possible via vapours (all scenarios) or accidentally by splashing of HF (solutions) in scenarios 2 and 3. Exposure to the eyes is possible via vapours (all scenarios) or accidentally by splashing of HF (solutions) in scenarios 2 and 3. However, eye protection is obligatory for activities where direct handling of HF occurs. If the required protection is strictly adhered to, exposure to liquid HF will occur only accidentally in scenarios 2 and 3, so conclusion ii) is justifiable. Given the effects observed in the acute eye irritation studies (exposure to HF solutions) and in human volunteer studies (repeated exposure to vapours gives slight irritation at 1.16 mg/m3), it is concluded that HF is of concern for workers with regard to eye irritation after repeated exposure to vapours, and risk reduction measures are indicated for these scenarios (conclusion iii). It is noted that workers are not at risk for adverse eye effects after single exposure to gaseous HF, based on the study of Lund et al. (1997), in which no effects on eyes were observed after 60 minutes exposure to concentrations up to 5.2 mg/m3. Sensitisation A sensitisation study with HF is not available (see 4.1.2.5). Given the physico-chemical properties of HF and F - it is concluded that the substance is of no concern for workers with regard to skin sensitisation (conclusion ii). Repeated-dose toxicity Inhalation exposure, systemic effects The occupational risk characterisation for local effects on the respiratory tract due to repeated exposure is mentioned in the chapter 'irritation'. The occupational exposure levels to be used as starting-point for risk characterisation vary between 0.5 and 10 mg/m3 (see chapter 4.1.1.1 and Table 4.1). As toxicological starting-point for systemic effects both the epidemiological study of Chan-Yeung et al. (1983) and the semichronic inhalation study with rats (Placke and Griffin 1991) can be used. In general, in epidemiological studies only limited parameters are studied as compared with animal studies. Therefore, the sensitivity of both starting-points should be weighed. In the inhalation study with rats exposed to HF an NOAEL of 0.72 mg/m3 was established. At the next higher dose level (LOAEL, 7.52 mg/m3) both local effects on respiratory tract and systemic effects occur. These effects comprise changes in body and organ weights, as well as haematological effects, clinical signs and death. In the epidemiological study no signs of fluorosis were observed in workers exposed to up to 0.48 mg/m3 for up to ten years. There were indications for liver and kidney lesions in this study, but the changes were within the normal range. Values for hematocrit and hemoglobin were reported to be slightly higher in workers of the highest exposure group (0.48 mg/m3) but were within normal limits.
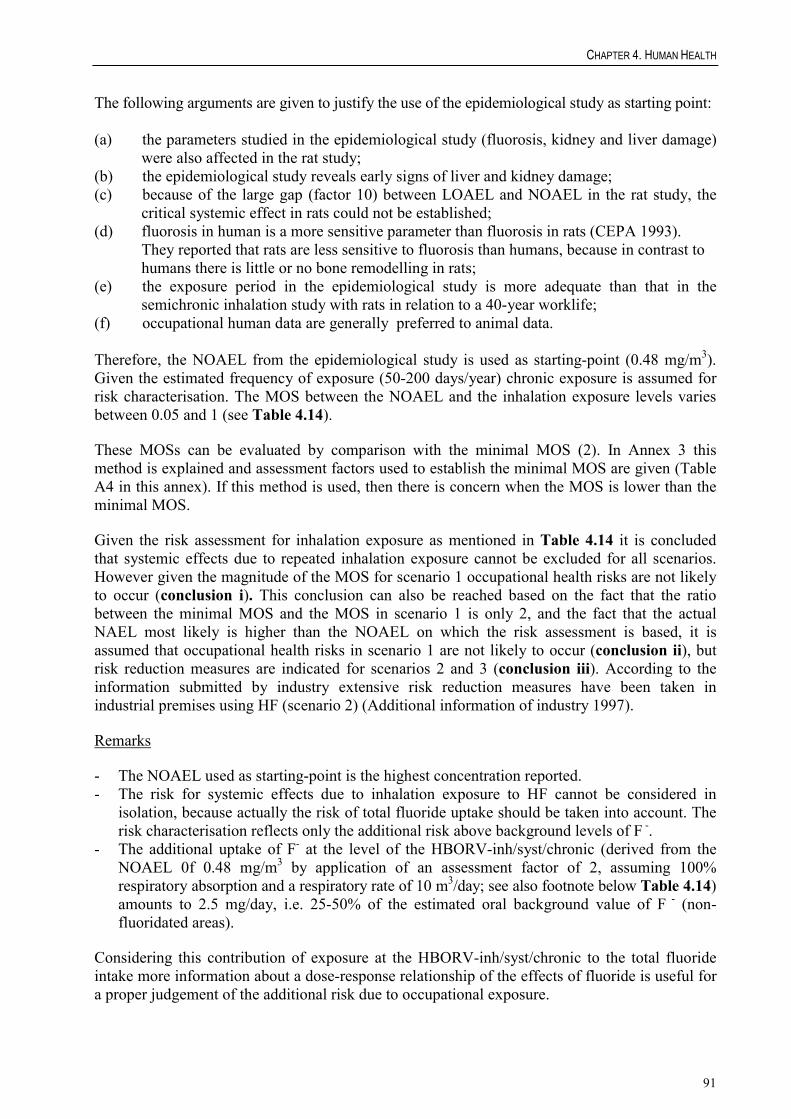
CHAPTER 4. HUMAN HEALTH
91
The following arguments are given to justify the use of the epidemiological study as starting point: (a) the parameters studied in the epidemiological study (fluorosis, kidney and liver damage)
were also affected in the rat study; (b) the epidemiological study reveals early signs of liver and kidney damage; (c) because of the large gap (factor 10) between LOAEL and NOAEL in the rat study, the
critical systemic effect in rats could not be established; (d) fluorosis in human is a more sensitive parameter than fluorosis in rats (CEPA 1993).
They reported that rats are less sensitive to fluorosis than humans, because in contrast to humans there is little or no bone remodelling in rats;
(e) the exposure period in the epidemiological study is more adequate than that in the semichronic inhalation study with rats in relation to a 40-year worklife;
(f) occupational human data are generally preferred to animal data. Therefore, the NOAEL from the epidemiological study is used as starting-point (0.48 mg/m3). Given the estimated frequency of exposure (50-200 days/year) chronic exposure is assumed for risk characterisation. The MOS between the NOAEL and the inhalation exposure levels varies between 0.05 and 1 (see Table 4.14). These MOSs can be evaluated by comparison with the minimal MOS (2). In Annex 3 this method is explained and assessment factors used to establish the minimal MOS are given (Table A4 in this annex). If this method is used, then there is concern when the MOS is lower than the minimal MOS. Given the risk assessment for inhalation exposure as mentioned in Table 4.14 it is concluded that systemic effects due to repeated inhalation exposure cannot be excluded for all scenarios. However given the magnitude of the MOS for scenario 1 occupational health risks are not likely to occur (conclusion i). This conclusion can also be reached based on the fact that the ratio between the minimal MOS and the MOS in scenario 1 is only 2, and the fact that the actual NAEL most likely is higher than the NOAEL on which the risk assessment is based, it is assumed that occupational health risks in scenario 1 are not likely to occur (conclusion ii), but risk reduction measures are indicated for scenarios 2 and 3 (conclusion iii). According to the information submitted by industry extensive risk reduction measures have been taken in industrial premises using HF (scenario 2) (Additional information of industry 1997). Remarks - The NOAEL used as starting-point is the highest concentration reported. - The risk for systemic effects due to inhalation exposure to HF cannot be considered in
isolation, because actually the risk of total fluoride uptake should be taken into account. The risk characterisation reflects only the additional risk above background levels of F -.
- The additional uptake of F- at the level of the HBORV-inh/syst/chronic (derived from the NOAEL 0f 0.48 mg/m3 by application of an assessment factor of 2, assuming 100% respiratory absorption and a respiratory rate of 10 m3/day; see also footnote below Table 4.14) amounts to 2.5 mg/day, i.e. 25-50% of the estimated oral background value of F - (non-fluoridated areas).
Considering this contribution of exposure at the HBORV-inh/syst/chronic to the total fluoride intake more information about a dose-response relationship of the effects of fluoride is useful for a proper judgement of the additional risk due to occupational exposure.

EU RISK ASSESSMENT – HYDROGEN FLUORIDE FINAL REPORT, OCTOBER 2001
92
Dermal exposure There are no dermal repeated dose toxicity studies available. Starting-points for the occupational risk assessment for systemic effects due to dermal exposure are the NOAEL (0.48 mg F -/m3) from the epidemiological study of Chan-Yeung et al. (1983) by application of route-to-route extrapolation, and (b) the dermal occupational exposure levels (see chapter 4.1.1.1 and Table 4.1). Correction is made by worst case assumptions for differences between inhalation and dermal absorption. It is assumed that fluoride is completely absorbed in the upper respiratory tract and 100% dermal absorption cannot be excluded. Given the estimated frequency of exposure (50-200 days/year) chronic exposure is assumed for risk characterisation. The MOS between the NOAEL and the dermal exposure levels is 24 (scenario 2) or is unknown (scenario 3; because exposure levels cannot be estimated) (see Table 4.14). These MOSs can be evaluated by comparison with the minimal MOS (2). In Annex 3 this method is explained and assessment factors used to establish the minimal MOS are given (Table A4 in this annex). If this method is used, then there is concern when the MOS is lower than the minimal MOS.
Because skin exposure in scenario 1 is limited to accidental events, risk characterisation for repeated exposure is not relevant. Systemic effects due to occupational dermal exposure in scenario 2 are not expected. Because dermal exposure in scenario 3 cannot be estimated, systemic effects cannot be excluded. Therefore conclusion iii) may be applicable for scenario 3. It is considered possible that risk reduction measures already applied in this scenario are adequate. Remarks - The risk for systemic effects due to dermal exposure to HF cannot be considered in
isolation, because actually the risk of total fluoride uptake should be taken into account. The risk characterisation reflects only the additional risk above background levels of F -.
- The additional uptake of F - at the level of the HBORV-derm/syst/chronic amounts to 2.5 mg/day (assuming 100% dermal absorption), i.e. 25-50% of the estimated oral background value of F - (non-fluoridated areas).
- Considering this contribution of exposure to the HBORV-derm/chronic to the total fluoride intake more information about a dose-response relationship of the effects of fluoride is useful for a proper judgement of the additional risk due to occupational exposure.

CHAPTER 4. HUMAN HEALTH
93
Table 4.14 Occupational risk characterisation of HF for repeated dose toxicity (systemic effects)
Risk characterisation for inhalation exposure Risk characterisation for dermal exposure
Occupational scenario
Estimated inhalation exposure (mg/m3)
full shift values
MOSa Conclusionb Estimated dermal exposure
(mg/d)
MOSc conclusiond
1:Chemical industry
0.5 1 ii accidental not relevant
(see text)
not relevant ii
2: Use of HF acid solutions
2.4 0.2 iii 0.2 24 ii
3: Indirect exposure
< 1 - ca. 10e 0.05-0.5 iii unknown unknown iii
aBased on a human NOAEL of 0.48 mg/m3 bThe conclusion is reached by considering the magnitude of the MOS, taking into account a number of additional parameters as described in the TGD. An approach to do so is given in Annex 3 cBased on a human NOAEL of 0.48 mg/m3 and a respiratory volume of 10 m3/day dThe conclusion is reached by considering the magnitude of the MOS, taking into account a number of additional parameters as described in the TGD. An approach to do so is given in Annex 3 eRough estimates Mutagenicity The results from the mutagenicity studies give no indication that HF is of concern for workers with regard to mutagenicity (conclusion ii). Carcinogenicity There are no carcinogenicity studies with HF available. Since the results from the oral studies with NaF give no indications that fluoride has a carcinogenic potential in animals, and taking into account that HF is not mutagenic, there is no clear reason for concern for workers with regard to carcinogenicity of HF (conclusion ii). Reproductive toxicity Inhalation exposure The occupational exposure levels to be used as starting-point for risk characterisation vary between 0.5 and 10 mg/m3 (see chapter 4.1.1.1 and Table 4.1). As for the toxicological starting-points, there are no studies available on reproductive toxicity with HF. Therefore, the oral reproduction studies with NaF are used. Given the effects observed in the developmental studies it is concluded that HF is of no concern with respect to these effects. Fluoride causes effects on the progeny only at maternally toxic dose levels. The 2-generation study of the US-FDA is used as starting-point for risk characterisation. At the highest dose level tested (10 mg F -/kg b.w./d) no effects on fertility were observed. Route-to-route extrapolation is applied with worst case assumptions for differences between inhalation and oral absorption. As mentioned in chapter 4.1.2.1 HF is completely absorbed in the upper respiratory tract. For oral absorption of fluoride 100% is used. The MOS between the NOAEL and the inhalation exposure levels varies between 2.5 and 50 (see Table 4.15).

EU RISK ASSESSMENT – HYDROGEN FLUORIDE FINAL REPORT, OCTOBER 2001
94
These MOSs can be evaluated by comparison with the minimal MOS (36). In Annex 3 this method is explained and assessment factors used to establish the minimal MOS are given (Table A5 in this annex). If this method is used, then there is concern when the MOS is lower than the minimal MOS. Given the risk assessment presented in Table 4.15, it is concluded that the MOS is lower than the minimal MOS in scenario 3, indicating a risk for fertility effects. There are no indications for concern for the other occupational exposure scenarios. Remarks - The NOAEL used as starting-point is the highest dose level tested. - The NOAEL in the study is 25 times the oral background value of fluoride in the diet. - Fluoride uptake via occupational respiratory exposure to HF amounts to 5, 24 and <1-ca 10
mg/day for scenarios 1, 2, and 3, respectively (assuming 100% inhalation absorption and a respiratory rate of 10 m3/day), i.e., approx. 1, 4 and <1-2 times the background value for fluoride uptake via food and drinking water in non-fluoridated areas (6 mg/d).
Given these remarks and the height of the MOS, it is concluded that this risk estimation indicates no additional risk for fertility effects resulting from occupational exposure above oral background levels for scenario 1 and 2, resulting in conclusion ii) for these scenarios. For scenario 3 health risk cannot be fully excluded, and conclusion iii) might be applicable for this scenario. Dermal exposure The occupational exposure levels to be used as starting point in risk characterisation are estimated in chapter 4.1.1.1 and summarised in Table 4.1. As for the toxicological starting-points, there are no dermal studies on reproductive toxicity with HF available. Reference is made to the chapter above ('reproductive toxicity, inhalation exposure') for the choice of the NOAEL to be used for the risk characterisation (10 mg F -/kg b.w./d from the 2-generation reproduction study). Route-to-route extrapolation is applied with worst case assumptions for differences between dermal and oral absorption. Complete dermal absorption cannot be excluded. For oral absorption of fluoride 100% is used. The MOS between the NOAEL and the dermal exposure levels is 15 (scenario 2) or is unknown (scenario 3; because exposure levels cannot be estimated) (see Table 4.15). These MOSs can be evaluated by comparison with the minimal MOS (36). In Annex 3 this method is explained and assessment factors used to establish the minimal MOS are given (Table A5 in this annex). If this method is used, then there is concern when the MOS is lower than the minimal MOS. Skin contact in scenario 1 is limited to accidental events, and therefore risk characterisation is not relevant in that case. Given the risk assessment presented in Table 4.15 it is concluded that reproduction effects due to occupational skin contact are not likely to occur in scenario 2, but cannot be excluded in scenario 3.

CHAPTER 4. HUMAN HEALTH
95
Remarks - The NOAEL used as starting-point is the highest dose level tested. - The NOAEL in the study is 25 times the oral background value of fluoride in the diet, and at
this level no effects on fertility were observed. - Fluoride uptake via occupational dermal exposure to HF amounts to 0.5 mg/day for scenario
2, (assuming 100% dermal absorption) i.e., approx. 7% of the background value for fluoride uptake via food and drinking water in non-fluoridated areas (6 mg/d).
Given these remarks, it is concluded that this estimation indicates no additional risk resulting from occupational exposure above oral background levels in scenario 1 and 2 and conclusion ii) is applicable for these scenarios. Because dermal exposure in scenario 3 cannot be estimated, reproduction effects cannot be excluded, resulting in conclusion iii). Table 4.15 Occupational risk characterisation of HF for reproduction effects
Risk characterisation for long-term inhalation exposure/reproduction toxicitya
Risk characterisation for long-term dermal exposure/reproduction toxicity
Occupational scenario
Estimated inhalation exposure
(mg/m3) full shift
MOSb Conclusionc estimated dermal
exposure (mg/d)
MOSd Conclusione
1: chemical industry
0.5 50 ii accidental not relevant (see text)
ii
2: use of HF acid solutions
2.4 10 ii 0.2 15 ii
3: indirect exposure
< 1 - ca.10f 2.5->25 iii unknown unknown iii
aWorst case assumption: 8 hr exposure/workday; bBased on a NOAEL of 10 mg/kg b.w./d in the rat, and a bodyweight of the rat of 0.3 kg, a respiratory volume of the rat of 0.12 m3/8 hr; cThe conclusion is reached by considering the magnitude of the MOS, taking into account a number of additional parameters as described in the TGD. An approach to do so is given in Annex 3; dBased on a NOAEL of 10 mg/kg b.w./d in the rat, and a bodyweight of the rat of 0.3 kg; eThe conclusion is reached by considering the magnitude of the MOS, taking into account a number of additional parameters as described in the TGD. An approach to do so is given in Annex 3; fRough estimates Occupational limit values It is noted that the HBROEL of the Dutch Expert Committee on Occupational Standards (DECOS) amounts to 1 mg F -/m3 (Dutch Expert Committee for Occupational Standards 1989). This value is based on direct effects on the respiratory tract observed in human volunteer studies of Largent as reported by the WHO (1984), in which 'the probable NOAEL' is 2.1 mg HF/m3. Irritation occurs at 4.2 mg HF/m3. By using a 'safety factor' of 2-4 the proposed health-based recommended occupational exposure limit is 1 mg F/m3 t.w.a - 15 min'. The Scientific Expert Group on Occupational Exposure Limits (1993) states that 'the no adverse effect level of 2.5 mg F -/m3 could be a suitable limit to prevent any kind of acute response of the body to HF. The starting point for this level has not been clearly described, but it is assumed that the same human volunteer studies of Largent were taken as starting point. This level would also

EU RISK ASSESSMENT – HYDROGEN FLUORIDE FINAL REPORT, OCTOBER 2001
96
prevent the effects on skeleton, the biological critical system, i.e. osteosclerosis, according to the most relevant data. An OEL should be set at 2.5 mg F-/m3 (STEL with skin notation). In the UK a short-term occupational exposure standard (OES) of 3 ppm (as F) is established as a 10-minute time-weighted average (HSE 1993). Irritation is considered as critical effect with a human no-effect-level of 3 ppm. The study on which this NOAEL relies is not mentioned. An 8-hour OES was considered unnecessary. 4.1.3.3 Consumers Information obtained from the Anti-poison centre in Belgium shows that a significant number of accidents have occurred through the use of rust cleaning and stone and wood cleaning agents, available to consumers. In the majority of cases symptoms concerned burned lesions of the hands. In all cases medical care was needed. An overview of the information collected by the Anti-poison centre is given in Annex 4. Because of the strong corrosive properties of the substance and because of the fact that incidental dermal exposure of consumers through the use of the above mentioned products cannot be excluded it is concluded that risk reduction measures are needed (conclusion iii). 4.1.3.4 Man exposed indirectly via the environment Inhalation exposure Repeated dose toxicity For the risk characterisation the ambient background F concentration in air has been added to the PEC values of Table 4.3. For the ambient background F concentration a value of 0.07 �g/m3 is chosen (see paragraph 3.1.1.2). In Tables 4.16 and 4.17 all local estimates of HF air concentrations measured as well as calculated, respectively are compared with the NOAEL (DCV) of 128 �g/m3 from the 90 day rats study (see 4.2.1.6 and 4.1.3.0). At this dose no irritation or systemic effects were observed. A marginal effect level for irritation in humans was established at 1.16 mg/m3. Table 4.16 Margin of Safety (from measured data)
Plant Air concentrationa �g/m3
Margin of Safety
NL 0.1 1
1280 128
D I 1.3 98
D II 2.4 53
UK I 0.06 0.23
2133 557
EU 0.05-0.06 2560-2133
a For specific data see section 3.1.5.3

CHAPTER 4. HUMAN HEALTH
97
It is known that in healthy workers exposed to fluoride in air at a concentration of 114.2 �g/m3 no fluorosis occurs after 10 years of exposure (Chan-Yeung et al. 1983). Because this NOAEL is approx. equal to the NOAEL (DCV) in the 90-day rat study a MOS of 100 is considered sufficient. The margin of safety (measured data) for 2 plants in Germany indicate a concern for human safety following inhalatory exposure to HF, indirectly via the environment. These rather old (<1994) measured data, however, are assumed to be replaced by more recent emission figures that are used in the calculated PECs . The margin of safety (calculated data) for end-user plant b indicate a concern for human safety following inhalatory HF exposure, indirectly via the environment conclusion iii). As stated in section 3.3.3 plant b has indicated that a) their fluoride emissions originate from unintentional HF formation (by-product) during the production of several organofluor compounds and b) they have taken release reduction measures which are expected to lead to substantial emission reduction. For all other plants and end-users the MOSs indicates no concern conclusion ii).
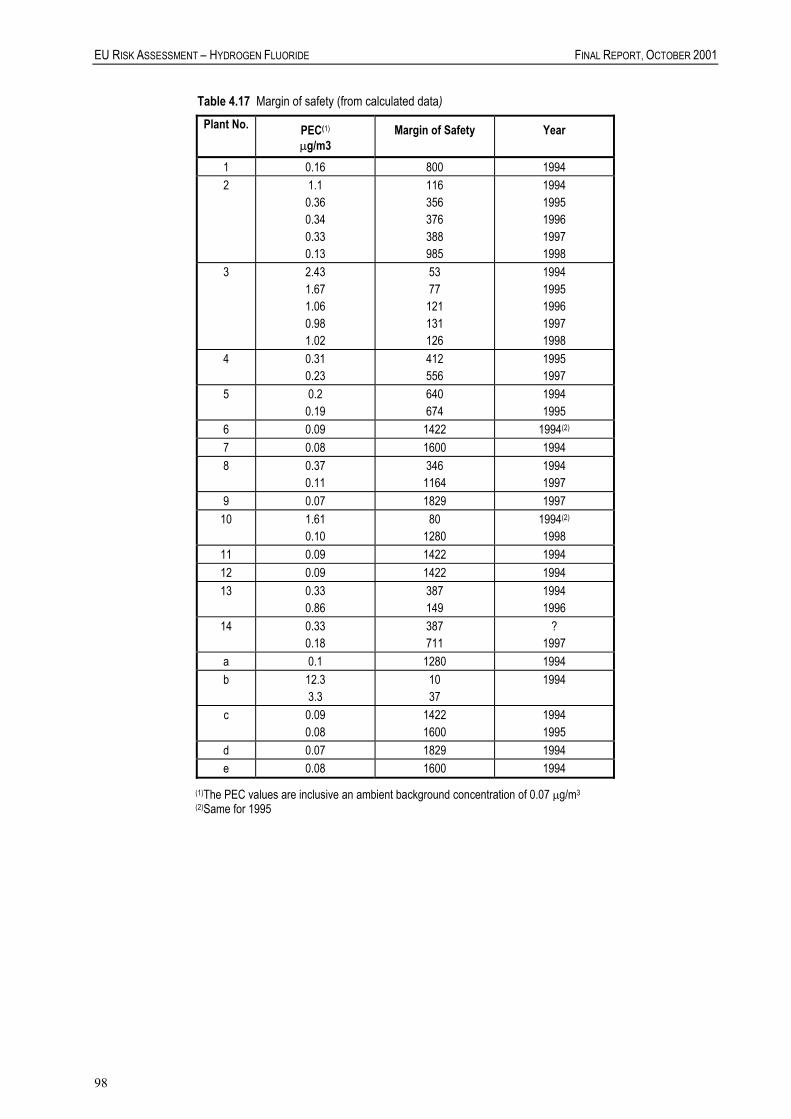
EU RISK ASSESSMENT – HYDROGEN FLUORIDE FINAL REPORT, OCTOBER 2001
98
Table 4.17 Margin of safety (from calculated data) Plant No. PEC(1)
�g/m3 Margin of Safety Year
1 0.16 800 1994 2 1.1
0.36 0.34 0.33 0.13
116 356 376 388 985
1994 1995 1996 1997 1998
3 2.43 1.67 1.06 0.98 1.02
53 77 121 131 126
1994 1995 1996 1997 1998
4 0.31 0.23
412 556
1995 1997
5 0.2 0.19
640 674
1994 1995
6 0.09 1422 1994(2) 7 0.08 1600 1994 8 0.37
0.11 346 1164
1994 1997
9 0.07 1829 1997 10 1.61
0.10 80
1280 1994(2)
1998 11 0.09 1422 1994 12 0.09 1422 1994 13 0.33
0.86 387 149
1994 1996
14 0.33 0.18
387 711
? 1997
a 0.1 1280 1994 b 12.3
3.3 10 37
1994
c 0.09 0.08
1422 1600
1994 1995
d 0.07 1829 1994 e 0.08 1600 1994
(1)The PEC values are inclusive an ambient background concentration of 0.07 �g/m3 (2)Same for 1995

CHAPTER 4. HUMAN HEALTH
99
Reproductive toxicity The local estimates for HF air concentrations measured as well as calculated to be used as starting point for the risk characterisation are listed in Tables 4.2 and 4.3. There are no studies available on reproductive toxicity with HF. Therefore, the oral studies with NaF are used. It is concluded that HF is of no concern with respect to developmental effects, since fluoride causes effects on the progeny only at maternally toxic doses (conclusion ii). In the 2-generation study of US-FDA with rats, at the highest dose level tested (about 10 mg F-
/kg b.w./d) no effects on fertility were observed. By route to route extrapolation assuming complete oral and inhalatory absorption an inhalatory equivalent NOAEL of 35 mg/m3 can be calculated for a continuously exposed person of 70 kg and a daily respiratory volume of 20 m3. When comparing this inhalatory equivalent NOAEL with the measured and calculated local HF concentrations (see Table 4.16 and 4.17) all margins of safety are >>2800. Hence, it is concluded that this risk estimation indicates no additional risk for fertility effects (conclusion ii). Intake via all media In section 4.1.3.3.1 it is concluded that HF contribution to the total daily fluoride intake is considered negligible. Therefore no risk characterisation has been performed for humans after exposure to total fluoride. 4.1.3.5 Combined exposure Since nearly all scenarios described in the previous sections caused concern for the environment/workers/public at large as discussed. It seems not useful to characterise the risk more specifically after combined exposure. 4.2 HUMAN HEALTH (PHYSICO-CHEMICAL PROPERTIES) HF is not flammable and not explosive. Oxidising properties are not expected in the sense of reaction with oxygen. It is noted that hydrofluoric acid dilutions in water of 65% and lower react with metals (e.g. iron from steel drums or from reactors) under the formation of H2. Dilution of concentrated HF with water may cause violent behaviour because of high dilution heat. There are no R- and S-sentences appropriate for these properties. Conclusion iii) is reached, because the general warnings on (1) the formation of H2 by reaction of HF solutions of less than 65% with metals, and (2) on the violent behaviour upon dilution of concentrated HF with water, should be included in all MSDSs.

100
5 RESULTS Environment ( ) There is need for further information and/or testing ( ) There is at present no need for further information and/or testing or for risk reduction
measures beyond those which are being applied (X) There is a need for limiting the risks: risk reduction measures which are already being
applied shall be taken into account Conclusion iii) is reached because: - for a number of HF producing and HF using sites the local environmental risk
characterisation points to risks for either 1) the aquatic compartment, or 2) the atmospheric compartment or 3) livestock and wildlife exposed via air.
Man indirectly exposed via the environment ( ) There is need for further information and/or testing ( ) There is at present no need for further information and/or testing or for risk reduction
measures beyond those which are being applied (X) There is a need for limiting the risks: risk reduction measures which are already being
applied shall be taken into account Conclusion iii) is reached because: - for one HF using site the local environmental risk characterisation indicates a significant risk
for humans indirectly inhalatory exposed via the environment Consumers ( ) There is need for further information and/or testing ( ) There is at present no need for further information and/or testing or for risk reduction
measures beyond those which are being applied (X) There is a need for limiting the risks: risk reduction measures which are already being
applied shall be taken into account Conclusion iii) is reached because of concerns for skin irritation and/or corrosivity, depending on concentration, as a consequence of single exposure to the hydrogen fluoride liquid arising from the use of HF containing rust cleaning and stone and wood cleaning agents. Workers ( ) There is need for further information and/or testing ( ) There is at present no need for further information and/or testing or for risk reduction
measures beyond those which are being applied (X) There is a need for limiting the risks: risk reduction measures which are already being
applied shall be taken into account

CHAPTER 5. RESULTS
101
Conclusion iii) is reached because: - the general warnings on (1) the formation of H2 by reaction of HF solutions of less than 65%
with metals, and (2) on the violent behaviour upon dilution of concentrated HF with water, should be included in all MSDSs.
- concerns for skin and respiratory tract irritation and/or corrosivity, depending on
concentration, as a consequence of repeated exposure to gaseous hydrogen fluoride at production and use as an intermediate in the chemical industry and use of aqueous HF-solutions.
- concerns for general systemic toxicity as a consequence of repeated inhalatory exposure
arising from the use of aqueous HF-solutions. - concerns for skin irritation and/or corrosivity, depending on concentration, as a consequence
of single exposure to the hydrogen fluoride liquid arising from the use of aqueous HF-solutions.
- concerns for respiratory tract irritation and/or corrosivity, depending on concentration, as a
consequence of single exposure to gaseous hydrogen fluoride at production and use as an intermediate in the chemical industry and at the use of aqueous HF-solutions.
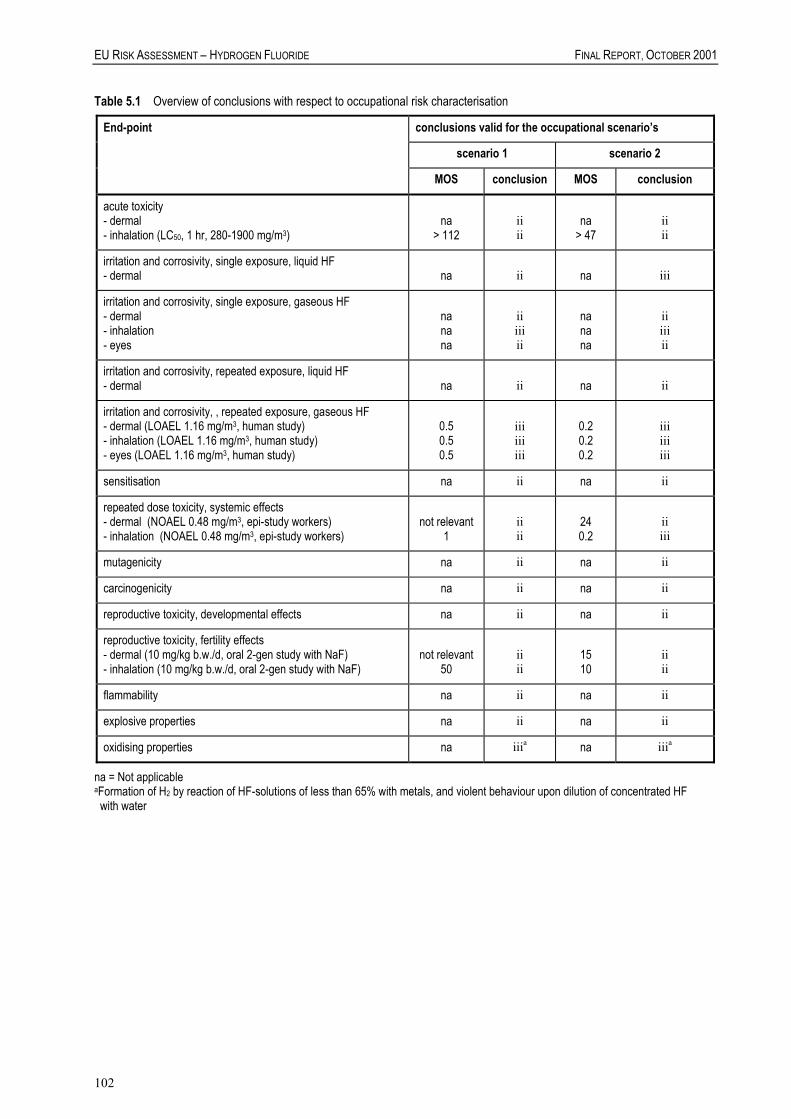
EU RISK ASSESSMENT – HYDROGEN FLUORIDE FINAL REPORT, OCTOBER 2001
102
Table 5.1 Overview of conclusions with respect to occupational risk characterisation
End-point conclusions valid for the occupational scenario’s
scenario 1 scenario 2
MOS conclusion MOS conclusion
acute toxicity - dermal - inhalation (LC50, 1 hr, 280-1900 mg/m3)
na
> 112
ii ii
na
> 47
ii ii
irritation and corrosivity, single exposure, liquid HF - dermal
na
ii
na
iii
irritation and corrosivity, single exposure, gaseous HF - dermal - inhalation - eyes
na na na
ii iii ii
na na na
ii iii ii
irritation and corrosivity, repeated exposure, liquid HF - dermal
na
ii
na
ii
irritation and corrosivity, , repeated exposure, gaseous HF - dermal (LOAEL 1.16 mg/m3, human study) - inhalation (LOAEL 1.16 mg/m3, human study) - eyes (LOAEL 1.16 mg/m3, human study)
0.5 0.5 0.5
iii iii iii
0.2 0.2 0.2
iii iii iii
sensitisation na ii na ii
repeated dose toxicity, systemic effects - dermal (NOAEL 0.48 mg/m3, epi-study workers) - inhalation (NOAEL 0.48 mg/m3, epi-study workers)
not relevant
1
ii ii
24 0.2
ii iii
mutagenicity na ii na ii
carcinogenicity na ii na ii
reproductive toxicity, developmental effects na ii na ii
reproductive toxicity, fertility effects - dermal (10 mg/kg b.w./d, oral 2-gen study with NaF) - inhalation (10 mg/kg b.w./d, oral 2-gen study with NaF)
not relevant
50
ii ii
15 10
ii ii
flammability na ii na ii
explosive properties na ii na ii
oxidising properties na iiia na iiia
na = Not applicable aFormation of H2 by reaction of HF-solutions of less than 65% with metals, and violent behaviour upon dilution of concentrated HF with water

103
6 REFERENCES Aardema, MJ et al. (1989). Environ. Mol. Mutagen.;14, suppl. 15: 3. Aardema, MJ et al. (1989). Mutat. Res. 1989; 223: 191-203. ACGIH (1984). Documentation of the threshold limit values, Cincinatti, Ohio, American Conference ofGovermental industrial Hygienists, 1984. Additional information of industry. Protective clothing standards for handling hydrofluoric acid, Examples. Letterof 10 March 1997. Agency for Toxic substances and Disease Registry (ATSDR) (1993). Toxicological profile for fluorides, hydrogenfluoride and fluorine (F). ATSDR/TP-91/17 U.S Department of Health and Human services. Public Health Service.Atlanta, GA, USA. Allied Signal (1993). Material Safety Data Sheet, HFBF-0001, 7/93 Anonymus (1996). Hydrofluoric acid (HF) Chemistry and Pharmacokinetic modelling. Chemical ManufacturersAssociation, HF panel, HAPS subgroup. Araibi AA et al. (1989). J. Biol. Sci. Res.; 20: 19-29. Aulerich, RJ, Napolitano, Bursion SJ, Olson BA, Hochstein JR (1987). Chronic toxicity of dietary fluorine to mink.J. Anim. Sci.; 65: 1759-1767. Barnard WR, Nordstrom DK (1982). Fluoride in precipitation -II. Implications for the geochemical cycling offluorine. Atmosph. Environ. 1982; 16(1): 105-111. Bayer (1992). AIDA 27/08/92 Bayer (1994). Hydrogenfluoride HF (CAS-No. 7664-39-3). Data according to EEC 793/93 for the preparation of arisk assessment. Bayer AG (Leverkusen). Bayer AG (1987). Data, Report Nr. 16300, December 14, 1987. Bayer AG (1987). Untersuchungen Bayer AG, 09-06-87. Bayer AG (1990). data Report Nr 19717. November 16, 1990. Beyer WN, Fleming WJ, Swineford D (1987). Changes in litter near an aluminium reduction plant. J. Environ.Qual. 1987; 16(3): 246-250. Biological effects of atmospheric pollutants, fluorides. National Academy of Sciences, Washington D.C. 1971; 66-67 Bos PMJ, Zwart A, Reuzel PGJ, Bragt PC (1992). Evaluation of the sensory irritation test for the assessment ofoccupational health risk, Crit. Rev. Toxicol. 1992; 21: 423-450 Bracken WM et al. (1985). J. Occup. Med. 1985; 27: 733-739 (from BAYER, AIDA, 27/08/92). Bragt PC (1995). Letter d.d. 20-12-1995 ref. BR/HA/U-95/26112. Subject: Waterstoffluoride inconsumentenprodukten. Braun J, Stob H, Zober A (1984). Intoxication following the inhalation of hydrogen fluoride. Arch. Toxicol. 1984;56: 50-54. (Abstract) Breimer RF et al. (1989). Fluorine contamination of soils and earthworms near a site of long-term industrialemission in southern Germany. Biol. Fertil. Soils 7. 1989; 297-302 .

EU RISK ASSESSMENT – HYDROGEN FLUORIDE FINAL REPORT, OCTOBER 2001
104
Breimer RF et al. (1989). Fluorine contamination of soils and earthworms near a site of long term industrialemission in southern Germany. Biol. Fertil. Soils 7. 1989; 297-302.
Bringman G, Kühn R (1959). Gesundheits Ing. 1959; 80(2): 115-120.
Bringmann G, Kühn R (1977). Z.Wasser- u. Abwasserforschung. 1977; 10(3/4): 87-98.
Bringmann G, Kühn R (1959). Ges. Ing. 1959; 80(4): 115-120.
Bringmann G, Kühn R (1977). Z.Wasser- u. Abwasserforschung. 1977; 10(3/4): 87-98.
Bringmann G, Kühn R (1981). Gwf-wasser/abwasser. 1981; 122(7): 506-513.
Brown MG (1985). Fluoride exposure from hydrofluoric acid in a motor gasoline alkylation unit. Am. Ind. Hyg.Assoc. J. 1985; 46: 662-669.
Burke WJ et al. (1973). Systemic Fluoride Poisining from a Fluoride Skin Burn, J. Occup. Med. 1973; 15: 39-41.
Burns FR, Paterson CA (1989). Prompt irrigation of chemical eye injuries may avert severe damage. Occup. HealthSafety 1989; 58: 3-36. (Abstract)
Burr GA, Baron S, Tubbs RL, Habes DJ (1990). Health Hazard Evaluation Report, Eagle Convex Glass Company,Clarksburg, West Virginia. NIOSH (Cincinnati, Ohio). Report No. HETA-89-137-2005. (Abstract)
Camargo JA, Tarazona JV (1990). Acute toxity to freshwater benthic macroinvertebrates of fluoride ion in softwater. Bull. Environ. Contam. Toxicol. 1990; 45: 883-887.
Camargo JA, Tarazona JV (1991). Fluoride. 1991; 24(2): 76-83.
Canadian Environmental Protection Act (1993). Inorganic Fluorides, Priority Substances List Assessment Report,Government of Canada, Environment Canada, Health Canada.
Chaisemartin C. Aspect of bioaccumulation phenomenous and of fluoride transferring in disturbed softly waters. (infrench) Revue Française des Sciences de l’Eau 4; 17-33.
Chan KM, Svancarek WP, Creer M (1987). Fatality due to acute hydrofluoric acid exposure. J. Toxicol. - ClinicalToxicol. 1987; 25: 333-339. (Abstract)
Chan-Yeung M et al. (1983). Epidemiologic health study of workers in an aluminium smelter in Kitimat, B.C. IIeffects on musculoskeletal and other systems. Arch. Environ. Hlth.; 38: 34-40.
Chang-Yeung M, Wong R, MacLean L, Tan F, Schultzer M, Enarson D, Martin A, Dennis R, Grzybowski S (1983).Epidemiologic Health Study of workers in an aluminium smelter in British Columbia, effects on the respiratorysystems. Am. Rev. Respir. Dis.; 127: 465-469.
Chinoy NJ, Pradeep PK, Sequeira E (1992). Effect of fluoride ingestion on the physiology of reproductive organs ofmale rat. J. Environ. Biol. 13; 1: 55-61.
Chinoy NJ, Sequeira E (1989). Reprod. Toxicol.; 3: 261-67.
Chinoy NJ, Sequeira E (1992). Fluoride; 25: 71-76.
Chinoy NJ, Sequeira E, Narayana MV (1991). Effects of vitamin C and calcium on the reversibility of fluoride-induced alterations in spermatozoa of rabbits. Fluoride; 24: 29-39.
Collins TFX, Sprando RL, Shackleford ME, Black TN, Ames MJ, Welsh JJ, Balmer MF, Olejnik N, Ruggles(1995). Developmental toxicity of sodium fluoride in rats. Fd. Chem. Toxic.; 33: 951-960.
Collins TFX, Sprando RL, Black TN, Shackleford ME, Bryant MA, Olejnik N, Ames MJ, Rorie JI, Ruggles (2001a).Multigenerational evaluation of sodium fluoride in rats. Fd. Chem. Toxic.; 39: 601-613.

CHAPTER 6. REFERENCES
105
Collins TFX, Sprando RL, Black TN, Shackleford ME, Bryant MA, Olejnik N, Ames MJ, Rorie JI, Ruggles(2001b). Developmental toxicity of sodium fluoride measured during multiple generations. Fd. Chem. Toxic.; 39:867-876. CTEF (1995). Hydrogen fluoride. Risk assessment document existing substances. EU Regulation 793/93 and1179/94. Draft. Environmental Working Group of the Comité Technique Européeen du Fluor (CTEF). Darmer KI, Haun CC, MacEwan JD (1972). The acute inhalation toxicity of chlorine pentafluoride. Am. Ind. Hyg.Assoc. J.1972; 33: 661-668 (as cited by M. Meldrum (1993) Toxicology of substances in relation to major hazards.Hydrogen fluoride. Health and Safety Executiv, HMSO, London UK). Derelanko MJ et al. (1985). Acute dermal toxicity of dilute hydrofluoric acid, J. Toxicol. Cut. & Ocular Toxicol.1985; 4(2): 73-85. Derivados del Fluor SA, HEDSET (1994). Data from HEDSET. Deveto FCH et al. (1972). Archs and Biol.; 17: 371-374. Dinman BD et al. (1976). Absorption and excretion of fluoride immediately after exposure. Part I, J. Occup. Med.1976; 18: 7-13. Dreisbach RH (1971). Handbook of Poisining: Diagnosis and Treatment, Los Altos, California, Lange MedicalPublications 1971; 517. Dutch Expert Committee for Occupational Standards (1989). Health-based recommended occupational exposurelimits for fluorine, hydrogenfluoride and inorganic fluoride compounds, Directorate-General of Labour of theMinistry of Social Affairs and Employment, RA 1/89 Echt A, Bresler FT, Hughes RT, Hayden CS (1993). Health Hazard Evaluation Report, Xomox Corporation, BlueAsh, Ohio. NIOSH (Cincinnati, Ohio). Report No. HETA-91-326-2278. (Abstract) El-Saadi MS, Hall AH, Hall PK, Riggs BS, Augenstein WL, Rumack BH (1989). Hydrofluoric acid dermalexposure. Veterin. Human. Toxicol. 1989; 31: 243-247. (Abstract) Environnement Canada Environmental Protection Service. Hydrogen Fluoride and Hydrofluoric Acid,Environmental and technical Information for problem spills. Technical Services Branch, Ottawa, Ontario, July 1984 Environmental Working Group of the Comité Technique Européen de Fluor (CTEF) (1996). Personalcommunication at the meeting of RIVM-TNO-CTEF, January 9, 1996 EPA (1993). Hydrogen Fluoride Study. Report to Congress. Section 112(n)(6) Clean Air Act As Amended. FinalReport. U.S. Environmental Protection Agency, Chemical Emergency Preparedness and Prevention Office. EPA-550-R-93-001. Finnish Registry (1995). Data from the Finnish Exposure Registry. Finnish Institute of Occupational Health. Freni SC (1994). Exposure to high flouride concentrations in drinking water is associated with decreased birth rates.J. Toxicol. Environ. Health; 42: 109-121. Gerdes RA (1970). Dros Info Service 1970; 45: 131 (from BAYER, AIDA, 27/08/92). Gerdes RA, Smith JD, Applegate HG (1971). The effects of atmospheric hydrogen fluoride upon Drosophilamelanogaster- II Fecundity, hatchability and fertility. Atmosph. Environ.; 5: 117-122. Gerdes RA. (1971). Fluoride. 1971; 4: 25-29 (from BAYER, AIDA, 27/08/92). Gezondheidsraad (1990). Fluoriden. Toetsing van een basisdocument. No. 1990/10, Den Haag 1990 . Gezondheidsraad. Fluorides. Assessment of an Integrated Criteria Document. The Netherlands.

EU RISK ASSESSMENT – HYDROGEN FLUORIDE FINAL REPORT, OCTOBER 2001
106
Greendyke RM, Hodge HC (1964). Accidental Death Due to Hydrofluoric Acid, Journal of Forensic Sciences 1964;9(3): 383-390. Gunther BJ, Thoburn TW (1982). Health Hazard Evaluation Report, Phillips Petroleum Company Refinery, WoodsCross, Utah. NIOSH (Cincinnati, Ohio). Report No. HHE-80-202-1092. (Abstract) Hamilton MA, Russo RC, Thurston RV (1977). Trimmed Spearmann-Karber method for estimating medium-lethalconcentrations in toxicity bioassays. Environ Sci. Technol. 1977; 11(7): 714-719. Correction 1978; 12(4): 417. Hansch AL, Elkins D (1971). Chem. Rev. 1971; 71: 525. HEDSET (1994). Data from HEDSET Heindel JJ, Bates HK, Price CJ, Marr MC, Myers CB, Schwetz BA (1996). Developmental toxicity evaluation ofsodium fluoride administered to rats and rabbits in drinking water. Fund. Appl. Toxicol.; 30: 162-177. Hemens J , Warwick RJ (1972). The effects of fluorides on estuarine organisms. Water Research 6. 1972; 1301-1308. Hemens J, Warwick RJ (1972). The effect of fluorides on estuarine organisms, Water Research 1972; 6: 1300-1308. Hemens J, Warwick RJ (1972). Water Res. 6. 1972; 1301 . Hery M, Diebold F, Hubert G, Oury V, Limasset JC (1990). Manufacture of phosphoric acid and phosphate andphosphate-containing fertilisers. Occupational exposure to fluorine compounds and inorganic acids. Cahiers denotes documentaires - Securité et hygiene du travails; 4th Quarter 1990, Note Mo. 1803-141-90; 809-816. (Abstract) Hodge HC, Smith FA (1970). Air quality criteria for the effects of fluorides on man. J. Air Pollution Control Assoc.1970; 20: 226-232. Horvath C (1989). Toratology; 40: 285. HSE (1993). Occupational Exposure Limits, Criteria Document Summaries, HSE. Huizinga K et al. (1995). Grofkeramische industrie, Samenwerkingsproject Procesbeschrijvingen IndustrieNederland (SPIN). Humiczewska M et al. (1989). Folia Biol. 1989; 37: 181-186 (from BAYER, AIDA, 27/08/92). IARC (1982). IARC Monographs on the evaluation of the carcinogenic risk of chemicals to humans. Some aromaticamines, anthraquinones and nitroscompounds, and inorganic fluorides used in drinking-water and dentalpreparations. IARC, Lyon, Volume 27. IARC (1992). IARC Monographs on the evaluation of the carcinogenic risk of chemicals to humans. Occupationalexposures to mists and vapours from strong inorganic acids; and other industrial chemicals. IARC, Lyon, Volume 54. ICI (1990). Unpublished Report: CTL/L/3266, August 1990. ICI, HEDSET (1994). Data from HEDSET. INRS (1988). Valeurs limites d’exposition professionelle aux substances dangereuses en France, Cah. Notes Doc.1988; 133: 691-706. INRS (1992). Valeurs limites d’exposition professionelle aux substances dangereuses de l’ACGIH et del’Allemagne, Cah. Notes Doc. 1992; 147: 195-225. INRS (1995). Data from the exposure register of the Institut National de Recherche et de Sécurité (VandoeuvreCedex). Irving Sax, N (1984). Dangerous Properties of Industrial Materials, 1984, 6th Ed.

CHAPTER 6. REFERENCES
107
Jackson R, Kelly S, Noblitt T et al. (1994). The effect of fluoride therapy on blood chemistry parameters inosteoporotic females. Bone Miner.; 27: 13-23. Jankovic J, Jones W, Burkhart J, Noonan G (1991). Environmental study of firefighters. Ann. Occup. Hyg. 1991;35: 581-602. Janssen PJ et al. (1989). Integrated Criteria document fluorides. Appendix to report 758474010, RIVM, theNetherlands. Janssen PJCM, Knaap AGAC (1994). Fluoride: re-appraisel of the oral toxicity. Document prepared by RIVM forthe EU scientific committee on Food. RIVM, Bilthoven. Juhnke I, Ludemann DZ (1978). Wasser-u. Abwasserforschung. 1978; 11(5): 161-164. Kemi (1995). Use of EU first priority Existing Substances identified in the Swedish Product Registry. CAS No.7664-39-3 Hydrofluoric acid. KEMI (1997). Additional exposure informations, 14 October 1997. . Khalil AM (1995). Chromosome aberrations in cultured rat bone marrow cells treated with inorganic fluorides.Mutat. Res.; 343: 67-74. Kirk-Othmer Encyclopedia of Chemical Technology, 3rd ed., 10 (1980) Klauder JV et al. (1955). Industrial uses of compounds of fluorine and oxalic acid: Cutaneous Reaction and Calciumtherapy, Arch. Ind. Health 1955; 12: 412-419. Kleinfeld M (1965). Acute Pulmonary Edema of Chemical Origin, Arch. Environ. health 1965; 10: 942-946. Kono K et al. (1982). Bull. Osaka Med. School 1982; 28: 124-133 Kono K et al. (1988). Proc. ICMR Semin. 1988; 8: 381-388 (from BAYER, AIDA, 27/08/92). Kono K, Yoshida Y, Watanabe M, Tanioka Y, Orita Y, Dote T, Bessho Y, Takahashi Y, Yoshida J, Sumi Y (c)(1992). Serum fluoride as an indicator of occupational hydrofluoric acid exposure. Int. Arch. Occup. Environ.Health. 1992; 64: 343-346. Kono K, Yoshida Y, Watanabe M, Watanabe H, Inoue S, Murao M, Doi K (b) (1990). Elemental analysis of hairamong hydrofluoric acid exposed workers. Int. Arch. Occup. Environ. Health . 1990; 62: 85-88. Kono K, Yoshida Y, Yamagata H, Watanabe M, Shibuya Y, Doi K (a) (1987). Urinary fluoride monitoring ofindustrial hydrofluoric acid exposure. Environ. Res. 1987; 42: 415-420. Krasowska A, Wlostowski T (1992). The effect of high fluoride intake on tisue trace elements and histology oftesticular tubules in the rat. Comp. Biochem. Physiol.; 103C: 31-34. Krasowska A, Wlostowski T (1996). Photoperiodic elevation of testicular zinc protects seminiferous tubules againstfluoride toxicity in the bank vole (Clethrionomys glareolu). Comp. Biochem. Physiol.; 113C: 81-84. Kühn R et al. (1988). Schadstoffwirkungen von Umweltchemikalien im Daphnien-Reproduktions-Test als Grundlage für die Bewertung der Umweltgefaehrlichkeit in aquatischen Systemen. Im Auftrag desUmweltbundesambtes.
LaDou J (1991). Semiconductor industries. Toxicol. Industrial Health 1991; 7: 59-62. (Abstract) Larez A et al. (1980). Toxicol. Aspects Int. Cong. Eur. Assoc. Poison Control; 528-540.
Largent EJ (1960). The metabolism of Fluorides in Man, Arch. Ind. Health 1960; 21: 318-323. Largent EJ. Ingestion, inhalation, excretion and storage of fluoride by man. In: Largent EJ: Fluorosis: The HealthAspects of Fluorine Compounds; pp. 22-140. Ohio State Univ. Press, Columbus, 1961.

EU RISK ASSESSMENT – HYDROGEN FLUORIDE FINAL REPORT, OCTOBER 2001
108
LeBlanc GA (1984). Interspecies relationships in acute toxicity of chemicals to aquatic organisms. Environ.Toxicol. Chem. 3. 1984; 47-60. Lee DC, Wiley JF, Snyder JW (1993). Treatment of inhalational exposure to hydrofluoric acid with nebulizedcalcium gluconate. J. Occup. Med. 1993; 35: 470. Li Y, Dunipace AJ, Stookey GK (1988). Genotoxic effects of fluoride: a controversial isue. Mutat. Res. 1988; 195:127-136. Lorenc-Pulcinka G (1980). Influence of hydrogen fluoride on the rate of carbon dioxide exchange in Scotch pines ofdiffere susceptibility to this gas, Arbor. Kornickie 1980; 25: 269-276. Luijk R, Van Broekhuizen P, Spruyt R, Van der Haar R, Van der Torren M (1989). De grote schoonmaak.Chemiewinkel Universiteit van Amsterdam (Amsterdam). Lund K, Ekstrand J, Boe J, Sostrand P, Kongerud J (1997). Exposure to hydrogen fluoride: an experimental study inhumans of concentrations of fluoride in plasme, symptoms, and lung function. Occup. Environ. med.; 54: 32-37. MacEwan JD, Vernot EH (1976). Toxic Hazards Research Annual Report. AMRL report No AD-AO31-860 (bothas cited by M. Meldrum (1993) Toxicology of substances in relation to major hazards. Hydrogen fluoride. Healthand Safety Executive, HMSO, London, UK). Machle W et al. (1934). The effects of the inhalation of hydrogen fluoride. I. The responce following exposure tohigh concentrations, J. Ind. Hyg. 1934; 16: 129-145. Madkour S et al. (1987). Effects on HF on the incorporation and transport of photoassimilates in soybean. Environ.Toxicol. & Chem. 1987; 6: 627-634. (from SOLVAY, 1994). Mahdevan TN, Meenakshy V, Mishira UC (1986). Fluoride cycling in nature through precipitation. Atmosph.Environ. 1986; 20(9): 1745-1749. Markel HL, Slovin DL (1982). Health Hazard Evaluation Report, Gulf Oil Corporation, Belle Chasse, Louisiana.NIOSH (Cincinnati, Ohio). Report No. HETA-81-031-1209. (Abstract) Marquart J (1990). Inventarisatie reinigingswerkzaamheden. (Inventory of cleaning work) MBL-TNO (Rijswijk),MBL 1990-12. Maurer JK, Cheng MC, Boysen BG, Anderson RL (1990). Two-year carcinogenicity study of sodium fluoride inrats. J. Nat. Cancer Inst. 82; 13: 1118-1126. Maurer JK, Cheng MC, Boysen BG, Strandberg JD, Weisbrode SE, Seymour JL, Anderson RL (1993). Confoudedcarcinogenicity study of sodium fluoride in CD-1 mice. Reg. Toxicol. Pharmacol. ;18: 154-168 Mc Lean DC, Schneider RE (1981). Effect on gaseous hydrogen fluoride on the yield of field-grown wheat.Environ. Pollut. Ser. A. Ecol. Biol. 1981; 24(1), 39-44. McCulley JP et al. (1983). J. Occup. Med. 1983; 25: 447-450. Messer HH et al. (1973). Influence of fluoride intake on reproduction in mice. J. Nutrition; 103: 1319-1326. Miszke A, Sanokowska E, Winiarski J, Chromiak E (1984). Nasal septum and mucosa in fluorosis. Fluoride. 1984;17: 114-118. Moeschlin S. (1980) Klinik and Therapie der Vergiftungen, Georg Thieme Verlag, Stuttgart, New York. Mohamed AH (1971). Proc. Int. Clean Air Cong. 2nd 1971; 158-161 (from BAYER, AIDA, 27/08/92). Morris JB (1979). The absorption, distribution and excretion in inhaled hydrogen fluoride in rats thesis, Universityof Rochester, New York (from SOLVAY, 1994).

CHAPTER 6. REFERENCES
109
Morris JB, Smith FA. (1982). Regional deposition and absorption of inhaled hydrogen fluoride in the rat, Toxicol.Appl. Pharmacol. 1982; 62: 81-89. National Academy of Sciences (1972). A report of the committee on water quality criterian. Environmental StudyBoard, National Academy of Sciences, Washington D.C., Water quality Criteria, 1972. NTIS (1993). Toxicological Profile for fluorides, hydrogen fluoride and fluorine. ATSDR PB93-182566, NTIS 1993. NTP (1990). Technical report 393. (from BAYER, AIDA, 27/08/92). Pack MR (1972). Response of strawberry fruiting to hydrogen fluoride fumigation, j. Air Pollut. Contr. Ass. 1972;22(9): 715-717. Pillai KS et al. (1989). Fluoride; 22: 165-168. Placke M, Griffin S (1991). Subchronic inhalation exposure study of hydrogen fluoride in rats. Batelle, MA-295C -85-10. Placke ME, Brooker M, Persing R, Taylor J, Hagerty M (1990). Repeated-exposure inhalation study of hydrogenfluoride in rats. Batelle, MA-195C-85-9. Research Corporation of New England (1978). Screening study on feasibility of standards of performance forhydrofluoric acid manufacture, Research Corporation of New England, for Environmental Protection Agency,Research Triangle Park, North Carolina 1978. Riedel de Haën, HEDSET (1994). Data from HEDSET. Riggs BL, Hodgson SF, O'Fallon WM, Chao EYS, Wahner HW, Muhs JM, Cedel SL, Melton LJ (1990). Effect offluoride treatment on the fracture rate in postmenopausal women with osteoporosis. N. Engl. J. Med.; 322: 802-809. Rogers JE, Li SW (1985). Effects of metals and other inorganic ions on soil microbial activity: Soil dehydrogenaseassay as a simple toxicity test. Bull. Environ. Contam. Toxicol.1985; 34: 858-865. Rosenholtz MJ, Carson TR, Weeks MH, Wilinski F, Ford DF, Oberst FW (1963). A toxicopathologic study inanimals after brief single exposures to hydrogen fluoride. Ind. Hyg. J. may-june 1963; 253-261. Sadilova MS et al. (1974). Age sensitivity of the body to fluoride ions in the air, Gig. Sanit. 1974; 12: 33-36. Safety Data Sheet ELF ATOCHEM, March 1992 Schorsch F (1995). Etude du pouvoir irritant de l'acide fluorhydrique administré par inhalation chez la souris. Testd'Alarie. Institut National de L'environment Industriel et de Risques. INERIS L.E.T.E rapport 95 642. Verneuil-en-Halatte, France. Scientific Expert Group on Occupational Exposure Limits (1993). Hydrogen Fluoride, SEG/CDO/39A. Sheehy JW, Jones JH (1985). Control of workplace hazards in chromium plating and acid cleaning operations.Plating and Surface Finishing. 1985; 42-48. Slooff HC et al. (1988). Basisdocument Fluoriden RIVM. Slooff HC et al. (1988). Basisdocument Fluoriden RIVM. Smith, Gardner in: NIOSH. Criteria for a recommanded standard for occupational exposure to HF. US dept, ofHealth, Education and Welfare, March 1976 (from SOLVAY, 1994). Smith FA, Gardner DE. A Preliminary Investigation of Blood Fluoride Levels following Exposure to HydrogenFluoride at a Concentration of Approximately 29 mg/m3, University of Rochester Atomic, Energy Project ReportNr UR-77; 1-19.

EU RISK ASSESSMENT – HYDROGEN FLUORIDE FINAL REPORT, OCTOBER 2001
110
Sowers M, Wallace RB, Lemke (1986). The relationship between bone mass and fracture history to fluoride andcalcium: intake study of three communities. Am. J. Clin. Nutr.; 44: 889-898 and Sowers M, Clarck MK, Jannausch, Wallace RB (1991). A prospective study of bone mineral content and fracture incommunities with differential fluoride content. Am. J. Epidemiol.; 133: 1649-1660 (both as cited in ref. 138.) Sprando RL, Black TN, Ames MJ, Rorie JI, Collins TFX (1996). Effect of intratesticular injection of sodiumfluoride on spermatogenesis. Fd. Chem. Toxicol.; 34: 377-384. Sprando RL, Collins TFX, Black TN, Rorie J and O'Donnell M (1997). Testing the potential of sodium fluoride toaffect spermatogenesis in the rat. Fd. Chem. Toxicol., 35; 881-890. Sprando RL, Collins TFX, Black TN, Olejnik N and Rorie J (1998). Testing the potential of sodium fluoride toaffect spermatogenesis: a morphometric study. Fd. Chem. Toxicol., 36; 1117-1124. Stencel JR, Tobin JS (1987). Hydrofluoric acid burn: Latent period was key factor. Am. Ind. Hyg. Assoc. J. 1987;48: A451-A452. (Abstract) Stoop JW, Droppers AW, Rennen AJM (1994). Schadelijke stoffen voor Land- en Tuinbouw. Fluoriden. CLM,Utrecht 1994. Stuyfzand PJ (1991). Sporenelementen in grondwater in Nederland. H2O. 1991; 24(26): 756-762. Susheela AK, Kumar A (1991). J. Reprod. Fertil.; 9: 353-360. Tao S, Suttie JW (1976). J. Nutrit.; 106: 1115-1122. Temple PJ, Weinstein LH (1978). J. Air Pollut. Control Assoc. 1978; 28: 151-152. (from BAYER , AIDA,27/08/92). Theuner RC et al. (1971). J. Nutrition; 101: 525-532. Thiessen KM (1988). Summary review of health effects associated with hydrogen fluoride and related componds.U.S. Environmental Protection Agency, Report EPA/600/8-89/002F. Research Triangle Park, North Carolina, USA. Thorne BD, Hewitt PJ (1988). Chemical composition and particle morphology of brazing fume from cadmiumbrazing alloy and fluoroborate flux. Ann. Occup. Hyg. 1988; 32: 489-497. Thyssen J, Lorke D (1980). Bayer AG data, Fluorwasserstoffsaüre, 1%ig bzw. 0.1%ig. Untersuchungen auf Haut-und Schleimhautreizende Wirkung. April 21, 1980. Tsutsui T et al. (1984 A). Mutat. Res. 1984; 139: 193-198. Tsutsui T et al. (1984 B). Mutat. Res. 1984; 140: 43-48. Tsutsui T, Tanaka Y, Matsudo Y, Uehama A, Someya T, Hamaguchi F, Yamamoto H, Takahashi M (1995). Noincrease in chromosome aberrations in human diploid fibroblasts following exposure to low concentrations ofsodium fluoride for long times. Mutat. Res.; 335: 15-20. Valentine R (1990). Acute inhalation toxicity of hydrogen fluoride in rats. Haskell Laboratory Report No. 365-390,Du Pont. August 14, 1990. Van Asten P, Duursma SA, Glerum JH, Ververs FFT, Van Rijn HJM, Van Dijk A (1996). Absolute bioavailability offluoride from disodium monofluorophosphate and enteric-coated sodium fluoride tablets. Eur. J. Pharmacol; 50: 321-326. Van de Laar RTH, De Vries I, Meulenbelt J (1994). Acute arbeidsintoxicaties door gebruik van etsendeverbindingen, schoonmaakmiddelen en desinfectantia, periode jan. t/m sept. 1993. RIVM rapport nr. 348708011 d.d. november 1994, Bilthoven.

CHAPTER 6. REFERENCES
111
Van der Eerden LJ (1991). Fluoride contents in grass as related to atmospheric concentrations: a simplifiedpredictive model. Agriculture, Ecosystems and Environment; 37: 257-273. Van Gemert LJ, Nettenbreijer AH (1977). Compilation of odour threshold values in air and water. Central institutefor nutrition and food research TNO, Zeist, The Netherlands. Van Veen MP (1995). CONSEXPO A program to estimate consumer product exposure and uptake. RIVM reportno. 612810.002 National Institute on Public Health and Environmental Protection, Bilthoven The Netherland. Van Wensem J, Adema T (1991). Effects of fluoride on soil fauna mediated litter decomposition. Environ. Pollut. 1972: 239-251. VDI (1989). Verein Deutscher Ingenieure. Maximale Immisions-Konzentrationen für Fluorwasserstoff. RichtliniDusseldorf: VDI, 1989 (VDI 2310). Velvart J (1993). Toxicologie der Haushaltprodukte. Aus der Kasuistik des Schweizerischen ToxicologisInformationszentrum. Verlag Hans Huber, Berlin. Verein Deutscher Ingenieure (1987). Emissionsminderung Herstellung von Fluorwasserstoff Flußsaure und KryoVDI 2296. Vernot EH, MacEwan JD, Haun CC, Kinkead ER (1977). Acute toxicity and skin corrosin data on some organic ainorganic compounds and aqueous solutions. Toxicol. Appl. Pharmacol.1977; 42: 417-423. Villar E et al. (1989). A study of the impact of industrial fluoride emissions on a rural environment. JAPCA. 1989; 1098. Vogel J, Ottow JCG (1992). Einflusz unterschiedlicher Fluoride in sublethalen Konzentrationen auf WachstuFertilitaet und Fluorid-Akkumulation von Eisenia fetida (Oligoahaeta, Lumbricidae). Pedobiologia. 1992; 36: 121-12 Voroshilin et al. (1975). Cytology Genetics. 1975; 9: 40-42 (from BAYER, AIDA, 27/08/92). Voroshilin SI et al. (1975). Cytology Genetics. 1975; 9: 40-42 (from BAYER, AIDA, 27/08/92) VROM (1992). p.m. VROM (1994). Environmental Quality Objectives in the Netherlands. A review of environmental quality objectives atheir policy framework in the Netherlands. Ministry of Housing, Spatial Planning and the Environment, 1994. Wagner BM, Burt BA, Cantor KP et al. (1993). Health effects of ingested fluoride. National Academy ScieWashington DC, USA. Wohlslagel J, Dipasquale LC, Vernot EH (1976). Toxicity of solid rocket motor exhaust: Effects of HCl, HF, aalumina on rodents. J. Combust. Toxicol. 1976; 3: 61-70. Wallace-Durbin P (1954). The metabolism of fluorine in the rat using F18 as a tracer, J. Dent. Res. 1954; 33: 789-80 World Health Organization (WHO) (1984). Environmental Health Criteria 36: Fluorine and Fluorides, Geneva 1984. Yoshida Y et al. (1982). Percutaneous absorption of hydroluoric acid and fluorine content in organs, Sangyo Iga1982; 17(5): 281-287. Zeiger E et al. (1994). Cytogenetic studies of sodium fluoride in mice. Mutagenesis; 9: 467-471. Zeiger E, Shelby MD, Witt KL (1993). Genetic toxicity of fluoride. Environ. Mol. Mutagen. 1993; 21: 309-318. Zhang R, Zhang S (1982). Toxicology of fluorides to fishes. Huanjing Kexue 3. 1982; 1.

112
GLOSSARY
Standard term / Abbreviation
Explanation/Remarks and Alternative Abbreviation(s)
Ann. Annex
AF assessment factor
BCF bioconcentration factor
bw body weight / Bw, b.w.
°C degrees Celsius (centigrade)
CAS Chemical Abstract System
CEC Commission of the European Communities
CEN European Committee for Normalisation
CEPE European Council of the Paint, Printing Ink and Artists’ Colours Industry
d day(s)
d.wt dry weight / dw
DG Directorate General
DT50 period required for 50 percent dissipation (define method of estimation)
DT50lab period required for 50 percent dissipation under laboratory conditions (define method of estimation)
DT90 period required for 90 percent dissipation (define method of estimation)
DT90field period required for 90 percent dissipation under field conditions (define method of estimation)
EC European Communities
EC European Commission
EC50 median effective concentration
EEC European Economic Community
EINECS European Inventory of Existing Commercial Chemical Substances
EU European Union
EUSES European Union System for the Evaluation of Substances
foc Fraction of organic carbon
G gram(s)

GLOSSARY
113
PNEC(s) predicted no effect concentration(s)
PNECwater predicted no effect concentration in water
(Q)SAR quantitative structure activity relationship
STP sewage treatment plant
TGD Technical Guidance Document11
UV ultraviolet region of spectrum
UVCB Unknown or Variable composition, Complex reaction products or Biological material
v/v volume per volume ratio
w/w weight per weight ratio
w gram weight
GLP good laboratory practice
h hour(s)
ha Hectares / h
HPLC high pressure liquid chromatography
IARC International Agency for Research on Cancer
C50 median immobilisation concentration or median inhibitory concentration 1 / explained by a footnote if necessary
ISO International Standards Organisation
IUPAC International Union for Pure Applied Chemistry
kg kilogram(s)
kPa kilo Pascals
Koc organic carbon adsorption coefficient
Kow octanol-water partition coefficient
Kp Solids water partition coefficient
l litre(s)
log logarithm to the basis 10
L(E)C50 lethal concentration, median
m Meter
µg microgram(s)
mg milligram(s)
11
Commission of the European Communities, 1996. Technical Guidance Documents in Support of the Commission Directive 93/67/EEC on risk assessment for new substances and the Commission Regulation (EC) No 1488/94 on risk assessment for existing substances. Commission of the European Communities, Brussels, Belgium. ISBN 92-827-801[1234]

EU RISK ASSESSMENT – HYDROGEN FLUORIDE FINAL REPORT, OCTOBER 2001
114
MOS margins of safety
NOAEL no observed adverse effect level
NOEC no observed effect concentration
NOEL no observed effect level
OECD Organisation for Economic Co-operation and Development
OJ Official Journal
pH potential hydrogen -logarithm (to the base 10) of the hydrogen ion concentration {H+}
pKa -logarithm (to the base 10) of the acid dissociation constant
pKb -logarithm (to the base 10) of the base dissociation constant
Pa Pascal unit(s)
PEC predicted environmental concentration

115
Annex 1 The occurrence of HF in products according to the Swedish product register (KEMI, 1995) Table A1 Trades that use products containing HF and product functions
Trade Product functions
Glass and glass products Etching agents for glass Pickling agents (metals)
Office machinery and computers Etching agents for glass
Electrical machinery n.e.c. Etching agents for glass Intermediates
Wholesale of chemicals Etching agents for glass Laboratory chemicals Pickling agents (metals) Intermediates
Manufacturing for export, export Laboratory chemicals
Technical testing and analysis Laboratory chemicals
Other chemical products Metal surface treatment agents
Basic metals Metal surface treatment agents Pickling agents (metals)
Metal products Metal surface treatment agents Pickling agents (metals) Degreasing agents * High pressure cleaning agents *
Treatment and coating of metals Metal surface treatment agents Pickling agents (metals)
Radio, television, communication equipment Metal surface treatment agents Pickling agents (metals)
Transport equipment Metal surface treatment agents Pickling agents (metals) High pressure cleaning agents *
Electricity, gas and water works Pickling agents (metals)
Wholesale trade, except motorvehicles and motorcycles Pickling agents (metals)
Transport, storage and communication companies Pickling agents (metals)
Ceramic , bricks and tiles Friction agents * Degreasing agents *
Publishers and printers, recorded media Other paints and varnishes, solvent based *
Construction industry Polishing agents *
Laundries, dry cleaning Stain removers *
* There are less than three products in this product category

EU RISK ASSESSMENT – HYDROGEN FLUORIDE FINAL REPORT, OCTOBER 2001
116
An
nex
2
Mea
sure
d O
ccu
pat
ion
al e
xpos
ure
leve
ls o
f H
F m
easu
red
Tabl
e A
2
Mea
sure
d oc
cupa
tiona
l exp
osur
e le
vels
of H
F m
easu
red
Indu
strie
s an
d ta
sks
Expo
sure
leve
ls1)
(mg/
m3 )
Rem
arks
R
efer
ence
s
Fu
ll-sh
ift
Shor
t-ter
m
Man
ufac
ture
and
fillin
g15
sam
ples
< 0
.25
0.43
+ 0
.46
Unc
lear
whe
ther
per
sona
l sam
plin
g; d
urat
ion
of s
ampl
ing
not m
entio
ned
120
Man
ufac
ture
of i
norg
anic
fluo
rides
9 sa
mpl
es <
0.2
55
sam
ples
0.2
7-0.
62U
ncle
ar w
heth
er p
erso
nal s
ampl
ing;
dur
atio
n of
sam
plin
g no
t men
tione
d 12
0
Man
ufac
ture
of o
rgan
ic fl
uorid
es
9
sam
ples
< 0
.2
Unc
lear
whe
ther
per
sona
l sam
plin
g; d
urat
ion
of s
ampl
ing
not m
entio
ned
120
Man
ufac
ture
< 2
No
deta
ils
106
Man
ufac
ture
< 5
No
deta
ils
107
Alky
latio
n pl
ant
w
ell b
elow
2.5
abst
ract
onl
y; n
ot v
ery
clea
r whe
ther
con
cent
ratio
ns w
ere
actu
ally
mea
sure
d at
alky
latio
n pl
ant o
nly;
occ
asio
nal s
ympt
oms
117
Ref
iner
yon
ly o
ne s
ampl
eap
proa
ched
2.5
abst
ract
onl
y; n
ot c
lear
whe
ther
mea
sure
men
ts w
here
at a
lkyl
atio
n un
it 11
8
Oil
refin
ery
10
0-13
3 ac
cide
ntal
pea
k ex
posu
re, d
urat
ion
appr
ox. 2
min
utes
11
9
Oil
refin
ery,
alk
ylat
ion
unit,
ope
rato
rs a
ndm
aint
enan
ce w
orke
rs<
0.00
5-0.
04 o
neva
lue
of 0
.18
22 m
easu
rem
ents
of 4
to 6
hou
rs d
urat
ion;
10
mea
sure
men
ts b
elow
0.0
05m
g/m
311
6
1.9
± 3.
1Ar
ithm
etic
mea
n an
d st
anda
rd d
evia
tion,
it is
ass
umed
that
thes
e ar
e sh
ort-t
erm
resu
lts; n
= 5
212
5
Was
hing
tele
visi
on tu
bes
and
etch
ing
sem
icon
duct
ors
aver
ages
per
wor
ksho
p: 0
.2-3
.3Pr
obab
ly a
rea
sam
ples
; unc
lear
des
crip
tion;
num
ber o
f sam
ples
unk
now
n, b
ut a
tle
ast 4
0: 5
per
wor
ksho
p (8
wor
ksho
ps);
mea
sure
men
ts p
re 1
985
126-
128
Tabl
e A2
con
tinue
d ov
erle
af

ANNEX 2. MEASURED OCCUPATIONAL EXPOSURE LEVELS OF HF MEASURED
117
) R
emar
ks
Ref
eren
ces
Tabl
e A
2 c
ontin
ued
Indu
strie
s an
d ta
sks
Expo
sure
leve
ls1)
(mg/
m3
Fu
ll-sh
ift
Shor
t-ter
m
Gla
ss m
anuf
actu
ring,
etc
hing
dep
artm
ent
0.
34-3
.0ab
stra
ct o
nly,
dur
atio
n of
mea
sure
men
ts u
ncer
tain
12
9
Etch
ing
and
polis
hing
<
OEL
abst
ract
onl
y 11
8
Plat
ing
faci
lity,
aci
d ba
ths
0.14
-0.1
9
2.7
4 m
easu
rem
ents
at t
he e
dge
of a
bat
h w
ith u
nkno
wn
perc
enta
ge H
F1
mea
sure
men
t at t
he e
dge
of a
bat
h co
ntai
ning
13%
HF
123
Bric
ks, t
iles:
(sur
face
) tre
atm
ent,
clea
ning
,pr
otec
tion
0.6-
1.3
4
sam
ples
, sta
tiona
ry s
ampl
ing
130
Met
al in
dust
ry: t
reat
men
t, as
sem
bly
< 0.
04-1
6.1
9 sa
mpl
es o
f whi
ch 7
sta
tiona
ry, 4
non
-det
ecte
d in
clud
ing
both
per
sona
l sam
ples
;Th
e hi
ghes
t val
ue w
as c
lear
ly in
an
unus
ual s
ituat
ion
130
Met
al in
dust
ry: f
ound
ries
< 0.
01
22
sam
ples
of w
hich
12
stat
iona
ry
130
Ferti
liser
man
ufac
turin
g ge
nera
l *
Supe
rpho
spha
te<
OEL
's50
% >
OEL
'sO
ften
> O
EL's
No
deta
ils; a
bstra
ct o
nly
115
Phos
phat
e/fe
rtilis
er
<
1 to
> 1
0 Fi
ve p
re 1
970
stud
ies;
no
deta
ils
113
Supe
rpho
spha
te
<
1-8
One
pre
197
0 st
udy;
no
deta
ils
113
Poly
mer
fum
es in
a p
last
ic d
epar
tmen
t
0.00
3-0.
005
Area
sam
ples
; No
deta
ils o
n sa
mpl
e du
ratio
n; a
ssum
ptio
n: s
hort-
term
; abs
tract
only
114
Fire
figh
ters
< 0.
1-6.
4 sa
mpl
es o
f 22
fires
, sam
plin
g du
ratio
n ar
ound
15
min
. 11
1
Alum
iniu
m in
dust
ry
<
0.1-
3 Th
ree
pre
1970
stu
dies
; no
deta
ils
113
Mag
nesi
um fo
undr
ies
and
mel
ting
<
1 to
> 1
0 Fo
ur p
re 1
970
stud
ies;
no
deta
ils
113
Braz
ing,
sol
derin
g, w
eldi
ng<
1 O
ne p
re 1
970
stud
y; n
o de
tails
11
3
Elec
troly
sis
shop
of a
n al
umin
ium
pla
nt6-
22 ti
mes
OEL
or
STEL
Prob
ably
are
a sa
mpl
es; a
bstra
ct o
nly
135
1 Exp
osur
e le
vels
are
usu
ally
giv
en a
s le
vels
F- .
1 m
g/m
3 = 1
.25
ppm
1 pp
m =
0.8
mg/
m3

118
Annex 3 Establishment of the minimal MOSs used for the risk characterisation by the Netherlands
12
In the tables below calculations of the minimal MOS-values via assessment factors are given. The assessment factors are based on the report of Hakkert et al. (1996). Table A3 Assessment factors applied for the calculation of the minimal MOS for local effects on skin and respiratory tract due to single exposure to gaseous HF
1The inter- and intraspecies differences are assumed to be 1 for irritation effects 2Because a LOAEL instead of a NOAEL is used as starting point, a factor 2 is introduced
Table A4 Assessment factors applied for the calculation of the minimal MOSs for chronic inhalation and dermal exposure applicable on the NOAEL from the epidemiological study
Aspect Assessment factors for inhalation risk assessment
Assessment factors for dermal risk assessment
Interspecies differences 1 1 1 Intraspecies differences 1 1 1 Differences between experimental conditions and exposure pattern of the worker 2
2 2
Type of critical effect 1 1 Dose-response curve 3 1 1 Route-to-route extrapolation - 14 Confidence of the database 1 15 Overall 2 2
1A factor 1 is applied, because an occupational epidemiological study is used as starting-point 2For a conclusion on extrapolation from 10-years exposure (study) to occupational exposure during the whole work-life (40 years) it should be taken into account (a) that in general adverse effect levels will decrease with increasing exposure times, (b) that adverse effects may appear a long time after exposure has been stopped, and (c) other and more serious adverse effects may appear with increasing exposure times. A factor 2 is applied 3At the highest dose level no effects were observed. Therefore, the actual NAEL might be higher than the NOAEL used as starting point. However, based on the data available, no estimation can be made of the actual NAEL, and therefore, the default value of 1 is used 4For route-to-route extrapolation correction is made for difference between inhalation and dermal absorption. For the inhalation and dermal route of exposure both 100% absorption is taken into account 5Application of a factor higher than 1 for uncertainties inherent to route-to-route extrapolation is considered not to be necessary for the fluoride-ion. Apart from absorption differences, no significant differences are expected with respect to metabolic and kinetic aspects due to uptake via dermal and inhalation exposure 12 This annex represents the views of the Netherlands. In particular it presents the approach used by the Netherlands to determine, in a transparent way, which conclusion is to be drawn for worker risk characterisation based on the magnitude of the MOS
Aspect Assessment factors
Interspecies differences 11 Intraspecies differences 11 Differences between experimental conditions and exposure pattern of the worker
1
Type of critical effect 1 Dose-response curve 22 Confidence of the database 1 Overall 2
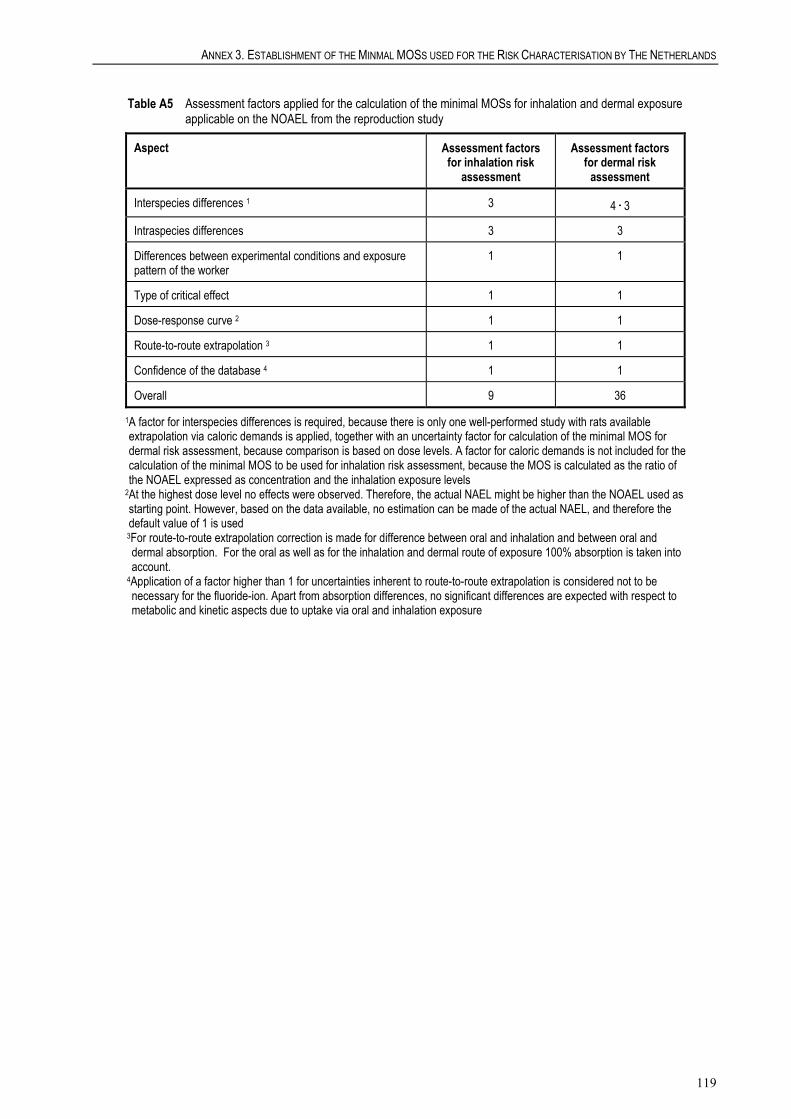
ANNEX 3. ESTABLISHMENT OF THE MINMAL MOSS USED FOR THE RISK CHARACTERISATION BY THE NETHERLANDS
119
Table A5 Assessment factors applied for the calculation of the minimal MOSs for inhalation and dermal exposure applicable on the NOAEL from the reproduction study
Aspect Assessment factors for inhalation risk
assessment
Assessment factors for dermal risk
assessment
Interspecies differences 1 3 4.3
Intraspecies differences 3 3
Differences between experimental conditions and exposure pattern of the worker
1 1
Type of critical effect 1 1
Dose-response curve 2 1 1
Route-to-route extrapolation 3 1 1
Confidence of the database 4 1 1
Overall 9 36
1A factor for interspecies differences is required, because there is only one well-performed study with rats available extrapolation via caloric demands is applied, together with an uncertainty factor for calculation of the minimal MOS for dermal risk assessment, because comparison is based on dose levels. A factor for caloric demands is not included for the calculation of the minimal MOS to be used for inhalation risk assessment, because the MOS is calculated as the ratio of the NOAEL expressed as concentration and the inhalation exposure levels 2At the highest dose level no effects were observed. Therefore, the actual NAEL might be higher than the NOAEL used as starting point. However, based on the data available, no estimation can be made of the actual NAEL, and therefore the default value of 1 is used 3For route-to-route extrapolation correction is made for difference between oral and inhalation and between oral and dermal absorption. For the oral as well as for the inhalation and dermal route of exposure 100% absorption is taken into account. 4Application of a factor higher than 1 for uncertainties inherent to route-to-route extrapolation is considered not to be necessary for the fluoride-ion. Apart from absorption differences, no significant differences are expected with respect to metabolic and kinetic aspects due to uptake via oral and inhalation exposure

120
Annex 4 Information from the Anti-poison Centre in Belgium onaccidents with HF containing products (as annexed toSZV&W, 1999)
Short overview of the telephone calls received by the Anti-poison Centre in 1998 andnecessitating at least a treatment on the basis of calcium (percutaneous or via parenteral route),communicated by Dr. M. Mostin 1.10.99 (shortened translation).
Profile of the calls
Number of calls
Total number: 40Number of victims: 41
Origin
11 calls from the public29 from the medical profession.
Circumstances of exposure
Except for one suicide attempt, all exposures were accidental: in 10 cases due to professionalexposure; in the remaining cases: domestic.
Route of exposure
Three via oral route; one contact via eye and skin; the 36 remaining via dermal route.
Age and sex of the victims
All adults. In 28 cases : male; in 11 cases: female. In two cases the sex of the victim was notregistered.
Products
In case of professional use: aqueous HF solutions or preparations for cleaning trucks, cleaningaluminium surfaces (e.g. alloy wheels), facade or verandas cleaning.
Domestic accidents were due to solutions of HF (usage not registered or precised), or tomarketed preparations e.g. rust cleaning of textiles, cleaning of aluminium surfaces, ofstoneware, wheels, greenhouses, cleaning and lightening of wood and rust remover.
The labelling of several products does not mention the presence of HF in the preparation.
Time interval
The delay between exposure and the call was recorded in 29 cases. Delay: 1h: in 12 cases. Delay>1h to 12h.: 7 cases. Delay > 12h to 24h: 9 cases. Delay >24h: 1 case.

ANNEX 4. INFORMATION FROM THE ANTI-POISON CENTRE IN BELGIUM ON ACCIDENTS WITH HF CONTAINING PRODUCTS
121
Severity of the exposure All patients developed symptoms. In the majority of the cases it concerned burning lesions of the hands. In all cases medical care was needed. In total 37 patients were hospitalised directly at the moment of their call or sent to the hospital via the physicians of the Anti-Poison Centre. Other data The progressive development of the burning lesions is a cause of delayed medical care. Solutions containing up to 75% HF are available in certain hardware stores. In 1998 no accident in children was registered but several cases of poisoning are known from the literature. Dr. M. Mostin, head of the Anti-Poison Centre concludes that the danger of those preparations justifies limiting their use to the well-informed skilled workers.


The report provides the comprehensive risk assessment of the substance Hydrogen fluoride. Ithas been prepared by the Netherlands in the frame of Council Regulation (EEC) No. 793/93 onthe evaluation and control of the risks of existing substances, following the principles forassessment of the risks to man and the environment, laid down in Commission Regulation (EC)No. 1488/94.
The evaluation considers the emissions and the resulting exposure to the environment and thehuman populations in all life cycle steps. Following the exposure assessment, theenvironmental risk characterisation for each protection goal in the aquatic, terrestrial andatmospheric compartment has been determined. For human health the scenarios foroccupational exposure, consumer exposure and humans exposed via the environment havebeen examined and the possible risks have been identified.
The human health risk assessment for Hydrogen fluoride concludes that there is at presentconcern for workers, for consumers and for humans exposed via the environment. Theenvironmental risk assessment for Hydrogen fluoride concludes that there is at presentconcern for the aquatic compartment and the atmospheric compartment at a number of HFproducing and HF using sites, while no concern for the terrestrial ecosystem and for micro-organisms in the sewage treatment plant was concluded.
The conclusions of this report will lead to risk reduction measures to be proposed by theCommissions committee on risk reduction strategies set up in support of Council Regulation(EEC) No. 793/93.
European Commission
EUR 19729 – European Union Risk Assessment Reporthydrogen fluoride, Volume 8
Editors: B.G. Hansen, S.J. Munn, S. Pakalin, C.J.A. Heidorn, R. Allanou, S. Scheer, G. Pellegrini, S. Vegro, M. Luotamo, J. De Bruijn, F. Berthault, H. Loonen, K. Vormann, A. Naughton, V. Anfossi, L. Praderio
Luxembourg: Office for Official Publications of the European Communities
2001 – X, 124 pp. – 17.0 x 24.0 cm
Environment and quality of life series
ISBN 92-894-0485-X
Price (excluding VAT) in Luxembourg: EUR 14.50

LB-N
A-19729-E
N-C
14
The mission of the JRC is to provide customer-driven scientific and technical support forthe conception, development, implementation and monitoring of EU policies. As a serv-ice of the European Commission, the JRC functions as a reference centre of science andtechnology for the Union. Close to the policy-making process, it serves the commoninterest of the Member States, while being independent of special interests, private ornational.
European Commission - Joint Research CentreInstitute for Health and Consumer ProtectionEuropean Chemicals Bureau (ECB)
European Union Risk Assessment Report
hydrogen fluorideCAS No.: 7664-39-3 EINECS No.: 231-634-8
Series: 1st Priority List Volume: 8
Price (excluding VAT) in Luxembourg: EUR 14.50
OFFICE FOR OFFICIAL PUBLICATIONSOF THE EUROPEAN COMMUNITIESL – 2985 Luxembourg