risk assessment of adjacent structures due to bored ... · maunsell consultant pte. ltd ... sponse...
TRANSCRIPT

Risk Assessment of Adjacent Structures due to Bored Tunneling for Changi Airport Line C.C. Ng, G.V.R. Raju, Kenny, P.A. Lim Maunsell Consultant Pte. Ltd., Singapore B.S. Kumar Nishimatsu Construction Co., Ltd.., Singapore
ABSTRACT: This paper discusses an ‘Observational Method’ used in the construction of the ChangiAirport Line (CAL) tunnels to minimize ground movement and thus risk of damage to adjacent struc-tures. The twin tunnels, which measure 6.13m in external diameter and are each 3.5km long, are the longest in Singapore. These bored tunnels were driven through 3 different soil conditions: at the inter-face between Kallang Formation and completely weathered Old Alluvium (OA), entirely within com-pletely weathered OA, and entirely within fresh to slightly weathered OA (Brown or Blue Sandstone). An extensive instrumentation program was used to monitor the surrounding ground movement and theresponse of the existing structures. This paper presents the theoretical predictions, monitoring dataand the damage assessment of the adjacent structures. 1 INTRODUCTION The proposed Changi Airport Line (CAL) is a Mass Rapid Transit (MRT) system that will link the Changi Airport to the existing MRT network, which comprises both elevated and underground sec-tions. The bored tunnel section of CAL, which forms part of Contract 503, is approximately 3.5km long and consists of twin 6.13m in external diameter tunnels with a center-to-center spacing of approx-imately 15m. These bored tunnels are the longest in Singapore and driven in the most precise way ev-er. The tunnels alignment passes beneath the existing drainage reserve of a canal, the Pan-Island Ex-pressway, and along the line of the western perimeter of the airport. Other structures in the vicinity of the bored tunnels are JTC Business Park, SASCO Bridge, Yan Kit pond (storm water reservoir) and sluice gates, Changi Airport Runway One and a Taxiway. A location plan showing the route of the bored tunnel alignment is given in Figure 1.
The construction of an underground tunnel is associated with a change in the state of stress in the ground and with corresponding strains and displacements. Ground surface settlements due to tunne-ling occur as a result of relief of the stresses existing in the ground before excavation commences. This stress relief, together with the flexure of the tunnel lining causes radial convergence of the sup-port system. The inward convergence of the tunnel is accompanied by settlement of the ground sur-face. Besides, the ground surface settlement may also arise due to additional face loss caused by tun-nel over-break.
As the bored tunneling passed under some existing structures, it was necessary to assess the behaviour of the surrounding ground movements and the response of adjacent structures during and after tunnel driving. The real ground response due to bored tunneling quite often differs from that of the predic-tion during design stage. In order to rationalize the differences between predicted and real ground re-sponse, extensive field measurements were implemented to monitor the ground movements and re-sponse of adjacent structures during and after tunneling. An ‘Observational method’ (Figure 2) was

employed to check and modify the original design based on the interpretation of the monitoring results (Sakurai, 1999) in order to minimize ground movement.
Figure 1. Location plan of C503 bored tunnel alignment
Start
Exploration
Design
Construction
Field Measurement
Modification ofDesign/
ConstructionMethods
Back Analysis
Identification ofMechanical Model and
Constant
Stop
Yes
No
Yes
No
Assessment ofStability and
Design/ConstructionMethod
End ofConstruction
igure 2. Observational Method in Geotechnical Engineering Projects (after Sakurai, 1999) F
GROUND CONDITIONS 2
The regional geology of the ground along the bored tunnels can be described locally as the Kallang Formation underlain by a very thick bed of Old Alluvium, in which its crust has been subjected to

deep weathering in its geologic past. Thus the ground condition generally comprises of the following strata with increasing depth from ground level: • Fill/Reclamation Fill • Kallang Formation (KF) (not always present) • Old Alluvium (OA) Formation
The KF occurs as infill in the valleys of the underlying OA. This formation can be classified as a co-hesionless material comprising loose to medium dense silty gravelly sands and a soft cohesive material comprising peaty/marine clay. The thick deposit of OA also exhibits a distinct weathering profile, which can be classified into: • Residual soil: Firm to stiff sandy clay and clayey sand • Completely Weathered Old Alluvium (CWOA): Dense to very dense sand and gravel with occa-
sional lenses of stiff to hard silty clays • Fresh to slightly weathered Old Alluvium (Sandstones): Coarse grained Brown or Blue Sandstones • Mudstones: Pale greenish brown layers of mudstones
The geotechnical properties of the above soil types are summarized in Table 1. The tunnel axis levels typically fall below10 to 20m below the existing ground level and the tunnels generally traverse the OA. However at some sections of the tunnel drives (eg. CH. 95+830 and 98+800) the KF extends to the tunnel level. The assessed geology of the ground along the tunnel drives is indicated in Figure 3. The ground water table was fairly constant throughout the drive. It could be considered to be fairly high, generally less than 5m below ground surface.
XILIN AVENUE
??
RL 70.00?
RL 80.00
?
RL 90.00
RL 100.00
RL 110.00
?
?
??
?
? ??
EXPO
?
?
?
??
??
?
CH
93
+ 90
0C
H 9
4 +
000
RL 120.00
CH
94
+ 5 0
0
ORIGINAL TOPOGRAPHY
CH
95
+ 00
0
CH
95
+ 50
0
APPROX. POSITION
DRAINAGE
?
??
??
??
??
??
CP2
CP1
RESERVECANAL
CH
96
+ 00
0
CH
96
+ 50
0
CH
97
+ 00
0
CH
97
+ 50
0
CH
98
+ 00
0AIRPORT
OLD TOPOGRAPHY - 1975AND ELEVATION OF
CH
98
+ 50
0
RUNWAY 1 TAXI WAYC
H 9
9 +
000
APRONA
PP
RO
X P
OS
ITIO
N O
FO
L D C
OA
STL
INE
CH
99
+ 50
0C
H 9
9 +
600
APPROXIMATE POSITION
RL 70.00
STATION STATION
FILL
K.F.C.
C.W.O.A. OLD ALLUVIUM (BLUE SANDSTONE)
K.F. SAND
RECLAMATION
STATION
OLD ALLUVIUM (BROWN SANDSTONE)
RESIDUAL SOIL (O.A)
HOLDING POND
SASCO TAXIWAY
Figure 3. Interpreted geotechnical profile along tunnel drives

Table 1. Summary of geotechnical properties
Soil type Density cu c' φ' E mv Permeability cv cc cz N(Mg/m3 ) (kPa) (MN/m2) (m2/MN) (m/s) (m2/year)
Reclamation Fill 2.0 10(W) - - - 0.03 7.8 X 10⁻⁷ 12.26 <450(CPT)
Fill 1.9 43-105(UU) (5-79) (29ο−33ο) 10.4 0.1 2.9 X 10⁻⁷ to 8.6 (3-6)50(CPT) 0 30o (200cu) 6.5 X 10⁻⁹
Kallang FormationCohsive Soils 1.6 11(FVT) 0 22o 2.6 2 1.0 0.12
15(UU) 13(small strain)25(CPT) 200cu
Cohesionless Soil 65-78 8.8 X 10⁻⁸ to <422.6(small strain) 10-9
Old AlluviumResidual Soil 2.0 28-310(UU) 0 30o 65-78 0.2 1.0 X 10⁻⁷ 10 (10-30)
100-200(CPT) 60(small strain)
Completely Weather 2.0 250(UU) 0* 31.5o 100 (50-90)116-313(UU) (Not typical) 41.6(small strain) 4X10⁻⁶
Brown Sand Stone 2.1 750(UCT) 59 (CD) 39o E=45 UCS (PMT) 0.03 10 -7 to 10 -8 22.08 N>1001000-3400 (PMT)
cu=200φu = 35(UU)
Mud Stones 2.1 750(UCT) 67 (CU) 53o E=74UCS (LAB) . 10 - 7
1300(PMT)E=140UCS (PMT)
Blue Sand Stones 2.0 375(UCT) 20 35o E=65UCS (LAB) 0.13 5 X 10 -7 1.65 <1001250(PMT) (CU) (CU)
cu=120 E=60 UCS (PMT)φu = 30(UU)
35(small strain)(very low)
3 BORED TUNNEL The 6.13m external diameter bored tunnels were driven by a TBM with the option of open or close face modes. The bored tunnels commenced from a portal in the cut and cover section at approximately CH. 95+500 and driven towards Changi Airport Station. The tunnels were be-ing constructed using bolted 1.4m wide, 250mm thick precast reinforced concrete lining seg-ments. Each ring was formed by 5 segments and 1 key. There are 12 cross-passage between the tunnels. The cross-passages were constructed by hand-mining method using steel frame and timber lagging. The approximate opening size for the cross-passage is 3m in diameter.
4 INSTRUMENTATION & MONITORING A comprehensive instrumentation and monitoring program was implemented for Contract 503. The monitoring scheme comprises of both ground and adjacent structure monitoring. The ground monitor-ing for the tunnel drives was conducted over 5 Greenfield sites (GFS) at approximately CH. 95+800, 96+050, 96+225, 97+039 and 98+297. These 5 GFS can generally be categorized into 3 types of dif-ferent ground conditions, which the tunnels traversed through: • Type 1 (GFS1) where tunnels were driven through interface between CWOA and KF • Type 2 (GFS 2 & 5) where tunnels were entirely within CWOA with overlying KF • Type 3 (GFS 3 & 4) where tunnels were entirely within Brown or Blue Sandstones without over-
lying KF The instrumentation across at the GFS consists of arrays of settlement markers, piezometers, in-place inclinometers and magnetic extensometers. A typical instrumentation layout plan at the Greenfield site and a typical cross-section are shown in Figures 4 and 5 respectively. Besides ground monitoring, monitoring of adjacent structures was also carried out, which included settlement markers on walls and column tiltmeters, to ensure the stability of the structures. Only ground monitoring results are pre-sented in this paper. The monitoring data was used to revise the initial prediction of settlement trough for damage assessments.

Figure 4. Typical instrumentation plans at the greenfield site
Figure 5. Typical instrumentation arrays at the greenfield site 5 ESTIMATION OF SETTLEMENT TROUGH PARAMETERS FROM GREENFIELD SITES The settlement data from the GFS was used to define the geometry of the settlement troughs needed to assess the likely damage to the adjacent structures. The prediction of Greenfield settlements due to the construction of a single bored tunnel were outlined by Peck (1969), O’Reilly and New (1982) and ex-tended by New and O’Reilly (1991). Considerable observations on a number of tunneling projects demonstrated that the ground surface settlements are usually in the form of Gaussian Distribution Curves. These curves can be defined in terms of the Equivalent Face Losses (EFL) and the Trough Width Parameters (K). EFL value, which is defined by volume of ground loss in terms of percentage of tunnel face area, is governed by the nature of surrounding soil conditions, including the ground water conditions and in-fluenced by the methods of construction and workmanship. K value is an empirical parameter, which is a function of the horizontal distance from the tunnel centerline to the point of inflection on the set-tlement trough, depth of the tunnel axis below the ground surface and external diameter of the tunnels. The settlement troughs for twin tunnels were obtained by superimposing the predicted ground settle-ment trough for each tunnel acting independently. This approach is conservative for tunnels where the clear separation is more than one tunnel diameter. In the back calculation for the EFL and K values

for the 3 different types of soil conditions, theoretical Gaussian settlement trough was iteratively fitted around the monitoring data at the GFS by adjusting the EFL and K values. These EFL and K values were subsequently used to define the settlement troughs at the sections with adjacent structures men-tioned above for damage assessments.
The monitoring data, characteristic EFL and K values of the ground surface settlement troughs in the 3 different types of soil conditions which the tunnels traversed through are summarized in Table 2. The following sections describe in detail the monitoring data and the back calculated EFL and K values of the ground settlement at the 3 different types of soil conditions. Table 2. Monitoring data and characteristic EFL & K values for 3 types of ground conditions
Type of ground conditions 1 2 3 Description Tunneling through inter-
face between CWOA and KF
Tunneling entirely in CWOA with overlying KF
Tunneling entirely in Brown or Blue Sandstones without overly-
ing KF GFS 1 2 & 5 3 & 4 Chainage(s) 95+584 to 95+835
96+033 to 96+065 98+289 to 98+317
96+225 to 96+243 97+039 to 97+061
Maximum Ground Surface Settlement 85mm 7mm 6mm Maximum Lateral Ground Movement 45mm 5mm 3mm Ground Water Table able Unchanged Unchanged Unchanged Unchanged Unchanged Unchanged EFL EFL 4.5% 4.5% 0.22 to 0.4% 0.22 to 0.4% 0.15 to 0.25% 0.15 to 0.25% K K 0.5 0.5 0.3 0.3 0.3 0.3
5.1 Type 1 (GFS 1 at approx. CH. 95+800) 5.1 Type 1 (GFS 1 at approx. CH. 95+800)
The monitoring data: settlement markers and inclinometer, as well as the theoretical Gaussian surface settlement trough at GFS 1 are shown in Figure 6. At this GFS, tunnels were driven through interface between CWOA and KF. The monitoring data shown in Figure 6 was recorded 2 weeks after both tunnels were driven through this monitoring site.
The monitoring data: settlement markers and inclinometer, as well as the theoretical Gaussian surface settlement trough at GFS 1 are shown in Figure 6. At this GFS, tunnels were driven through interface between CWOA and KF. The monitoring data shown in Figure 6 was recorded 2 weeks after both tunnels were driven through this monitoring site.
-300
-280
-260
-240
-220
-200
-180
-160
-140
-120
-100
-80
-60
-40
-20
0-35 -30 -25 -20 -15 -10 -5 0 5 10 15 20 25 30 35
Distance (m)
Set
tlem
ent (
mm
)
0
4
8
12
16
20
24
28
Dep
th (m
)
01020304050Lateral Movement (mm)
Fill
KFC
CW
OA
OA
Theoretical Settlement Trough (EFL = 5.5%, K = 0.5)
Measured settlement data
Center to Center Spacing = 15mTunnel External Diameter = 6.126m
Depth to axis of tunnel = 17m
0 10 20 30 40 50Lateral Movement (mm)
EB WB
Inclinometer Inclinometer
Settlement Marker
East bound
West bound
GFS
Settlement Marker
Inclinometer
Figure 6. Settlement Trough and inclinometer reading at GFS 1 (CH.95+584 to CH.95+835) Figure 6. Settlement Trough and inclinometer reading at GFS 1 (CH.95+584 to CH.95+835) Large settlements (above 300mm) occurred after the westbound tunnel was driven through this moni-toring zone. This is because there was an unexpected abrupt change in the ground at the tunnel level Large settlements (above 300mm) occurred after the westbound tunnel was driven through this moni-toring zone. This is because there was an unexpected abrupt change in the ground at the tunnel level

from OA to KF. The TBM driving parameters such as face pressure and the grout pressure used in OA had to be adjusted for driving in such soft and loose soils. During this process, the continued presence of the loose soils resulted in the large immediate ground settlements. When these driving pa-rameters were adjusted for the subsequent tunnel drives, the settlements above the tunnels were limited to about 55mm above fluvial deposits to 85mm above marine clay deposits. Hence, the large settle-ment initially recorded above the westbound tunnel was treated as non-representative of actual settle-ment trough due to tunneling in such ground and this monitoring data is not shown in Figure 6.
The maximum lateral ground movement was 45mm and there was no significant change in ground wa-ter table. Based on the monitoring data for the subsequent tunnel driving through this site, the critical EFL and K values at this site are 4.5% and 0.5 respectively. These are assumed as parameters defining the settlement trough where tunnels are driven through the interface between CWOA and KF.
5.2 Type 2 (GFS 2 at approx. CH. 96+050 and GFS 5 at approx. CH. 98+297)
The monitoring data: settlement markers and inclinometer, as well as the theoretical Gaussian surface settlement troughs at GFS 2 and 5 are shown in Figures 7 and 8 respectively. At these 2 GFS, the tun-nel driving was entirely in CWOA, but with some KF, ranging from 2 to 6m, overlying the CWOA above the tunnels. The monitoring data shown in Figures 7 and 8 was recorded 2 weeks after both tunnels were driven through these monitoring sites. The maximum ground surface settlement was about 4mm above KF of 2m thick and 7mm above KF of 6m thick. There was no significant change in ground water table. The maximum lateral ground movement was about 5mm. The EFL values at these 2 GFS range from 0.22% to 0.4% at location where the thickness of KF overlying the CWOA ranges from 2 to 6m. The K value at these 2 GFS is 0.3. These are assumed as parameters defining the settlement trough for tunneling entirely through the CWOA with overlying KF above the tunnels.
Figure 7. Settlement Trough and inclinometer reading at GFS 2 (CH.96+033 to CH.96+065)
-16
-14
-12
-10
-8
-6
-4
-2
0-35 -30 -25 -20 -15 -10 -5 0 5 10 15 20 25 30 35
Distance (m)
Set
tlem
ent (
mm
)
0
4
8
12
16
20
24
28
Dep
th (m
)
0 1 2 3 4 5Lateral Movement (mm)
-5-4-3-2-1012345Lateral Movement (mm)
Fi 6 h d l d GFSS l I i i 2
Fill
KF
CW
OA
OA
Theoretical Settlement Trough (EFL = 0.25%, K = 0.3)
Measured settlement data
Center to Center Spacing = 15mTunnel External Diameter = 6.126m
Depth to axis of tunnel = 19.65m
EB WB
Inclinometer Inclinometer
Settlement Marker
East bound
West bound
GFS
Settlement Marker
Inclinometer
-16
-14
-12
-10
-8
-6
-4
-2
0-35 -30 -25 -20 -15 -10 -5 0 5 10 15 20 25 30 35
Distance (m)
Set
tlem
ent (
mm
)
0
4
8
12
16
20
24
28
Dep
th (m
)
-5-4-3-2-1012345Lateral Movement (mm)
Fill
Bro
wn
San
dsto
nes
Blu
e S
ands
tone
s
Theoretical Settlement Trough (EFL = 0.25%, K = 0.3)
Monitoring data
Center to Center Spacing = 15mTunnel External Diameter = 6.126m
Depth to axis of tunnel = 19.75m
-5-4-3-2-10 1 2 3 4 5Lateral Movement (mm)
EB WB
Inclinometer Inclinometer
Settlement Marker
East bound
West bound
GFS
Settlement Marker
Inclinometer
Figure 8. Settlement Trough and inclinometer reading at GFS 5 (CH.98+289 to CH.98+317)
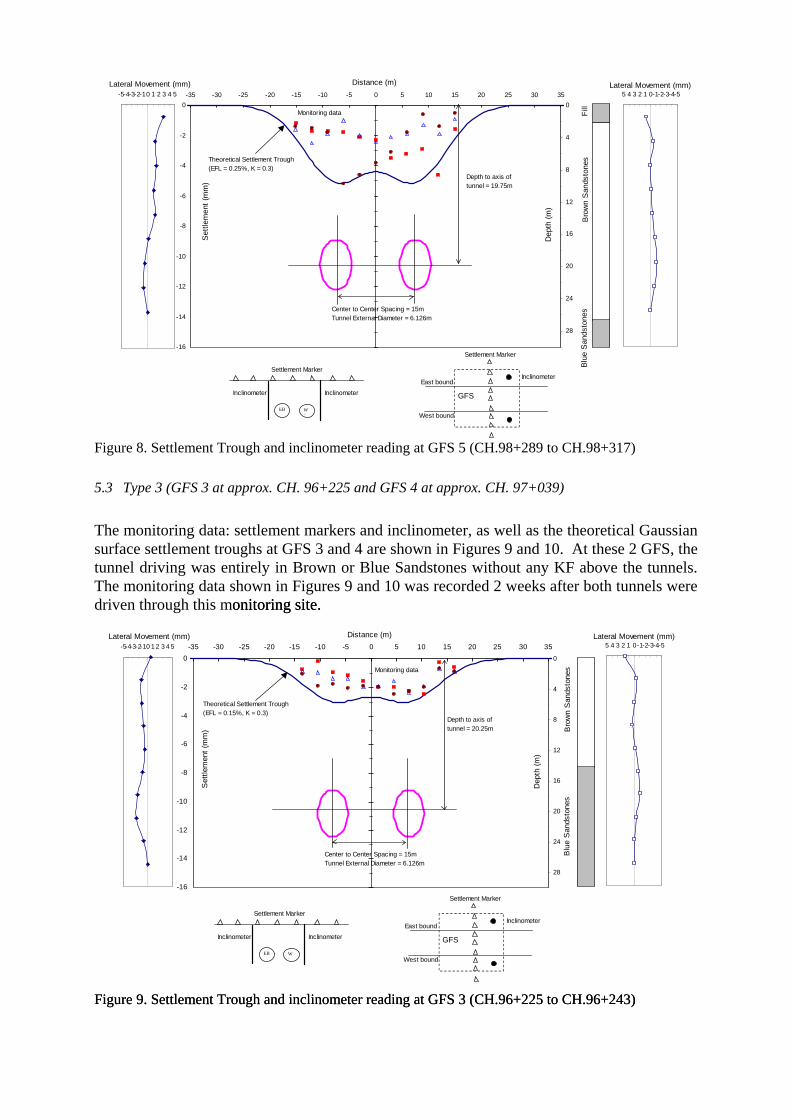
5.3 Type 3 (GFS 3 at approx. CH. 96+225 and GFS 4 at approx. CH. 97+039)
The monitoring data: settlement markers and inclinometer, as well as the theoretical Gaussian surface settlement troughs at GFS 3 and 4 are shown in Figures 9 and 10. At these 2 GFS, the tunnel driving was entirely in Brown or Blue Sandstones without any KF above the tunnels. The monitoring data shown in Figures 9 and 10 was recorded 2 weeks after both tunnels were driven through this monitoring site. onitoring site.
-16
-14
-12
-10
-8
-6
-4
-2
0-35 -30 -25 -20 -15 -10 -5 0 5 10 15 20 25 30 35
Distance (m)
Set
tlem
ent (
mm
)
0
4
8
12
16
20
24
28
Dep
th (m
)
-5-4-3-2-1012345Lateral Movement (mm)
Bro
wn
San
dsto
nes
Blu
e S
ands
tone
s
Theoretical Settlement Trough (EFL = 0.15%, K = 0.3)
Monitoring data
Center to Center Spacing = 15mTunnel External Diameter = 6.126m
Depth to axis of tunnel = 20.25m
-5-4-3-2-10 1 2 3 4 5Lateral Movement (mm)
EB WB
Inclinometer Inclinometer
Settlement Marker
East bound
West bound
GFS
Settlement Marker
Inclinometer
Figure 9. Settlement Trough and inclinometer reading at GFS 3 (CH.96+225 to CH.96+243) Figure 9. Settlement Trough and inclinometer reading at GFS 3 (CH.96+225 to CH.96+243)

-16
-14
-12
-10
-8
-6
-4
-2
0-35 -30 -25 -20 -15 -10 -5 0 5 10 15 20 25 30 35
Distance (m)
Set
tlem
ent (
mm
)
0
4
8
12
16
20
24
28
Dep
th (m
)
-5-4-3-2-1012345Lateral Movement (mm)
CW
OA
Bro
wn
San
dsto
nes
Theoretical Settlement Trough (EFL = 0.4%, K = 0.3)
Monitoring data
Center to Center Spacing = 15mTunnel External Diameter = 6.126m
Depth to axis of tunnel = 20m
-5-4-3-2-10 1 2 3 4 5Lateral Movement (mm)
EB WB
Inclinometer Inclinometer
Settlement Marker
East bound
West bound
GFS
Settlement Marker
Inclinometer
KF
Fill
Figure 10. Settlement Trough and inclinometer reading at GFS 4 (CH.97+039 to CH.97+061) The maximum ground surface settlement was about 6mm. The maximum lateral ground movement was 3mm and there was no significant change in ground water table. The EFL at these 2 GFS range from 0.15% to 0.25% and the K value is 0.3. These are assumed as para-meters defining the settlement trough for tunneling entirely through the Brown or Blue Sand-stones. 6 DAMAGE ASSESSMENT OF ADJACENT STRUCTURES The assessment of the potential damage to the structures along CAL tunnels is based largely on the works of Burland and Wroth (1974), Boscardin and Cording (1989), Burland (1995) and Mair, Taylor and Burland (1996). The classification into various categories of damage is based on the limiting ten-sile strains on the subsided ground surface and those experienced by the structure. The damage cate-gories based on the work by Burland et al. (1977) is shown in Table 3. Table 3. Category of damage (after Burland et al., 1977) ge (after Burland et al., 1977)
Category of
Damage
Normal Degree of Severity
Damage Type Description of Typical Damage
0 Negligible Aesthetic Hairline cracks less than about 0.1mm.
1 Very Slight Aesthetic Fine cracks, which are easily treated during normal decoration.
2 Slight Aesthetic Cracks easily filled. Re-decoration probably required. Recurrent cracks can be masked by suitable linings.
3 Moderate Serviceability The cracks require some opening up and can be patched by a mason. Repainting of external brickwork and possibility a small amount of brickwork to be replaced.
4 Severe Serviceability Extensive repair work involving breaking out and replacing sections of walls, especially over doors and windows.
5 Very Severe Stability This requires a major repair job involving partial or complete rebuilding.

The risk analysis consists of evaluating the ground settlements due to the construction of bored tunnel and determination of the angular distortion and critical tensile strain experienced by the buildings due to the ground settlements. Hence, settlement troughs need to be predicted when adjacent structures, which could be adversely affected, required to be assessed for possible damage. Damage assessment had been done for the following adjacent structures: • SASCO Bridge (approx. CH. 97+100 to 97+200) • Yan Kit Pond (storm water reservoir)/ sluice gates (approx. CH 97+900 to 98+000) • Airport Structures – Runway One and Taxiway (approx. CH.98+500 to 98+700) The above damage assessments are based on the assumption that the ground and the structure settle by the same amount and primarily based on the approach used for masonry structure where the structure stiffness is ignored. At the design stage, conservative values of EFL and K were used for damage assessment of the above adjacent structures based on the soil descriptions and the past experience on similar ground conditions. These assessments were then reassessed based on the available GFS monitoring data. The risk as-sessment was repeated using EFL of 1% and 4.5% for the Yan Kit Pond/sluice gates, and using EFL of 3% and 4.5% for Airport Runway and Taxiway, and 0.4% for SASCO Bridge. The damage categories of these structures are shown in Table 4. For Airport Runway, Taxiway and Yan Kit Pond/sluice gates, higher values of ground loss were used for the OA, as compared to GFS monitoring data. This was necessary to cover the likely variation in ground loss between the open and closed modes of the TBM operation and possibility of soft soil pockets beneath the structures. It could be seen from Table 4 that the most critical damage category predicted for any of the structures assessed is Category ‘3’ (Moderate), which can be described as ‘aesthetic to serviceability damage’, due to typical crack widths ranging from 5 to 15mm. The cracks can be easily filled and recurrent cracks can be masked by suitable linings. However, no structural damage is expected. The predicted worst damage categories for Yan Kit Pond/sluice gates and Airport Taxiway are ‘Moderate’, which exceed the ‘Slight’ category as per the particular specifications for Contract 503. The risk category predictions for the sluice gates shown in Table 4 should be interpreted with caution. The risk assessment is primarily based on the approach used for masonry structures, which in a strict sense is not suitable for the sluice gates. In the case of masonry structure, cracks of the size predicted can easily be filled. But in the case of the sluice gates, the possible adverse effects on the canal bar-rage mechanism of the sluice gates were difficult to predict, and difficult to repair if damage did occur. If the EFL value reaches 4.5% due to the presence of pockets of KF extending to the tunnel level, the function of the sluice gates as canal barrage may be adversely affected as the differential settlements may cause jamming of the gates in the sliding grooves. Hence, it was decided to adopt higher standard of control at this location in order to limit the severity of damage to the sluice gates. It was proposed to increase the depth of the tunnel at this location so that adequate firm ground cover is available be-tween the tunnel crown and the gates to minimise differential settlements. For the Airport Runway and Taxiways, the settlements due to tunneling are not expected to cause any damage even when the face loss reaches 4.5% at location where there is pockets of soft soils extending up to the tunnel level. This is because the thick taxiway structure will help to flatten the settlement trough, hence reduce the differential settlements. The maximum settlement monitored at Airport Runway and Taxiway were 5mm and 6mm respectively. These values are well below the limit in the particular specifications. The SASCO Bridge is supported on deep foundations in good ground. The settlement of the ground due to tunneling in the vicinity (7 to 8m away from the piles) is not expected to increase the moments in the piles. Excessive settlements of the piles are unlikely because the toes of the piles are below the invert level of the tunnels. Table 4. Risk categories for adjacent structures

Structure Predictions based on moni-toring data
Predictions for 4.5% EFL for the case of KF at tunnel level
Allowable values in particular
specifications
Monitoring data
Max. settlement
(mm)
Risk Category*2
Max. settlement
(mm)
Risk Category*2
Max. settle-ment (mm)
Risk Category*2
Max. settlement*1
(mm)
SASCO Bridge (Ch. 97+150m)
7 (EFL=0.4%, K=0.3)
0 - - 25 2 -
Yan Kit Pond/sluice gates (Ch. 97+950m)
18 (EFL=1%, K=0.45)
1 82 3 50 2 4
Airport Runway One (Ch. 98+500m)
8 (EFL=0.4%, K=0.3)
0 80 3 30 2 5
Airport Taxiway (Ch. 98+700m)
52 (EFL=3%, K=0.45)
3 80 3 40 2 6
*1 Based on greenfield settlements assuming that the ground and the structure settle by the same amount. *2 Structure stiffness is ignored. 7 DAMAGE MITIGATION MEASURES
Mitigation measures such as changing the mode of driving and lowering the vertical alignment of the tunnel was successfully implemented to minimize the ground movement, especially for the Yan Kit Pond/sluice gates structure. These mitigation measures were used to minimize risk identified from ‘Observational Method’. Lowering of the original tunnels vertical alignment at Yan Kit Pond/sluice gates had been proposed to minimize ground movement and thus structures damage and was accepted by Land Transport Authority (LTA). This lowering of the vertical alignments of eastbound and west-bound tunnels are shown in Figure 11.
Figure 11. Lowering of the vertical alignments of eastbound & westbound tunnels After the lowering of the tunnels vertical alignment, the maximum settlement monitored at the Yan Kit Pond/sluice gates was 4mm. The EFL and K values obtained by iteratively fitting a Gaussian settle-ment trough on the monitored data at this site were 0.3% and 0.45 respectively. As a result, the dam-age category of the Yan Kit Pond/sluice gate was improved from ‘Very Slight’ to ‘Negligible’, which is within the limit of the particular specifications.

8 CONCLUSIONS The following conclusions were drawn from the above findings: 1. The monitoring data at GFS provides a better understanding of the actual ground movements
caused by bored tunneling in OA and KF. 2. Lowering of tunnels vertical alignment at Yan Kit Pond/sluice gates to give sufficient ground
cover between the tunnels and the sluice gates has been proposed and accepted by the LTA. The damage category for the Yan Kit Pond/sluice gates was reduced from ‘very slight’ to ‘neg-ligible’ by the proposed lowering of alignment.
3. The method of estimating the EFL and K values based on the theoretical Gaussian curves fitted on the monitoring data, appears to be appropriate for tunneling in the KF and OA.
4. EFL and K values of 4.5% and 0.5 are estimated to be the parameters defining the settlement trough where tunnels are driven through the interface between CWOA and KF.
5. EFL values ranging from 0.22% to 0.4% and K value of 0.3 are estimated to be the parameters defining the settlement trough for tunneling entirely through the CWOA with overlying KF of thickness ranging from 2 to 6m above the tunnels.
6. EFL values ranging from 0.15% to 0.25% and K value of 0.3 are estimated to be the parameters defining the settlement trough for tunneling entirely through Brown or Blue Sandstones without overlying KF.
7. The damage assessment method used for CAL was able to predict the response of the adjacent structures to tunneling induced ground movements satisfactorily.
9 REFERENCES 1. Boscardin M. D. and Cording E. J. (1989), ‘Building Response to Excavation Induced Settle-
ment’, ASCE Journal of Geotechnical Engineering., Vol. 115, No. 1, January, pp. 1-21 2. Burland J. B. (1995), ‘Assessment of Risk of Damage to Buildings due to Tunneling and Exca-
vation’, Proceedings of First International Conference on Earthquake Geotechnical Engineering, Tokyo, pp. 1189-1201.
3. Burland J. B. and Wroth C. P. (1974). ‘Settlement of Buildings and Associated Damage’, Pro-ceedings of Conference on Settlement of Structures, Pentech Press, London, England, pp. 611-654.
4. Burland J. B., Broms B. B., ad de Mello V. F. B. (1977), ‘Behaviour of Foundations and Struc-tures’, State of the Art Report, Proceedings of the 9th International Conference on Soil Mechan-ics and Foundation Engineering, Tokyo, Japan, pp. 495-546
5. New B. M. and O’Reilly M. P. (1991), ‘Tunneling Induced Ground Movements: Predicting Their Magnitude and Effect’, 4th International Conference on Ground Movements and Struc-tures, Cardiff.
6. O’Reilly M. P. and New B. M. (1982), ‘Settlements above tunnels in the United Kingdom – Their Magnitude and Prediction’, Tunneling ’89, London, pp. 171-181.
7. Peck R. B. (1969), ‘Deep Excavations and Tunneling in Soft Ground’, State of the Art Report, 7th International Conference on Soil Mechanics and Foundation Engineering, Mexico City, State of the Art Volume, pp. 225-290.
8. Mair R. J., Taylor R. N. and J. B. Burland (1996), ‘Prediction of Ground Movements and As-sessment of Risk of Building Damage due to Bored Tunneling’, Geotechnical Aspects of Un-derground Construction in Soft Ground, Balkema, Rotterdam, pp. 713-718.
9. Sakurai S. (1999), ‘Interpretation of The Results of Displacement Measurements in Geotechnic-al Engineering Projects’, Proceedings of the 5th International Symposium on Field Measure-ments in Geomechanics, Singapore, pp. 13 – 18.