risk assessment and risk management for subsea … · risk assessment and risk management for...
TRANSCRIPT

RISK ASSESSMENT AND RISK MANAGEMENT FOR
SUBSEA RIGID SPOOL COMMISSIONING AND
INSTALLATION OPERATIONS
By
Hassan Elfeki
A thesis submitted to the
School of Graduate Studies
In partial fulfillment of the requirements for the degree of
Masters in Engineering
Faculty of Engineering & Applied Science
Memorial University of Newfoundland
2015
St. John’s Newfoundland and Labrador
ii
ABSTRACT
Today the newest frontier in oil & gas exploration, drilling and production industries
is the Oil and Gas Subsea Industry. Oil and gas fields reside beneath many inland
waters and offshore areas around the world. Subsea oil & gas production equipment
and systems can range in complexity from a single satellite well with a flow-line
linked to a fixed platform, FPSO or an onshore installation, to several wells on a
template or clustered connected to a manifold via a rigid spool.
The proposed study focuses on developing a risk assessment and risk management
tool that can be used by the decision maker in the field to address the risks involving
the different subsea rigid spool operations. This includes site integration tests,
different phases of the logistics operations to get these spools from their test facility to
their offshore fields, and the deployment and installation operations carried out in
their designated locations in the subsea fields.
This study attempts to identify and integrate the risks in each operational step and
give a clear account of the consequences involved ,the effects of such risks on the
project as whole showing the true cost of such risks and also gives the tools to reduce
these risks to as low as reasonably practical.

iii
ACKNOWLEDEGMENTS
All praises are for Almighty Allah, who by his will, I had the opportunity to enrol and
pursue Master of Engineering thesis based program at Memorial University.
I would like to express my deepest gratitude to my two supervisors Dr. Faisal Khan
and Dr. Ayhan Akinturk for their professional academic guidance, for teaching me
how to turn a new idea through innovative engineering thinking to useful quality
work that can be practically utilized ,and without whom this work would not have
seen daylight .
My gratitude and appreciation to Dr. Faisal & Dr. Ayhan is extended not only for
academic support, encouragement and guidance but also for their optimism,
kindness and patience with me.
I would like to express my gratitude to The School of Graduate Studies and Faculty
of Engineering and Applied Science at Memorial University of Newfoundland for
giving me the opportunity to study and research for a Master Degree.
My prayers and heartfelt thanks are also given to my late father Dr. Salah Elfeki who
taught me the great value in pursuing knowledge and how a man’s status is defined
by the amount of knowledge he can obtain. Last but not least, I would like to convey
my thanks, love and appreciation to my wife, Marwa Alhussieny and my two beloved
sons Omar Elfeki and Ali Elfeki for their patience, sacrifices and support during my
study.
iv
TABLE OF CONTENTS
ABSTRACT…………………………………………………………………….......ii
ACKNOWLEDEGMENTS………………………………………………………..iii
TABLE OF CONTENTS…………………………………………………………..iv
List of Tables………………………………………………………………………..vi
List of Figures………………………………………………………………………vii
List of Abbreviations………………………………………………………………viii
CHAPTER 1: INTRODUCTION ........................................................................................... 1
1.1 Introduction to the Subsea Oil and Gas Industry ....................................................... 1
1.2 Hazards , Risks and Failure Consequences in Subsea Industry .................................. 3
1.3 Challenges Facing Accurate Subsea Risk Analysis ...................................................... 7
1.4 Scope of Research ...................................................................................................... 9
1.5 Research Objectives ................................................................................................. 10
CHAPTER 2: LITERATURE REVIEW ............................................................................ 12
2.1 Accident Modeling and Prevention ............................................................................... 12
2.1.1 The Nature and Causes of Accidents ...................................................................... 14
2.1.2 Subsea Assets integrity and Risk Analysis ............................................................... 15
2.1.3 Accident Prediction Models and Model Classification ........................................... 19
2.2 Utilizing Accident Modeling in the Proposed Thesis ...................................................... 22
2.3 Site Integration Test (S.I.T)……………………………………………………………………………………..24
2.4 Transportation and Logistics…………………………………………………………………………………..34
2.5 Subsea Rigid Spool Offshore Installation and Commissioning Operations ……………..39
CHAPTER 3: METHODOLOGY OF RISK ASSESSMENT AND
MANAGEMENT ................................................................................................................... 42
3.1 Methodology of Risk Assessment and Management .................................................... 43
3.2 Steps of the Methodology ............................................................................................. 45
3.2.1 Description of Operational Sequence ..................................................................... 46
3.2.2 Identifying the Hazards in Each Operational Step .................................................. 46
3.2.3 Identifying the likelihood of occurrences for the risks and hazards associated with
all three operational phases in the case study. ............................................................... 53

v
3.2.4 Consequence Assessments ..................................................................................... 59
3.2.5 An Engineered Risk Matrix for the study. ............................................................... 63
3.3 Control Tools Used to Prevent and/or Mitigate Hazards .............................................. 67
3.5 Summary ........................................................................................................................ 72
CHAPTER 4: IMPLEMENTATION OF THE PROPOSED METHODOLOGY
IN A CASE STUDY ............................................................................................................... 73
4.1 Application of Thesis on Subsea Rigid Spool Operations. .............................................. 73
4.2 Case study of a lifting accident involving a Subsea Rigid Spool at a Fabrication Facility
on July 19, 2010 ................................................................................................................... 74
4.2.1 Incident Summary. .................................................................................................. 74
4.2.2 Incident Investigation Overview. ............................................................................ 78
4.2.3 Incident Description. ............................................................................................... 78
4.2.4 Root Cause Analysis. ............................................................................................... 81
4.2.5 Corrective Action Recommendations. .................................................................... 84
4.2.6 Lessons Learned due to Incident as per the Oil Company’s Final Report. ........... 87
4.3 Appling the Research on Case Study Operation ............................................................ 89
4.3.1 Developing an Engineered Risk Matrix for the Operations of the Case Study. ...... 90
4.3.2 Developing a hazard prevention and mitigation checklist for the case study. ....... 95
4.3.3 Implementing the risk assessment and risk management study in this case study
......................................................................................................................................... 99
CHAPTER 5 CONCLUSION AND FUTURE WORK .................................................... 108
5.1 Summary ...................................................................................................................... 108
5.2 Future Work ................................................................................................................. 109
5.2.1 Development of risk assessment and management systems for other subsea
assets.............................................................................................................................. 109
5.2.2 Development of a computerized Subsea assets risk management system. ......... 110
REFERENCES ..................................................................................................................... 112
vi
List of Tables
Table 1 Likelihood Of Lifting Incident & Hazard Occurrence Checklist. ............................................ 58
Table 2 Risk Matrix .............................................................................................................................. 65
Table 3 Causal Factor #A ..................................................................................................................... 82
Table 4 Causal Factors #B .................................................................................................................... 83
Table 5 Causal Factor #C ...................................................................................................................... 83
Table 6 Corrective Action Recommendations. ..................................................................................... 86
Table 7: Risk Matrix ............................................................................................................................. 94
Table 8 Lifting Incident Likelihood Of Occurrence. ............................................................................ 97

vii
List of Figures
Figure 1: Jack-up rig and production platforms……………………………………………..2
Figure 2: A Schematic Shows a Number of Floating Production Units……….…………….3
Figure 3: Deepwater Horizon oil rig in flames fueled from the gushing subsea well………..3
Figure 4: Rigid Spool………………………………………………………………………..28
Figure 5: Typical Rigid Jumper Shape……………………………………………………...29
Figure 6: Specific 4” Rigid Jumper Shape…………………………………………………..29
Figure 7: Simple Subsea Rigid Spool ……………………………………………………….32
Figure 8: Land Transportation of Rigged Spool…………………………………………….37
Figure 9: Offshore Transportation Of The Rigged Spool…………………………………...39
Figure 10: A Lifting Incident/Hazard Check List………………………..………………….51
Figure 11: An Uncontrolled Pressure Release Check List…………………………………..52
Figure 12: Control Means To Reduce Potential Pressure Release Check List……………...68
Figure 13: Control Means to Reduce Potential Lifting Hazard Check……………………...69
Figure 14: Risk Assessment Flow Chart……………………………………………….........71
Figure 15: Spool Diagram…………………………………………………………………...76
Figure 16: Tipped Over Crane……………………………………………………………….77
Figure 17: Tipped Over Rigged Spool……………………………………………………….77
Figure 18: Potential Factors That Could Result in Lifting Incident…………………………96
Figure 19: Factors To Reduce Lifting Hazards………………………………………………98

viii
List of Abbreviations
AEB Accident Evaluation Barrier
ALARP As Low As Reasonably Practicable
AEB Accident Evaluation Barrier
BOE Barrels of Equivalent
BAR Pressure Unit
CCA Cause Consequence Analysis
CWMS Computerized Work Management System
CMMS Computerized Maintenance Management System
CVC Cameron Vertical Connection
CVCRT Cameron Vertical Connection Running Tool
DP Dynamic Positioning
ETA Event Tree Analysis
FIG Figure
FPSO Floating Production, Storage and Offloading Unit
FTA Fault Tree Analysis
GBq Giga- Becquerel
HAZOP Hazard and Operability Study
HRA Human Reliability Analysis
HSE Health Safety & Environment
JSA Job Safety Analysis
M Meter
MSDS Material Safety Data Sheet
MPFM Multi-Phase Flow Meter
NST Newfoundland Standard Time

ix
PHA Preliminary Hazard Analysis
PRA Probabilistic Risk Assessment
PRV Pressure Relief Valve
PT Pressure – Temperature
QC Quality Control
QHSE Quality Health Safety & Environment
QRA Quantitative Risk analysis
R&D Research and Development
ROV Remotely Operated Vehicle
RT Running Tool
SIT Site Integration Test
SPAC Standards , Policies and Admin, Controls
STAMP System-Theoretic Accident Model and Processes
USD United States Dollars
XMT Christmas Tree

1
CHAPTER 1: INTRODUCTION
1.1 Introduction to the Subsea Oil and Gas Industry
On planet earth hydrocarbons, such as crude oil and natural gas, are the products of
compression and heating of ancient organic materials, in the absence of oxygen over
geological time. They are found in various deep and shallow underground zones in
different locations all around the world. Such oil and gas zones are either found
onshore, such as the ones processed in the deserts of the Middle East, Texas, Alberta,
and in other land locations all around the world. These zones are utilized, and oil and
gas are extracted. There are also oil and gas zones that are located offshore, where
they are beneath the ground of the seabed.
The term Subsea in the Oil and Gas Industry relates to the exploration, drilling, and
development operations of oil and gas fields conducted in underwater locations.
To distinguish between different facilities and approaches that are needed, subsea oil
field developments are usually split into shallow water and deep-water categories.
The term shallow water is used for shallow water depths, where bottom-founded
facilities like jack-up drilling rigs can be used during the drilling operations and fixed
offshore structures during production operations. They are also used where saturation
diving is feasible, and where in most cases all the main flow control equipment is
located on the surface, such as the wellhead and the XMT that are on the production
platforms and installations as shown in Figure 1 [by:- Jon Mainwaring , Rig-zone
Staff 2012].

2
Figure 1: Jack-Up Rig And Production Platforms [by:- Jon Mainwaring , Rig-zone Staff 2012].
Deep-water is a term often used to refer to offshore projects located in water depths
greater than 300 feet, where floating drilling vessels, whether semi sub drilling rigs or
drill ships are used for drilling operations. They are also used for floating oil
platforms during production operations. Deep water is where remotely operated
underwater vehicles are required as manned diving is not practical.
In deep water operation, the term or prefix used to describe the assets and systems
used in deep water drilling and production operations is referred to as subsea. As in
subsea well, subsea XMT, subsea manifold, and subsea field, as per Figure 2 Source
[FMC technology’s website Feb. 2014].

3
Figure 2: A Schematic Shows a Number of Floating Production Units [FMC technology’s website
Feb. 2014].
1.2 Hazards, Risks and Failure Consequences in Subsea Industry
Basic Terminology
Initiating Event: The start of an unplanned and unwanted event such as system or
equipment failure or human error is the initiating event for the event tree.
Event: The event following and caused by the initiating event such as release of pressure
(after valve failure), radioactive release (after equipment source damage) , dropping
equipment ( after human error) are also termed as precursor events.
Outcome Event: The possible effects, scenarios or outcomes of an initiating event are known
as the outcome events, such as an oil spill, radioactive contamination, explosion or costly
operational down time.
Subsea Risk Matrix: A subsea risk matrix is a matrix that is used during risk assessment of
the different phases of the subsea process operation, from the manufacturing and testing
phase to final commissioning in the offshore subsea spots. It is used to define the various
4
levels of risk as the product of the hazard probability categories and hazard severity
categories
Flowchart: A flowchart is a type of diagram that represents an algorithm or process, showing
the steps as boxes, and their order by connecting them with arrows. This is used in
analyzing, designing, and managing the risk analysis and risk management operations.
Safety engineering is a discipline which assures that engineered systems provide
acceptable levels of safety. The primary goal of safety engineering is to manage risks
by eliminating or reducing them to acceptable levels.
By understanding the existing hazards, risks, and failure consequences of any system,
a realistic and suitable risk management system can be developed. This system would
provide acceptable levels of safety to such a system or industrial entity.
Any unwanted or undesired occurrence during any operation is termed as an incident.
Hazards generally refer to those events that have the potential to cause an incident or
accident. An accident is a resulting outcome of an occurrence of a single incident or
multiple incidents or events. Risk analysis is widely recognized as a systematic
process to model the probable accident scenarios for the industrial facility, and
quantify the losses and consequences in a measurement of risk (Daneshkhah, 2004). It
has now become a common term which has various implications. It is usually defined
as a combination of the likelihood of occurrence of an unwanted event (accident) and
its consequences. Alternatively, it can also be defined with the following
explanations:

5
Kaplan and Garrick (1981) define “risk as a set of scenarios (occurrences), each of
which has a probability (likelihood) and consequences”.
Kumamoto and Henley (1996) define “risk as collections of likelihoods and likely
occurrences”.
Aiche (2000) defines “risk as a combination of probability of the occurrence and its
consequences”.
Crowl and Louvar (2002) define “risk as a probability of a hazard resulting in an
accident”.
Ayyub (2003) defines “risk as a characteristic of an uncertain future and is neither a
characteristic of the present nor past. It results from a hazardous event or sequence of
hazardous events referred to as causes and if it occurs, results in different adverse
consequences”.
Bedford and Cook (2001) define “risk with two particular elements: hazard (a source
of danger) and uncertainty (quantified by probability).”
Risk involved in a potential accident or incident is evaluated based on a systematic
analysis, which usually comprises a number of steps including a detailed qualitative
and quantitative evaluation (Modarres, 2006). A detailed risk analysis is always
designed to answer three fundamental questions about an occurrence in a facility: (1)
what can happen and why? (2) what are the likelihoods?, and (3) what are the
consequences? (Modarres, 2006). Four major steps, namely: hazard identifications,
consequence assessment, likelihood assessment, and risk characterization have to be

6
conducted in a comprehensive risk analysis in order to get the answers to these
questions (Ferdous, 2006).
The severity of the consequences resulting from a failure in an oil and gas subsea
system can be overwhelming, with devastating environmental and economic results.
Also, there is much more potential for human losses when compared to the
consequences resulting from a failure in an oil and gas land fields; this is due to a
number of reasons :-
Most subsea wells are at deep water depths a few thousand feet below the sea
surface, which makes the process of mitigation should an incident occur very
complicated, very costly, and technically challenging to address.
Most of these subsea fields are far away from the shore (most of the offshore
subsea fields off Newfoundland-Canada are more than 300 Km from shore),
adding a logistical challenge to get equipment and/or people to or from these
fields in case of an incident and also increases the time before any outside help
can arrive should an incident develop.
The remoteness of these offshore subsea fields, the weather, and time of year
are major negative factors that could delay or prevent any immediate response
to a major incident occurring in a subsea field offshore.
Subsea systems are a relatively new technology with limited historical
occurrences of major incidents, which means there are no clear standard
guidelines for how to address the different situations should a major incident
take place.

7
An example of the above factors and severity of the consequences resulting from a
subsea incident can be demonstrated by reviewing the Deep-water Horizon
catastrophe and the oil spill incident that followed. Following the explosion and
sinking of the Deep-water Horizon oil rig, which claimed 11 lives, a sea-floor oil
gusher flowed unabated for three months in 2010. The gushing wellhead was not
capped until 87 days later. The total discharge is estimated at 4.9 million barrels in the
gulf of Mexico. The environmental cost was epic, as well as the financial liability and
penalties that the oil company responsible had to pay. Some estimates suggested that
the total liability could amount to as much as $100 billion USD by the conclusion of
the disaster. Spillius, Andrew The Telegraph (London). Retrieved 2010-06-18.
1.3 Challenges Facing Accurate Subsea Risk Analysis
In process industries the integrated hazard identification, risk assessment,
consequence analysis, and risk mitigation are provided via different formalized
Figure 3: Deepwater Horizon Oil Rig In Flames Fueled From The Gushing Subsea Well Spillius, Andrew The
Telegraph (London). Retrieved 2010-06-18.

8
programs. These formalized programs are used in the general operations and facility
operation, when carrying out critical routine operations and when handling hazardous
materials. These programs show the methodology and aspects of detection,
prevention, and mitigation of risks associated with processing, handling, and
production during the different phases of any industrial process . Special attention is
given to hazard identification and hazard assessment techniques, ranging from simple
screening checklists to highly structured Hazard and Operability (HAZOP) analysis.
This shows how to calculate potential consequences of identified hazards, quantify the
likelihood of these events, and combine equipment failure rate data and human
reliability analysis with hazard assessment.
However, when dealing with oil and gas subsea systems and subsea assets, the
process to have a working system for hazard identification, risk assessment,
consequence analysis, and risk mitigation systems effective and in place faces many
challenges. These challenges are due to the complex nature of subsea assets,
equipment, and the nature of operations carried out as follows:
Subsea equipment and assets are custom-made products. For example, there is
no production line to produce a Subsea Christmas tree ( XMT) , subsea rigged
spool, or subsea manifold. These subsea assets and equipment are built
according to the customer’s (oil companies) field requirements, policies, and
field development strategic planning. This results in the uniqueness of
equipment ordered for each project. For example for a subsea rigged spool,
such uniqueness would be in terms of different size , shape , weight , added
accessories , materials used, methodology of testing, and the procedures and
9
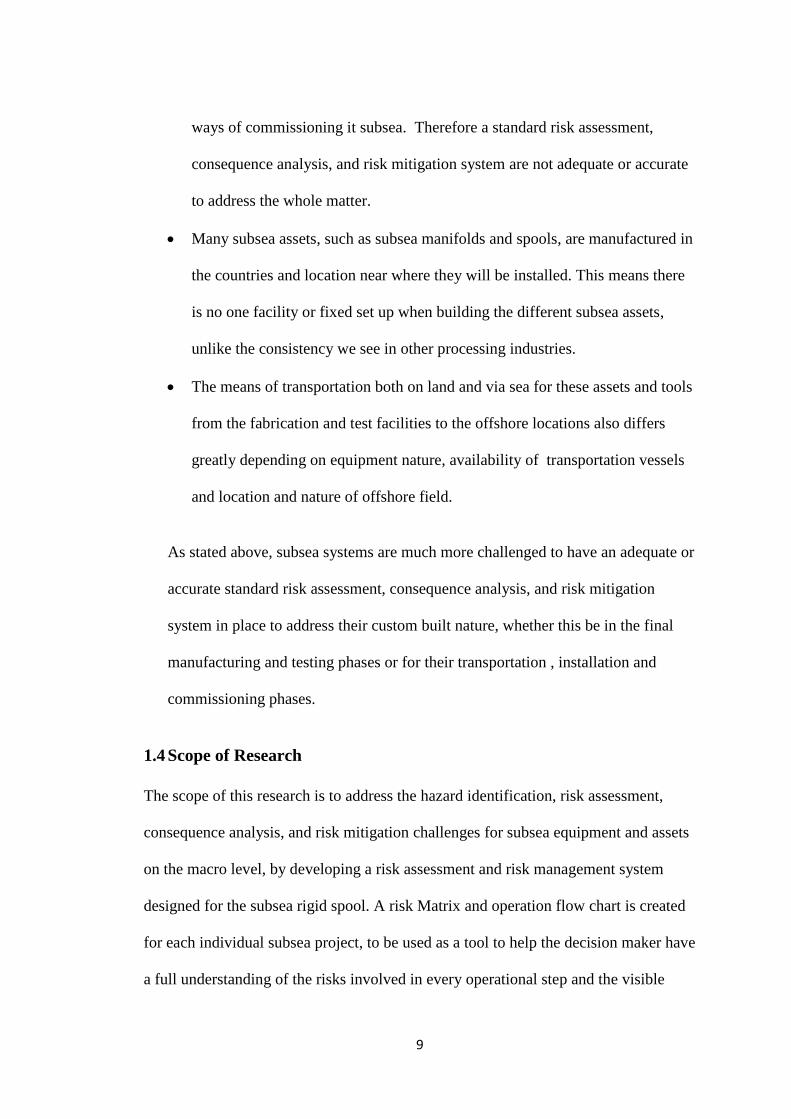
ways of commissioning it subsea. Therefore a standard risk assessment,
consequence analysis, and risk mitigation system are not adequate or accurate
to address the whole matter.
Many subsea assets, such as subsea manifolds and spools, are manufactured in
the countries and location near where they will be installed. This means there
is no one facility or fixed set up when building the different subsea assets,
unlike the consistency we see in other processing industries.
The means of transportation both on land and via sea for these assets and tools
from the fabrication and test facilities to the offshore locations also differs
greatly depending on equipment nature, availability of transportation vessels
and location and nature of offshore field.
As stated above, subsea systems are much more challenged to have an adequate or
accurate standard risk assessment, consequence analysis, and risk mitigation
system in place to address their custom built nature, whether this be in the final
manufacturing and testing phases or for their transportation , installation and
commissioning phases.
1.4 Scope of Research
The scope of this research is to address the hazard identification, risk assessment,
consequence analysis, and risk mitigation challenges for subsea equipment and assets
on the macro level, by developing a risk assessment and risk management system
designed for the subsea rigid spool. A risk Matrix and operation flow chart is created
for each individual subsea project, to be used as a tool to help the decision maker have
a full understanding of the risks involved in every operational step and the visible

10
means to reduce such risks to as low as reasonably practicable. In this study, the
subsea rigged spool shall be the subsea asset of interest, starting from the testing and
integration phase through the transportation and logistics phase, from test facilities to
offshore destinations, to the final phase of installation and commissioning phase of
the subsea assets (rigid spool) in its designated spot subsea.
1.5 Research Objectives
As the oil and gas industry moves towards the subsea fields in pursue of new
untapped oil and gas reservoir sources to meet the global demand, a number of highly
innovative and custom made subsea assets and equipment have been created. These
enable industry to extract and develop hydrocarbons from these deep and remote
subsea fields. With such new custom made newly innovated equipment and assets
comes the challenge of new risks associated with the testing, the logistics, and the
installation operations of this subsea equipment and assets, which cannot be addressed
in the same manner as the traditional risks present in other process industry systems;
nor can these risks be identified and managed in the same manner as those in the land
based process industry systems. Therefore, the need to develop new approaches for
subsea risk assessment and risk management was present.
The overall objectives for this research are as following:-
To propose a system for risk assessment and risk management created for
subsea assets [subsea rigged spool is the asset of interest in this study], where
the commissioning and installation operations involve identification,

11
assessment, and prioritization of risks. This is followed by coordinated and
economical application of resources to minimize, monitor, and control the
probability and/or impact of any unfortunate events. Also, the intent is to
maximize the realization of opportunities in an attempt to prevent such
unfortunate events from occurring, and to have a mitigation plan should they
happen.
To develop a risk matrix for each individual custom made subsea assets, to
suit the features of each subsea asset. Then this risk matrix would be utilized,
to determine on flow charts the degree of the consequences and the likelihood
of occurrence for all operations associated with the identified hazards,
showing the different scenarios in which these hazards can occur.
To empower the decision makers in the field during all phases of the
operation of testing, moving and installing this subsea equipment and assets
with a tool that shows the risks and their probability of occurring, and what’s
at stake should they occur. This tool also demonstrates what measures need to
be taken to reduce the chance of such risks occurring.
The end result of this study is to have an easy to use and effective risk assessment and
risk management system custom built for subsea assets [Rigid Spool in this study]
that can be used by the field operational supervisor or QHSE officer.

12
CHAPTER 2: LITERATURE REVIEW
The purpose of this study is to develop a risk assessment and risk management tool,
built specifically for the subsea rigid spool. This tool is developed to cover the
operations which are carried out on the spool, from the time its fabrication is
completed till it’s installed and commissioned in its subsea spot in its designated
subsea field offshore. In order to develop such an accurate risk assessment and
management tool, an overview of the different existing accident and prevention
models that are in use today in industry is presented, and what this study used from
these models and what it adds, also to be mentioned that due to the new nature of this
industry vary little risk studies and publications are available on the subject.
2.1 Accident Modeling and Prevention
In most high technological industries today, such as the oil and gas subsea industry,
the consequences of accidents, events, mishaps and near misses are so severe that they
are simply unacceptable. Therefore, when such events happen a thorough
investigation is carried out in order to learn from what has happened, how it
happened, and to prevent future occurrences. From such investigations and studies
accident modeling was developed. Most accidents can be traced to one or more than
one of four levels of failure: Organizational influences, unsafe supervision,
preconditions for unsafe acts, and the unsafe acts themselves. In these models, an
organization's defenses against failure are modeled as a series of barriers, with
individual weaknesses in individual parts of the system, and continually vary in size
and position. The system as a whole produces failures when all individual barrier
weaknesses align, permitting "a trajectory of accident opportunity", so that a hazard

13
passes through all of the holes in all of the defenses, leading to a failure ( Smith, D.
R., Frazier, D., Reithmaier, L. W. and Miller, J. C. 2001 & Stranks, J. 2007).
Therefore, the main purpose of accident modeling is to understand and analyze
different accidents and work on preventing them.

14
2.1.1 The Nature and Causes of an Accident
The term (Accident) has been used mainly as a common denominator for a set of
phenomena that is of interest, which includes a critical accident, incidents, and
mishaps which have in common two things: first, that they carry with them unwanted
and undesirable outcomes , secondly, that they are unexpected .
The nature of any accident has a three-step sequence:-
Initiation (the event that starts the accident).
Propagation (the event or events that maintain the accident), and
Termination (the event or events that stop the accident or diminish it in size).
Comprehending how accidents evolve from the initiating events, to their propagating
effects, to the final consequences is paramount in designing safety into systems.
(Hollnagel, E . 2004).
The main aim of accident modeling is to understand accidents, causes in order to
prevent them from occurring.
Accidents cannot be attributed to a single cause, but are the result of a number of
failures and mistakes that are caused by confluences of a whole chain of errors.
Therefore, there is a tendency to consider the relationship between variables rather
than causes.
However, it can be observed that accidents are mainly caused by three causal factors:

15
1st Unsafe acts: Any act that deviates from a generally recognized safe way or
specified method of doing a job.
2nd
Unsafe conditions: Any physical state which deviates from that which is
acceptable, normal, or correct in terms of its past production or potential future
production of personal injury and/or damage to property or systems. Any physical
state which results in a reduction in the degree of safety normally present.
3rd
Management and organizational failures which result from poor management of
safety policy & decisions , inadequate safety programs , supervision , worker training
or communication , leadership failure or inadequate management job knowledge.
It should be noted that accidents are invariably preceded by unsafe acts and/or unsafe
conditions. Thus, unsafe acts and/or unsafe conditions are essential to the occurrence
of an accident (Kjellen, U. 2000).
2.1.2 Subsea Assets integrity and Risk Analysis
Subsea asset integrity in this study is in regard to the integrity of the process. This
starts from the manufacturing and testing phases of the subsea rigid spool, passing
through transportation and logistics phases of transporting the subsea spool to its
designated offshore field location and the integrity of commissioning and installation
of the subsea spool in its final spot subsea. Subsea spool integrity here refers to the
ability to have the work performed on the subsea spool in an effective and efficient
way , whilst protecting the health and safety of the workers carrying out the work,
protecting the equipment and assets, and protecting the environment. This is done via
16
means of ensuring that the people, systems, processes and resources that deliver
integrity are in place, in use, and perform as required.
Therefore, an Integrity Management tool is developed to address the quality at every
stage of the subsea asset phases that have been mentioned above. This would cover
the facilities in which the subsea rigid spool will be worked on, the work procedures
while carrying out the different jobs on the spool, and means for handling , lifting and
transporting these spools. The inspections, auditing/assurance, and overall quality
processes are just some of the tools designed to make the subsea integrity
management system effective.
The integrity of a subsea rigged spool as an asset during installation and
commissioning is defined as its ability to perform its required function effectively and
efficiently whilst protecting health, safety and environment (HSE UK, 2009). Failure
of the management of offshore operations to adequately monitor the asset integrity
during such operations often leads to poor decision making (Stephens et al., 1995).
The safety of any system can be defined as “ Freedom from unacceptable risk”
(Harold E. Roland, Brian Moriarty-1990). From such a definition one can grasp the
importance of risk analysis in any system, and a subsea system is no exception. Since
absolute safety where all risks are completely eliminated can never be achieved, we
strive to reduce all risk to an acceptable level. Therefore, the goal is that all risk
associated with the subsea system activity in this study, as in industry, is reduced to
As Low As Reasonably Practicable or ALARP, and to reduce the frequency at which
hazards may occur to tolerable limits.

17
In general risk analysis can be qualitative and quantitative. The analysis estimates and
predicts the risks associated with unwanted events, measures societal risk, individual
risk, potential loss of life, probability of an accident and reliability of a system.
Qualitative evaluation is usually performed at each stage of the system or operation
development to identify the possible hazards with relevant causes. Traditional
qualitative evaluation methods like Safety Reviews, Functional Hazard Analysis,
What-If Analysis, Relative Ranking, Preliminary Hazard Analysis (PHA), Checklist
Analysis and Failure Modes & Effect Analysis are descriptive and generally used for
identifying possible system hazards (Wang, 2004 & Modarres, 2006).
Normally these methods are used in preparation for consequence analysis or failure
frequency analysis modeling of the risk analysis process, and also when a more
detailed study is not required (Hauptmanns, 1988; Lees, 1996, 2005). After
identifying the possible hazard scenarios of a system, the principal task of risk
analysis is to determine the logical causes and consequences for the identified hazard
scenarios and to evaluate the risk in a quantitative manner for the unwanted events.
Quantitative risk analysis (QRA) for a process system can either be deterministic or
probabilistic (Wang, 2004). The deterministic methods focus on consequence
assessment (such as worst-case scenario analysis), while the probabilistic approaches
consider both frequency and consequence. The probabilistic approach of QRA
evaluates risk for an industrial facility in terms of its numerical evaluation of
consequences and frequencies of an accident or an incident. Probabilistic data and
information about the possible hazard scenarios of an accident are the main required
parameters of probabilistic QRA. The final outcome of QRA is a numerical

18
evaluation of the overall facility in terms of calculating the probability of occurrences
of potential hazards and their contributions to risk.
A variety of techniques and many formal methods are used to assess or to "measure"
risk including Fault Tree Analysis (FTA), Event Tree Analysis (ETA), Cause-
Consequence Analysis (CCA), Human Reliability Analysis (HRA), and the latest
technique, “Bow-tie” analysis, has been used in QRA to perform risk analysis
(Badreddine and Amor, 2010).
Even when statistical estimates are available, in many cases risk is associated with
rare failures of some kind, and data may be sparse. Often, the probability of a negative
event is estimated by using the frequency of past similar events or by event tree
methods, but probabilities for rare failures may be difficult to estimate if an event tree
cannot be formulated. This makes risk assessment difficult in hazardous industries
such as the subsea industry. In this industry the frequency of failures is rare, and
harmful consequences of failure are numerous and severe. In addition to all the
previous factors stated, general historical statistical data is limited in the subsea
industry due to the fact it’s a new industry using new technologies.
In statistics, the notion of risk is often modeled as the expected value of an
undesirable outcome. This combines the probabilities of various possible events and
some assessment of the corresponding harm into a single value. The simplest case is a
binary possibility of Accident or No accident. The associated formula for calculating
risk is then:

19
Risk = Likelihood of a Hazard Occurring X Consequences resulting from These
Hazards
Because the level of consequence severity that could result from a subsea system
failure is extremely severe, as is the likelihood of occurrence for any defined hazard,
these depend on the initiating events that lead such a hazard to happen, and also on
the presence or absence of prevention layers of protection and procedures barriers to
prevent the occurrence of such hazards.
2.1.3 Accident Prediction Models and Model Classification
It is important to understand the causes of accidents in complex industries such as the
subsea oil & gas industry in order to enhance the safety of such industries and to
develop preventive strategies to mitigate the occurrence of future similar accidents.
Accident models provide a conceptualization of the characteristics of the accident,
which typically show the relation between the causes and effects, explain why and
how accidents occur, and are used as a technique for risk assessment during system
development and to study the causes of the occurrences of an accident.
As stated before, in complex industries such as the deep subsea oil and gas industry
accidents are not usually caused by a single failure or error but rather as a sequence of
events initiated by the deviation from process parameters, failures or malfunctioning
of one or more components.
Most traditional accident models use a linear notion of causality to analyze the
accident process. Accident causation models are classified into three different types:
sequential, epidemiological, and systemic ( Hollnagel 2004).

20
1st Sequential accident models
The sequential accident models are the simplest types of accident models, where the
occurrence of a preventable accident or injury is the natural culmination of a series of
events or circumstances which invariably occur in a fixed and logical order. One of
the earliest sequential accident models is the “Domino theory” proposed by Heinrich
(Heinrich HW. 1931).
2nd
Epidemiological accident models
This accident model describes an accident as an analogy to the spreading of a disease,
i.e as the outcome of a combination of factors, some manifest and some latent , that
happen to exist together in space and time, and the steps needed to create such models
are the following steps :
1:collection and analysis of data, 2:examination of apparent relationships for other
causative factors, 3:establishment of hypotheses regarding causation and testing them
under controlled conditions, 4: developing control measures and testing them for
effectiveness, 5: incorporation of these tested control methods into programs of
accident prevention. The epidemiological models can be seen as more powerful ways
of understanding an accident and differ from sequential accident models on four main
points ( Albert P. Iskrant Feb. 1960).
1. Performance deviations such as unsafe acts , unsafe conditions , a critical act
or disturbance which could be called performance deviation, this model helps
21
in understanding how systems gradually deteriorate from a normal state into a
state where an accident occurs.
2. Environmental conditions are the surrounding conditions that could lead to
performance deviations.
3. Barriers: this feature of the model could prevent the unexpected consequences
from occurring and could stop the development of an accident at the last
moment.
4. Latent failure which could occur as a result of human error is a condition
present within the system well before the onset of a recognizable accident
sequence.
3rd
Systemic accident models
Systemic models view accidents as emergent phenomena, which arise due to the
complex interactions between system components that may lead to degradation of
system performance, or result in an accident; an example of a systemic accident
model is Leveson’s STAMP (Systems-Theoretic Accident Model and Processes)
model, a systemic model that considers the technical, human and organizational
factors in complex socio-technical systems.
By reviewing these types of models we could summarize their characteristics. While
both sequential and epidemiological models represent clear cause and effect links,
these models view accidents as resultant phenomena, in the sense that the
consequences are predictable, in contrast to that the systemic models which see

22
accidents as emergent phenomena, as events that arise from the compelling of
conditions but which cannot be predicted in a similar manner.
2.2 Utilizing Accident Modeling in the Proposed Thesis
The study here presents a risk assessment and risk management system for the subsea
rigged spool. In order to determine a practical and accurate risk assessment it is
essential to have an accurate accident model, because by utilizing a functional
accident causation model we can identify the sources of such potential hazards or
accidents and ultimately work on eliminating or reducing the probability of them
occurring.
The selection process of a suitable accident causation model depends on the area of
focus, causal factors, and the purpose of the model, different models focus on
different aspects and are associated with different recommendations for improvement.
As reviewed in the start of this chapter and mentioned in chapter 1, the aspects of the
subsea oil and gas industry can be summarized as follows:
The subsea oil and gas industry is a new industry with limited historical
accident / incident logged data.
The subsea oil and gas industry utilizes state of the art new technologies which
in many cases are in their early R&D phase so there is no concrete
understanding of their reliability nor is there an understanding of the full
potential of harm they could cause if failure occurs .
23
The subsea oil and gas industry is a very customized industry in every aspect
so each subsea asset is custom built for a particular customer for a particular
field; this custom criterion is present in the way each asset is manufactured
and because of the different hazardous substances built into it, the way it is
transported, the way it is submerged to its subsea slot and even in many cases
in the way these assets are commissioned.
In this study it is proposed to utilize the methodology of a number of different
accident causation models. This study creates a custom built risk assessment and
management for the subsea rigged spool in all 3 phases from the end of manufacturing
till commissioning operations in the subsea field, Therefore different accident models
will be utilized in different areas where its determined that they best fit. For example
in the subsea rigged spool (S.I.T) phase utilizing a sequential model such as the
Accident Evaluation and Barrier (AEB) model in each potential hazard or accident
scenario would be the most successful approach. During the logistical phase of
transporting the spool it might be recommended to utilize the epidemiological
accident model such as the “Swiss cheese” model proposed by Reason. As for the
complex phases of the operations such as during offshore transportation, submarining
and commissioning operations of the subsea rigged spool, more complex accident
models are required to provide a conceptualization of the characteristics of the
potential hazard/ accident that might occur. In these phases models such as Kujath’s
Conceptual offshore oil and gas process accident model can be used. This model
addresses and works to prevent accidents related to hydrocarbon release scenarios and
any escalating events that follow, Kjellen, U.(2000).
24
An even more affective accident model that can be utilized in critical phases of the
subsea rigged spool offshore operation is the latest approach to model the accident
process. This model accommodates modeling of multiple risk factors considered in
the system in which interaction and relationship of the system elements are complex
and non-linear such as those present in the offshore logistics and transportation,
submerging and commissioning of the rigid spool.
Together the above accident causation models explain the causation mechanisms of
accidents, based on somewhat theoretical hypotheses (Panagiota Katsakiori 2008);
therefore during the different phases and steps of the operations of the subsea rigged
spool various accident models are utilized in this thesis to help determine the different
risks and possible accidents that might occur and therefore work on eliminating or
reducing them to as few as possible.
2.3 Site Integration Test S.I.T
The purpose of this review is to describe in a semi-detailed way the procedures
required to carry out the S.I.T after full completion of spool fabrication, in order for
the spool to perform its job. Only the S.I.T procedures for a simple spool will be
displyed without any accessories such as acoustic sand detectors, flow meters,
sensors,...etc. (BUR/PRJ/008/2011). Such accessories would also require a S.I.T
before they are ready to be shipped for deployment subsea. The main step can be
stated as follows :
• Cleaning the inner pipe body, the rigid spool & ROV panel piping.

25
• Rigid Spool body Hydro-Test and MEG or Water filling.
• Rigid Spool Connector Tubing pressure test.
• De-watering of the Rigid Spool.
1st Rigid Spool Cleaning task
Piping cleaning will be performed on spool [before the CVC connections are welded
on] as follows:
Step 1:- Initial Status:
• Equipment visually inspected.
• All necessary equipment has been functionally tested.
• All fittings are of a suitable rating for operation.
• Crane / Forklift available for movement of equipment.
• All necessary personnel available.
• Rigid Spool pre shape horizontally mounted.
Then fill system supply tank with water, connect water supply tank to water pump and
water disposal tank at pre-shaped end of the Rigid Spool.
Step 2:- Spool body piping flushing:
• Connect water supply tank to pumping system.

26
• Connect pump outlet with flushing spray nozzle to pre-shape piping at one end
• Water disposal tank at the other end.
• Insert flushing hose with spray nozzle into piping system (forwards and
backwards).
• Visually check water coming out through piping end using clean bottle
• Continue pumping , checking till there is no debris observed
Step 3:- ROV panel piping tubing flushing:
• Tubing not connected to CVC, dummy stab removed and hot stab installed
• Connect TRANS AQUA supply tank to pumping system
• Connect pump outlet hose to hot stab
• Visually check trans aqua coming out through tubing end using clean bottle
• Continue pumping , checking till there is no debris observed
Completely disconnect the flushing system, empty water disposal tank and dewater
the rigid spool [empty the water from the rigid spool].
Piping cleaning shall be performed for rigid spool for the verification of absence of
any debris in the flow path.
2nd Hydro-test & Meg Filling Procedure for Rigid Spool.

27
The Spool Body Hydro test is in accordance with the spool design and fabrication
limitations, to demonstrate that the spool main body piping has the strength required
to meet the design conditions and to check the integrity of the spool body. The test
medium for all Rigid Spool Hydro-Tests shall be MEG except for 4” Spools for which
fresh water could be used.
Step 1: Hydro test equipment set up & function test:-
Equipment visually has been inspected.
All necessary equipment has been serviced ready for testing.
All relevant documentation is in place for equipment.
Fittings, hoses and instrumentation are ready.
Instrumentation is calibrated and certificates available.
All fittings are of a suitable rating for operation.
Crane / Forklift is available for movement of equipment.
Full certification is available for all equipment and hoses.
PRV rated to hydro-test pressure is fitted.
Equipment function test pressure shall be (1.1 * hydro test pressure).
Step 2: Place the Rigid Spool in the vertical position and start filling it with the
MEG:-
28
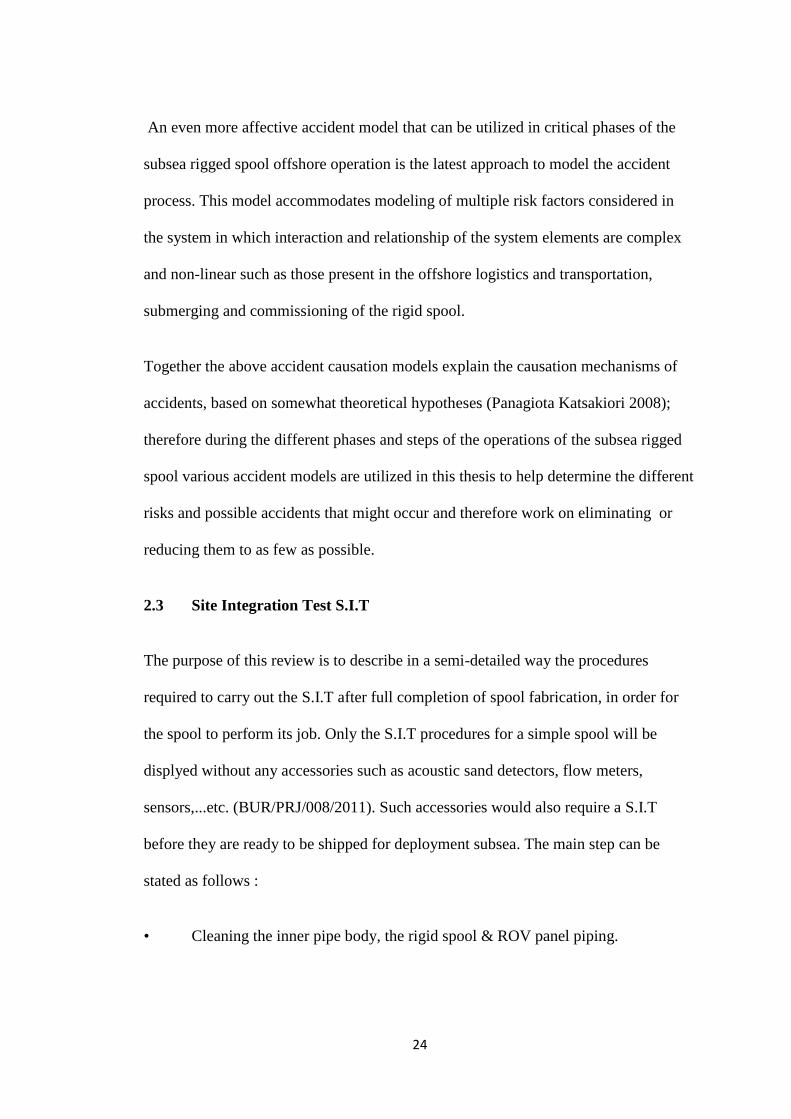
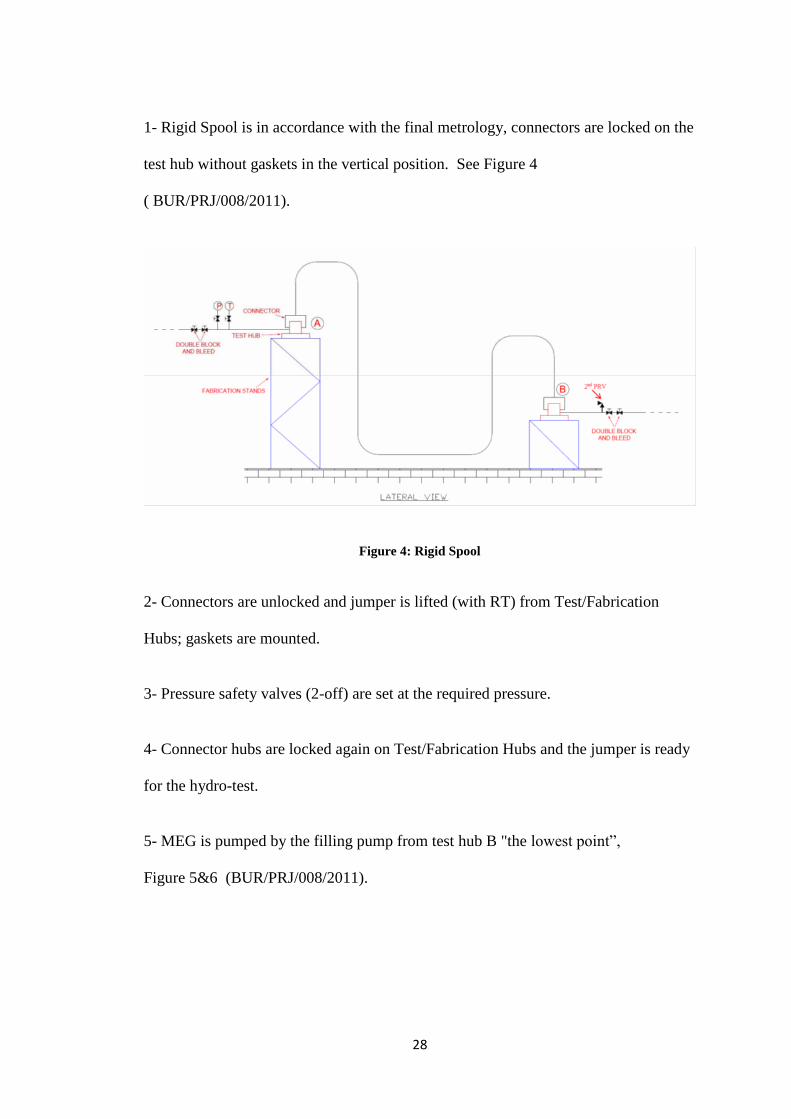
1- Rigid Spool is in accordance with the final metrology, connectors are locked on the
test hub without gaskets in the vertical position. See Figure 4
( BUR/PRJ/008/2011).
Figure 4: Rigid Spool
2- Connectors are unlocked and jumper is lifted (with RT) from Test/Fabrication
Hubs; gaskets are mounted.
3- Pressure safety valves (2-off) are set at the required pressure.
4- Connector hubs are locked again on Test/Fabrication Hubs and the jumper is ready
for the hydro-test.
5- MEG is pumped by the filling pump from test hub B "the lowest point”,
Figure 5&6 (BUR/PRJ/008/2011).

29
Filling starts by pumping MEG from hub B and opening the valve at hub A for air
venting. An estimation of MEG quantity for a rigid spool will depend on spool size
and inner volume.
Figure5& 6: Specific 4” Rigid Jumper Shape
6- Pumping MEG will continue through Hub B till MEG is coming from hub A;
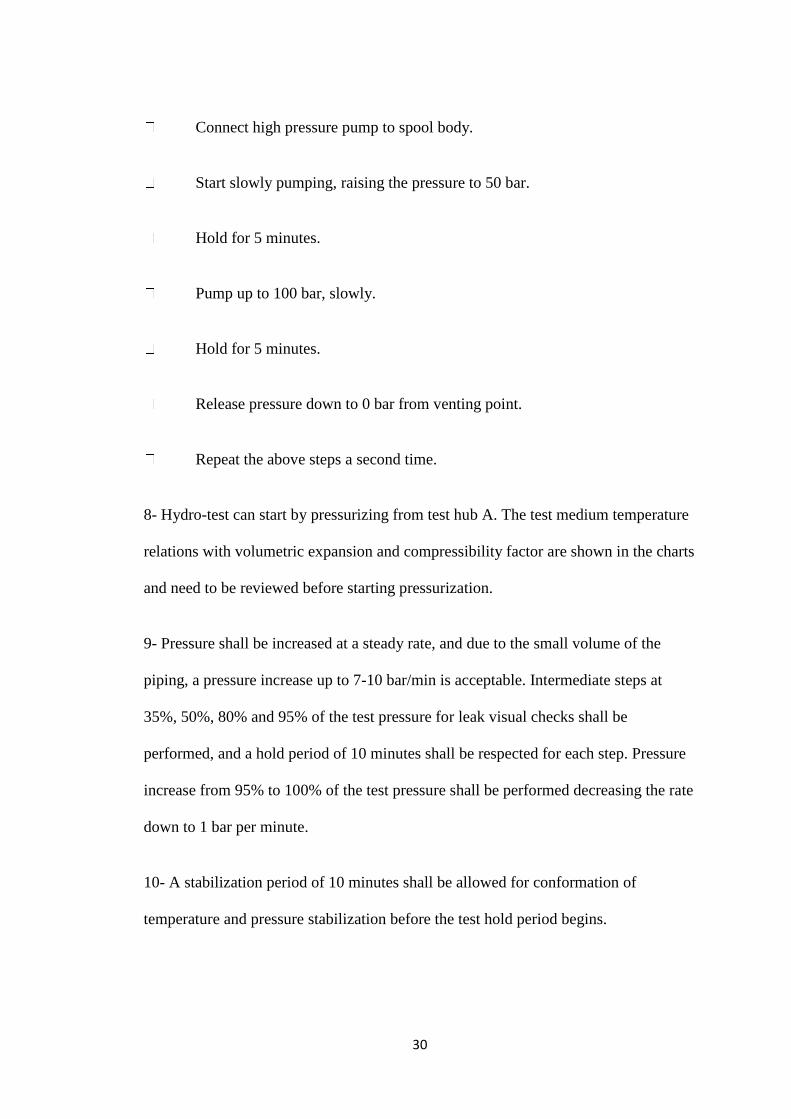
7- Close the valve at hub A; cycling is applied to get rid of any trapped air inside
Rigid Spool Body as per following:
30
Connect high pressure pump to spool body.
Start slowly pumping, raising the pressure to 50 bar.
Hold for 5 minutes.
Pump up to 100 bar, slowly.
Hold for 5 minutes.
Release pressure down to 0 bar from venting point.
Repeat the above steps a second time.
8- Hydro-test can start by pressurizing from test hub A. The test medium temperature
relations with volumetric expansion and compressibility factor are shown in the charts
and need to be reviewed before starting pressurization.
9- Pressure shall be increased at a steady rate, and due to the small volume of the
piping, a pressure increase up to 7-10 bar/min is acceptable. Intermediate steps at
35%, 50%, 80% and 95% of the test pressure for leak visual checks shall be
performed, and a hold period of 10 minutes shall be respected for each step. Pressure
increase from 95% to 100% of the test pressure shall be performed decreasing the rate
down to 1 bar per minute.
10- A stabilization period of 10 minutes shall be allowed for conformation of
temperature and pressure stabilization before the test hold period begins.
31
11- When pressuring any test system, continuous attendance and supervision must be
maintained at the test pump and pressure gauges shall be monitored at all times during
the test by a QC engineer.
12- The test pressure shall be held for a minimum of 6 hours (test holding time). If,
due to residual trapped air the pressure drops under the minimum required during the
hold time it will be brought up and, after a new stabilization, the hold period we be
reinitiated.
13- Mechanical connector shall be visually inspected for leaks during the pressure
test.
14- Pressure and temperature shall be recorded during pressurization, stabilization and
hold periods. Temperatures and pressure shall be recorded by a PT
transducer/recorder. Pressure and temperature shall be recorded every 10 minutes
during the stabilization and hold periods.
15- After satisfactory completion of the pressure test, the authority’s representative
shall witness the gradual release of pressure in a steady and controlled manner.
16- Open valves on hub A for gradual pressure release.
3rd Rigid Spool connector tubing pressure test.
Tubing Hydro- tests are carried out when weather conditions are stable and no
sensible fluctuation of temperature is envisaged throughout the hold period. They are
32
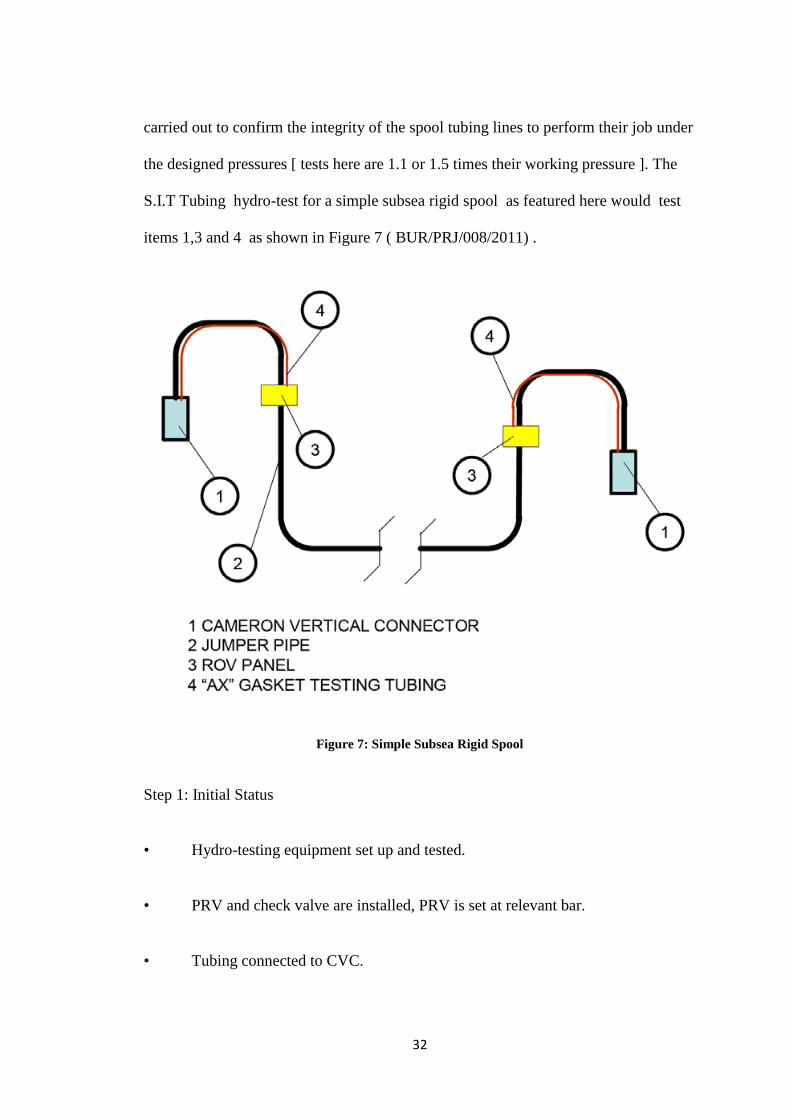
carried out to confirm the integrity of the spool tubing lines to perform their job under
the designed pressures [ tests here are 1.1 or 1.5 times their working pressure ]. The
S.I.T Tubing hydro-test for a simple subsea rigid spool as featured here would test
items 1,3 and 4 as shown in Figure 7 ( BUR/PRJ/008/2011) .
Figure 7: Simple Subsea Rigid Spool
Step 1: Initial Status
• Hydro-testing equipment set up and tested.
• PRV and check valve are installed, PRV is set at relevant bar.
• Tubing connected to CVC.

33
• Instrumentation and injection hose have been connected.
• Dummy stab removed and hot stab installed
• Flushing satisfactorily completed.
Step 2: Start hydro-test
• Connect hydro-test pump to hot stab.
• Start pressurization 0 bar to 35% of Test Pressure.
• Commence pressurization of the tubing to 35% of test pressure with controlled
rate.
• Hold for 5 minutes and inspect for leak.
• Then restart pressurization from 35% to 50% Test Pressure, hold for 5 min.
and inspect for any leak or pressure drop.
• Do the same as the last step for 50% to 80% Test Pressure, wait for 5 min.
And inspect, then go to 95% of test pressure and also wait to see if all is well.
• Then go to 100% of the test pressure and after stabilization (wait for 5 min and
inspect for leaks ) start a 15 min test at 104 bar; a drop of up to 3% is acceptable .
• If test passes and is accepted then bleed down the pressure [but the ROV
panel and tubing are left filled with test fluid].
• Take the hot stab out and put the dummy back in.

34
The test medium used is TRANSAQUA [ a water based hydraulic fluid].
4th De-watering of the Rigid Spool.
This final step in the SIT will be carried out via a suction line fitted in from the high-
end connection, and via suction pump the test medium fluid will be removed from the
rigid spool, after which the rigid spool will be placed in the horizontal position [a
support frame will be built to support the subsea rigid spool] and it will be ready to be
transported to the port key side.
2.4 Transportation and Logistics
After the completion of the rigid spool. S.I.T at its fabrication facility, the second step
is the transportation and the logistic activity associated with moving the rigid spool
from its fabrication and test facility to the offshore location (BUR/PRJ/003/2010)
over its field were it is submerged and installed in place connecting the two specific
subsea assets it is built for, and to accomplish this there are two sub-steps as follows:
1st : The transportation operations via land to port:
After the SIT is done and the subsea rigged spool is ready, the next step is the safe
transport of the spool via land and sea to its offshore field where it is to be installed.
The challenges and risks here can be summarized as:-

35
Step 1: Dewatering the spool body and placement in horizontal position:
Dewatering the hydraulic test medium is the 1st operation carried out in preparation to
safely move the rigged spool where we:-
• Bring, inspect and connect all involved equipment such as the suction pump,
suction tank , all rated houses and fittings , and a containment system should a leak
happen ..etc.
• MSDS present for the test fluid, job procedure present and all personnel
involved in the dewatering operation present for a tool box talk to review the tasks for
each individual.
• All related work and safety permits filled out.
Step 2: Lifting the subsea rigged spool from the vertical position (after dewatering
operation is carried out) and placing and securing it in a transport frame in the
horizontal position.
• All equipment involved in this operation (cranes, forklifts, rigging
equipment...etc) must be inspected, certified and all must be working within their safe
handling loads with a proper safety factor added.
• All procedures (especially the support structural design plans, drawings and
metal support work) and work permits must be present and reviewed by the engineer
in charge on site and must be understood by all personnel taking part in the job.

36
• The sequence of the operation needs to be understood by all especially during
critical jobs such as during the lift, or during the supports welding operations when
only essential personnel must be present.
Step 3: Rigid Spool road gurney management operations:
In this final step to move the rigged spool from its SIT location to the sea port, after
the rigged spool has been dewatered and secured to a transportation frame in the
horizontal position, the following steps will be taken:
• The road route needs to be mapped, studied and confirmed so that no rigid
structural objects [bridges, electrical posts, trees ..etc] can become an obstacle in the
way, and alternative routes are to be planned if necessary .
• All local authorities need to be informed and approval from them must be
granted to proceed (local police, electrical company, city or town officials ,..etc) and
in most cases the police need to escort the spool convey and even give approved times
and dates for the move ( in most cases the spool is a wide transport item that requires
stopping traffic on 2 way roads.
• An operation meeting must be carried out with all involved parties, to review
procedures, permits and the game plan, and there must be good communication at all
times. ….
Example of logistics and land transportation operations as in Figure 8 ( By Hassan
Elfeki).

37
Figure 8 Land Transportation of Rigged Spool
2nd The transportation operations offshore to subsea field location:
At this point after the rigged spool has been successfully transported to the seaport we
start the next phase which is the transportation of the rigged spool via sea vessel (boat
or barge) to its offshore field location for deployment and installation. We follow the
following steps:
Step 1: The spool to be re-oriented to the vertical position and secured on its support
frame along with its lifting spreader beam and filled with its deployment fluid:
• All equipment (cranes, forklifts, rigging equipment..etc) inspected and
certified and checked for being within safe load capacity.

38
• All procedures (especially lift planes) and permits are to be present and
reviewed by all involved personnel.
• The spreader beam supports the entire spool during lifting and confirms the
spool balance.
• The spool is then filled with its deployment fluid, after all the equipment used
in this operation is inspected and certified. The deployment fluid is present with its
MSDS and a contingency plan is in place should a spill occur, and all the relevant
procedures and personnel involved are present.
Step 2: The spool to be secured on the barge or boat via sea designed support frame
and the gurney plan to the field offshore:
• The spool to be secured on the barge or boat via sea designed support frame
{strong back} and strapped down to the deck via the proper sea fasteners. All
equipment used to be certified and inspected.
• The maritime specialists along with the weather experts to determine the
acceptable weather timing; and sea conditions for the gurney to go to the field
offshore.
• Vessels exiting the port and the planned route must be presented to all
government and local authorities prior to the start of the gurney.
Example of offshore transportation on barges as in Figure 9 ( by Hassan Elfeki).

39
Figure 9 Offshore Transportation Of The Rigged Spool.
2.5 Subsea Rigid Spool Offshore Installation and Commissioning
Operations
The 3rd and last step in the Rigid Spool installation and commissioning operations
after the SIT have been carried out and the Spool has been transported from the SIT
facility to it location offshore is to pick up, submerge the Rigid Spool and lower it to
its location on the sea bed or in the glory hole in the field, install and connect it, and
then commission it by a series of tests before it enters its operational service. This will
take place via the following sub step:-
Step 1: Submerging the Subsea Rigid Spool and landing it in its right hubs.
• Remove pressure caps from the asset hubs, clean hubs and place a debris cap
in preparation to land rigid spool.

40
• Pick up the rigid spool via boat or barge crane and submerge over safe
handling zone, about 10 to 15 meters above the depth of the subsea assets.
• Remove the debris caps off both hubs and slowly move over the assets and
land the spool down on it proper hubs.
Step 2: Connect the rigid spool via CVC running tool to the hubs, locking them to
hubs and pressure testing the connectors.
• Bring down one end of the rigid spool connector to 50% of soft land, then
bring down the other end 100% and lock it to its hub, Then bring the 1st side down
the remaining 50% and lock it to its hub.
• Before unlatching the 2 CVC running tools, conduct a connector pressure test
to confirm the integrity of the gaskets and that is to be carried out on both connectors
to the designated pressures ( 3000 , 5000 psi , ..etc ) for the required time (10 , 15
min, ..etc) .
Step 3: Unlatch the two CVC running tools from both sides and retrieve them back to
the vessel .
• Hydraulically unlatch both CVC running tools and slowly lift each of them
one at a time to about 10 meters over the subsea assets.
• Once in the safe handling zone retrieve back to the surface and secure on the
deck of the vessel to send them back to port.

41
It is important to note here that this is a very simple and straightforward subsea spool
[Site Integration Test]. The spool here is just an underwater pipe connection, and
although such simple spools are built and used, most subsea rigid spools would be
built with other accessories such as sensors, flow meters , injection ports ..etc. which
would require more tests carried out in the SIT phase for each component to confirm
its integrity and functionality on the subsea rigid spool.

42
CHAPTER 3: METHODOLOGY OF RISK ASSESSMENT
AND MANAGEMENT
Hydrocarbon production from conventional oil and gas fields, whether from onshore
land fields or from offshore platform installations, are facing many challenges to keep
up with the global demand for hydrocarbons.
Therefore, the exploration and development of new oil and gas fields continue to
move towards deeper waters offshore known as subsea fields.
Such development of oil and gas subsea fields has helped in solving the hydrocarbon
growing demand issue.
As technology improves, the contribution from subsea fields will grow and the subsea
oil and gas production installations will become increasingly utilized to meet the
growing global demand for hydrocarbons.
These subsea production systems can range in complexity from a single satellite well
with a flow line linked to a fixed platform, FPSO or an onshore installation, to several
wells on a template or clustered around a manifold, which are transferred to a fixed or
floating facility, or directly to an onshore installation.
Subsea production systems can be used to develop reservoirs or parts of reservoirs,
which require drilling of the wells from more than one location. Deep water
conditions, or even ultra-deep water conditions, can inherently dictate the
development of a field by means of a subsea production system, since traditional
43
surface facilities such as a steel-piled jacket, might be either technically unfeasible or
uneconomical due to the water depth.
The development of subsea oil and gas fields requires specialized equipment. The
equipment must be reliable to safeguard the environment, and make the exploitation
of the subsea hydrocarbons economically feasible. The deployment of such
equipment requires specialized and expensive vessels, which need to be equipped
with human diving capability for relatively shallow water depths (i.e. up to a few
hundred feet depth of water at maximum), and robotic diving equipment such as
“ROVs” for deeper water depths.
Therefore, any requirement to repair, or intervene with, the pre-installed subsea
equipment is normally a very expensive operation. This can be summarized by stating
that the subsea oil and gas production systems are characterized by significant costs,
technical challenges and severe consequences of failure.
3.1 Methodology of Risk Assessment and Management
An integrated and holistic risk management system is essential for the successful
development, application and installation of subsea systems. For increasingly
complex risk-management programs to be fully effective, insurers need consistent,
qualitative, and wide-ranging information about risk (Virginia R. Prevosto 2014) .
The various subsea operations require a risk assessment and risk management system
that are capable of identifying and managing potential hazards, risk of underwater

44
leaks from live wells, economic risks associated with non-productive time, costs of
possible down times and unplanned events.
This study gives the decision maker in the field a tool to help him/her to assess and
manage risks associated with these operations, by providing accurate risk assessments
for each step in the operations. (Maryam Kalantarnia, 2009)
In this study, the main focus will be developing a risk assessment and risk
management framework to address specifically the hazards associated with the
commissioning, transportation, and the installation operations of a subsea rigid spool.
The framework developed can then be custom-built into a risk assessment and
management system that would be handed to the safety supervisor and/or the
operation engineer in charge. It is envisioned that the system would consists of a
number of modules containing the following:
Hazard Identification checklist (to identify the different scenarios that can
cause each hazard).
Hazard control checklist (to identify different control measures to prevent or
mitigate each identified hazard).
An engineered risk matrix. A risk matrix is a tool that multiplies the hazard
severity by the likelihood of such hazards. It is used to help the decision maker
to assess the associated risks in order to determine whether operations should
proceed, proceed with caution or come to a complete stop.

45
A hazard flow chart. The flow chart is used to show the identified hazards, the
different scenarios for a hazard to occur, the severity of the identified hazards
and the likelihood of occurrence of the identified hazards. Also it shows
whether to proceed or stop operations until the risk is reduced.
3.2 Steps of the Methodology
The method adopted in this study was to apply an integrated approach using various
risk perspectives.
The first step in the methodology is to lay out a detailed description of the sequence of
operations for a subsea rigged spool starting the initial site integration test. This is
carried out on the spool after the manufacturing phase is completed, before its final
commissioning in the offshore subsea field.
The second step is to identify the hazards associated with each step of this detailed
operational sequence.
The third step is to implement control means to eliminate or reduce the possibility of
hazards from happening or mitigate the incident’s consequences should they occur.
In the fourth step, the likelihood of occurrence for each hazard identified is estimated.
In the final step, after developing an associated Risk Matrix for the subsea rigid spool
of interest, a hazard flow chart is constructed.

46
3.2.1 Description of Operational Sequence
After the Rigid Spool has been completely built, there are 3 main operational
processes. They are carried out before the spool is installed at the final spot in its
subsea field. These three processes are as follows:
Step 1- Site Integration Test (S.I.T.)
Step 2 - Spool Logistics and Transportation from test sites to the Offshore
Field
Step 3 - Spool Installation and Commissioning Operations
Each step was explained in detail in Chapter 2.
3.2.2 Identifying the Hazards in Each Operational Step
A Hazard is defined as "a condition, event, or circumstance that could lead to or
contribute to an unplanned or undesirable event." [Principles of Risk-Based Decision
Making]. Seldom does a single hazard cause an accident. More often, an accident
occurs as the result of a sequence of causes. A hazard analysis will consider the state
of the system; for example, the operating environment, as well as failures or
malfunctions.
From the above definition, the possible hazards of each operational step and the
associated possible scenarios are identified.
Identified Hazards in Step 1 Site Integration Test:
1. Equipment Unavailability

47
Such a hazard will have crippling effects on the operation and will cause
costly delays. The scenarios for this hazard are:
Wrong equipment ordered for the job.
Equipment does not meet location specific technical requirements such
as available power rating.
Equipment held at customs due to improper customs papers.
Equipment unavailability due to late delivery.
2. Rigid Spool Lifting Incident during Vertical Positioning:
Before the spool body and piping pressure tests start, the spool needs to be
filled with the testing medium, water or MEG. In this process it needs to be
moved into the vertical position from its horizontal position. During this
move, there is a risk of a lifting incident happening, which could be caused by
one of the following scenarios:
Lift failure due to crane machine failure.
Lift failure due to incorrect, or absence of, a lift plan.
Lift failure due to human error.
Lift failure due to unknown weights (underestimation of the weight).
Lift failure due to failed rigging equipment.
3. Over Pressuring Spool Body during Hydro-test:
During a pressure test, there is always the risk of over pressuring which could
lead to devastating consequences.

48
A number of scenarios could lead to this:
Equipment pressure control system failure.
Human error applying the wrong pressure.
Identified Hazards in Step 2 Spool Logistics and Transportation from test sites to
the Offshore Field:
The transportation and the logistic activity, associated with moving the rigid spool
from its fabrication and test facility to its offshore field location, is accompanied with
a number of risks during its journey. These hazards are as follows:-
1. Hazards during preparation for the transportation via road:-
A spill during the dewatering operations.
A lifting incident during horizontal positioning.
Road accident during transportation to port.
2. Hazards during preparing rigid spool in port to be loaded on vessel:-
Lifting Incident during vertical positioning.
Spill during filling spool with submerging fluid.
Lifting Incident during positioning on the vessel.
3. Hazards during the offshore journey to subsea field:-
Rigid spool tipping to the side due to improper tie down to deck.
Rigid spool tipping down or hit by other object due to bad weather
during the trip to the field.
49
Hazards Identified during Step 3 Spool Installation and Commissioning
Operations:
This is the final step, where the subsea rigid spool reaches its offshore location. It is
picked up to be submerged at its final location on the sea bed or in the glory hole in
the field. It is then installed and commissioned by a series of tests before it enters its
operational life. During these operations a number of risks and hazards are identified
as follows:
1. Hazards identified in the pre-spool deployment phase.
Damage to Subsea assets during removal of CVC cap due to:
1. Trapped pressure in lines.
2. Lifting incident due to crane heave compensator failure.
Dropped objects on subsea assets during lowering or raising operations.
Undetected damage on CVC hub surface.
2. Hazards identified in the spool deployment phase.
Damage to spool while lifting from vessel by falling or striking other
fixed objects or equipment.
Damage to spool while trying to submerge.
3. Hazards identified during the phase of landing, locking and commissioning the
subsea spool.
Dropping the spool or any of its accessories.
50
Damage by striking any of the subsea assets while landing.
Damage to spool while making connection.
Dropping the CVC tools or any of the accessories on the subsea assets
while retrieving them back to surface.
From the above, a number of potential hazards have been identified at each
operational step. The development of hazard identification checklists can be made for
each of the identified potential hazards. These hazards checklists state the various
factors that would contribute to increasing the likelihood of an incident occurring.
The following (Figure 10) and (Figure 11) are two examples for a hazard checklist.
The first is for the factors that enhance the potential of a lifting incident/hazard. The
second is for the factors that enhance the potential of an uncontrolled pressure release
incident/hazard. These checklists are filled out by the safety engineer or operation
engineer before starting the job.
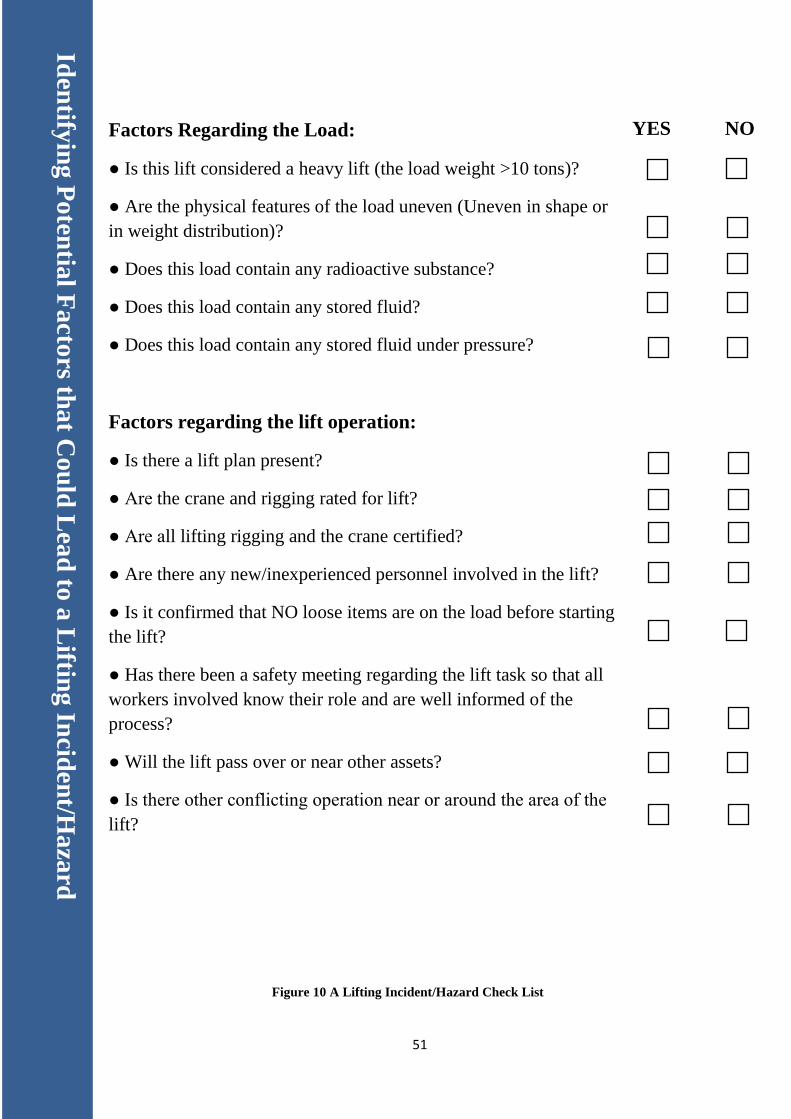
51
Iden
tifyin
g P
oten
tial F
acto
rs tha
t Cou
ld L
ead
to a
Liftin
g In
ciden
t/Ha
zard
YES NO
Factors Regarding the Load:
● Is this lift considered a heavy lift (the load weight >10 tons)?
● Are the physical features of the load uneven (Uneven in shape or
in weight distribution)?
● Does this load contain any radioactive substance?
● Does this load contain any stored fluid?
● Does this load contain any stored fluid under pressure?
Factors regarding the lift operation:
● Is there a lift plan present?
● Are the crane and rigging rated for lift?
● Are all lifting rigging and the crane certified?
● Are there any new/inexperienced personnel involved in the lift?
● Is it confirmed that NO loose items are on the load before starting
the lift?
● Has there been a safety meeting regarding the lift task so that all
workers involved know their role and are well informed of the
process?
● Will the lift pass over or near other assets?
● Is there other conflicting operation near or around the area of the
lift?
Figure 10 A Lifting Incident/Hazard Check List
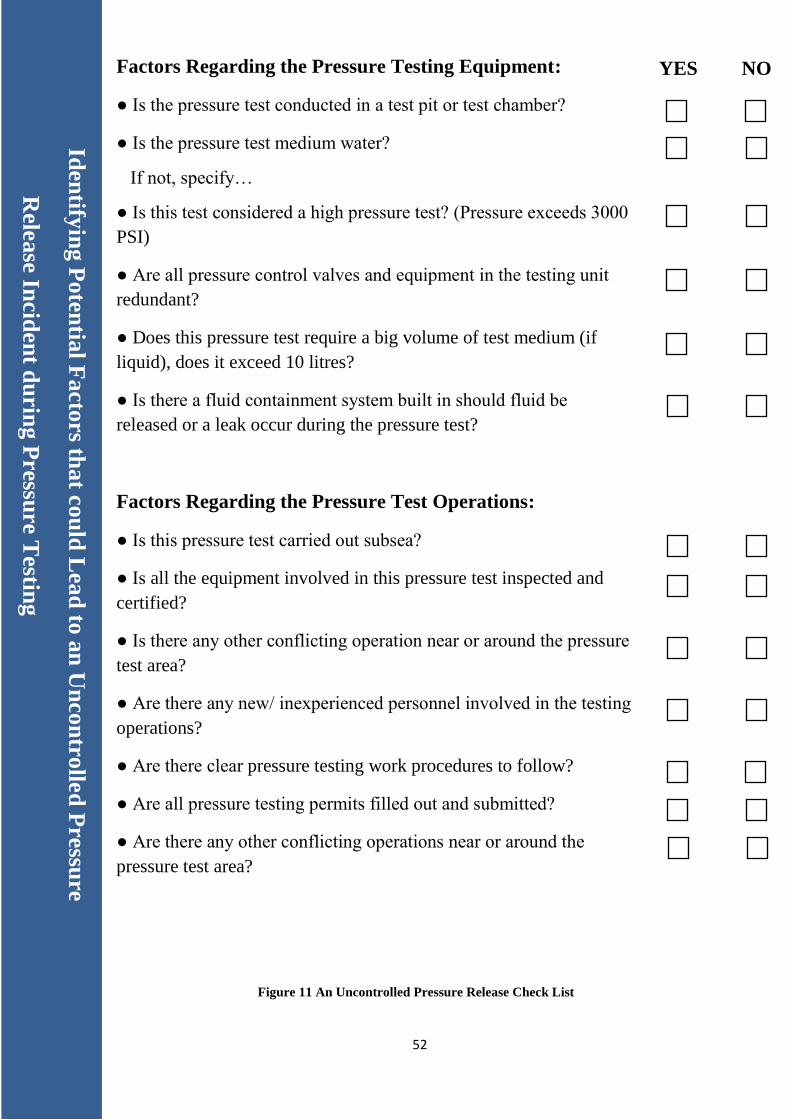
52
Iden
tifyin
g P
oten
tial F
acto
rs that c
ou
ld L
ead
to a
n U
nco
ntro
lled
Pre
ssure
Rele
ase In
ciden
t du
ring P
ressure
Testin
g
Factors Regarding the Pressure Testing Equipment:
● Is the pressure test conducted in a test pit or test chamber?
● Is the pressure test medium water?
If not, specify…
● Is this test considered a high pressure test? (Pressure exceeds 3000
PSI)
● Are all pressure control valves and equipment in the testing unit
redundant?
● Does this pressure test require a big volume of test medium (if
liquid), does it exceed 10 litres?
● Is there a fluid containment system built in should fluid be
released or a leak occur during the pressure test?
Factors Regarding the Pressure Test Operations:
● Is this pressure test carried out subsea?
● Is all the equipment involved in this pressure test inspected and
certified?
● Is there any other conflicting operation near or around the pressure
test area?
● Are there any new/ inexperienced personnel involved in the testing
operations?
● Are there clear pressure testing work procedures to follow?
● Are all pressure testing permits filled out and submitted?
● Are there any other conflicting operations near or around the
pressure test area?
YES NO
Figure 11 An Uncontrolled Pressure Release Check List

53
3.2.3 Identifying the likelihood of occurrences for the risks and hazards
associated with all three operational phases in the case study:
In the context of hazard identification, risk assessment and loss prevention, the term
“likelihood of occurrence” gains its most importance. This is because it is a decisive
factor in the mitigation process. Knowing the probability or likelihood of occurrence
of a certain hazard will determine how to address it.
In this study we use an integrated approach in which a number of methods are
combined to determine the likelihood of occurrence for each anticipated hazard.
These methods are as follows:
Judgments made by expert groups and people with special competence.
Their judgments of the likelihood of a matter are based on former
experience of such operations.
Observational data (facts) from statistical historical records for
incidents occurring during similar operations.
Perceived risk information on certain equipment used; for example, the
probability of a crane failure due to hydraulic failure or human error.
Also, how that probability would change when the crane’s life nears its
maximum capacity. The same goes for equipment such as the
hydraulic pressure unite. The manufacturer will have information on
the reliability of the equipment, the probability of failure, and “factors
affecting” such probability.

54
The following are examples of implementing such tools to determine the likelihood of
occurrence of a number of possible hazards, associated with the three spool
operational phases of this study.
Likelihood of occurrence for a hazard in step 1 [site integration test]:
For example, the likelihood of occurrence for over pressuring the spool body during
the hydro-test can be determined at a particular spool at a particular site by the
following:-
A technical review of the hydraulic pressure unit used to pressure the spool
body. The manufacturers recommendations in terms of reliability of the
system components and weather tests are needed on the testing unit. As a
result, we can estimate the likelihood of equipment failure leading to over
pressuring the spool body.
Groups of experts or people with experience to evaluate the site and the
technicians carrying out the job, using their experience to determine the
likelihood of a human error leading to over pressuring the spool body.
Reviewing actual cases of spool body over pressuring that took place in the
most recent period spectrum [5 years as an example] compared to the total
number of similar operations carried out.
According to the above methods, we can come up with estimated likelihood of
occurrence value for over pressuring a rigid spool, during a spool body hydro- test at a
certain location.

55
Likelihood of occurrence for a hazard in step 2 Spool Logistics and
Transportation from test sites to the Offshore Field:
The example is the likelihood of occurrence for a road accident during the
transportation of the spool from the SIT site to the seaport, and this would be
determined as follows:-
Groups of experts or people with experience to evaluate different routes and
conditions from site to port, and the likelihood of accidents due to striking
fixed or moving objects.
A revision to the actual cases of road accidents for a wide load while moving
the rigid spool over a certain period of time, as well as the statistical times of
these accidents [ day , night ], and [ summer , winter ].
A review of the accident history of the transport company, by tracking both
the driver’s driving history and the company’s fleet accident history.
From the above methods we can come up with estimated likelihood of occurrence
value for a road accident involving the transportation of a rigid spool from a certain
S.I.T location to the seaport .
Likelihood of occurrence for a hazard in step 3 Spool Installation and
Commissioning Operations:
The example is the likelihood of occurrence for an incident of a rigid spool striking
any of the other subsea assets while landing the spool in the designated place , which
could occur due to a number of scenarios as follows :-

56
Technical review of the vessel crane heave compensator and loading cells
malfunction probability, and the vessel dynamic positioning DP system and its
probability of a malfunction during operations.
Experts groups or people with experience to evaluate the subsea field layout
and the initial work procedures to determine the likelihood of the spool
striking another subsea asset.
A revision of similar incidents where subsea assets collided subsea during the
installation phase.
Using the tools stated above, the implementation of probability theory as a common
technique and to avoid mathematical complexity in the analytical methods of
probability theory ,the Monte Carlo simulation is also a preferable method to use to
address uncertainties due to randomness in the estimates of input parameters (events
probability) Hammonds et al., 1994.
An assessment is carried out to determine the likelihood of occurrence associated
with different events during the different operations carried out on the subsea rigged
spool where the following likelihood of occurrences was conceived :-
1:- happens once in every 10 operations. 0.1.
2:- happens once in every 100 operations. 0.01.
3:- happens once in every 1000 operations. 0.001.
4:- happens once in every 10000 operations. 0.0001.
5:- happens once in more than 10000 operations > 0.0001.
57
To aid the field supervisors and the decision makers in the field in determining the
likelihood of occurrence of the different hazard scenarios in different operational
conditions an engineered likelihood of occurrence checklist is created for different
hazards and for different operational conditions to guide the decision maker in
determining the accurate likelihood rank for each case. Such likelihood of occurrence
checklists can be created for :-
Different lifting hazards scenarios.
Different transportation hazards scenarios.
Different pressure release hazard scenarios.
…etc.
Please see (Table 1) as an example of a likelihood of lifting incident hazard
occurrence checklist.
The colors in table 1 refer to:
Green: It’s safe to proceed with operation.
Light Green: It’s safe to proceed with operations with caution.
Yellow: Take caution before you proceed with operations.
Orange: Operation need to be stopped to lower risk levels.
Red: Operations need to come to an immediate stop to address the high risk issue.

58
Table 1 Likelihood Of Lifting Incident & Hazard Occurrence Check List.
Lik
elih
oo
d o
f O
ccu
rren
ce o
f a
Lif
tin
g I
nci
den
t d
uri
ng
Lif
tin
g O
per
ati
on
s
Scenario 1 3 5 7 10
Lift is 0 – 60% of crane safe work capacity or
rigging capacity. X
Lift is 60 – 90% of crane safe work capacity
or rigging capacity.
X
Lift is 90 – 110% of crane safe work capacity
or rigging capacity.
X
Crane and/or rigging are not certified while
lifting a load 0 – 60% of crane safe work
capacity.
X
Crane and/or rigging have no up to date
certification while lifting a load 60 – 90% of
crane safe work capacity.
X
Crane and/or rigging have no-up-to date
certification while lifting a load 90 – 110% of
safe work capacity.
X
If two unsafe conditions such as [No Lift
Plan , Uneven lift , No certification for
crane or rigging , inexperienced crane
operator or personnel ..etc] occurred
during the same single lift and if :-
The load is 0 – 60% of crane safe work
and/or rigging safe capacity.
X
The load is 60 – 90% of crane safe work
and/or rigging safe capacity.
X
The load is 90 – 110% of crane safe work
and/or rigging safe capacity.
X
If crane is on an offshore vessel and
current sea waves are above 3m or wind
above 40 knots while:
The lifts are 0 – 60% of crane safe work or
rigging safe work capacity.
X
The lifts are 60 – 90% of crane safe work or
rigging safe work capacity.
X
The lifts are 90 – 110% of crane safe work or
rigging safe work capacity.
X

59
3.2.4 Consequence Assessments
Consequence assessments are carried out to identify the effects of an aftermath of a particular
incident and therefore they show the result of harm or damage that would come about in case a
particular hazard happens. The importance of hazard consequence assessments comes from the
fact that by understanding what’s at stake should a particular hazard happen one can develop
better risk mitigation strategies.
To determine the consequences of the occurrence of a particular hazard, the following
information is needed:
Cost information for all elements involved in each operation such as equipment costs ,
labor costs , site costs , equipment rental costs, etc.
Cost information for fines for delays, downtime, etc.
Cost of possible environmental damage, associated legal costs, cost of lost production,
worker compensation costs, etc.
The history of similar incidents that happened due to similar hazards and the total losses
from such incidents.
Using the sum of the above different methods the following are a number of examples of
implementing such tools to determine the consequences resulting from a number of possible
hazards associated with the three spool operational phases of this study.
The consequences of a hazard occurrence in Step 1 Site Integration Test:
Examples of the potential consequences a lifting incident involving a rigid spool during the SIT
phase using the methods stated above are the following:-
60
The complete loss of the spool itself (which could cost anywhere from a few hundred
thousand USD to a few million USD).
Damage to the crane (which could result in the cost of thousands of USD).
Damage to other assets close by that might be struck (which could costs thousands of
dollars).
The cost of down time of operations due to a damaged spool (workers’ pay , site fees ,
rental equipment cost, ..etc ).
From the above example it’s clear how this hazard results in heavy financial consequences, and
that is without taking into account the consequences in terms of workers getting injured or killed.
The consequences of a hazard occurrence in Step 2 Spool Logistics and Transportation
from test sites to the Offshore Field:
In this phase the example also studies the consequences of a lifting incident of a rigid spool but
during the spool loading on the vessel where the consequences could result in a far greater loss,
as follows:-
The complete loss of the spool itself (which could cost anywhere from a few hundred
thousand USD to a few million USD).
Damage to vessel, its crane or other assets (could be in terms of hundreds of thousands of
USD).
Down time of the vessel which could reach up to a few hundred thousand USD per day.
Down time for the project as a whole and the delay to reopen the subsea oil field which
could be up from hundreds of thousands to a few million USD per day.
61
Like the previous example, this consequence estimation does not take into account the
consequences of workers getting injured or killed.
The consequences of a hazard occurrence in Step 3 Spool Installation and Commissioning
Operations:
This is the most critical and dangerous phase of the operation. In this phase a number of
operations are done above subsea oil fields and an incident here can be catastrophic, In the case
of the rigid spool striking another subsea asset during installation, the following consequences
may occur:-
Damage to the subsea spool and other already installed subsea assets [ the costs would in
millions of USD].
The possibility of a subsea oil spill as a result from the spool striking another subsea asset
[the costs here would be overwhelming and could run into tens or even hundreds of
millions of USD].
Best case scenario: No spill, but the costs to test and confirm equipment integrity would
cause a delay that could stretch to a few days or even weeks, causing losses that could
reach millions of USD.
The above consequence assessment studies give us a better understanding of what’s at stake , so
using the tools listed above to carry out an assessment to determine the severity of the
consequences associated with a subsea rigid spool operation, the following severity levels were
conceived :-

62
1:- An event that would result in equipment’s extreme damage [while offshore] and would cause
complete offshore operational shutdown for a considerably long period of time, with estimated
financial losses per day exceeding $1,000,000 USD.
2:- An event that would result in equipment’s partial damage [ while offshore ] and would cause
partial or complete offshore operational shutdown for a short period of time ,with an estimated
financial loss per day between $ 500,000 and $ 1,000,000 USD .
3:- An event that would result in equipment damage [while onshore ] causing facility operational
shutdown for a considerably long period of time and would directly have a negative effect on
offshore operations work schedules resulting in down time, with estimated financial losses per
day between $ 100,000 and $ 500,000 USD .
4:- An event that would result in equipment damage [while onshore] causing facility shutdown
but with little to no effect on the offshore operations with an estimated financial loss per day of
between $ 10,000 and $ 100,000 USD .
5:- An event that would result in equipment partial damage [while onshore] causing operational
delays but with no effect on the offshore operations, with an estimated financial loss per day to
be less than $ 10,000 USD.

63
3.2.5 An Engineered Risk Matrix for the study.
As safety is more than observations alone, it was necessary to see behind the data and
incorporate additional aspects related to risk perception. To have the full risk picture
established in a comprehensive way. A broad perspective is required, therefor the following
are needed:
Risk analysis descriptions
Observational data (facts)
Judgments made by people with special competence
Perceived risk information
Expert groups
This can be summarized in three categories of data which provide different types of
information that we can use:
Losses expressed
Hazardous situations expressed
Events and conditions on a more detailed level reflecting technical organizational and
operational factors leading to hazards
In this study we used all the above to build a Risk Matrix for the risk assessments and
risk management associated with commissioning, transportation, and installation operations
of the subsea rigid spool.
The risk matrix has two main axes: hazard severity (an assessment based on the
consequences), and the likelihood of such hazards to happen (likelihood of occurrence).

64
By using the above two factors we create a risk matrix which is a tool made to aid the
decision maker during the execution of the different phases of the Subsea Spool
commissioning and installations operations.
See the Risk Matrix diagram in Table 2.
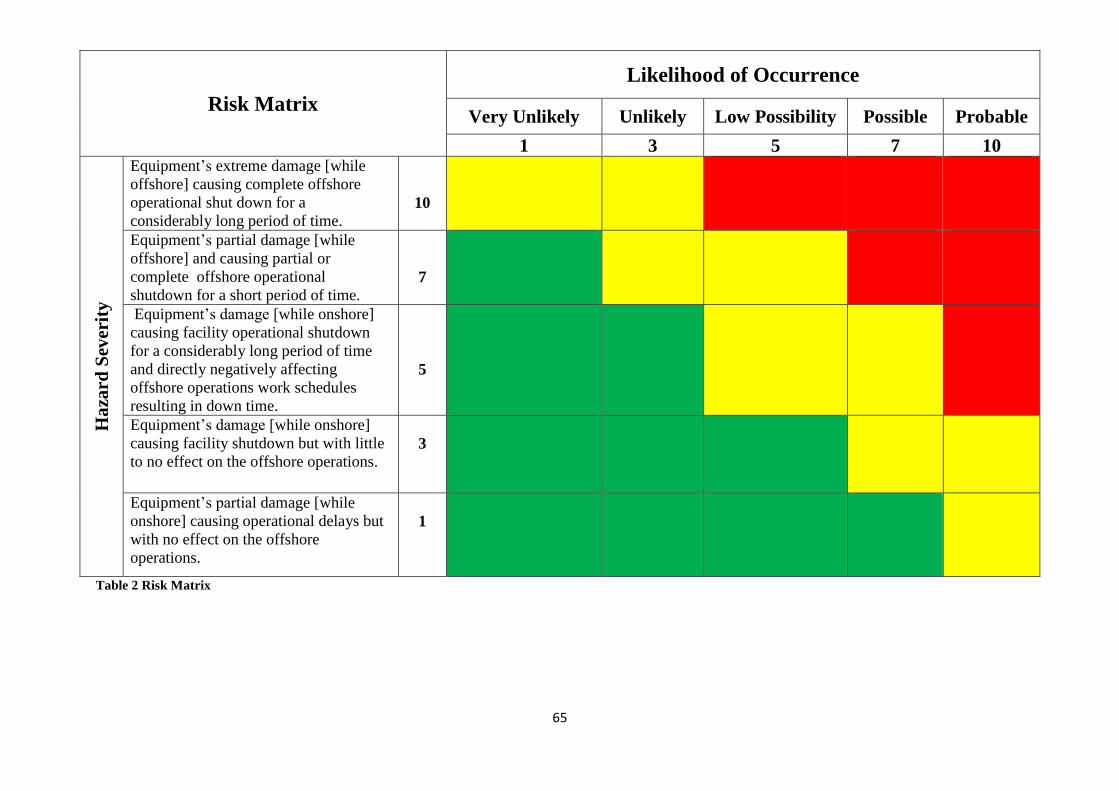
65
Table 2 Risk Matrix
Risk Matrix
Likelihood of Occurrence
Very Unlikely Unlikely Low Possibility Possible Probable
1 3 5 7 10
Ha
zard
Sev
erit
y
Equipment’s extreme damage [while
offshore] causing complete offshore
operational shut down for a
considerably long period of time.
10
Equipment’s partial damage [while
offshore] and causing partial or
complete offshore operational
shutdown for a short period of time.
7
Equipment’s damage [while onshore]
causing facility operational shutdown
for a considerably long period of time
and directly negatively affecting
offshore operations work schedules
resulting in down time.
5
Equipment’s damage [while onshore]
causing facility shutdown but with little
to no effect on the offshore operations.
3
Equipment’s partial damage [while
onshore] causing operational delays but
with no effect on the offshore
operations.
1
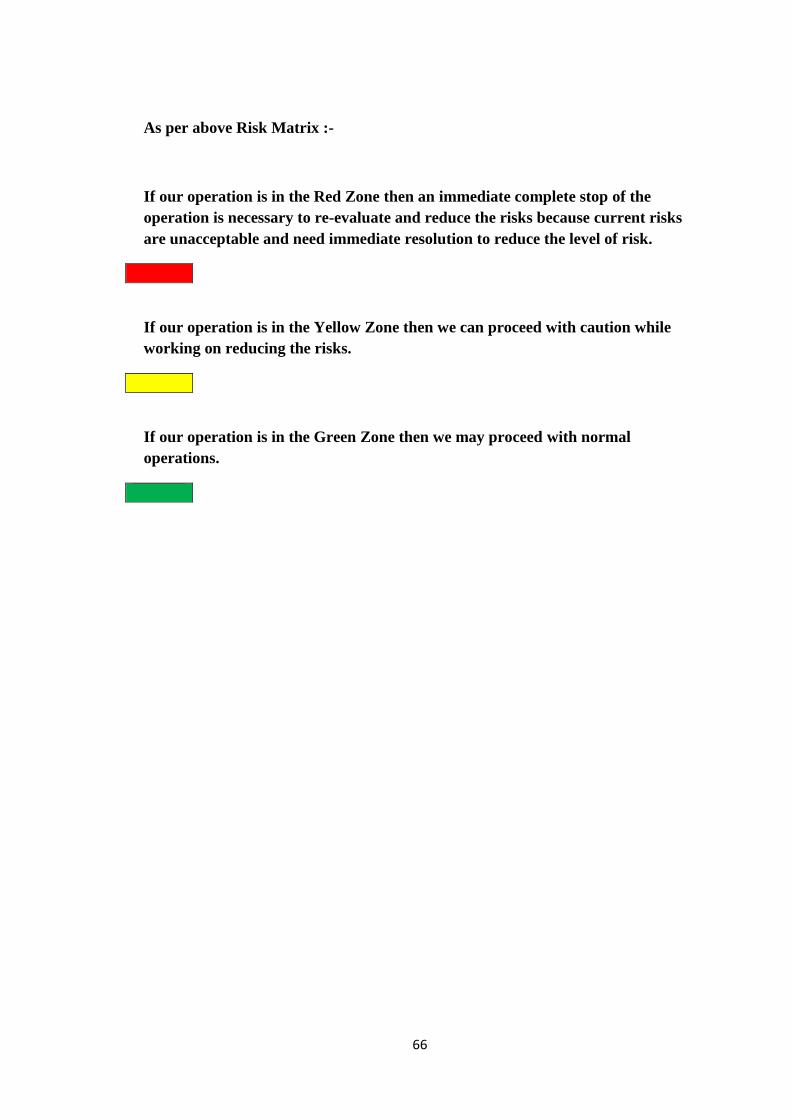
66
As per above Risk Matrix :-
If our operation is in the Red Zone then an immediate complete stop of the
operation is necessary to re-evaluate and reduce the risks because current risks
are unacceptable and need immediate resolution to reduce the level of risk.
If our operation is in the Yellow Zone then we can proceed with caution while
working on reducing the risks.
If our operation is in the Green Zone then we may proceed with normal
operations.
67
3.3 Control Tools Used to Prevent and/or Mitigate Hazards
Should the field supervisor or field safety engineer, after using the study here, find
that the risk matrix ranking for his upcoming operation is in the Red Zone; then an
immediate complete stop to the operation is necessary. Risks must be re-evaluated
and reduced when current risk levels are unacceptable and need immediate resolution
to reduce the level of risk. Such reduction is done in one of two ways. The first is to
reduce the likelihood of occurrence of the hazard, and the second way is to attempt to
reduce the severity of the consequences should an incident occur. In the study here, an
engineered checklist is developed to be used as a control tool to prevent and /or
mitigate the hazard. Such lists are developed for the different hazards and are created
by using the expertise and judgment calls made by expert groups and people with
special competence. These experts judge of the likelihood of a matter based on former
experience with such operations, and they also give out means and steps which must
be taken to reduce the probability of occurrence of such hazardous incidents.
See (Figure 12) and (Figure 13) as examples of such checklists.

68
Figure 12 Control Means To Reduce Potential Pressure Release Checklist
Control Tools:
● An approved work procedure present before starting the job
● Effective communications and permit to work in place, clear
escape routes, and good housekeeping
● Pre-operation meeting held with senior engineer or experienced
technician in charge
● MSDS present for the test medium used in the pressure test (if
applicable)
● Emergency response plans in place should an incident occur
● Barricade the test zone with barriers and signs
● Assurance that all testing equipment (hoses, fittings, pumps, etc.)
are certified and suitable for the rated pressure testing
Co
ntro
l Too
ls to P
reven
t or M
itigate th
e Po
tentia
l of a
n U
nco
ntro
lled
Pressu
re Relea
se Incid
ent d
urin
g T
esting
USED

69
Co
ntro
l Too
ls to P
reven
t or M
itigate th
e Poten
tial o
f a L
ifting In
ciden
t / Ha
zard
Control Tools:
● An Engineered lift plan in place.
● An MSDS is present for all fluids in items being lifted.
● Full certification for all lifting rigging used in the lift.
● Pre-operation meeting held with experienced lead personnel in
charge.
● Final check carried out to ensure there are no missing or
unfastened items before lift.
● Weather conditions, time of day and mental and physical
conditions of workers involved taken into account.
● Emergency response planes in place should an incident occur
● Is there a need to complete any extra work permits (working at
heights, handling hazardous materials, etc
USED
Figure 13 Control Means to Reduce Potential Lifting Hazard Checklist

70
3.4 Risk Assessment Flow Chart
A risk assessment flow chart is developed to aid the field safety engineer or field
supervisor to determine whether risk levels are acceptable or not. The chart is filled
out using the data utilized from the lists and tables that have been described above.
For each hazard the safety engineer or person in charge would be reviewing:
Hazard likelihood checklist.
Risk Matrix Table.
Hazard prevention and/or mitigation checklist.
If the risk flow chart is initially completed and, if the risk matrix rank is acceptable,
then it’s safe to proceed to the next step of the operations. If the matrix is not at an
acceptable level, then steps will be made to reduce the likelihood that an incident will
occur, or the consequences of the incident, should it occur, or reduce both according
to the circumstances of each case. An example is shown in Figure 14.

71
Risk Assessment Flow Chart
Scenario 1 Scenario 2
Figure 14 Risk Assessment Flow Chart.
Different Scenarios for Hazard Occurrence
Hazard Identified
Consequences Severity Rank
New Severity Rank
Likelihood of Occurrence Rank
New Rank
If
Unacceptable
Measures
taken to
reduce the
possible
consequences
Risk
Acceptable
Move to Next Step
tep
Measures
taken to
reduce the
likelihood of
occurrence
1st Possible Scenario causing
Hazard
If
acceptable
New Risk Matrix
Acceptable Rank
Move to Next Step
tep
Scenario (N)
Risk Matrix
Rank

72
3.5 Summary
The proposed study develops an integrated approach to identify and manage the risks,
during the execution of the different operational phases carried out on the subsea rigid
spool. The operational phases are from the point the subsea spool is completely
fabricated to the final operation steps, when it is installed and commissioned in its
subsea slot in its designated subsea field offshore.
The final product of this study will be an uncompleted risk flow chart and a risk
matrix table, along with a set of checklists custom built for the operations carried out
by the subsea rigid spool. These documents will be handed over to the safety engineer
in the field and/or the operational supervisor in charge of the operation. The
documents will enable them to have a better understanding of the actual risk level the
operation faces and give them the tools to reduce such risks, if they are at an
unacceptable level.
73
CHAPTER 4: IMPLEMENTATION OF THE PROPOSED
METHODOLOGY IN A CASE STUDY
The implementation of the proposed study to develop a risk assessment and risk
management system will be applied to a case study presented in this chapter. Risk
assessment and risk management systems will be used to address the risks associated
with the different operational phases of the subsea rigid spool.
The identification and assessment of risks will be followed by a feasible approach to
minimize and control the probability and/or impact of any unfortunate events, in
addition to the ability to prevent such unfortunate events from occurring and to have a
mitigation plan should they happen.
The risks of unfortunate events happening during the subsea spool life cycle are
always present, starting from the spool’s site integration tests, to the transportation to
its offshore field along with all related logistics operations involved , to the final
submerging and installation process of the spool subsea in its position in the subsea
field offshore. Such risks and unfortunate events can vary with accidents either due to
equipment failure, human error, design errors or as a result of disasters created by
natural causes, such as extreme weather conditions or legal liabilities, as well as
events of uncertain or unpredictable causes.
4.1 Application of Thesis on Subsea Rigid Spool Operations.
The overall objective of the research is to address the hazards facing the different
stages of Subsea assets operations from the site integration phase till the final
installation in their subsea fields offshore and to develop a risk assessment and risk
74
management approach that can be utilized specifically for subsea assets, where the
specific focus is on Subsea Rigid Spool operations.
After the methodology was explored in chapter 3, in this chapter the application of
this study will be demonstrated on a particular hazard in one of the operations of the
subsea rigid spool and show by implementing such techniques the improvement made
to the risk assessment and risk management of our operation to reduce the possibility
of an incident from happening and to have mitigation measures in place to address
such events should they happen, by knowing the potential consequences regarding
their magnitude and affect should they happen.
To give a better idea of how this study would significantly reduce the probability of
incidents occurring and its impacts on reducing the negative effects should an
undesirable incident occur with more information about the realistic consequences of
the existing risks and having a mitigation plan in place, below is a demonstration of
an actual accident that occurred with a subsea rigid spool while in the SIT phase in
Newfoundland –Canada in the year 2010, the consequences this incident had , and
how the application of this study in such operations would improve the overall risk
assessment and risk management process .
4.2 Case study of a lifting accident involving a Subsea Rigid Spool at a
Fabrication Facility on July 19, 2010
4.2.1 Incident Summary:
On July 19, 2010, a crane commenced lifting a subsea spool (CP3). Please see the
attached diagram of the spool. (Figure 15) Husky Investigation Report 2010 .

75
The lift was from its testing location on fabrication stands at a fabrication facility to
another location on transportation stands at the same fabrication facility for additional
work when the crane tipped onto its right side dropping the spool. The crane tipped
over completely. Please see (Figure 16) By Hassan Elfeki.
The subsea spool contained a Multi-Phase Flow Meter (MPFM) and its 1.11 GBq C-
137 radioactive source. Please see (Figure 17) By Hassan Elfeki.
Department of Occupational Health & Safety investigators have conducted an
investigation in the incident.
This incident had the potential to result in serious personal injury or fatality to the
crane operator and other workers in the immediate vicinity of the crane and its boom.
This incident also had potential to have more environmental impact if more hydraulic
fluid and/or fuel had been spilled on the ground.
This incident had potential to destroy the rigid spool, running tool and the MPFM. If
the MPFM had been damaged this could have led to the C-137 – 1.11GBq radioactive
source housing being compromised resulting in radiation exposure.
If the impact of this incident had been greater, there would have been more local and
regional media coverage, [ Husky Investigation Report 2010 ]* .

76
Figure 15 Spool Diagram

77
Figure 16 Tipped Over Crane
Figure 17 Tipped Over Rigged Spool

78
An investigation report was launched to determine the root cause of the incident. On
July 19, 2010.The scope of this incident investigation stated that: During lifting of the
spool, the crane tipped over, resulting in property damage and multiple high potential
near misses.
4.2.2 Incident Investigation Overview:
The investigation into the incident was conducted by assembling a team of qualified
personnel to confirm the root cause of the incident and provide recommendations to
prevent re-occurrence.
4.2.3 Incident Description:
At approximately 1557hrs NST on July 19, 2010, a 170 ton crane commenced lifting
a subsea spool (CP3) from its testing location on fabrication stands at a fabrication
facility to another location on transportation stands at the fabrication facility for
additional work when the crane tipped onto its right side dropping the spool. The
crane tipped over completely. The subsea spool contained a Multi-Phase Flow Meter
(MPFM) 1687.08 with its 1.11 GBq C-137 radioactive component.
On July 15, 2010, DCH Crane Rentals (DCH) was contacted by the fabrication
facility to complete a lift of the subsea spool (CP3) which the fabrication facility was
contracted by the oil company to fabricate. The spool was engineered by a 3rd
party
engineering firm. The lift was originally planned to occur on the afternoon of July 16,
2010, but because of crane unavailability the lift was rescheduled to July 17, 2010.
Prior to the July 17, 2010 lift, the HSE Advisor from the fabrication facility developed
a job safety analysis (JSA) and presented it to all those involved with the lift on the
79
morning of July 17, 2010. The lift was unable to be completed on that day as a bolt
on one of the Cameron supplied running tools [ CVC tool ] had sheared off two times
before it was determined that the cause of the shearing was due to not having the
required funnel guide on the running tool. The oil company representative and the 3rd
party engineering firm observer decided to halt operations for the day and continue
the lift on Monday, July 19, 2010. The crane remained on site.
Sometime during the morning of July 19, 2010, there was an informal toolbox talk by
the lift foreman. All those who would be involved in the lift were present except for
one fabrication facility employee who was added to the job scope just prior to the
final lift. Just after 1330 hrs NST the crane operator, having discussed the lift with
the lift foreman, did a dry run of the final lift with no load. The crane operator was
told that the weight of the entire lift would be “just over 40,000lbs”. He cannot
remember who told him this. He decided to use 41,000lbs as his value for
determining load capacity on his charts. It is now known that the actual weight of the
lift was 42,316.45lbs.
The first lift was completed, which consisted of lifting CP3 off the fabrication stands,
moving it approximately 10 to 15 feet to the operator’s left and suspending the load
about 3 to 4 feet from the ground until an employee from a surveying 3rd
party
company had completed the survey work. The load was then returned to the
fabrication stands to ensure that the rigid spool had not twisted during the lift. After
confirming that no twisting had taken place by the base with which CP3 was fitted
back on the fabrication stands, the crane operator was then ready to begin the final lift
to the transportation stands.

80
Just prior to the start of the final lift, one of the transportation stands was moved from
the roadway where they were originally placed to a location which would make
barricading the MPFM more efficient. The crane operator did not check this new
distance as he was already supporting the weight of CP3 when the move occurred.
No one involved in the lift felt that this change in location would make a difference to
the lift. It is now known that the original placement of the transportation stands
resulted in the radius of the lift over the side of the crane to be approximately 36 feet,
well within the 46 feet limit the crane operator was using. The new placement of the
transportation stand placed the radius at approximately 53 feet.
To begin the lift, the lift foreman stood between the load and the crane, with his back
to the crane so he could direct the tag line holders on how to respond to the movement
of CP3 and also give the signal person direction on which signals to give the crane
operator. After moving CP3 past the rear quadrant and into the side quadrant of the
crane (approximately 25-30 degrees further than the first lift), CP3 was about three
feet above the transportation spools when workers noticed that it was dropping
quickly and had passed the intended target. Just prior to the workers noticing this
quick lowering of the load, the crane operator felt the crane rock from side to side and
was attempting to lower the load as fast as he could in an effort to prevent the crane
from tipping. The signal person, who was the only person not focused on the load but
rather on the crane, observed the outriggers retracting each time the crane tipped
towards the load side.
The crane operator was not able to lower the load fast enough, and with the retracted
outriggers, the crane tipped over with the boom landing on the running tools. The
81
crane operator did not leave the cab of the crane until the crane had come to a stop
and as a result did not sustain any physical injuries. Due to the boom landing on the
running tools, the MPFM was untouched and after a survey of the area was completed
by the Authorized Worker, it was determined that the source housing had not been
compromised.
4.2.4 Root Cause Analysis:
The oil company has adopted the Tap-Root process for conducting formal root cause
analysis. A Tap-Root analysis was performed for this event. The tools used included
the Snap-Chart event tree format which recreated the sequence of events that
transpired leading up to and following the incident.
The sequence of events was then analyzed to determine the causal factors leading to
the identification of the root causes of the incident.
The following Table 3 details the causal factors and associated root causes pertaining
to the incident:

82
Causal Factor #A: No Lift Plan Used/Developed
Human Performance
Difficulty
Quality Control – No Inspection – Inspection Not Required
Communications – No Communication or Not Timely (near
root cause)
Management System – Standards, Policies or Admin.
Controls (SPAC) Need Improvement – No SPAC
Management System – SPAC Not Used – Accountability
Needs Improvement
Work Direction – Preparation – Work Package/Permit Needs
Improvement
Table 3 Causal Factor #A
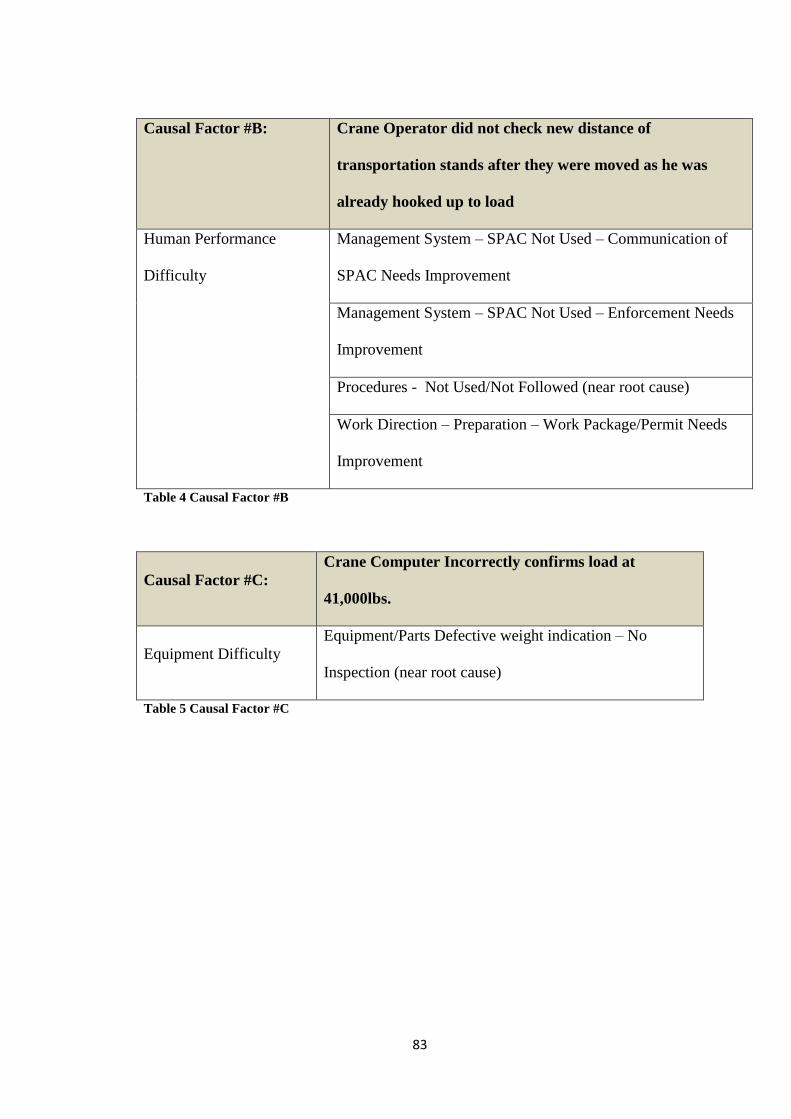
83
Causal Factor #B: Crane Operator did not check new distance of
transportation stands after they were moved as he was
already hooked up to load
Human Performance
Difficulty
Management System – SPAC Not Used – Communication of
SPAC Needs Improvement
Management System – SPAC Not Used – Enforcement Needs
Improvement
Procedures - Not Used/Not Followed (near root cause)
Work Direction – Preparation – Work Package/Permit Needs
Improvement
Table 4 Causal Factor #B
Causal Factor #C:
Crane Computer Incorrectly confirms load at
41,000lbs.
Equipment Difficulty
Equipment/Parts Defective weight indication – No
Inspection (near root cause)
Table 5 Causal Factor #C

84
4.2.5 Corrective Action Recommendations:
Table 6 outlines the actions that are intended to address the root causes of the
incident. It is recommended by the oil operator that consideration for each action be
given and rationale be provided where actions are not amended or not completed by
the recommended completion date.
Corrective Action
Recommendation Causal Factor Root Cause
1. A Standard,
Policy or
Administrative Control
(SPAC) to be
developed for onshore
lifts which includes but
is not limited to:
criteria for the
development of a lift
(or a guideline for non-
critical lifts such as a
checklist); quality
control checks to
ensure lift plan is being
followed; management
of change; and
responsibilities and
authorities for onshore
lifts as they pertain to
development and
execution of the plan.
No lift plan used/
developed
Quality Control - No Inspection –
Inspection Not Required
Communications – No
Communication or Not Timely
(near root cause)
Management System – SPAC
Needs Improvement – No SPAC
Management System – SPAC Not
Used – Accountability Needs
Improvement
Work Direction – Preparation -
Work Package/Permit Needs
Improvement
Crane Operator
did not check
new distance of
transportation
stands after they
were moved as
he was already
hooked up to
load
Procedures – Not Used/Not
Followed (near root cause)
Work Direction – Preparation –
Work Package/Permit Needs
Improvement
2. Specific
accountabilities,
expectations and chain
of authority for
onshore fabrication and
fabrication …(cont.)
management are
No lift plan
used/developed
Communications – No
Communications or Not Timely
Management System – SPAC
Not Used – Accountability Needs
Improvement
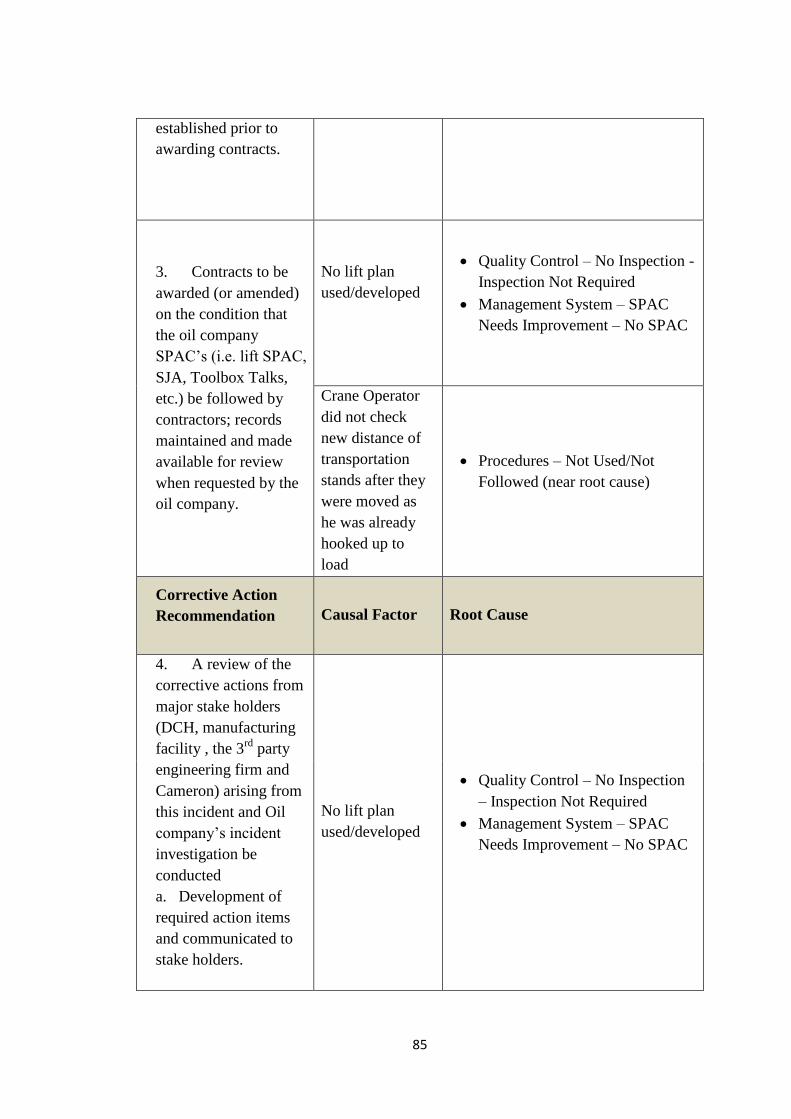
85
established prior to
awarding contracts.
3. Contracts to be
awarded (or amended)
on the condition that
the oil company
SPAC’s (i.e. lift SPAC,
SJA, Toolbox Talks,
etc.) be followed by
contractors; records
maintained and made
available for review
when requested by the
oil company.
No lift plan
used/developed
Quality Control – No Inspection -
Inspection Not Required
Management System – SPAC
Needs Improvement – No SPAC
Crane Operator
did not check
new distance of
transportation
stands after they
were moved as
he was already
hooked up to
load
Procedures – Not Used/Not
Followed (near root cause)
4. Corrective Action
Recommendation Causal Factor Root Cause
5. 4. A review of the
corrective actions from
major stake holders
(DCH, manufacturing
facility , the 3rd
party
engineering firm and
Cameron) arising from
this incident and Oil
company’s incident
investigation be
conducted
6. a. Development of
required action items
and communicated to
stake holders.
No lift plan
used/developed
Quality Control – No Inspection
– Inspection Not Required
Management System – SPAC
Needs Improvement – No SPAC
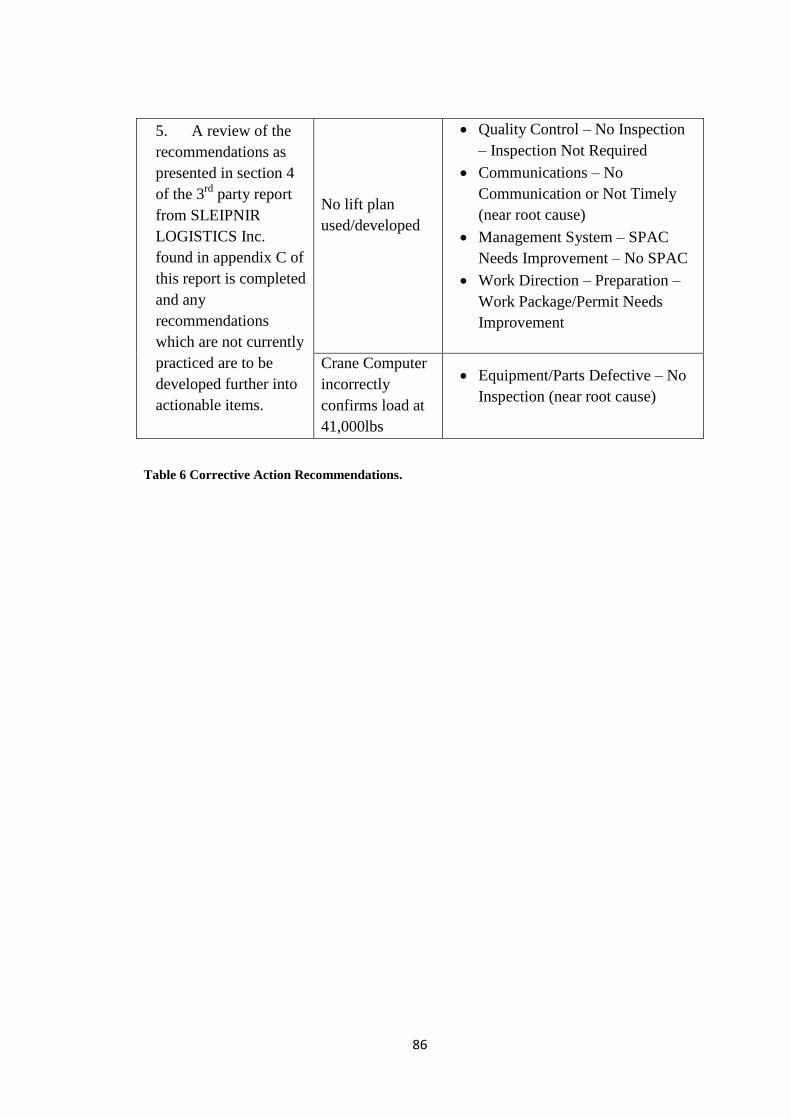
86
7. 5. A review of the
recommendations as
presented in section 4
of the 3rd
party report
from SLEIPNIR
LOGISTICS Inc.
found in appendix C of
this report is completed
and any
recommendations
which are not currently
practiced are to be
developed further into
actionable items.
No lift plan
used/developed
Quality Control – No Inspection
– Inspection Not Required
Communications – No
Communication or Not Timely
(near root cause)
Management System – SPAC
Needs Improvement – No SPAC
Work Direction – Preparation –
Work Package/Permit Needs
Improvement
Crane Computer
incorrectly
confirms load at
41,000lbs
Equipment/Parts Defective – No
Inspection (near root cause)
Table 6 Corrective Action Recommendations.
87
4.2.6 Lessons Learned due to Incident as per the oil company’s Final Report:
Using 3rd
party expert investigators in this investigation became a valuable
asset. This practice should be a consideration for all investigations.
It is of vital importance that all responsibilities for fabrication and fabrication
management are clearly defined at the onset of any project and any changes to
personnel or scope be addressed immediately.
Not all 3rd
party companies use the same level of change management as the
operator’s oil company. The oil company specifications for this need to be
communicated to all 3rd
party companies.
As the principal operator, all Husky employees must be aware that when at a
contractor’s site, it will often be perceived that the oil company’s rep. is in
charge, and as such their actions or inactions may not be questioned.
Communications regarding the role that an oil company’s rep. will play in the
project management process must take place, including key aspects of the
project that fall outside of the role of the oil company’s rep.
Any deviation to a lift, formal or informal, must be accompanied by a risk
assessment with the new set of parameters causing the lift to be classified as a
new lift and treated as such (i.e. if something changes, all values must be re-
confirmed and the lift re-assessed).
If is not safe to assume that a contractor who has been hired based on good
reputation and a long work history will always abide by industry best practices
and legislative requirements. The only means to evaluate a contractor’s
suitability is through a well designed and implemented contractor management
system.

88
These are the lessons learned from this incident. Although the report has many
positive points, it does not address the main issue which is a failure in the existing risk
assessment system. This failure allowed such an incident to happen in the first place,
and such lessons will be of less significant value, should we have different subsea
equipment or different operating features. Therefore in this research, we address this
by creating an optimized risk assessment and risk management system for subsea
assets during the different phases of their operations, till they are commissioned in
their designated subsea fields.
The core reason why such incidents occur in relatively big numbers despite the
massive costly consequences when an incident occurs in most cases is not due to
simple factors such as the incompetence of a contractor , or a piece of equipment
failing; but rather due to the incompetence of the risk assessment and risk
management systems implemented by these companies. The subsea oil and gas
industry is a relatively new industry which is rapidly growing; therefore, many places
where these assets are being manufactured or tested are places where other activity is
usually carried out. For example, the fabrication facility in this case study is a big
fabrication facility that builds steel structure elements and items for boats, barges and
ports. It is not a specialized fabrication facility for subsea equipment which is custom
built with unique features [shape challenges, accessories that contain radioactive
substances, ..Etc.].
Therefore putting the blame on such facilities, for not being up to the safety and
reliability standards of the oil company, or due to their incompetence, is not the way
forward. The aim is to establish a clear guided risk assessment and risk management

89
operations guide to aid in identifying , evaluating and managing these risks and help
in the decision making process in every operational step. This would have a
significant effect in reducing the likelihood of these incidents of occurring and
improve the overall operational performance. In the following, this study will be
applied on the same case study shown above. Also, it will be demonstrated how, by
utilizing this study, similar incidents can be avoided using practical tools and
calculated measures .
4.3 Applying the Research to Case Study Operation
At this point, we shall demonstrate the improvement and added value to subsea
operational integrity that this study would add if the risk assessment and risk
management system are implemented in such operations. This study will be applied to
the case study reviewed above. The first step will be to create an engineered risk
matrix by understanding the hazards associated with each step of the operations, the
likelihood of occurrence and consequences severity. After the matrix is developed, a
number of hazard identification and control checklists will also be developed for each
of the identified potential hazards.
These hazards checklists state the various factors that would contribute in increasing
the likelihood of a hazard occurrence and will provide suggested means to reduce the
likelihood of such hazards from occurring. We shall describe the conditions present
before this operation took place and how it would appear to the decision maker, and
what mitigation tools could have been implemented to reduce the probability of such
incident from occurring.

90
4.3.1 Developing an Engineered Risk Matrix for the Operations of the Case
Study.
The case study concerned a lifting incident that happened when a crane commenced
lifting a subsea spool (CP3) from its testing location, on fabrication stands at the
fabrication facility, to another location on transportation stands at the fabrication
facility for additional work when the crane tipped onto its right side dropping the
spool. The crane tipped over completely. The subsea spool contained a Multi-Phase
Flow Meter, and the spool was destroyed completely. The possibility of a radioactive
leak was high, but due to good luck there was no radioactive leak.
The operations carried out here were on a Subsea rigid spool containing a Multi-Phase
which has a 1.11 GBq C-137 radioactive source. Such operation start from the end of
fabrication, SIT [Site Integration Test] phase, transportation to the offshore field
phase and the deployment and commissioning phase .
To develop the engineered risk matrix, it’s required to develop its two main [X, Y]
axes. Its first axis is the likelihood of occurrence, and we develop this as following:-
To develop such likelihood of occurrence associated with different hazards that are
present during the different operations carried out on the subsea rigged spool, the
following likelihood of occurrences were conceived:-
1:- An incident that could occur once in every 10 operations. 0.1
2:- An incident that could occur once in every 100 operations. 0.01
3:- An incident that could occur once in every 1000 operations. 0.001

91
4:- An incident that could occur once in every 10000 operations. 0.0001
5:- An incident that could occur once in more than 10000 operations. > 0.0001
Each probability of a incident occurring takes a number from 1 to 10 [number 1 is
when a incident is least likely to happen with a probability < 1:10,000 and number 10
is when the incident is most likely to happen with a probability equal or > than 1:10].
The 2nd
axis is the consequence of such incidents should they occur, the process of
determining the consequence assessment of such incident, and the effect of an
aftermath of a particular incident. Therefore, they show the result of harm or damage
that would come about in case any of the identified incident should occur.
In this case study, we used a number of methods to determine the consequences of the
occurrence of the identified incident as follows:-
1st: By analyzing the financial costs of all elements involved in each operation such as
asset costs, labor hourly costs, daily site costs, daily or hourly rental equipment costs,
etc. Also adding costs such as the project’s daily fines for every day of delay after the
deadline, the cost of every hour of downtime, and other indirect costs related to
operations..Etc.
2nd
: The previous history of similar incidents that happened due to similar hazards and
the total losses resulting from such incidents.
3rd
: Evaluations done by experts determining the cost of certain incidents such as the
cost to address an environmental crisis as a result of a radioactive leak or the legal

92
and liability costs should workers gets hurt or worse due while on the job due to a
hazard occurring.
The above methods are utilized in this case study to give us a better understanding of
what’s at stake. By using the tools listed above we carry out an assessment to
determine the consequences severity associated with this subsea rigged spool that
contains a Roxar Multi-Phase Flow Meter from its phase of site integration phase till
final commissioning in its subsea field. The following severity levels were
conceived:-
1:- An event that would result in equipment’s extreme damage and would cause an
uncontrolled radioactive leak from its flow meter during operations on land, or an
event that would result in the subsea spool extreme damage while offshore and would
cause complete offshore operational shut down for a considerable period of time, or
an event that would cause damage to the subsea rigged spool and /or damage to other
installed subsea assets that results in a subsea hydrocarbon spill or leak with an
estimated financial loss per day exceeding $1,000,000 USD.
2:- An event that would result in the rigged spool’s partial damage resulting in a
radioactive leak during conducting operations on land, or partial damage to the spool
while offshore causing partial or complete offshore shutdown for a short period of
time ,with an estimated financial loss per day between $ 500K and $ 1 Million.
3:- An event that would result in equipment’s damage while conducting operations
onshore , with the possibility of a radioactive leak causing facility operational shut
down for a considerably long period of time and would directly have a negative effect

93
on offshore operational work schedules resulting in down time , with an estimated
financial loss per day between $ 100,000 and $ 500,000 USD .
4:- An event that would result in equipment damage while conducting onshore
operations which would result in facility shutdown but with little to no effect on the
offshore operations with an estimated financial loss per day between $ 10,000 and $
100,000USD.
5:- An event that would result in equipment’s partial damage while conducting
onshore operations resulting in limited operational delays but with no effect on the
offshore operations, with an estimated financial loss per/day to be less than
$10,000USD.
By using the two axes to create a risk matrix which is a tool made to aid the decision
maker during the execution of the different phases of the Subsea Spool site integration
tests , commissioning and installation operations.
In the case study here an evaluation will be carried out after the matrix has been
developed, where a review of the conditions present before the lifting accident in the
case study took place, how would it appear to the decision maker and what the
mitigation tools were that could have been implemented to reduce the probability of
such incident from occurring.
Please see the Risk Matrix [Table 7]
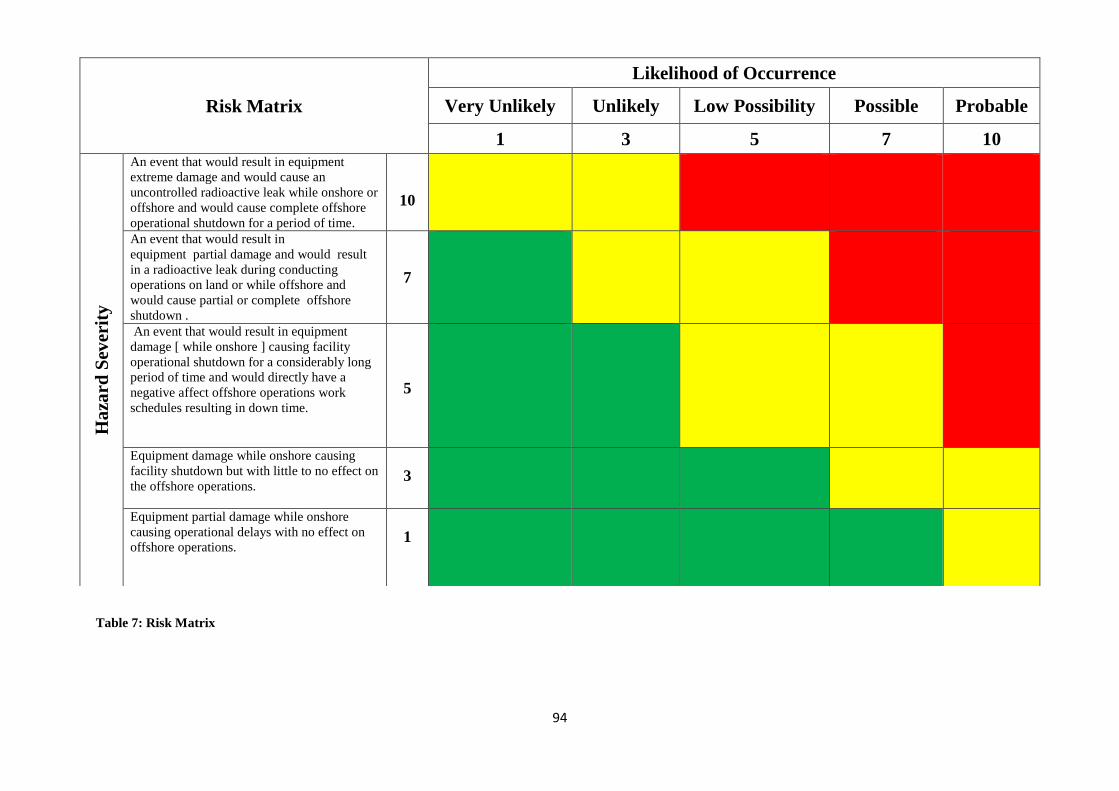
94
Table 7: Risk Matrix
Risk Matrix
Likelihood of Occurrence
Very Unlikely Unlikely Low Possibility Possible Probable
1 3 5 7 10
Ha
zard
Sev
erit
y
An event that would result in equipment
extreme damage and would cause an
uncontrolled radioactive leak while onshore or
offshore and would cause complete offshore
operational shutdown for a period of time.
10
An event that would result in
equipment partial damage and would result
in a radioactive leak during conducting
operations on land or while offshore and
would cause partial or complete offshore
shutdown .
7
An event that would result in equipment
damage [ while onshore ] causing facility
operational shutdown for a considerably long
period of time and would directly have a
negative affect offshore operations work
schedules resulting in down time.
5
Equipment damage while onshore causing
facility shutdown but with little to no effect on
the offshore operations.
3
Equipment partial damage while onshore
causing operational delays with no effect on
offshore operations.
1

95
4.3.2 Developing hazard prevention and mitigation checklists for the case study.
Hazard identification checklists can be developed for each of the identified potential
hazards for this specific subsea rigid spool from the start of the 1st SIT phase. These
hazards checklists state the various factors that would contribute to increasing the
likelihood of a hazard occurring and bring them to the attention of the field supervisor or
field safety engineer. These check lists would have been developed by the means
described in chapter 3 and presented to the person in charge of executing the job, so they
would have been completed before the job was to start, as seen in Figure 18.
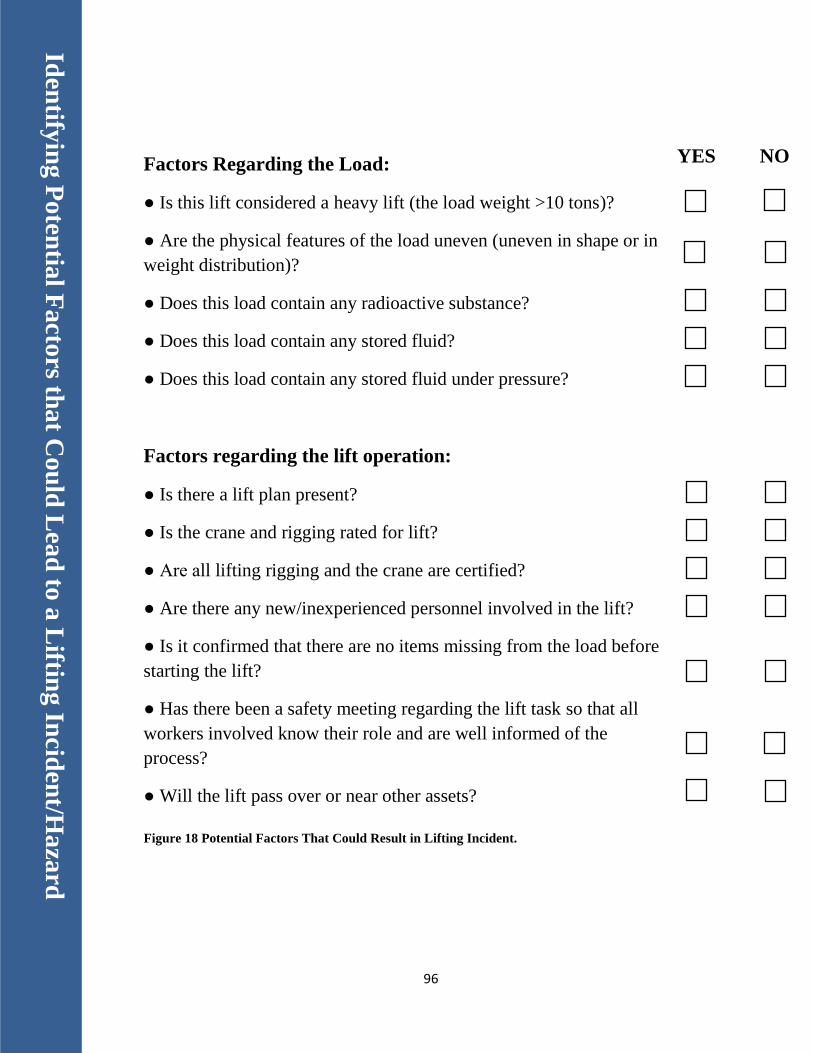
96
Figure 18 Potential Factors That Could Result in Lifting Incident.
Factors Regarding the Load:
● Is this lift considered a heavy lift (the load weight >10 tons)?
● Are the physical features of the load uneven (uneven in shape or in
weight distribution)?
● Does this load contain any radioactive substance?
● Does this load contain any stored fluid?
● Does this load contain any stored fluid under pressure?
Factors regarding the lift operation:
● Is there a lift plan present?
● Is the crane and rigging rated for lift?
● Are all lifting rigging and the crane are certified?
● Are there any new/inexperienced personnel involved in the lift?
● Is it confirmed that there are no items missing from the load before
starting the lift?
● Has there been a safety meeting regarding the lift task so that all
workers involved know their role and are well informed of the
process?
● Will the lift pass over or near other assets?
● Is there other conflicting operation near or around the area of the
lift?
Iden
tifyin
g P
oten
tial F
acto
rs that C
ou
ld L
ead
to a
Liftin
g In
ciden
t/Haza
rd
YES NO

97
Table 8 Lifting Incident Likelihood Of Occurrence.
Lik
elih
oo
d o
f O
ccu
rren
ce o
f a
Lif
tin
g I
nci
den
t d
uri
ng
Lif
tin
g O
per
ati
on
s
Scenario
1 3 5 7 10
Lift is 0 – 60% of crane safe work capacity or rigging capacity.
X
Lift is 60 – 90% of crane safe work capacity or rigging capacity.
X
Lift is 90 – 110% of crane safe work capacity or rigging capacity.
X
Crane and/or rigging are not certified while lifting a load 0 – 60% of
crane safe work capacity.
X
Crane and/or rigging have no up to date certification while lifting a
load 60 – 90% of crane safe work capacity.
X
Crane and/or rigging have no up to date certification while lifting a
load 90 – 110% of safe work capacity.
X
If two unsafe conditions such as [No Lift Plan , Uneven lift , No
certification to crane or rigging , inexperienced crane operator
or personnel ..etc] occur during the same single lift and if :-
The load is 0 – 60% of crane safe work and/or rigging safe
capacity.
X
The load is 60 – 90% of crane safe work and/or rigging safe
capacity.
X
The load is 90 – 110% of crane safe work and/or rigging safe
capacity.
X

98
Figure 19 Factors To Reduce Lifting Hazards.
Control Tools:
● An Engineered lift plan in place.
● An MSDS is present for all fluids in items being lifted.
● Full certification for all lifting rigging used in the lift .
● Pre-operation meeting held with experienced lead personnel in
charge.
● Final check carried out to ensure no missing or unfastened items
before lift.
● Weather conditions, time of day and mental and physical
conditions of workers involved taken into account
● Emergency response plans in place should any lifting incident
occur.
● Emergency response plan in place to address uncontrolled incident
involving hazardous materials: toxic material, radioactive material
..etc.
● Is there a need to complete any extra work permits (working at
heights, handling hazardous materials, etc.)
Co
ntro
l Too
ls to P
reven
t or M
itigate th
e Poten
tial o
f a L
ifting
Incid
ent / H
aza
rd
USED
99
4.3.3 Implementing the risk assessment and risk management study in this case
study.
By applying this risk assessment and risk management study and by using the tools we
developed as a risk matrix for the activities carried out during the subsea spool (CP3) site
integration test operations, we shall demonstrate how the lifting incident that took place
on July 19, 2010, at the fabrication facility could have been prevented. The incident took
place when a crane commenced lifting the subsea spool (CP3) from its testing location on
fabrication stands at a fabrication facility to another location on transportation stands at
the fabrication facility for additional work. The crane tipped onto its right side dropping
the spool; the crane tipped over completely. The subsea spool contained a Multi-Phase
Flow Meter, which has a 1.11 GBq C-137 radioactive source.
Before commencing the lift, the operation manager in charge or QHSE Engineer would
have done the following:-
1st:- Identify possible hazards associated with such an operation, and different possible
scenarios if such hazards occur:-
A lifting incident involving dropping the spool.
A lifting incident involving striking the spool with other fixed objects.
2nd
:- Utilize the engineered risk matrix we developed for this spool S.I.T operation to aid
in the decision making.

100
3rd
:- Develop a flow chart we shall use as initial data input with all the facts of the
situation on the morning of July 19, 2010. …. Please see the following flow charts.

101
Scenario 1
Lifting Incident
Rigging Failure while Attempting
the Lift
Scenario 2 & 3
Risk Matrix
Rank 15
Risk
Acceptable
Proceed to Next Step
Risk
Unacceptable
Enough lag time between
the completion of all
onshore operations and
the start of offshore
operations to cover any
possible delays that
might happen during
onshore operations.
Contingency and
emergency response plan
in place to deal with any
radioactive leak
Likelihood of
Occurrence
Possible Rank 7
Unlikely Rank 3
Detailed lift
procedures approved
by a specialized
engineering firm
Complete
supervision by
competent staff
during lift
Risk Matrix
Rank 49
Consequences
Severity Level 7
Severity Level 5
The accurate weight
value of spool must
be known and
confirmed via 3rd
party expert group

102
Scenario 2
Consequences
Severity Level 7
Severity Level 3
Likelihood of Occurrence
Possible Level 7
Unlikely Level 3
Risk Matrix
Rank 49
Lifting Incident due to Crane
Failure (Mechanical or Hydraulic)
Crane and all rigging
equipment must be
inspected and certified
Enough lag time between
the completion of all
onshore operations and the
start of offshore operations
to cover any possible
delays that might happen
during onshore operations.
Risk Matrix
Rank 9
Risk
Acceptable
Move to Next Step
tep
Risk
Unacceptable
To have an emergency
response plan to address a
radioactive leak should it
occur .
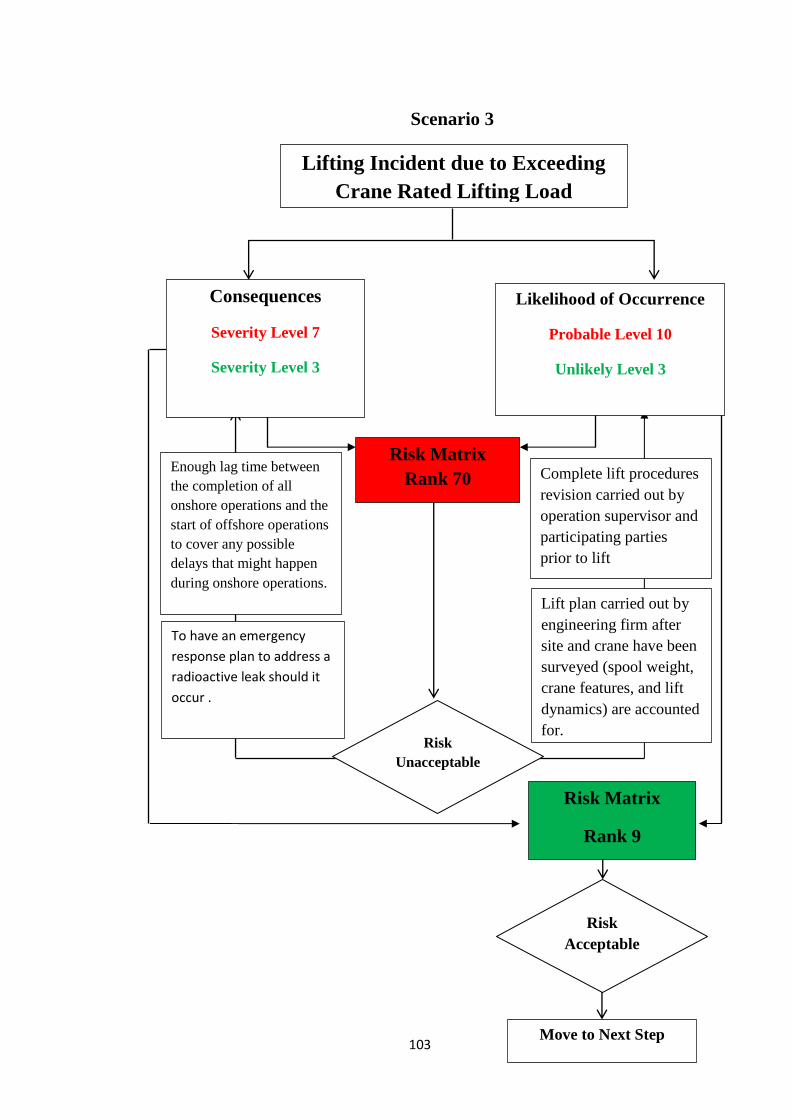
103
Risk Matrix
Rank 70 Complete lift procedures
revision carried out by
operation supervisor and
participating parties
prior to lift
Enough lag time between
the completion of all
onshore operations and the
start of offshore operations
to cover any possible
delays that might happen
during onshore operations.
Risk Matrix
Rank 9
Risk
Acceptable
Move to Next Step
tep
Risk
Unacceptable
To have an emergency
response plan to address a
radioactive leak should it
occur .
Lift plan carried out by
engineering firm after
site and crane have been
surveyed (spool weight,
crane features, and lift
dynamics) are accounted
for.
Scenario 3
Consequences
Severity Level 7
Severity Level 3
Likelihood of Occurrence
Probable Level 10
Unlikely Level 3
Lifting Incident due to Exceeding
Crane Rated Lifting Load

104
As per the above flow charts, it is important to point out that completing the charts for
the consequences severity and hazard identification and the likelihood of occurrence
charts was predetermined for this operation using the tools we have discussed earlier
in the study.
The role that the operation supervisor or the QHSE Engineer on location would have
had on the morning of the incident was to take 15 min of his time to fill out the
checklist sheets. Then the engineer would have completed the 3 hazard flow charts as
per all 3 lifting hazard scenarios stated here, which were the 3 possible for a lifting
hazard the morning of the lift in the case study.
The initial likelihood for any of the mentioned 3 scenarios of a lifting incident had
rank numbers in the red zone which required an immediate stop to the operation and
mitigation measures. These measures should have been taken before work proceeded,
as we see in the following:-
In the 1st scenario:-
A lifting incident due to rigging equipment failure due to the following facts:
There was:
No accurate knowledge of the actual CP3 spool weight.
No lift plan developed to check suitability of rigging equipment.
No quality control inspection to identify condition of rigging equipment.
No proper supervision present before and during the start of the operation.
105
For these reasons the likelihood of a lifting incident due to rigging failure was a level
7 [possible] which along with the severity of the operation [also a severity level 7]
brings the overall risk matrix number to 49 which is in the red zone. At this point,
operations should have stopped and mitigation steps should have been taken to reduce
this risk hazard probability to an acceptable figure.
In the 2nd
scenario:-
One lifting incident due to crane’s mechanical or hydraulic failure due to the
following facts:
There was:
No quality control inspection carried out to confirm both the mechanical and
hydraulic integrity of the crane [especially when taking into to account the age
of that crane].
No lift plan developed to determine the precise lift job that the crane was
required to do, and whether or not it was within the crane’s safe work limits.
No accurate knowledge of the actual CP3 spool weight.
As a result, the likelihood of a lifting incident due to crane mechanical or hydraulic
failure was at a level 7 [possible] which along with the severity of the operation [also
a severity level 7] brings the overall risk matrix number to 49 which is in the red zone.
At this point, operations should have stopped and mitigation steps should have been
taken to reduce this risk hazard probability to an acceptable figure.

106
In the 3rd
scenario:-
One lifting incident due to crane exceeding lifting capability due to the following
facts:
There was:
No accurate knowledge of the actual CP3 spool weight.
No lift plan present to give detailed information on where the crane and spool
were positioned and how far the crane would reach out along with other
operational details.
No quality control inspection carried out to confirm both the mechanical and
hydraulic integrity of the crane especially when taking into account the age of
that crane.
No proper supervision present before and during the start of the operation.
As a result, the likelihood of a lifting incident due to the crane exceeding lifting
capability was at a level 10 [probable] which along with the severity of the
operation [also a severity level 7 ] brings the overall risk matrix number to 70
which is in the red zone. At this point, operations should have stopped and
mitigation steps should have been taken to reduce this risk hazard probability to
an acceptable figure.
As I have just demonstrated, the lifting incident happened when a crane
commenced lifting a subsea spool (CP3) from its testing location on fabrication
107
stands at the fabrication facility to another location on transportation stands at the
fabrication facility, where the crane tipped onto its right side dropping the spool.
This lifting accident resulted in the crane tipping over completely. The subsea rigid
spool that contained a Multi-Phase Flow Meter and the spool were destroyed
completely. The possibility of a radioactive leak was high, but due to good luck there
was no radioactive leak. This serious incident could have been worse. The accident
could have been completely avoided if the proposed study was implemented, where
the need for the operation to come to a complete stop would have been clear to the
person in charge. By using the tools in this study, it would have been clear that with
the operational conditions and circumstances that were present the morning of July
19, 2010, it was too dangerous to proceed. Measures to reduce the risk of a lifting
incident were needed before the operation proceeded, which could have avoided this
incident.

108
CHAPTER 5 CONCLUSION AND FUTURE WORK
5.1 Summary
In the proposed study, a comprehensive risk assessment and risk management tool is
custom built for the subsea rigid spool, to manage the operation related risks that the
subsea sea spool is subjected to from the completion of its fabrication to the point it
has been commissioned in its subsea slot in its designated subsea field.
The study attempts to develop a risk assessment and management tool that is easy to
use and effective. Also, it can be used by the field operation supervisors or the QHSE
field engineer to identify the hazards present during every operational step, determine
whether the job is safe to proceed or not, and give means to reduce the risks to
ALARP before resuming operational activity.
The final product of this study if implemented would be a set of custom made
checklists and tables. They can provide the operation supervisor with data regarding
the consequence of hazards should they occur, the likelihood of a certain hazard to
occur, a risk matrix to give an indication of what’s an acceptable risk and what’s not,
control measures to be set in place to reduce the current unacceptable level or a risk to
acceptable levels and an uncompleted risk flow chart to be completed with the data
provided for every different hazard scenario and the means taken to reduce risks to
acceptable levels.

109
5.2 Future Work
5.2.1 Development of risk assessment and management systems for other subsea
assets
All subsea equipment and assets are custom-made products as well as the subsea rigid
spool, and there is no production line to produce a subsea Christmas-Tree (XMT),
subsea manifold , or any other subsea asset.
These subsea assets and equipment are built as per the customers, (oil companies)
field requirements and as per customer policies and field development strategic
planning. This results in unique equipment being ordered for each project .
This uniqueness would be different in terms of size, shape, weight, added
accessories, materials used to build it, different methodology and nature of testing
these assets , different logistical challenges and different ways to transport these
assets whether by land, sea or air[ in some cases ], and the different work procedures
and ways of commissioning them subsea.
Therefore the development of custom made risk assessment and risk management
systems for every individual subsea asset would be area for future work in order to
have an integrated system to accurately identify, manage and if need be mitigate the
hazards that are associated with each individual asset in every different operational
activity it undertakes before it is functional in its subsea slot in its designated subsea
field.

110
5.2.2 Development of a computerized subsea assets risk management system.
In today’s world almost all middle and large sized work entities in all industries use a
form of computerized work management system or CWMS and/or computerized
maintenance management system (CMMS).
Generally CWMS & CMMS are software programs or a combination of programs that
are displayed to the users as a number of modules. CWMS is designed to computerize
the work management process (for example maintenance work) and its associated
support processes (e.g., inventory, purchasing and capital projects). These computer
software programs are designed to assist in the planning, management, and
administrative procedures required for effective work management.
The CWMS is a business tool that allows control over the linked work and material
processes, and at the same time provides a means for collection of valuable cost and
work history data.
These processes include work initiation (work request), planning and scheduling work
orders, work execution and closeout. In addition, the inventory and purchasing
processes provide the necessary materials and services that facilitate work. (Terry
Wireman, 2011)*.
All these processes are related to each other through workflow that allows the
electronic simulation of business procedures.
Therefore, an area for future work would be to develop a computerized subsea risk
assessment and risk management systems for different subsea assets, that can be

111
integrated in the computerized work management systems in use by oil companies.
The new computerized subsea risk assessment and management program can be made
to be integrated with the existing computerized work management systems software
program used by the oil company, so that whenever a work order is issued, it
automatically incorporates the approved risk assessment and management
procedures, along with all the other features of the work order such as work
procedures , labur hours , 3rd
party involvement , materials used ….etc.
112
REFERENCES
AIChE (2000). Guidelines for chemical process quantitative risk analysis (2nd Edition
ed.). New York, USA: Center for Chemical Process Safety/AIChE.
Albert P. Iskrant : Accident mortality data as epidemiologic indicators., Am J Public
Health Nations Health. Feb 1960; 50(2): 161–172, PMC1373133.
Ayyub, B. M. (2003). Risk analysis in engineering and economics. NEW York,USA:
Chapman and Hall/CRC.
Badreddine, A., and Amor, N. B. (2010). A dynamic barriers implementation in
Bayesian-based bow tie diagrams for risk analysis. Computer Systems and
Applications,ACS/IEEE International Conference on, 1-8.
Bedford, T., and Cooke, R. (2001). Probabilistic risk analysis: Foundations and
Methods (1st ed.) Cambridge University Press.
BURULLUS Gas Company – Subsea Facilities EPIC , WDDM Phase VIII-A
Development Project [ RIGID JUMPER INSTALLATION PROCEDURE ]
Contract no. BUR/PRJ/003/2010.
BURULLUS GAS COMPANY- WDDM PHASE VIII-B Development Project
[Fabrication Yard Activities-Hydrotest & Meg Filling Procedure for Jumpers
and Goosenecks] Contract no. BUR/PRJ/008/2011.

113
Crowl, D. A., & Louvar, J. F. (2001). Chemical process safety, fundamentals with
applications (2nd ed.). Upper Saddle River, New Jersey, USA: Prentice Hall
PTR.
Daneshkhah, A. (2004). Uncertainty in probabilistic risk assessment: A review,
Unpublished manuscript.
Ferdous, R. (2006), “Methodology for Computer Aided Fuzzy Fault Tree Analysis” ,
A Thesis Submitted to Memorial University of Newfoundland, Canada, in
Partial Fulfillment of the requirements for the Degree of Master of
Engineering.
FMC Technologies web site , http://www.fmctechnologies.com/SubseaSystems.aspx
in Feb2014.
Hammonds S.J., Hoffman O.F. and Bartell M.S. (1994). An Introduction Guide to
Uncertainty Analysis in Environmental and Health Risk Assessment.
Technical report No. ES/ER/TM-35/R1). SENES Oak Ridge, Tennessee.
Harold E. Roland, Brian Moriarty (1990). System Safety Engineering and
Management. John Wiley & Sons. ISBN 0471618160.
Hauptmanns, U. (1988). Fault tree analysis for process industries engineering risk
and hazard assessment . In Engineering risk and hazard assessment (pp. 21-
59) Florida, US:CRC Press Inc.
Heinrich HW (1931). Industrial accident prevention: a scientific approach. McGraw-
Hill.

114
Hollnagel, E. (2004). Barriers and Accident Prevention. Ashgate Publishing Limited.
UK
HSE UK (2009). Offshore Injury,I11 Health and Incident Statistics. Health and Safety
Executive Report, HSR 2009-1, Merseyside, UK.
Husky Energy Investigation Review, (2010). DCH Crane Incident at M&M Offshore
Ltd. Facility.
Jon Mainwaring , Rigzone Staff, March 28th 2012 ,
https://mb50.wordpress.com/tag/jack-up-rig/.
Kaplan, S. and Garrick, B. (1981) On the quantitative definition of risk. “ Risk
Analysis, I(1), 11-27. Doi:10.11 11/j.1539-6924.1981.tb01350.x.
Kjellen, U. (2000). Prevention of Accident through Experiences Feedback. Taylor and
Francis. London, UK
Kumamoto, H., and Henley, J. E. (1996). Probablistic risk assessment and
management for engineers and scientists (2nd ed.) Wiley-IEEE Press.
Lee, F. (1996). Loss prevention in the process industries (2nd ed.). Butterworth-
Heinemann,Oxford.
Lee, F.P. (2005). In Mannan S., O’Connor M.K. (Kds.), Loss prevention in the
process industries (3rd ed.) Elservier.
115
Maryam Kalantaria , Faisal Khan , Kelly Hawbodt ( Dynamic risk assessment using
failure assessment and Bayesian theory) , Journal of Loss Prevention in the
Process Industries. 22(2009) 600-606.
Modarres, M. (2006). Risk analysis in engineering techniques, tools and trends.
Bocca Raton, Florida, USA.: Taylor and Francis.
Panagiota Katsakiori , George Sakellaropoulos , Emmanuel Manatakis , Article
(Towards an evaluation of accident investigation methods in terms of their
alignment with accident causation models) Safety Science 47(2009) 1007-
1015 .
Principles of Risk-Based Decision Making . ABS Consulting, ISBN 0-86587-908-7
Smith, D. R., Frazier, D., Reithmaier, L. W. and Miller, J. C. (2001). Controlling Pilot
Error. McGraw-Hill Professional. p. 10. ISBN 0-07-137318.
Stephens, M., Nessim, M., Chen, Q. (1995). A Methodology for the Risk Based
Optimization of the Pipeline Integrity Maintenance Activities. PIRAMID
Technical Reference Manuel No. 1.2, Center for Engineering Research Inc.,
Edmonton, Canada.
Stranks, J. (2007). Human Factors and Behavioural Safety. Butterworth-Heinemann.
pp. 130–131. ISBN 9780750681551.
Spillius, Andrew (18 June 2010). The Telegraph (London). Retrieved 2010-06-18.
http://www.telegraph.co.uk/finance/newsbysector/energy/oilandgas/7836982/
BP-oil-spill-could-cost-100bn.html (On Oct. 2013)

116
Terry Wireman (2011), Successfully Utilizing CMMS/EAM Systems, ISBN 978-0-
9832258-7-4.
Virginia R. Prevosto , web site reviewed on April 2014 ,
http://www.iso.com/Research-and-Analyses/ISO-Review/Holistic-Risk-
Management-and-Quantification.html.
Wang, Y. (2004). Development of a computer-aided fault tree synthesis methodology
for quantitative risk analysis in the chemical process industry. ( Doctor of
Philosophy Texas A and M University). , 1-164