risk-adjusted morbidity and mortality models to compare the performance of two units after major...
TRANSCRIPT

RtAA
General Thoracic Surgery Brunelli et al
8
GTS
isk-adjusted morbidity and mortality models to comparehe performance of two units after major lung resectionslessandro Brunelli, MD,a Nicholas J. Morgan-Hughes, MD,b Majed Refai, MD,a Michele Salati, MD,a
rmando Sabbatini, MD,a and Gaetano Rocco, MDc
Oct
Mw22croaaat
Rl(lsboo
Cme
Iqpaiomqape
From the Unit of Thoracic Surgery, Um-berto I° Regional Hospital,a Ancona, Italy;the Department of Anaesthesiology, Shef-field Teaching Hospital,b Sheffield, UnitedKingdom; and the Division of ThoracicSurgery, National Cancer Institute,c PascaleFoundation, Naples, Italy.
Read at the Eighty-sixth Annual Meeting ofThe American Association for ThoracicSurgery, Philadelphia, Pa, April 29-May 3,2006.
Received for publication April 22, 2006;revisions received Aug 13, 2006; acceptedfor publication Aug 31, 2006.
Address for reprints: Alessandro Brunelli,MD, Via S Margherita 23, Ancona 60129,Italy (E-mail: [email protected]).
J Thorac Cardiovasc Surg 2007;133:88-96
0022-5223/$32.00
Copyright © 2007 by The American Asso-ciation for Thoracic Surgery
adoi:10.1016/j.jtcvs.2006.08.058
8 The Journal of Thoracic and Cardiov
bjective: We sought to develop risk-adjusted morbidity and mortality models toompare the performance of 2 different thoracic surgery units in patients submittedo major lung resections.
ethods: Seven hundred forty-three patients (551 male and 192 female patients)ho underwent lobectomy (n � 611) or pneumonectomy (n � 132) from January000 through August 2004 at 2 European thoracic units (519 patients in unit A and24 patients in unit B) were analyzed. Risk-adjusted models of 30-day or in-hospitalardiopulmonary morbidity and mortality were developed by using stepwise logisticegression analyses and validated by means of bootstrap analysis. Preoperative andperative variables were initially screened by using univariate analysis. Those withP value of less than .10 were used as independent variables in the regression
nalyses. The regression equations were then used to estimate the risk of outcome,nd the observed and predicted outcome rates of the 2 units were compared by usinghe z test for comparison of proportions.
esults: The following regression models were developed. Predicted morbidity:n R⁄1 � R � � 2.4 � 0.03Xage � 0.02XppoFEV1 � 0.6Xcardiac comorbidityHosmer-Lemeshow statistic � 6.1 [P � .6], c index � 0.65). Predicted mortality:n R⁄1 � R � � 6.97 � 0.095Xage � 0.042XppoFEV1 (Hosmer-Lemeshowtatistic � 2.99 [P � .9], c index � 0.77). The models proved to be stable atootstrap analyses. No differences were noted between observed and predictedutcome rates within each unit, despite an apparent unadjusted better performancef unit B.
onclusions: The use of risk-adjusted outcome models avoided misleading infor-ation derived from the unadjusted analysis of performance. Risk modeling is
ssential for the evaluation of the quality of care.
n the present era of managed care systems, increasing pressure is exerted bypayers and the public on the profession to assume greater responsibility fordelivering high-quality care. Accountability demands an increased effort in
uality-monitoring and quality-improvement processes through the analysis oferformance of health care providers. However, because patients are not randomlyllocated to different physicians or hospitals and their outcome can be influenced byllness severity, treatment effectiveness, or even mere chance,1,2 the comparison ofutcomes is challenging. Indeed, a different case mix at different institutions mightake the comparison of crude outcome rates misleading. Therefore the selection of
uality end points must account for the differences in the prevalence of risk factors,nd clinical risk modeling must become the logical and necessary approach forrovider profiling. Nevertheless, risk modeling for audit purposes appears yet in itsmbryonic phase in thoracic surgery, and specific literature on this issue is scanty
nd mainly limited to internal audit.3-5ascular Surgery ● January 2007

ajdpbp
PW�iA
iuppfutrd
usdomevbopdpt
tvmpasmo
fsmmaaaociaawaspd
ot
f1
audGqTad(uwvnSCF
wrprdwniecvss
vc
Brunelli et al General Thoracic Surgery
GTS
The objective of the present study was to develop risk-djusted models of early morbidity and mortality after ma-or lung resection and to compare the performance of 2ifferent European thoracic surgery units with the intent torovide a methodological and practical example of modeluilding and application for multicentric comparative auditurposes.
atients and Methodse analyzed 743 patients treated with lobectomy/bilobectomy (n611) or pneumonectomy (n � 132) in 2 European centers (519
n center A and 224 in center B) from January 2000 throughugust 2004.
This is an observational study performed on prospective, period-cally audited electronic databases of two dedicated thoracic surgerynits located in two different European countries. Data were enteredrospectively in each database by a trained staff physician and wereeriodically audited by a designated audit lead, who was responsibleor the accuracy and completeness of the database. Both databases aresed as continuous quality-improvement instruments at the two par-icipating units. The study was approved by the local institutionaleview board of each center, and informed consent to be entered in theatabases was obtained from all patients.
The patients and datasets used for this study were the samesed for a recently published analysis.6 Although the subject wasimilar (risk modeling), the focuses of the two analyses wereifferent in that the first study aimed at demonstrating the superi-rity of bootstrap analysis over the traditional training and testethod for developing risk models by constructing multiple mod-
ls from the population from unit A and then assessing theiralidity on the bootstrapped population of unit B.6 No comparisonetween the two units was performed because this was not thebjective of that report. On the other hand, in this analysis the mainurpose was to compare the performance of the two units byeveloping risk models from the entire dataset of patients (unit Alus unit B) after validation by means of bootstrap analysis. Forhis reason, we consider the two studies unique and independent.
In both centers surgical intervention was contraindicated inhose patients with a predicted postoperative forced expiratoryolume in 1 second (ppoFEV1) and predicted postoperative carbononoxide lung diffusion capacity (ppoDLCO) of less than 30% of
redicted value in association with a poor exercise capacity (heightt maximal stair-climbing test �12 m or maximum oxygen con-umption [VO2max] at cycle ergospirometry �10 mL · kg�1
in�1) or in the presence of hemodynamic instability, despite
Abbreviations and AcronymsDLCO � carbon monoxide lung diffusion capacityFEV1 � forced expiratory volume in 1 secondppoDLCO � predicted postoperative carbon monoxide
lung diffusion capacityppoFEV1 � predicted postoperative forced expiratory
volume in 1 secondVO2max � maximum oxygen consumption
ptimization of treatment. As a rule, lung resections were per- a
The Journal of Thorac
ormed through a muscle-sparing thoracotomy by certified thoracicurgeons for benign (56 lobectomies and 2 pneumonectomies) oralignant (555 lobectomies and 130 pneumonectomies; 667 pri-ary and 18 metastatic diseases) diseases. The postoperative man-
gement policies were the same in both centers. All patients weredmitted to a dedicated general thoracic surgery ward immediatelyfter the operation, resorting to the intensive care unit only in casef complications requiring invasive assisted ventilation or invasiveontinuous monitoring. Postoperative treatment was standardizedn both units and focused on early mobilization, chest physiother-py and physical rehabilitation, thoracotomy pain control, andntibiotic and antithrombotic prophylaxis. Postoperative chest painas controlled by means of epidural or continuous intravenous
nalgesia, which was titrated to keep the pain visual analoguecore at less than 4 (in a scale ranging from 0-10) for the firstostoperative 48 to 72 hours (pain score was assessed twice dailyuring the morning and afternoon rounds).
Postoperative morbidity and mortality were considered as thoseccurring within 30 days postoperatively or for a longer period ifhe patient was still in the hospital.
A number of preoperative and operative variables were testedor possible association with outcome variables (see Appendix4,5,7-9 for explanation of variables).
Data were initially scrutinized for assessing the quality of vari-bles and their consistency in definition and recording between the 2nits. To this purpose, the 2 databases were reciprocally and indepen-ently audited by the principle investigator of the other unit (AB andR). Only those variables and end points that were deemed of highuality and consistent across the 2 units were included in this analysis.he databases were made anonymous for both patients and surgeonsnd were merged for analysis. All patients were initially used toevelop the predictive logistic models. For each measure of outcomemorbidity and mortality rates), variables were initially screened bysing univariate analyses. The univariate comparisons of outcomesere performed by means of the unpaired Student t test for numericariables with normal distribution and by means of the Mann–Whit-ey U test for numeric variables without normal distribution. Thehapiro–Wilk normality test was used to assess normal distribution.ategoric variables were compared by means of the �2 test or theisher exact test, as appropriate.
Variables with a P value of less than .10 at univariate analysisere then used as independent variables in the stepwise logistic
egression analyses. The presence or absence of 1 or more com-lications or of mortality was used as a dependent variable in eachespective model. All data were complete, with the exception ofata on carbon monoxide lung diffusion capacity (DLCO), whichere 95% complete. Missing data were imputed by averaging theonmissing values. Potential explanatory variables more than 5%ncomplete were excluded from this analysis (ergometric param-ters [VO2max], blood gas analysis measures, and albumin con-entration). To avoid multicollinearity, only 1 variable in a set ofariables with a correlation coefficient of greater than 0.5 waselected (by using the bootstrap procedure) and used in the regres-ion model.
A P value of less than .05 was selected for retention ofariables in the final model. The area under the receiver operatingharacteristic curve or c index was used to study the discrimination
bility of each model. Hosmer–Lemeshow goodness-of-fit statis-ic and Cardiovascular Surgery ● Volume 133, Number 1 89

ttbsbsw.attaosmids
muctdtid
ft
RTT
T
V
AEBFDppCNP
Rcm
Tp
V
AMBFDppMCNP
Rcm
General Thoracic Surgery Brunelli et al
9
GTS
ics were used to assess the calibration of the models. Furthermore,he multivariate procedures were validated by means of bootstrapagging with 1000 samples. In the bootstrap procedure repeatedamples of the same number of observations as the original data-ase (n � 743) were selected with replacement from the originalet of observations. For each sample, stepwise logistic regressionas performed, entering the variables with a P value of less than
1 at univariate analysis. The stability of the final model can bessessed by identifying the variables that enter most frequently inhe repeated bootstrap models and comparing those variables withhe variables in the final model. If the final stepwise model vari-bles occur in a majority (�50%) of the bootstrap models, theriginal final stepwise regression model can be judged to betable.6,10,11 We have previously shown that bootstrap analysisight be particularly advantageous in moderate-sized samples
nasmuch as it allows the use of the entire dataset for modeleveloping without the need to split and further reduce the sampleize (and the number of outcome cases).6
ABLE 1. Characteristics of the patients in the study (agg
ariablesAll patients
(n � 743)
ge (y) 65.2 (10.7)lderly (�70 years of age; n [%]) 275 (37)MI (kg/m2) 25.9 (4.4)EV1% 84.7 (18.9)LCO% 78 (18.8)poFEV1% 65.5 (17.3)poDLCO% 60.4 (16.9)ardiac comorbidity (n [%]) 287 (39)eoadjuvant chemotherapy (n [%]) 85 (11)neumonectomy (n [%]) 132 (18)
esults are expressed as means (standard deviations) unless otherwise indarbon monoxide lung diffusion capacity; ppoFEV1, predicted postoperativeonoxide lung diffusion capacity. *Mann–Whitney Test. †�2 Test.
ABLE 2. Univariate comparison between patients withatients
ariablesComplicated
(n � 159)Nonco
(n �
ge 68 (10.2) 64.4ale sex (n [%]) 132 (83) 419
MI (kg/m2) 26.3 (4.1) 25.8EV1% 80.3 (17.3) 85.9LCO% 74.8 (19.6) 78.9poFEV1% 62.1 (15.9) 66.5poDLCO% 57.4 (15.6) 61.2alignant disease (n [%]) 152 (96) 533
ardiac comorbidity (n [%]) 84 (53) 203eoadjuvant chemotherapy (n [%]) 24 (15) 61neumonectomy (n [%]) 32 (20) 100
esults are expressed as means (standard deviations) unless otherwise indarbon monoxide lung diffusion capacity; ppoFEV , predicted postoperative
1onoxide lung diffusion capacity. *Mann–Whitney test. †�2 Test. ‡Fisher exac
0 The Journal of Thoracic and Cardiovascular Surgery ● Janua
The logistic models were then used to predict morbidity andortality in the patients undergoing operations in the 2 different
nits. Predicted and observed outcome rates in each unit were thenompared, and P values were calculated from the z test statistic forhe difference between two proportions, which uses the samplingistribution of the statistic to guess population parameters. In theest statistic the numerator is the difference between the proportionn the two samples, and the denominator is the standard error of theifference in the two proportions.
All the statistical tests were two-tailed. The analysis was per-ormed with STATA 8.2 (Stata Corp, College Station, Tex) sta-istical software.
esultshe characteristics of the patients in the study are shown inable 1.
Table 2 shows the results of the univariate comparison
te and by center)Unit A
(n � 519)Unit B
(n � 224)Unit A vs unit B,
P value
66.9 (9.6) 61.3 (12.2) �.0001*220 (42) 55 (25) �.0001†26 (4.4) 25.6 (4.5) .3*85 (19.3) 84 (18.2) .4*
76.5 (18.6) 81.4 (18.2) .005*66.9 (16.9) 62.4 (17.8) .001*60.3 (16.8) 60.6 (16.4) .5*253 (49) 34 (15) �.0001†60 (12) 25 (11) 0.9†90 (17) 42 (19) 0.6†
. BMI, Body mass index; FEV1, forced expiratory volume in 1 second; DLCO,d expiratory volume in 1 second; ppoDLCO, predicted postoperative carbon
without complications and between dead and surviving
ated) P value
Dead(n � 35)
Surviving(n � 708) P value
) �.0001* 71.5 (6.7) 64.9 (10.8) .0001*.004† 30 (86) 521 (74) .12‡.2* 25.2 (4.4) 25.9 (4.4) .4*
) .0009* 74.9 (16.3) 85.2 (19) .002*) .02* 71.3 (23) 78.3 (18.3) .05*) .003* 56.1 (12.7) 66 (17.3) .0004*) .03* 53.5 (18) 60.7 (16.6) .01*
0.07† 33 (94) 652 (92) 1‡�.0001† 20 (57) 267 (38) .02†
.1† 4 (11) 81 (11) 1‡
.4† 12 (34) 120 (17) .009†
. BMI, Body mass index; FEV1, forced expiratory volume in 1 second; DLCO,d expiratory volume in 1 second; ppoDLCO, predicted postoperative carbon
rega
icatedforce
and
mplic584
(10.7(72)(4.5)(19.2(18.3(17.5(16.9(91)(35)(10)(17)
icatedforce
t test.
ry 2007

bitfD.ac
w(vt
i..
o
l
(0s�
o
(0mbT
t
stoto
TPP
M
M
Bp
Fsp
Brunelli et al General Thoracic Surgery
GTS
etween patients with and without complications or mortal-ty. In particular, compared with noncomplicated patients,hose with complications were older (P � .0001); had lowerorced expiratory volume in 1 second (FEV1; P � .0009),
LCO (P � .02), ppoFEV1 (P � .003), and ppoDLCO (P �03) values; were more frequently male (P � .004); and had
higher prevalence of malignant disease (P � .07) andardiac comorbidities (P � .0001).
Compared with patients who survived, those who diedere older (P � .0001); had lower FEV1 (P � .002), DLCO
P � .05), ppoFEV1 (P � .0004), and ppoDLCO (P � .01)alues; and had a higher prevalence of cardiac comorbidi-ies (P � .02) and pneumonectomies (P � .009).
Stepwise logistic regression analysis showed that signif-cant and reliable predictors of morbidity were age (P �005), ppoFEV1 (P � .003), and cardiac comorbidity (P �002, Table 3).
The following equation predicting morbidity was devel-ped:
n R ⁄ 1 � R � �2.4 � 0.03Xage � 0.02XppoFEV1
� 0.6Xcardiac comorbidity
Hosmer–Lemeshow statistic � 6.1 [P�.6], c index �.65). Stepwise logistic regression analysis showed thatignificant and reliable predictors of mortality were age (P
.0002) and ppoFEV1 (P � .0004, Table 3).The following equation predicting mortality was devel-
ped:
ln R ⁄ 1 � R � �6.97 � 0.095Xage � 0.042XppoFEV1
Hosmer-Lemeshow-statistic � 2.99 [P�.9], c index �.77). Figure 1 plots the cumulative observed morbidity andortality rates against the predicted rates in patients ordered
y increasing risk of morbidity and mortality, respectively.he plots showed overall good calibration of the models.
The stability of the models was evaluated by assessing
ABLE 3. Results of the stepwise logistic regression analysarsimonious modelsredictors Coefficients SE O
orbidity modelIntercept �2.4Age 0.03 0.01ppoFEV1% �0.02 0.006Cardiac comorbidity 0.6 0.2ortality modelIntercept �6.97Age 0.095 0.03ppoFEV1% �0.042 0.01
ootstrap frequency: frequency of significance (P � .05) in 1000 bootostoperative forced expiratory volume in 1 second.
he distribution of the c index statistics across 1000 boot- c
The Journal of Thorac
trap samples. The morbidity model c index was greaterhan 0.6 in 99% of the samples and greater than 0.7 in 46%f the samples. The mortality model c index was greaterhan 0.6 in 100% of the samples and greater than 0.7 in 97%f the samples.
ependent variables: morbidity and mortality, respectively):
atio 95% CL P value Bootstrap frequency
1.009-1.05 .005 80%0.97-0.99 .003 88%
1.2-2.6 .002 89%
1.05-1.16 .0002 100%0.94-0.98 .0004 98%
samples. SE, Standard error; CL, confidence limit; ppoFEV1, predicted
igure 1. A, Plot of cumulative predicted morbidity against ob-erved morbidity ordered by increasing risk. B, Plot of cumulativeredicted mortality against observed mortality ordered by in-
es (d
dds r
1.030.981.8
1.10.96
strap
reasing risk.
ic and Cardiovascular Surgery ● Volume 133, Number 1 91
apo(b
imf.
pp
s
io
DImavpt
tAao
General Thoracic Surgery Brunelli et al
9
GTS
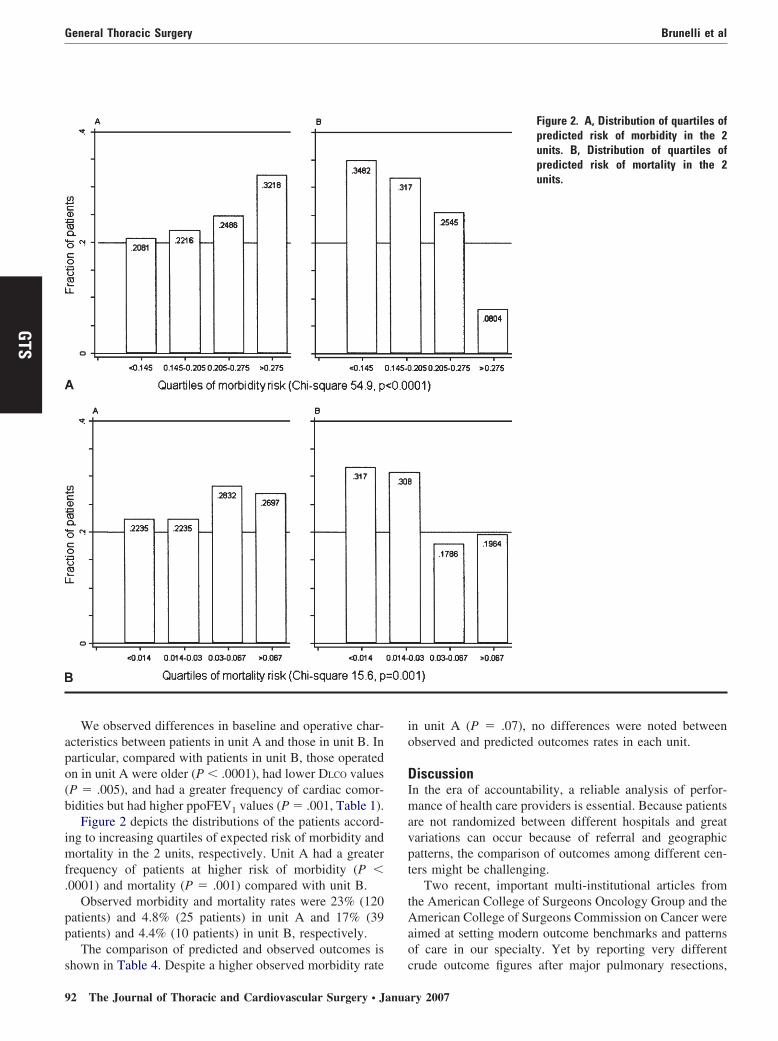
We observed differences in baseline and operative char-cteristics between patients in unit A and those in unit B. Inarticular, compared with patients in unit B, those operatedn in unit A were older (P � .0001), had lower DLCO valuesP � .005), and had a greater frequency of cardiac comor-idities but had higher ppoFEV1 values (P � .001, Table 1).
Figure 2 depicts the distributions of the patients accord-ng to increasing quartiles of expected risk of morbidity andortality in the 2 units, respectively. Unit A had a greater
requency of patients at higher risk of morbidity (P �0001) and mortality (P � .001) compared with unit B.
Observed morbidity and mortality rates were 23% (120atients) and 4.8% (25 patients) in unit A and 17% (39atients) and 4.4% (10 patients) in unit B, respectively.
The comparison of predicted and observed outcomes is
hown in Table 4. Despite a higher observed morbidity rate c2 The Journal of Thoracic and Cardiovascular Surgery ● Janua
n unit A (P � .07), no differences were noted betweenbserved and predicted outcomes rates in each unit.
iscussionn the era of accountability, a reliable analysis of perfor-ance of health care providers is essential. Because patients
re not randomized between different hospitals and greatariations can occur because of referral and geographicatterns, the comparison of outcomes among different cen-ers might be challenging.
Two recent, important multi-institutional articles fromhe American College of Surgeons Oncology Group and themerican College of Surgeons Commission on Cancer were
imed at setting modern outcome benchmarks and patternsf care in our specialty. Yet by reporting very different
Figure 2. A, Distribution of quartiles ofpredicted risk of morbidity in the 2units. B, Distribution of quartiles ofpredicted risk of mortality in the 2units.
rude outcome figures after major pulmonary resections,
ry 2007

lt
tcic
pgsbra
STmcpiiapb
mmcegfrltrtmfeadcm
capaaticacrtFmantt
thetVesaaiwtdfvloltbdmb
T
U
UU
E unit A
Brunelli et al General Thoracic Surgery
GTS
ikely reflecting different eligibility criteria, they emphasizehe need for risk adjustment.12,13
The quality end points must be necessarily risk adjustedo account for differences in patients’ baseline and operativeharacteristics. In fact, crude outcome rates might lead tonappropriate clinical and administrative decisions andause unethical risk-averse behaviors.
As a consequence, risk modeling should become an integralart of any quality-monitoring and quality-improvement pro-ram. In our specialty risk stratification for audit purposes istill in its embryonic phase, and only few experiences haveeen published on this issue.3-5 In particular, examples ofisk-adjusted multicentric comparative analysis of performancere lacking.
Recently, the European Association for Cardiothoracicurgery/European Society of Thoracic Surgeons Europeanhoracic Database project produced a model of in-hospitalortality from a dataset of more than 3400 lung resections
ollected voluntarily from 27 units in 14 countries over aeriod of 3 years.7 This work represented the first multi-nstitutional multinational effort to develop an objectivenstrument to analyze the performance of different unitscross Europe. Future developments of the project are ex-ected to refine the preliminary model and set performanceenchmarks in Europe.
The present study must be interpreted as an example ofethods and application of risk models for provider-initiatedulticentric comparative audit purposes. In fact, it was con-
eived to develop risk-adjusted morbidity and mortality mod-ls to compare the performance of two different thoracic sur-ery units. Because no model is better than the one derivedrom the data at hand and because it has been shown thateady-made models applied to external populations performess well than internally derived models,2,14-16 we elected noto use existing external models. Furthermore, it is known thategression models perform better when applied retrospectivelyo evaluate the past performance.17 Under a total quality-
anagement perspective, they are not meant to foretell theuture but to analyze past data to avoid repeating problemsncountered in the past.17 In this regard the retrospectivepplication of a model as a diagnostic quality instrument to theata from which it was developed seems justified, provided aross-sample validation (bootstrap) had been performed to
ABLE 4. Comparison of predicted and observed morbidityMorbidity
nit Observed Predicted P
nit A 23% 22.7% (22%-23.5%)nit B 17%* 18.2% (17%-19%)
xpected outcomes are presented with 95% confidence limits. *P � .07,
easure its reliability.6,10,11 t
The Journal of Thorac
In surgical practice morbidity and mortality are the mostommonly used clinical indicators of quality. When used asn outcome variable, however, complications have inherentroblems: their definition might be complex and subjective,nd their recording might vary among different institutionsnd even within the same unit during successive periods ofime. In this work complications were prospectively andndependently recorded at two different centers after strictriteria were preliminarily defined. It was our priority tossess the consistency of these definitions between the twoenters, and only those complications that were judged to beeliably consistent in definition and recording were used forhe analysis (see Appendix 1 for definition of variables).urthermore, the two main investigators (AB and GR) areember of the European Thoracic Database Committee7
nd share the same methods and purposes in variable defi-ition and database quality control. They were designated ashe clinical audit leads responsible for periodically verifyinghe quality of the databases.
The same issue applied for the selection of the variablesested for a possible association with outcomes. Only thoseigh-quality variables that were at least 95% complete inach database and were deemed to be consistent betweenhe two units were selected and used for the analysis.ariables that were more than 5% incomplete, such as
rgometric parameters (VO2max), blood gas analysis mea-ures, and albumin concentration, were not included in thenalysis. We are aware that our models might be imperfectnd subject to improvements in terms of individual discrim-nation by the addition of other important factors associatedith postoperative outcome (ie, ergometric parameters), but
hey are presumably the most reliable ones that we coulderive in the context of this analysis. They showed a goodace value and content validity and had a good predictivealidity, as assessed by using the bootstrap bagging simu-ation. Our models are parsimonious enough to obviateverfitting problems when applied to medium-sized popu-ations (particularly when the events are rare, such as mor-ality). It has recently been shown that increasing the num-er of predictors does not necessarily improve theiscrimination of the models.18 Conversely, keeping theodels as parsimonious as possible might be attractive
ecause it can prevent many problems: cost of data collec-
mortality rates within each unitMortality
Observed Predicted P value
4.8% 4.9% (4.5%-5.3%) .94.4%† 4.2% (3.6%-4.9%) .9
versus unit B. †P � .8, unit A versus unit B.
and
value
.9
.7
ion, errors and imprecision in data recording, missing val-
ic and Cardiovascular Surgery ● Volume 133, Number 1 93
ubr(c
wotmepat
odicypmrHpi
troimbaimaat
pwtuwwmlbfmWe
pscm
pogibSfitqrctittspjmpna
R
General Thoracic Surgery Brunelli et al
9
GTS
es, and instability of the model. The ideal model should beased on clinical, high-quality, prospectively compiled, pe-iodically audited, specialty-specific, and procedure-specificlung resection) databases. We think our models met theseriteria.
Bootstrapping was used to validate the models once theyere developed from the entire cohort of patients. We andthers have shown that this method is superior to the tradi-ional training and test splitting of the dataset, inasmuch asore reliable and reproducible predictive equations are gen-
rated.6,10 Each model was tested on 1000 bootstrap sam-les of the same number of patients as the original dataset,nd only reliable predictors were selected and factored intohe final regression equations.
As ever, caution is required in interpreting the predictionf a risk model in an individual patient. The individualiscrimination of the models (c statistics) was moderate butn line with the ones reported in other studies.5,8 Thisommon finding in surgical models might be partly due toet unknown predictors, to the difficulty to represent com-lex clinical conditions or pathways of care with one orore variables, and to catastrophic random events that are
are in the population but important for the single patients.19
owever, the models could be reliably applied to the wholeopulation of lung resection candidates as auditnstruments.
Another important issue central to every audit analysis ishe definition of quality of care, which most likely is theeflection of the entire process of care rather than of a singleutcome end point. However, in the absence of more precisenstruments to evaluate the quality of care in its wholeness,ultiple end points should be analyzed as a surrogate20
ecause each end point might be associated with a differentspect of the quality of care. In this regard our selectedndicators (morbidity and mortality) are only a few of the
ultiple end points that could be risk adjusted and used forudit purposes (eg, postoperative stay, intensive care unitdmission, technical complications, readmission rate, long-erm survival, quality of life, and residual functional state).
After development and validation, our models were ap-lied for predicting the outcomes in the two units, and theyere able to prevent misleading information derived from
he unadjusted analysis of the performance. In fact, despitenit A having a higher observed morbidity rate comparedith that of unit B, the observed outcome rates were in lineith the predicted ones in each unit. The increased observedorbidity in unit A could be explained by a worse physio-
ogic state of the patients at the time of operation rather thany a poorer performance, as shown also by the higherrequency of patients with higher predicted morbidity andortality risks in unit A compared with those in unit B.ithout the use of risk adjustment, unit A would have been
rroneously regarded as underperforming unit B.
4 The Journal of Thoracic and Cardiovascular Surgery ● Janua
It must be noted that our models were designed for auditurposes only and were not meant to be used for patientelection, a process that should be based more on individuallinical evaluation rather than on a population-based riskodel.21
This work confirmed that risk modeling is essential forrovider profiling and can be easily used for a fair comparisonf the performance between different centers, with the ultimateoal of improving the quality of surgical care. The costs formplementing and managing international multicentric data-ases (eg, the European Thoracic Surgery Database or theociety of Thoracic Surgeons thoracic database) seem there-ore justified by the benefits that could derive from the quality-mprovement processes that will be based on them. Evenhough start-up costs might be daunting, ultimately, improveduality will be cost-efficient, and part of any cost savingsealized by improved quality can be even factored into the totalosts of gathering and maintaining risk-adjusted data. We thinkhat important international cooperative processes for monitor-ng and standardization of the pathways of surgical care and forhe accreditation of structures cannot leave out of considerationhe use of reliable risk-adjustment models. As physicians, wehould assume complete responsibility in the evaluation of ourerformance. We should not let managers and administratorsudge our practice through imprecise and improper instru-ents. At a minimum, it would be in our best interest to
rovide them with the right evaluation tools, which mustecessarily take into account our proficiency in clinical riskdjustment.
eferences
1. Iezzoni LI. The risks of risk adjustment. JAMA. 1997;278:1600-7.2. Luft HS, Romano PS. Chance, continuity, and change in hospital
mortality rates. Coronary artery bypass graft patients in Californiahospitals, 1993 to 1998. JAMA. 1993;270:331-7.
3. Brunelli A, Fianchini A, Al Refai M, Gesuita R, Carle F. Internalcomparative audit in a thoracic surgery unit using the physiologicaland operative severity score for the enumeration of mortality andmorbidity (POSSUM). Eur J Cardiothorac Surg. 2001;19:924-8.
4. Brunelli A, Fianchini A, Al Refai M, Salati M. A model for the internalevaluation of the quality of care after lung resection in the elderly. EurJ Cardiothorac Surg. 2004;25:884-9.
5. Brunelli A, Xiumé F, Al Refai M, Salati M, Marasco R, Sabbatini A.Risk-adjusted morbidity, mortality and failure-to-rescue models forinternal provider profiling after major lung resection. Interact Cardio-vasc Thorac Surg. 2006;5:92-6.
6. Brunelli A, Rocco G. Internal validation of risk models in lungresection surgery: bootstrap versus training and test sampling. J Tho-rac Cardiovasc Surg. 2006;131:1243-7.
7. Berrisford R, Brunelli A, Rocco G, Treasure T, Utley M, on behalf ofthe Audit and Guidelines Committee of the European Association forCardiothoracic Surgery and the European Society of Thoracic Sur-geons. The European Thoracic Surgery Database project: modellingthe risk of in-hospital death following lung resection. Eur J Cardio-thorac Surg. 2005;28:306-11.
8. Harpole DH Jr, DeCamp MM Jr, Daley, Hur K, Oprian CA, Hender-son WG, Khuri SF. Prognostic models of thirty-day mortality and
morbidity after major pulmonary resection. J Thorac Cardiovasc Surg.1999;117:969-79.ry 2007

1
1
1
1
1
1
1
1
1
1
2
2
APTabD(n
Acw
pafbf
pfiif
twdrta
O
aEbupcrbfiu(tmmcocaf
DDbatn
ohmbetcqtrst
aoovqws
Brunelli et al General Thoracic Surgery
GTS
9. Ferguson MK, Durkin AE. A comparison of three scoring systems forpredicting complications after major lung resection. Eur J Cardiotho-rac Surg. 2003;23:35-42.
0. Blackstone EH. Breaking down barriers: helpful breakthrough statis-tical methods you need to understand better. J Thorac CardiovascSurg. 2001;122:430-9.
1. Grunkemeier GL, Wu YX. Bootstrap resampling method: somethingfor nothing? Ann Thorac Surg. 2004;1142-4.
2. Little AG, Rush VW, Bonner JA, Gaspar LE, Green MR, Webb WR,et al. Patterns of surgical care of lung cancer patients. Ann ThoracSurg. 2005;80:2051-6.
3. Allen MS, Darling GE, Pechet TT, Mitchell JD, Herndon JE, Landre-neau RJ, et al. Morbidity and mortality of major pulmonary resectionsin patients with early-stage lung cancer: initial results of the random-ised prospective ACOSOG Z0030 trial. Ann Thorac Surg. 2006;81:1013-20.
4. Ivanov J, Tu JV, Naylor CD. Ready-made, recalibrated or remodeled?Issues in the use of risk indexes for assessing mortality after coronaryartery bypass graft surgery. Circulation. 1999;99:2098-104.
5. DeLong ER, Peterson ED, DeLong DM, Muhlbaier LH, Hackett S,Mark DB. Comparing risk-adjustment methods for provider profiling.Stat Med. 1997;16:2645-64.
6. Orr RK, Naini BS, Sottile FD, Dumas EM, O’Mara P. A comparisonof four severity-adjusted models to predict mortality after coronaryartery bypass graft surgery. Arch Surg. 1995;130:301-6.
7. Chassin MK, Hannan EL, DeBuono BA. Benefits and hazards ofreporting medical outcome publicly. N Engl J Med. 1996;334:394-8.
8. Tu JV, Sykora K, Naylor CD. Assessing the outcome of coronaryartery bypass graft surgery: how many risk factors are enough? Steer-ing Committee of the cardiac Care Network of Ontario. J Am CollCardiol. 1997;30:1317-23.
9. Shahian DM, Blackstone EH, Edwards FH, Grover FL, GrunkemeierGL, Naftel DC, et al. Cardiac surgery risk models: a position article.Report from the STS workforce on evidence-based surgery. AnnThorac Surg. 2004;78:1868-77.
0. Silber JH, Rosenbaum PR, Schwartz JS, Ross RN, Williams SV.Evaluation of the complication rate as a measure of quality of care incoronary artery bypass graft surgery. JAMA. 1995;274:317-23.
1. Esteva H, Marchevsky A, Nunez T, Luna C, Esteva M. Neural net-works as a prognostic tool of surgical risk in lung resections. AnnThorac Surg. 2002;73:1576-81.
ppendix 1reoperative and Operative Variableshe following variables were initially screened for a possiblessociation with postoperative morbidity and mortality: age, sex,ody mass index (BMI; in kilograms per square meter), FEV1,LCO, ppoFEV1, ppoDLCO, cardiac comorbidity, type of disease
benign vs malignant), type of operation (lobectomy vs pneumo-ectomy), and neodjuvant chemotherapy.
Pulmonary function tests were performed according to themerican Thoracic Society criteria. Results of spirometry were
ollected after bronchodilator administration. DLCO measurementas performed by using the single-breath method.
FEV1, ppoFEV1, DLCO, and ppoDLCO values were expressed asercentages of predicted value for age, sex, and height. ppoFEV1
nd ppoDLCO values were calculated by estimating the amount ofunctioning parenchyma removed during operation by means ofronchoscopy, computed tomography, and quantitative lung per-usion.
For the purpose of the present study and in accordance withrevious investigations,4,5 a concomitant cardiac disease was de-ned as follows: previous cardiac surgery, previous myocardial
nfarction, history of coronary artery disease, and current treatment
or arrhythmia, cardiac failure, or hypertension. We chose to use tThe Journal of Thorac
his definition of cardiac comorbidity for the sake of comparisonith previous studies and for numeric reasons. In fact, breakingown the variable in the single cardiac diseases would haveesulted in too many cofactors with limited representation. Al-hough not weighed, all cardiac conditions included in the variablere widely recognized cardiac risk factors for noncardiac surgery.
utcome VariablesFor the purpose of this study, according to previous studies5,8,9
nd to the European Association for Cardiothoracic Surgery/uropean Society of Thoracic Surgeons thoracic surgery data-ase,7 the following complications were included: respiratory fail-re requiring mechanical ventilation for more than 48 hours,neumonia (chest radiographic infiltrates, increased white bloodell count, and fever), atelectasis requiring bronchoscopy, adultespiratory distress syndrome, pulmonary edema, pulmonary em-olism, myocardial infarction (suggestive electrocardiographicndings and increased myocardial enzymes), hemodynamicallynstable arrhythmia requiring medical treatment, cardiac failuresuggestive chest radiographs, physical examination, and symp-oms), acute renal failure (change in serum creatinine level �2g/dL compared with preoperative values), and stroke. For nu-eric reason, we did not separate cardiac and pulmonary compli-
ations. We also did not weigh complications in keeping with mostf the work done on morbidity; however, we included only thoseomplications that increased the complexity of postoperative man-gement, requiring new treatments or a change of treatment, there-ore adding up to hospital costs and stay.
iscussionr Mark S. Allen (Rochester, Minn). Dr Yang, Dr Sonett, mem-ers, and guests. I have no conflicts to disclose other than that I ammember of the Society of Thoracic Surgeons Database Commit-
ee, and therefore my encouragement to get you to join is herebyoted.
The authors are to be congratulated on an excellent presentationn a topic that is becoming increasingly important in the field ofealth care, and especially surgery. The push for quality improve-ent and the means to measure what good quality is has already
ecome an important part of our daily practice and can only bexpected to increase in importance in the future. Analyses such ashese using data with risk adjustment are very important so that wean accurately assess the progress we are making in improving theuality of care we deliver to our patients. This analysis of morehan 700 patients who underwent operations in two separate Eu-opean hospitals is a good example of how we, the surgeons,hould lead the effort so that it can be done in a scientific mannerhat is valid and meaningful.
I have several questions for the author. In your report you usedmodel to predict the number of complications. Because there is
bviously a difference between someone with symptomatic post-perative atrial fibrillation that is easily controlled with medicationersus someone with adult respiratory distress syndrome that re-uires prolonged ventilatory support and intensive care unit care,ere you able to dissect out from your data the risk factors for
pecific complications, or was there insignificant statistical power
o provide for these types of specific predictions?ic and Cardiovascular Surgery ● Volume 133, Number 1 95

wtpap
ctaapphslp
id
y
tfumns
cgcr
ddrmna1omtEt
amhtwmsaoctapm
cdch
aurwtd
ebop
pct
tb
osrdq
General Thoracic Surgery Brunelli et al
9
GTS
Second, the question that always arises in the United States ishether a board-certified thoracic surgeon has a better outcome
han a nonthoracic board-certified surgeon when performing aulmonary resection. Do you have the ability in your dataset tonswer this question using these European data? Were all of theserocedures performed by certified thoracic surgeons?
Finally, your statistical analysis is quite complicated, and I amertainly not a statistical expert; however, I am concerned abouthe relatively small sample size you have. With only 743 patientsnd 35 deaths in your analysis, that leaves the standard error forge at plus or minus about 30% of the risk coefficient for age andlus or minus 25% of the coefficient for the percent predictedostoperative FEV1. Did your statistician give you an estimate ofow many additional patients you would need to obtain a lowertandard of error, say, a plus or minus 5%. In other words, howarge of a database do we need to accumulate to get a more specificredictive number?
Again, I appreciate your efforts to provide us with stratificationn the field of pulmonary surgery and appreciate the opportunity toiscuss this article. Thank you.
Dr Brunelli. Thank you, Dr Allen, for your kind comments andour questions.
As to the first question, the complications, we did not weighthe complications, and therefore each complication was accountedor similarly, and I think we did not have the numbers to individ-ally dissect the complications, for example, to make separateodels for pulmonary and cardiac complications. Therefore, the
umbers and the statistical power precluded us from making thisubgroup analysis.
You asked about the qualifications of the surgeons. These twoenters were dedicated thoracic surgery units, and all of the sur-eons were qualified, certified thoracic surgeons. Therefore weould not assess the differences between credentials of surgeons inelation to outcome.
Finally, sample size is a major concern in our specialty whenealing with audit analysis. These are the numbers. Of course, 35eaths seems to be a low number, but we are confident that theesults are reliable. We used bootstrap analysis to validate theodel. The mortality model had two predictors, and therefore it is
ot overfitted, and the predictors had high stability with bootstrapnalysis, which means that we repeated the regression analysis in000 new simulated samples drawn with replacement from theriginal dataset, and these variables turned out to be significant inore than 85% or 90% of cases. It took us 5 years to aggregate
hese data, and these two units have the average volume load inurope, and this is a major concern. Even if you aggregate mul-
iple units, let us say 10, 20, or 100 units, when dealing with audit t
6 The Journal of Thoracic and Cardiovascular Surgery ● Janua
nd comparison between the units, we have to then apply theodels to the single units or to the single surgeon and then you can
ave problems. Perhaps we have to shift from outcome measureso other measures of quality of care, perhaps process measures,hich are less affected by random noise and numbers and perhapsore linked to the quality. Therefore, the main purpose of this
tudy was to provide an example or method, and of course therere limitations, but I think the limitations are inherent to theutcome measures selected. For this first audit, we wanted to do aomparative audit between two thoracic surgery units using thewo most commonly used outcome measures, which are morbiditynd mortality. But of course sample size is very important, anderhaps we can change our mentality and shift from outcomeeasures to process measures.
Dr Stephen C. Yang (Baltimore, Md). I am less of a statisti-ian than Dr Allen, but how would you see the results to beifferent if there was a significant difference in mortality rates oromplications between the two institutions? Would this model stillold?
Dr Brunelli. There was no significant difference—Dr Yang. I know, but what if?Dr Brunelli. Oh, what if? You have to assess whether there is
difference in the predicted and observed mortality within thenits. Therefore let us say we have a big difference in mortalityate, observed mortality rate between the two units. If the unitsere not in line with the predicted values, you can be confident
hat the difference is not due to poor performance but perhaps aifferent case mix.
Dr Joshua R. Sonett (New York, NY). But dead is dead in thend, and it does not matter what your risk model is if you have veryad outcomes. If it is much higher, then maybe that is a reflectionf patient selection, which must be considered when evaluatingrograms and surgeons.
Dr Brunelli. Yes, but we are dealing with audit analysis anderformance evaluation. Therefore it is unfair to judge a unit onrude mortality rate without taking into account the case mix andhe prevalence of risk factors.
Dr Yang. Well, even if the case mixes are different, what abouthe experience of the surgeons? Are they fairly well balancedetween the 2 units?
Dr Brunelli. Yes. We explored this, and the structural andrganizational characteristics of the two units were remarkablyimilar in credentials, experience of the surgeons, nurse-to-patientatio, intensive care unit policy, and management. They both wereedicated thoracic surgery wards. We were confident that theualifications and experience of the surgeons and the structure of
he units were similar.ry 2007