rising wage inequality and postgraduate education/file/2011_d3_3... · rising wage inequality and...
TRANSCRIPT
0
Preliminary Draft, Comments Welcome
Rising Wage Inequality and Postgraduate Education
Joanne Lindley*and Stephen Machin **
May 2011
* Department of Economics, University of Surrey ** Department of Economics, University College London and Centre for
Economic Performance, London School of Economics
Abstract
In this paper, we revisit the literature on rising wage inequality, which has tended to study narrowly defined wage differentials when exploring which between group inequality measures matter for explaining increased inequality. Our focus is on a hitherto relatively neglected subject, namely the role of postgraduate education in rising wage inequality. For the last forty years or so in the United States and Great Britain, we document increases in the number of workers with a postgraduate qualification. We also show that their relative wages have risen over time as compared to workers with only a college degree. Consideration of shifts in demand and supply uncovers trend increases in relative demand from postgraduate vis-à-vis college only workers. The final issue we consider is whether the type of postgraduate qualification held by workers are related to within graduate inequality changes. We offer some suggestive evidence that the changing mix of postgraduates and the resultant evolution of their labour market rewards has contributed to rising wage inequality among college graduates. JEL Keywords: Wage inequality; Postgraduate education JEL Classifications: J24; J31. Corresponding author: Joanne Lindley Email: [email protected]

1
1. Introduction
Rising wage differentials between education groups have been identified as a key
feature of rising wage inequality in a number of countries (most notably the US and
UK, but also elsewhere).1 Rising relative wages for college educated workers, despite
their increased numbers, and the increased relative demand for workers that are more
educated (and the drivers of such increase) have been prominent in discussions of
why wage inequality has risen.
One potentially significant drawback in this area has been the focus on
particular wage differentials and on the treatment of workers with different education
levels as homogeneous groups. For example, the influential US papers of Katz and
Murphy (1992), Card and Lemieux (2001) and Autor, Katz and Kearney (2008) all
consider the evolution through time of one particular educational wage differential,
the college only (i.e. 16 years of US education) to high school graduate wage gap (i.e.
12 years of education). In what has become known as the canonical supply-demand
model of the labour market (first introduced by Katz and Murphy, 1992, but harking
back in time to Tinbergen’s, 1975, model of the race between demand and supply)
supply is modelled for just two (aggregated) education groups: ‘college equivalent’
workers and ‘high school equivalent’ workers.2
Consideration of wage differentials and supply measures for only two
education groups amounts to an assumption invoked to simplify the analysis, but is a
potentially important one, given the increased heterogeneity of education. For
1 See Acemoglu and Autor (2010) for an up to date review of this literature, 2 In their estimation of simple supply-demand models in the US labour market, these authors assume the following for five groups of workers: workers with a high school degree supply one ‘high school equivalent’, whilst workers with less than a high school degree supply a (relative wage weighted) proportion of this; workers with a college degree supply one ‘college equivalent’, whilst workers with an advanced postgraduate degree supply a (relative wage weighted) mark up of this; and, finally, the intermediate group with some college are split between the two groups (Katz and Murphy, 1992, and Autor, Katz and Kearney, 2008, split them 50-50, whilst Card and Lemieux, 2001, assume they supply α high school equivalents and (1-α) college equivalents, where α is a high school weight used to measure the wages of some college workers as a weighted mean of high school and college wages.

2
example, it is well known that the variance of educational attainment has increased
through time, and that the labour market rewards to college major/subject of
university degree, to an undergraduate or postgraduate education institution attended,
class of degree all display increased variation over time.
In this paper, we focus on one important development in the nature of
increased educational heterogeneity. We study how the increase in postgraduate
education has contributed to rising wage inequality. This is an important area that, to
our knowledge, has been almost totally ignored by the contributors to the rising wage
inequality literature. This is perhaps surprising in that the few studies that do place a
focus on postgraduate wages and education do find a connection with rising wage
inequality. Lemieux (2006) looks at all postsecondary education, rather than just
college graduates, in a decomposition of inequality changes between the mid-1970s
and mid-2000s concluding that ‘Understanding why postsecondary education, as
opposed to other observed or unobserved measures of skills, plays such a dominant
role in changes in wage inequality should be an important priority for future research
[Lemieux, 2006, p.199].
For the last thirty to forty years in the United States and Great Britain, we
document increases in the number of workers with a postgraduate qualification. We
show that their relative wages have risen over time as compared to workers with only
a college degree. Consideration of shifts in their demand and supply uncovers trend
increases in relative demand for postgraduates that are a key driver of rising
inequality. In both countries up to the early 1990s, there is a trend increase in the
relative wages of college only workers, after which this trend turns back down. In the
US, this is countered by a long run relative demand shift (from 1963 to 2009) in
favour of postgraduates. In Britain, there is a turnaround or twist in relative demand

3
(from the early 1990s onwards) where a significant trend demand increase occurs for
workers with postgraduate education. The final issue we consider is whether the type
of postgraduate qualification held by workers are related to within graduate inequality
changes. We offer some suggestive evidence that the changing mix of postgraduates
and the resultant evolution of their labour market rewards has contributed to rising
wage inequality among college graduates.
The remainder of the paper is structured as follows. In Section 2, we
document changes in postgraduate education in the United States and Great Britain
over the last forty or so years. We also present some descriptive evidence on changes
in the relative wages of postgraduates compared to other workers. In Section 3, we
show results from estimating simple models of the relative demand and supply of
workers with different levels of education, placing a specific focus on whether one
can identify trend shifts for different groups of workers. In Section 4, for a shorter
time period than we were able to consider in the previous section, we study whether
there are notable differences for different postgraduate qualifications (Master's
degrees and doctorates). Finally, Section 5 concludes.
2. Changes in Postgraduate Employment and Wages
Rising Wage Inequality and Education
The broad motivation underpinning this paper comes from the observation that wage
inequality has risen very rapidly in the US and UK over the last thirty to forty years.
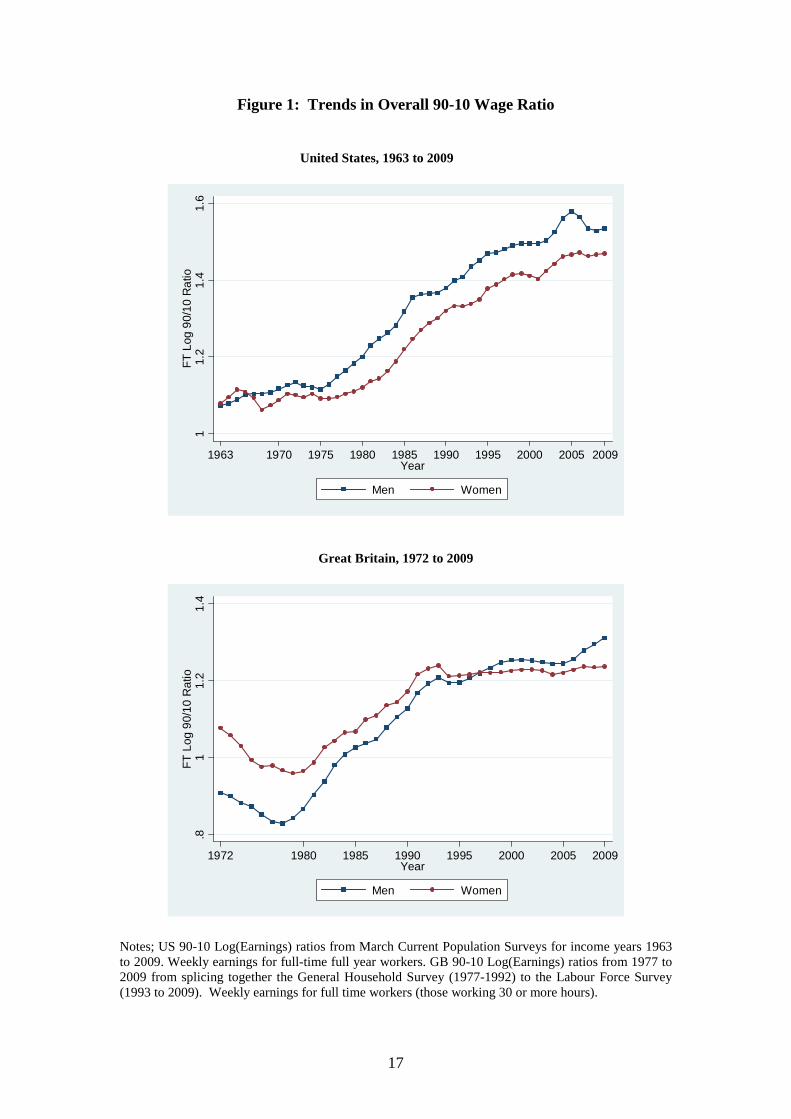
To see this, consider Figure 1 which shows the 90-10 ratio of log(weekly wages) for
full-time workers (and in the case of the US, full year workers) from the data sources
we analyse in this paper, the Current Population Survey (CPS) for the United States
and the General Household Survey (GHS) and Labour Force Survey (LFS) for Great
4
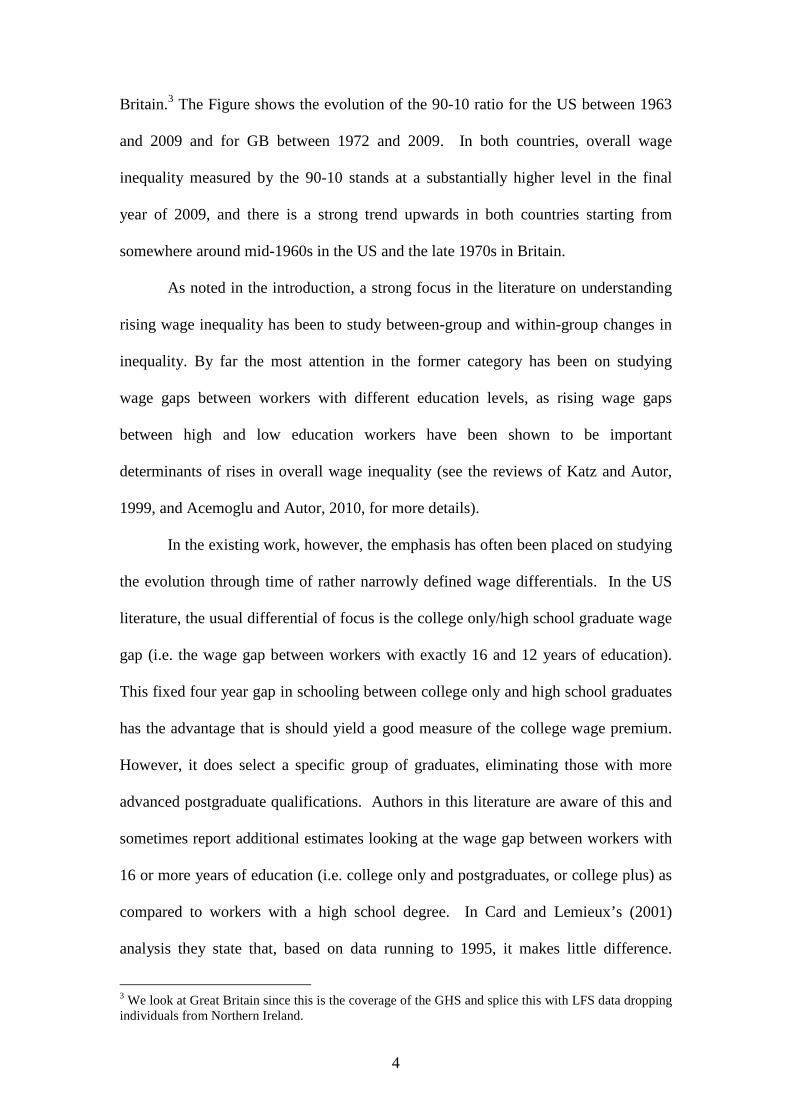
Britain.3 The Figure shows the evolution of the 90-10 ratio for the US between 1963
and 2009 and for GB between 1972 and 2009. In both countries, overall wage
inequality measured by the 90-10 stands at a substantially higher level in the final
year of 2009, and there is a strong trend upwards in both countries starting from
somewhere around mid-1960s in the US and the late 1970s in Britain.
As noted in the introduction, a strong focus in the literature on understanding
rising wage inequality has been to study between-group and within-group changes in
inequality. By far the most attention in the former category has been on studying
wage gaps between workers with different education levels, as rising wage gaps
between high and low education workers have been shown to be important
determinants of rises in overall wage inequality (see the reviews of Katz and Autor,
1999, and Acemoglu and Autor, 2010, for more details).
In the existing work, however, the emphasis has often been placed on studying
the evolution through time of rather narrowly defined wage differentials. In the US
literature, the usual differential of focus is the college only/high school graduate wage
gap (i.e. the wage gap between workers with exactly 16 and 12 years of education).
This fixed four year gap in schooling between college only and high school graduates
has the advantage that is should yield a good measure of the college wage premium.
However, it does select a specific group of graduates, eliminating those with more
advanced postgraduate qualifications. Authors in this literature are aware of this and
sometimes report additional estimates looking at the wage gap between workers with
16 or more years of education (i.e. college only and postgraduates, or college plus) as
compared to workers with a high school degree. In Card and Lemieux’s (2001)
analysis they state that, based on data running to 1995, it makes little difference.
3 We look at Great Britain since this is the coverage of the GHS and splice this with LFS data dropping individuals from Northern Ireland.

5
Other studies using more recent data than this (like Autor, Katz and Kearney, 2008)
focus only on the narrow measures.
We believe there is good reason to revisit this question. First, it is well known
that wage inequality has risen within the college plus group. Consider Figure 2, which
shows the 90-10 ratio for all graduates in the US and GB samples, now running from
1963 to 2009 in the US but (because of requiring a consistent education variable)
from 1977 to 2009 in GB. The Figure shows significant rises in graduate wage
inequality, a feature we investigate further in this paper to see if there are differences
between graduate workers with and without postgraduate qualifications. Second, the
relative employment and wages of postgraduate versus college only workers has
shifted through time. This is especially the case in the time periods after the data used
in existing work that does consider both college only and college plus measures ends.
We consider this in the next sub-section.
Trends in Postgraduate Employment and Wages
Table 1 shows the employment shares of all graduates (college degree or
higher), postgraduates and college only shares and the postgraduate share amongst
graduates for the United States and Great Britain over time. The upper panel of the
Table shows that the graduate proportion is higher in the US, rising from 0.12 in 1963
through to 0.35 by 2009. The decade by decade changes reveal a well known pattern,
where the employment share of graduates rose rapidly in the 1970s, and continues to
rise at a slower rate in the decade that followed. Considering the postgraduate and
college only proportions, they broadly show the same decade by decade pattern of
change, although the overall change is a little faster for postgraduates whose graduate
share rises to 35 percent of graduates by 2009 (up from 26 percent in 1963).
6
The GB numbers are in the lower panel of the Table. There is a rapid increase
in the share of graduates (from 0.06 in 1977 to 0.26 by 2009) which speeds up
through the decades. There is also a sharper increase in the postgraduate share, from
very low levels in 1977 (0.006), rising to just under 9 percent of the workforce in
2009. In 1977 10 percent of graduates had a postgraduate qualification and this rises
to 35 percent (a number very comparable with the US share) by 2009.
It is natural to next consider what happened to the relative wages of these
education groups and this is considered in Table 2. The first three rows of the Table
show wage differentials over time for the different graduate groups (college degree or
higher, postgraduates, college only) measured relative to intermediate groups of
workers (in the US high school graduates, in GB workers with intermediate
qualifications). The fourth row shows differentials between postgraduates and college
only workers (i.e. the gap between rows 2 and 3). The differentials are reported for
full-time workers aged 25 to 59 in both countries.
As is well known in the wage inequality literature, the wage differentials
between college graduates and the relevant intermediate groups rise significantly in
both countries through time. In both countries, there was a fall in the 1970s followed
by sharp rises thereafter. The first row shows that the college degree or higher group
had 0.63 higher log weekly wages in 2009 (up from .30 in 1963 and .32 in 1980) in
the US; in the UK the comparable gap relative to intermediate qualification workers
rose to 0.47 by 2009 (up from 0.42 in 1980, but with almost all the increase occurring
in the 1980s).
Turning to possible differences between the postgraduates and college only
workers, it is evident that postgraduates have significantly strengthened their relative
wage position in both countries. In the US the postgraduate/high school graduate

7
premium reaches 0.80 log points by 2009 (up by 0.50 log points from 0.30 in 1963).
However, the college only/high school premium also rises, but by less (going from
0.31 to 0.54). Hence the postgraduate/college only wage differential rises sharply
through time, from zero in 1963, but trending up continuously since, reaching a 0.25
log gap by 2009.
The temporal pattern is different in Britain. Relative to workers with
intermediate qualifications the postgraduate and college only wage gaps both increase
through time (going from 0.45 to 0.55 for postgraduates, and from 0.36 to 0.43 for
college only). This long change however masks an interesting shift between the two,
as shown in the final row of the Table. This row shows the postgraduate/college only
gap over time: this was 0.09 in 1978, and fell to 0.02 by 1990, before sharply rising
back up again to 0.12 by 2009.
Overall, Tables 1 and 2 show that the relative labour market fortunes of
postgraduate and college only workers have been different through time. The clear
pattern that emerges – despite different timing of change in the two countries – is the
increase in both the employment shares and wage differentials for postgraduates vis-
à-vis college only workers in both countries. The wage inequality literature has noted
coincident increases in relative supply and relative wages of the college only group
before and has developed empirical supply-demand models to consider their evolution
through time. To our knowledge, the within college graduates variation we have
identified has not been discussed in the context of these models and we turn to this in
the next section of the paper.

8
3. Supply-Demand Models of Postgraduate and College Education
In this section we consider how the relative wage and employment patterns
documented in the previous section of the paper map into shifts in the relative demand
and supply of workers with postgraduate and college education. To do so, we present
estimates of what has become known as the canonical model of relative supply and
demand where relative wage differentials of workers with different education levels
are empirically related to measures of the relative supply of the different groups and
proxies for demand (usually trends assumed driven by technical change). The origins
of this model are Tinbergen’s (1975) race between supply and demand, where relative
wage differentials between more and less educated workers rise through time if
demand outstrips supply, which was formalised in a general way by Katz and Murphy
(1992) and has been empirically estimated by a number of authors since (see
Acemoglu and Autor, 2010).
The Katz-Murphy approach begins with a Constant Elasticity of Substitution
production function where output in period t (Yt) is produced by two education groups
(E1t and E2t) with associated technical efficiency parameters (θ1t and θ2t) as follows:
1/ρρ
2t2tρ
1t1tt )EθE(θY += (1)
where ρ = 1 – 1/σE, where σE is the elasticity of substitution between the two
education groups.
Card and Lemieux (2001) note that this specification imposes the restriction
that different age groups with the same education level are perfect substitutes, an
assumption that is not consistent with the data they analyse where education-specific
wage differentials do not move in the same way through time. One can relax this
assumption by decomposing E1t and E2t into CES sub-aggregates as

9
1/η
j
η
1jt1j1t EβE
= ∑ and
1/η
j
η
2jt2j2t EβE
= ∑ , where there are j age groups and η = 1 –
1/σA, where σA is the elasticity of substitution between different age groups within the
same education level.4
If workers are paid their marginal productivity, we can derive a model for the
wage gap between group 1 and 2 workers as:
−
+
=
2t
1t
E2j
1j
2t
1t2jt
1jt
E
Elog
σ
1
β
βlog
θ
θlog
W
Wlog
jt2t
1t
2jt
1jt
A
uE
Elog
E
Elog
σ
1 +
−
−
(2)
Equation (2) is a generalised version of the canonical model allowing for
imperfect substitution between workers of different within education groups as well
as for substitutability across education groups. Card and Lemieux (2001) report
estimates of this model based on US data, and Autor, Katz and Kearney (2008)
present a variant where imperfect substitution is allowed across potential experience,
as a pose to age, groups. We permit variations across age groups in our analysis, but
also present robustness checks based on using potential experience.
Estimates of the Canonical Model
The model is implemented (as with other work in the area) by parameterising
the technological parameters in terms of a linear time trend (t) so that the estimating
equation becomes:
jt2t
1t
2jt
1jt3
2t
1t2102
jt
1jt
E
Elog
E
Elog
E
Elog t
W
Wlog e+
−
+
++=
δδδδ
(3)
4 Of course, if η = 1 (because σA is infinity owing to perfect substitution) this collapses back to the standard Katz-Murphy model.
10
where the coefficient on the trend δ1 indicates the relative demand shift over and
above supply changes, δ2 = -1/ σE, δ3 = -1/ σA and e is an error term.
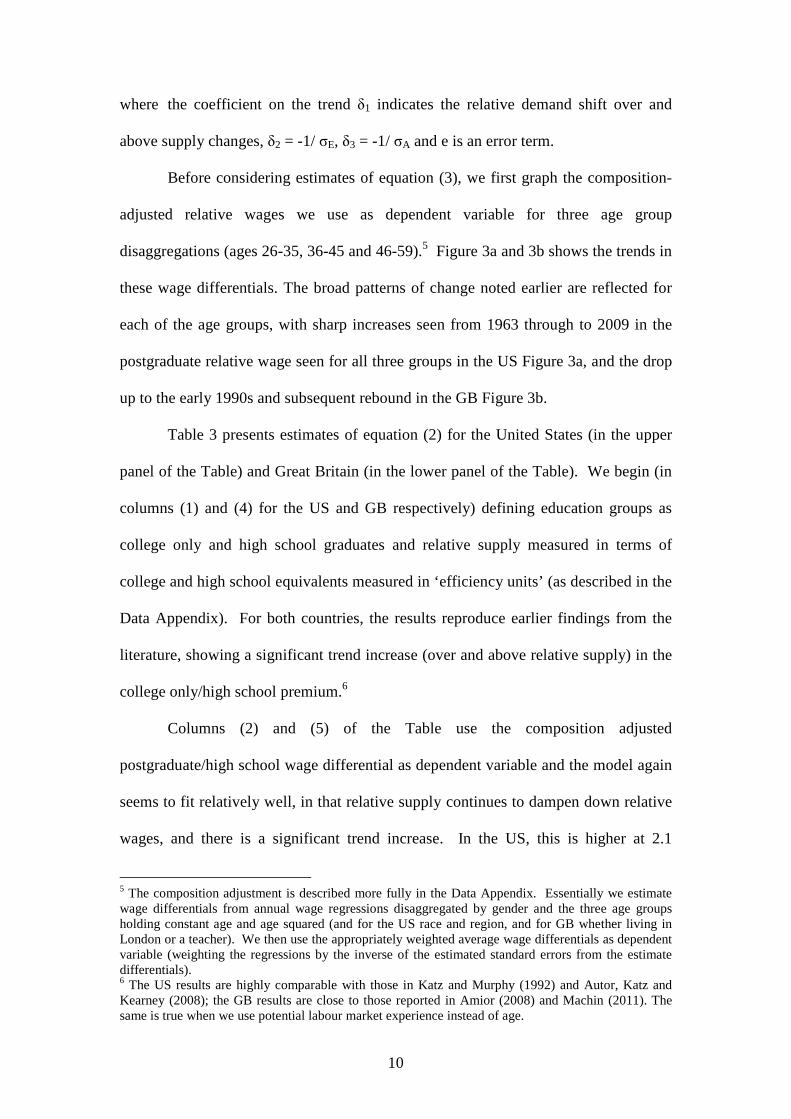
Before considering estimates of equation (3), we first graph the composition-
adjusted relative wages we use as dependent variable for three age group
disaggregations (ages 26-35, 36-45 and 46-59).5 Figure 3a and 3b shows the trends in
these wage differentials. The broad patterns of change noted earlier are reflected for
each of the age groups, with sharp increases seen from 1963 through to 2009 in the
postgraduate relative wage seen for all three groups in the US Figure 3a, and the drop
up to the early 1990s and subsequent rebound in the GB Figure 3b.
Table 3 presents estimates of equation (2) for the United States (in the upper
panel of the Table) and Great Britain (in the lower panel of the Table). We begin (in
columns (1) and (4) for the US and GB respectively) defining education groups as
college only and high school graduates and relative supply measured in terms of
college and high school equivalents measured in ‘efficiency units’ (as described in the
Data Appendix). For both countries, the results reproduce earlier findings from the
literature, showing a significant trend increase (over and above relative supply) in the
college only/high school premium.6
Columns (2) and (5) of the Table use the composition adjusted
postgraduate/high school wage differential as dependent variable and the model again
seems to fit relatively well, in that relative supply continues to dampen down relative
wages, and there is a significant trend increase. In the US, this is higher at 2.1
5 The composition adjustment is described more fully in the Data Appendix. Essentially we estimate wage differentials from annual wage regressions disaggregated by gender and the three age groups holding constant age and age squared (and for the US race and region, and for GB whether living in London or a teacher). We then use the appropriately weighted average wage differentials as dependent variable (weighting the regressions by the inverse of the estimated standard errors from the estimate differentials). 6 The US results are highly comparable with those in Katz and Murphy (1992) and Autor, Katz and Kearney (2008); the GB results are close to those reported in Amior (2008) and Machin (2011). The same is true when we use potential labour market experience instead of age.

11
percentage points per year for the postgraduate specification as compared to 1.1
percentage points per year for the college only estimate. The estimates in column (3),
where the differential under consideration is the postgraduate/college only differential
(together with an appropriately defined relative supply measure), confirm this with a
strongly significant trend in increase in the estimated differential of 0.6 percentage
points per year over and above supply within the graduate group.
Comparing the GB specifications in specifications (4) and (5) of the Table,
shows much the same trend increase for the college only to intermediate qualifications
comparison as for the comparison of postgraduate to intermediate qualifications.
Thus the column (6) model has an insignificant trend coefficient. As we will see
below, this is because this masks a turnaround, or twist, in the evolution of the
postgraduate/college only differential seen already in the Figures.
Acemoglu and Autor (2010) and Autor, Katz and Kearney (2008) note that,
whilst claiming the canonical model does well in terms of picking up some of the
general (and longer term7) trends in the relative position of college and high school
workers in the United States, the slowdown in the increase in education supply that
has occurred there means the model tends to over predict what has actually happened.
They thus augment equation (3) with non-linear time trends to allow for the fact that
the evolution of the college only/high school wage differential is not adequately
modelled via a linear trend but is better characterised by an inverse-U shaped
quadratic.
We consider this in Table 4 where we add a squared trend to the three
specifications considered in Table 3. Again, the upper panel reports US results and
the lower panel reports GB results. Consider first the US results in specifications (1)
7 See Goldin and Katz (2007) for estimates through the 20th century.

12
to (3). In the first two of these, the inverse U-shaped quadratic fits well. However,
the magnitudes of the trend increases are different, being larger for the postgraduate
comparison in specification (2). Thus, when the postgraduate/college only
comparison is considered in specification (3) the squared term is completely
insignificant in statistical terms and there is a linear trend in the postgraduate/high
school premium.
Table 4 adds a fourth specification for both countries. This is the canonical
model for the sub-sample that yields the highest trend increase when all possible sub-
samples are considered. Interestingly, for the United States, it is for the full sample,
showing that the strongest trend effect (of 0.6 percentage points per year) occurs when
considering the whole sample. A glance back at the composition adjusted wage
differentials given in the lower panel of Figure 3a shows that the pattern there is
robust to controlling for the relative supply changes between postgraduates and
college only workers in the US labour market and that relative demand has shifted in
favour of the former over the last 45 years.
The lower panel of Table 4 considers the British results. The inverse U-
shaped model works well in specification (5) for the college only/intermediate
comparison. However, it is less successful for the postgraduate/intermediate
comparison in (6). This maps into a turnaround/twist of the postgraduate/college only
differential with a U-shaped (rather than inverse U-shaped) relation showing a
significant fall to start with and then a bounce back (i.e. a significant negative linear
trend coefficient, but a significant positive coefficient on the square).
This twist is seen in specification (8) where the best fitting trend increase in
the postgraduate/college only gap appears for the sub-sample from 1993 to 2009. In
this period, there is a very sharp trend increase in the postgraduate/college only wage

13
differential over and above the relative supply change seen for the two groups. Thus,
as in the longer term period in the US, relative demand seems to have shifted over
time in favour of postgraduate workers as compared to college only workers. This
seems to be an important aspect of rising within-group inequality amongst graduates
that has, to date, been neglected by the literature.
4. Type of Postgraduate Qualification
The analysis so far considers whether workers have any postgraduate qualification.
This is the only measure available for the longer time periods we consider. From
1993 onwards in the US, and from 1996 onwards in Britain, we do have data on what
type of broad postgraduate qualification people hold. We can thus consider the
evolution of employment shares and relative wages within the postgraduate group for
people with Master’s degrees, doctorates and other postgraduate qualifications.
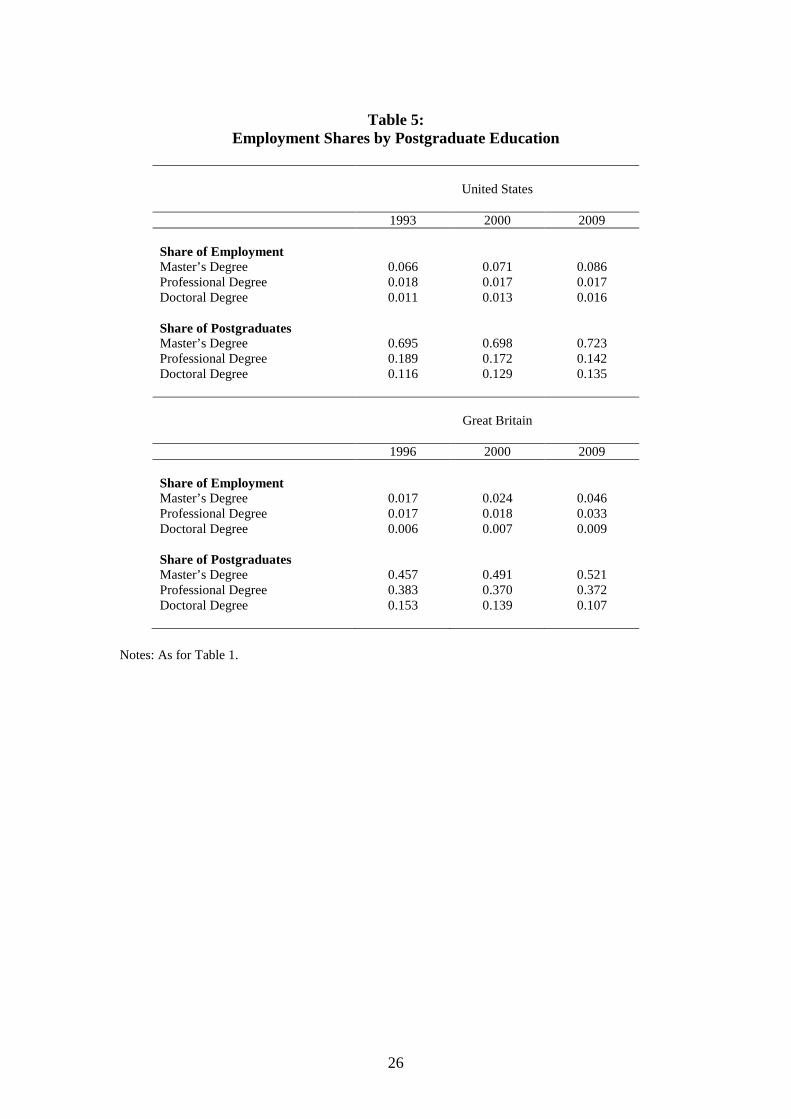
Employment Shares by Postgraduate Education
Table 5 shows the employment share and share amongst postgraduates of
these three qualification groups, from 1992 to 2009 in the upper panel for the US, and
from 1996 to 2009 in the lower panel for GB. In both countries, the biggest share is
for Master’s degrees, and this is the group seeing the larger increase in relative
supply. In the US, the share of Master’s rises, whilst the share of professional
qualifications falls, and the share of doctorates remains relatively constant. In Britain,
the Master’s share goes up, with the professional degree group staying constant and
the share of postgraduates with a PhD falling.

14
Relative Wage Differentials
Table 6 considers the evolution of wage differentials for those with Master’s degrees
and doctorates as compared to workers with just a college degree.8 The wage
differentials rise over the period considered for Master’s and doctorates in both
countries, but by more in the latter case.
Using similar methods to those used in the previous section, Figure 4 graphs
the trends in the composition-adjusted postgraduate wage differentials for those with
Master’s degrees and doctorates again relative to those with college only
qualifications. For both countries these clearly fan out. The doctorates are pulling
away from the Masters qualifications in terms of pay though this is mainly a
consequence of the fall in their supply, thus explaining within post-graduate
qualification increasing inequality. These patterns help to explain the rising wage
inequality observed from in the divergence of the 90-10 within graduate group as
presented in Figure 2.
5. Conclusions
In this paper, we focus on what we view as a rather neglected, but potentially
important, aspect of how increased educational heterogeneity may have impacted on
rising wage inequality. We study how the increase in postgraduate education in the
United States and Great Britain has contributed to rising wage inequality. We
document that, for the last thirty to forty years, there have been increases in the
number of workers with a postgraduate qualification. We show that, at the same time,
their relative wages have risen as compared to workers with only a college degree.
Consideration of shifts in their demand and supply uncovers trend increases in relative 8 The composition of the professional degree group differs substantially across the two countries since they consist largely of professionals in the US whereas in Britain a substantial number are those with post-graduate teaching qualifications.

15
demand for postgraduates that are a key driver of rising inequality. In both countries
up to the early 1990s, there is a trend increase in the relative wages of college only
workers, after which this trend turns back down. In the US this is countered by a long
run relative demand shift (from 1963 to 2009) in favour of postgraduates. In Britain,
there is a turnaround or twist in relative demand (from the early 1990s onwards)
where a significant trend demand increase occurs for workers with postgraduate
education. The final issue we consider is whether the type of postgraduate
qualification held by workers are related to within graduate inequality changes. We
offer some suggestive evidence that the changing mix of postgraduates and the
resultant evolution of their labour market rewards has contributed to rising wage
inequality among college graduates.
16
References
Acemoglu, D. and D. Autor (2010) Skills, Tasks and Technologies: Implications for Employment and Earnings, in Ashenfelter, O. and D. Card (eds.) Handbook of Labor Economics Volume 4, Amsterdam: Elsevier.
Amior, M. (2008) The Skill Divide and the North-South Graduate Exodus: How have
Changes in the Supply and Demand for Graduate Workers Affected Britain’s Regional Labour Markets?, unpublished MSc dissertation, University College London.
Autor, D., L. Katz, and M. Kearney (2008) Trends in U.S. Wage Inequality: Re-
Assessing the Revisionists, Review of Economics and Statistics, 90 300-323. Autor, D., F. Levy and R. Murnane (2003) The Skill Content of Recent Technological
Change: An Empirical Investigation, Quarterly Journal of Economics, 118, 1279-1333.
Card, D. and T. Lemieux (2001) Can Falling Supply Explain the Rising Return to
College for Younger Men? A Cohort-Based Analysis, Quarterly Journal of Economics, 116, 705-46.
Goldin, C. and L. Katz (2007) The Race Between Education and Technology: The
Evolution of US Educational Wage Differentials, 1890 to 2005, National Bureau of Economic Research Working Paper 12984.
Katz, L. and K. Murphy (1992) Changes in Relative Wages, 1963-87: Supply and
Demand Factors, Quarterly Journal of Economics, 107, 35-78. Lemieux, T. (2006) Postsecondary Education and Increasing Wage Inequality,
American Economic Review, Papers and Proceedings, 96, 195-99. Machin, S. (2011) Changes in UK Wage Inequality Over the Last Forty Years, in P.
Gregg and J. Wadsworth (eds.) The Labour Market in Winter - The State of Working Britain 2010, Oxford University Press.
Machin, S. and J. Van Reenen (1998) Technology and Changes in Skill Structure:
Evidence From Seven OECD countries, Quarterly Journal of Economics, 113, 1215-44.
Tinbergen, J. (1974) Substitution of Graduate by Other Labour, Kyklos, 27, 217-26.
17
Figure 1: Trends in Overall 90-10 Wage Ratio
United States, 1963 to 2009
11.
21.
41.
6F
T L
og 9
0/10
Ra
tio
1963 1970 1975 1980 1985 1990 1995 2000 2005 2009Year
Men Women
Great Britain, 1972 to 2009
.81
1.2
1.4
FT
Log
90/
10 R
atio
1972 1980 1985 1990 1995 2000 2005 2009Year
Men Women
Notes; US 90-10 Log(Earnings) ratios from March Current Population Surveys for income years 1963 to 2009. Weekly earnings for full-time full year workers. GB 90-10 Log(Earnings) ratios from 1977 to 2009 from splicing together the General Household Survey (1977-1992) to the Labour Force Survey (1993 to 2009). Weekly earnings for full time workers (those working 30 or more hours).

18
Figure 2: Trends in 90-10 Wage Ratio For Graduates
United States, 1963 to 2009
.91.
11.
31.
5Lo
g E
arni
ngs
Rat
io
1963 1970 1975 1980 1985 1990 1995 2000 2005 2009Year
Men Graduates Women Graduates
Great Britain, 1977 to 2009
.81
1.2
1.4
Log
Ear
ning
s R
atio
1977 1980 1985 1990 1995 2000 2005 2009Year
Men Graduates Women Graduates
Notes: As for Figure 1.

19
Figure 3a: Trends in Composition Adjusted Postgraduate Wage Differentials
Postgraduate/High School - United States, 1963 to 2009
.1.3
.5.7
.9T
rend
s in
Wag
e D
iffer
entia
ls
1963 1970 1975 1980 1985 1990 1995 2000 2005 2009Year
PG/HSG, 26-35 PG/HSG, 36-45PG/HSG, 46-59
Postgraduate/College Only - United States, 1963 to 2009
0.1
.2.3
Tre
nds
in W
age
Diff
eren
tials
1963 1970 1975 1980 1985 1990 1995 2000 2005 2009Year
PG/College, 26-35 PG/College, 36-45PG/College, 46-59

20
Figure 3b: Trends in Composition Adjusted Postgraduate Wage Differentials
Postgraduate/Intermediate – Great Britain, 1978 to 2009
.2.3
.4.5
.6.7
Tre
nds
in W
age
Diff
eren
tials
1978 1985 1990 1995 2000 2005 2009Year
PG/Inter, 26-35 PG/Inter, 36-45PG/Inter, 46-59
Postgraduate/College Only - Great Britain, 1978 to 2009
-.05
0.0
5.1
.15
.2T
rend
s in
Wag
e D
iffer
entia
ls
1978 1985 1990 1995 2000 2005 2009Year
PG/College, 26-35 PG/College, 36-45PG/College, 46-59

21
Figure 4: Wage Differentials by Postgraduate Qualification
United States, 1992 to 2009
.1.2
.3.4
Tre
nds
in P
ostg
radu
ate
Wag
e D
iffer
entia
ls
1992 1995 2000 2005 2009Year
Master's/College Doctorate/College
Great Britain, 1993 to 2009
.05
.1.1
5.2
.25
Tre
nds
in P
ostg
radu
ate
Wag
e D
iffer
entia
ls
1996 2000 2005 2009Year
Master's/College Doctorate/College

22
Table 1:
Employment Shares by Education
United States
1963 1970 1980 1990 2000 2009
College Degree or Higher 0.123 0.145 0.224 0.267 0.307 0.346 Postgraduate Degree 0.032 0.041 0.068 0.083 0.101 0.119 College Degree Only 0.090 0.104 0.155 0.183 0.206 0.227 Postgraduate Share 0.260 0.282 0.306 0.313 0.330 0.345
Great Britain
1977 1980 1990 2000 2009 College Degree or Higher 0.058 0.072 0.119 0.161 0.255 Postgraduate Degree 0.006 0.011 0.017 0.048 0.088 College Degree Only 0.052 0.061 0.102 0.113 0.167 Postgraduate Share 0.100 0.158 0.141 0.297 0.346
Notes: Source for United States is March Current Population Surveys. Source for Great Britain is 1977, 1980 and 1990 General Household Surveys and the 2000 and 2009 Labour Force Surveys. Employment shares are defined for people in work aged 25 to 59 inclusive.

23
Table 2: Wage Differentials by Education
United States
1963 1970 1980 1990 2000 2009 College Degree or Higher 0.304
(0.011) 0.381
(0.007) 0.324
(0.006) 0.467
(0.006) 0.585
(0.007) 0.634
(0.006) Postgraduate Degree 0.301
(0.020) 0.413
(0.013) 0.397
(0.009) 0.572
(0.009) 0.718
(0.010) 0.799
(0.008) College Degree Only 0.306
(0.012) 0.369
(0.008) 0.291
(0.007) 0.420
(0.006) 0.519
(0.008) 0.544
(0.007) Postgraduate Degree Versus College Degree Only
-0.005 (0.021)
0.044 (0.014)
0.106 (0.011)
0.151 (0.010)
0.199 (0.010)
0.254 (0.008)
Sample Size 13481 25397 32443 37211 30595 44900
Great Britain
1977-79 1979-81 1989-91 2000 2009 College Degree or Higher 0.374
(0.010) 0.418
(0.010) 0.461
(0.011) 0.465
(0.006) 0.471
(0.006) Postgraduate Degree 0.453
(0.023) 0.465
(0.023) 0.475
(0.026) 0.538
(0.010) 0.547
(0.019) College Degree Only 0.361
(0.011) 0.409
(0.011) 0.459
(0.011) 0.432
(0.007) 0.428
(0.007) Postgraduate Degree Versus College Degree Only
0.092 (0.025)
0.056 (0.025)
0.016 (0.028)
0.106 (0.012)
0.120 (0.011)
Sample Size 19790 19059 15030 40393 30173
Notes: Source for United States is March Current Population Survey. Source for Great Britain is 1977-79, 1979-81 and 1989-91 General Household Surveys (pooled for three years for reasons of sample size) and the 2000 and 2009 Labour Force Surveys. Full time full-year workers aged 25 to 59 in the US; full time workers aged 25 to 59 in GB. Wage differentials relative to high school graduates in the US and intermediate qualifications in GB. Control variables included are: gender, age, age squared, region and race (US); gender, age, age squared, London and teacher (GB). Standard errors in parentheses.

24
Table 3:
Estimates of the Canonical Supply-Demand Model of Educational Wage Differentials
United States,
1963-2009
(1) (2) (3) Wage Differential College Only/
High School Postgraduate/ High School
Postgraduate/ College Only
Relative Supply College Equivalent/ High School Equivalent
College Equivalent/ High School Equivalent
Postgraduate/ College Only
Log(Age Specific Relative Supply) - Log(Aggregate Relative Supply)
-0.274 (0.019)
-0.203 (0.027)
-0.007 (0.027)
Log(Aggregate Relative Supply) -0.302 (0.023)
-0.342 (0.033)
-0.074 (0.056)
Trend 0.011 (0.001)
0.021 (0.001)
0.006 (0.001)
Sample Size 141 141 141 R-Squared 0.94 0.95 0.82
Great Britain, 1978-2009
(4) (5) (6) Wage Differential College Only/
Intermediate Postgraduate/ Intermediate
Postgraduate/ College Only
Relative Supply College Equivalent/ Intermediate Equivalent
College Equivalent/ Intermediate Equivalent
Postgraduate/ College Only
Log(Age Specific Relative Supply) - Log(Aggregate Relative Supply)
-0.126 (0.032)
-0.045 (0.049)
0.091 (0.057)
Log(Aggregate Relative Supply) -0.132 (0.029)
-0.130 (0.046)
0.026 (0.038)
Trend 0.007 (0.001)
0.008 (0.001)
0.000 (0.002)
Sample Size 96 96 96 R-Squared 0.84 0.90 0.20
Notes: The dependent variable is the log of the relevant fixed weighted (composition adjusted) wage differentials. Standard errors in parentheses. Three age-specific groups per country (26-35, 36-45 and 46-59).

25
Table 4: Estimates of the Canonical Supply-Demand
Model of Educational Wage Differentials, Trend Non-Linearities
United States
(1) (2) (3) (4) Wage Differential College Only/
High School Postgraduate/ High School
Postgraduate/ College Only
Postgraduate/ College Only
Relative Supply College Equivalent/ High School Equivalent
College Equivalent/ High School Equivalent
Postgraduate/ College Only
Postgraduate/ College Only
Time Period 1963-2009 1963-2009 1963-2009 1963-2009 Log(Age Specific Relative Supply) - Log(Aggregate Relative Supply)
-0.270 (0.017)
-0.202 (0.024)
-0.007 (0.027)
-0.007 (0.027)
Log(Aggregate Relative Supply) -0.548 (0.054)
-0.716 (0.078)
-0.104 (0.079)
-0.074 (0.056)
Trend 0.030 (0.003)
0.044 (0.005)
0.007 (0.002)
0.006 (0.001)
Trend Squared/100 -0.017 (0.003)
-0.026 (0.001)
-0.000 (.0001)
Sample Size 141 141 141 141 R-Squared 0.95 0.96 0.82 0.82
Great Britain
(5) (6) (7) (8) Wage Differential College Only/
Intermediate Postgraduate/ Intermediate
Postgraduate/ College Only
Postgraduate/ College Only
Relative Supply College Equivalent/ Intermediate Equivalent
College Equivalent/ Intermediate Equivalent
Postgraduate/ College Only
Postgraduate/ College Only
Time Period 1978-2009 1978-2009 1978-2009 1993-2009 Log(Age Specific Relative Supply) - Log(Aggregate Relative Supply)
-0.112 (0.031)
-0.057 (0.049)
0.079 (0.054)
0.103 (0.127)
Log(Aggregate Relative Supply) -0.120 (0.028)
-0.157 (0.047)
0.030 (0.036)
-0.113 (0.058)
Trend 0.014 (0.003)
0.000 (0.004)
-0.015 (0.005)
0.009 (0.003)
Trend Squared/100 -0.011 (0.005)
0.013 (0.007)
0.022 (0.007)
Sample Size 96 96 96 51 R-Squared 0.90 0.80 0.28 0.56
Notes: As for Table 3.
26
Table 5:
Employment Shares by Postgraduate Education
United States
1993 2000 2009
Share of Employment Master’s Degree 0.066 0.071 0.086 Professional Degree 0.018 0.017 0.017 Doctoral Degree 0.011 0.013 0.016 Share of Postgraduates Master’s Degree 0.695 0.698 0.723 Professional Degree 0.189 0.172 0.142 Doctoral Degree 0.116 0.129 0.135
Great Britain
1996 2000 2009 Share of Employment Master’s Degree 0.017 0.024 0.046 Professional Degree 0.017 0.018 0.033 Doctoral Degree 0.006 0.007 0.009 Share of Postgraduates Master’s Degree 0.457 0.491 0.521 Professional Degree 0.383 0.370 0.372 Doctoral Degree 0.153 0.139 0.107
Notes: As for Table 1.

27
Table 6:
Wage Differentials by Postgraduate Education
United States
1993 2000 2009
Master’s Degree 0.119
(0.011) 0.147
(0.012) 0.186
(0.006) Doctoral Degree 0.254
(0.024) 0.246
(0.025) 0.369
(0.019)
Great Britain
1996 2000 2009 Master’s Degree 0.087
(0.024) 0.139
(0.015) 0.121
(0.014) Doctoral Degree 0.178
(0.040) 0.208
(0.026) 0.242
(0.026)
Notes: As for Table 2. Wage differentials relative to college only.