rishab ghosh, kirsten haaland, and bronwyn h. hallbhhall/papers/ghh08_dime_presentation.pdf · 4...
TRANSCRIPT

1
Which firms participate in open source software
development?A study using data from Debian
Rishab Ghosh, Kirsten Haaland, and Bronwyn H. Hall
What is this paper about?
� Facts rather than hypotheses
� i.e., curiosity driven research
� Many firms contribute to open source software
� Which are they, and where do they come from (region, industry, size?)
� Based on Debian source code from 5 releases (1998-2005)
� Preliminary!

2
Why do firms contribute to open source (with their own money)?**apologies to Nate RosenbergNote: Lerner and Tirole (2004) report that IBM spent >$1B on OSS in
2001� Enables customization to their own needs (Kuan 2002; Bessen
2002)� Subcase: provision of drivers for new hardware� Harhoff, Henkel et al (2003) – sponsored standards
� De novo entry with a new business model built on services (Dahlander 2007, inter alia)
� Fosfuri et al. (2003) stress pre-OSS firm assets as determinants –OSS contributors have SW tech competence and HW market presence (e.g., IBM, Sun, H-P)
� Absorptive capacity – positions the firm to take advantage of new developments in software (Rosenberg 1990, Cohen and Levinthal 1989)
Debian description (1)
� According to the website (http://www.debian.org):� “The Debian Project is an association of individuals who have
made common cause to create a free operating system. This operating system that we have created is called Debian GNU/Linux, or simply Debian for short.
� ...... Debian GNU/Linux provides more than a pure OS: it comes with over 18733 packages, precompiled software bundled up in a nice format for easy installation on your machine.”
� Largest distribution of FLOSS software in terms of number of packages and lines of code, about 250M� supports a large number of hardware platforms
� stable and mature
3
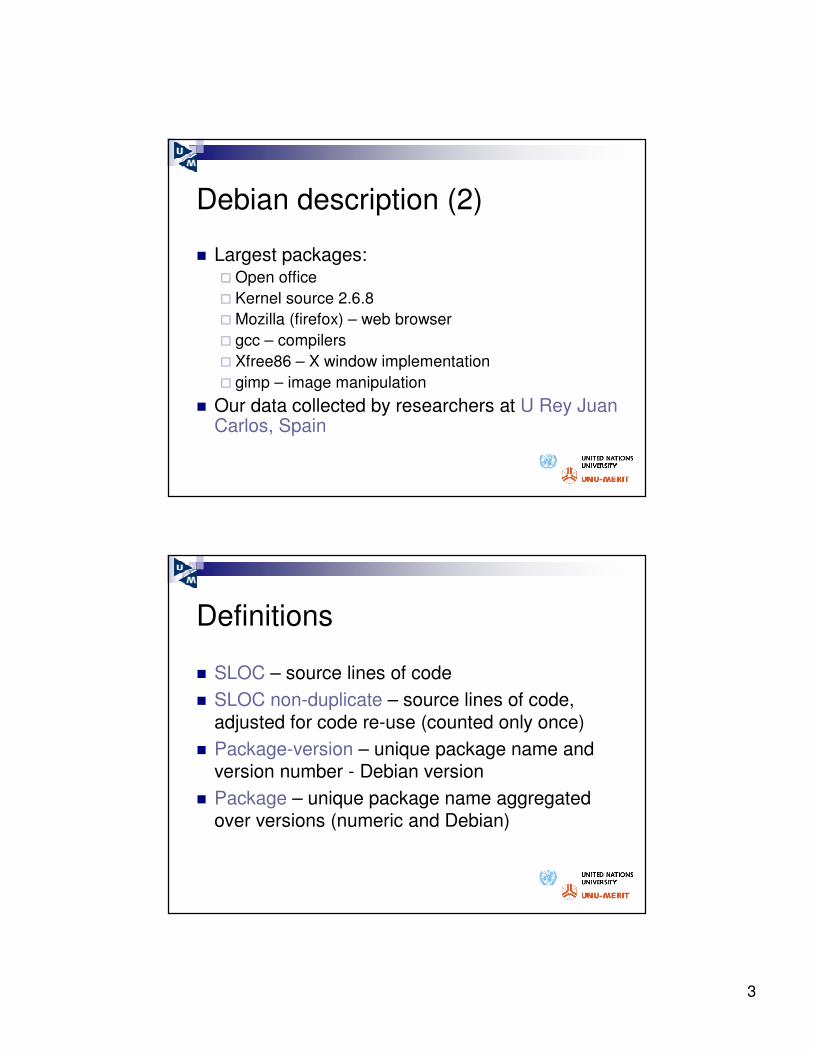
Debian description (2)
� Largest packages:� Open office
� Kernel source 2.6.8
� Mozilla (firefox) – web browser
� gcc – compilers
� Xfree86 – X window implementation
� gimp – image manipulation
� Our data collected by researchers at U Rey Juan Carlos, Spain
Definitions
� SLOC – source lines of code
� SLOC non-duplicate – source lines of code, adjusted for code re-use (counted only once)
� Package-version – unique package name and version number - Debian version
� Package – unique package name aggregated over versions (numeric and Debian)

4
Debian versions in our data
6 June 2005
19 July 2002
14 August 2000
9 March 1999
24 July 1998
Release date
1050 daysSarge3.1
705 daysWoody3.0
510 daysPotato2.2
200 daysSlink2.1
Hamm2.0
Time between releases
Debian version name
Debian version number
Contributions to Debian by version release date
0
50
100
150
200
250
300
Mar-97 Jul-98 Dec-99 Apr-01 Sep-02 Jan-04 May-05 Oct-06
SLO
C (
mill
ion
s)
All code Adjusted for re-use
5
0%
10%
20%
30%
40%
50%
60%
70%
80%
90%
100%
hamm slink potato woody sarge
Debian version
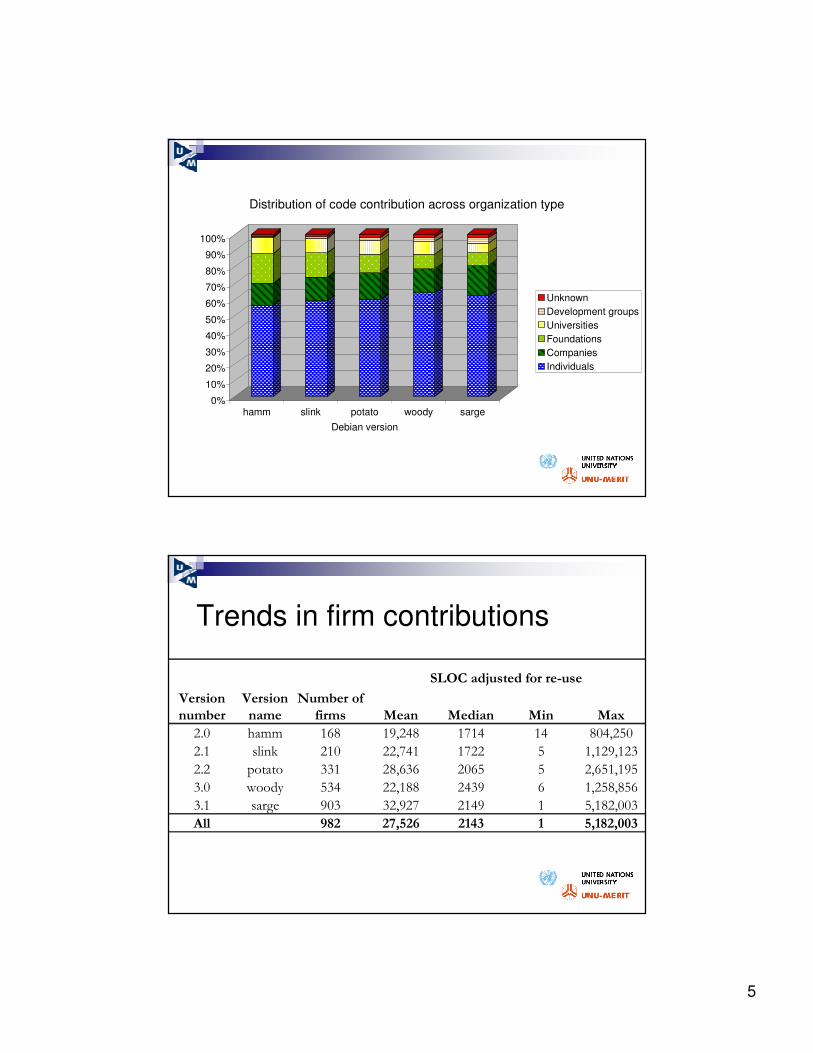
Distribution of code contribution across organization type
Unknown
Development groups
Universities
Foundations
Companies
Individuals
Trends in firm contributions
Version
number
Version
name
Number of
firms Mean Median Min Max
2.0 hamm 168 19,248 1714 14 804,250
2.1 slink 210 22,741 1722 5 1,129,123
2.2 potato 331 28,636 2065 5 2,651,195
3.0 woody 534 22,188 2439 6 1,258,856
3.1 sarge 903 32,927 2149 1 5,182,003
All 982 27,526 2143 1 5,182,003
SLOC adjusted for re-use

6
Distribution of the share of firm contributions to SLOC (unduplicated, weighted by size of package)
0.0%
10.0%
20.0%
30.0%
40.0%
50.0%
60.0%
hamm slink potato woody sarge
Version
Sh
are
of
pa
ckag
es
0 to 1% 1 to 40% 40 to 80% 80 to 99% >99%
Extreme skewness
� Half the firms contribute to only one package and 7 firms contribute to more than 100:
� Aladdin Enterprises, Hewlett-Packard (incl. Compaq and Dec), IBM, Red Hat, RSA Data Security, Silicon Graphics, Sun Microsystems
� 60% of packages have contributions from one firm and 5 have contributions from more than 50:
� kernel-image-hppa, kernel-image-ia64, kernel-source, linux-kernel-headers, xfree86

7
Nevertheless, distribution looks log normal Distribution of the size of each firm-version contribution
Fre
qu
en
cy
Log of SLOC, adj for code re-use0 5 10 15
0
149
Next few slides
� Characteristics of the firms that contribute, by
�Employment size (<10, 11-20, 21-99, 100-499, 500+)
�Sector (various software/hardware sectors, other services and manufacturing)
�Region (North America, Europe, Asia, Oceania, Africa & Mideast, Latin America)

8
Firm size distribution
982
211
92
246
224
168
41
Number of sample firms
65.4%Large: >500
100.0%All
5.9%Medium: 100-499
11.1%Small: 20-99
6.3%Small: 10-19
9.0%Micro: <10
2.3%unknown*
Share of firm SLOC contribution
Employee size class
Size distribution of firms and contributions
0%
10%
20%
30%
40%
50%
60%
70%
80%
90%
100%
Number of firms onHoovers**
Number of samplefirms
Total number ofpackages
Total SLOCcontributions
Large
Medium
Small 21-99
Small 11-20
Micro
Size unknown

9
Geographic distribution of firms and contributions
0%
10%
20%
30%
40%
50%
60%
70%
80%
90%
100%
Number ofproject leaders
Number offirms on
Hoovers**
Number ofsample firms
Number ofpackage-versions
Total SLOCcontributions
Oceania
North America
Latin America
Europe
Asia
Africa & Middle East
Unknown
Industry distribution of firms and contributions
0%
10%
20%
30%
40%
50%
60%
70%
80%
90%
100%
Number of firms onHoovers**
Number of samplefirms
Number ofpackage-versions
Total SLOCcontributions
Utilities
FIRE
Trade
Bus&eng services
Information
Other mfg
Elec equip
Telecomm
Computers
Software
Size unknown

10
Probability that a firm contributes to Debian
� Logit regression on grouped data (weighted and unweighted) – 108 observations
� Relative to large North American software firms:� Equally likely: European and Oceania firms, electrical
and electronics firms, micro-sized firms (perhaps)
� All others less likely, esp. bus/eng services, FIRE, other manufacturing, non-telecomm utilities, small firms with 10-99 employees
� Explanatory power > 0.9
Size of the average contribution to Debian
� Log (average SLOC) regressed on cell characteristics (weighted and unweighted) – 108 observations
� Relative to large North American software firms:� Same size: European firms, computer hardware, telecomm
services
� All others have smaller contributions, with the possible exceptions of Asian firms, electric and electronics firms, and other manufacturing
� Explanatory power approximately 0.5
� Effects are large, typically -100% to -200%

11
Conditional on contributing
� Relative to large North American software firms:� By region: size of the contribution is the same, but Asian,
European, and Oceanic firms contribute to fewer packages
� By sector: most contribute to fewer packages and size of contribution is smaller. Some exceptions:
� computer hardware firms contribute to more packages and the sizes if their contribution are larger
� telecomm services contributes about the same as software
� elec eq contributes to fewer packages but size of contribution the same as software
� By size: smaller firms make smaller and fewer contributions
� Effects are large, typically -100% to -200%
Summary
� Regressions plus informal evidence show that
� Largely a US/Canadian/Australian/European activity
� Concentrated in computer hardware/software
� Largest code contributors are SW/HW firms like IBM and Sun, also firms exiting the sector (Dec, Netscape, etc.)
� Many contributors are small hardware firms supplying drivers or other interface software

12
Future work
� More focus on entry and timing
� Choose a matched sample of non-contributing firms and compare
� Add the patenting activity of these firms –how does OSS interact with IP?
Share of code reuse by type of contributor
0.00%
10.00%
20.00%
30.00%
40.00%
50.00%
60.00%
70.00%
80.00%
Hamm Slink Potato Woody Sarge
Individual Authors
Companies
Foundations
Universities
Development Groups
Unknown