rise uk 2009
TRANSCRIPT

The SELENAThe SELENA––RISeRISe Open Risk PackageOpen Risk Packagep gp g
D.H. Lang, S. Molina, V. Gutiérrez, C.D. Lindholm, and F. LingvallD.H. Lang, S. Molina, V. Gutiérrez, C.D. Lindholm, and F. LingvallNORSAR/International Center of Geohazards (ICG)
Kjeller, Norway
International Conference on Open Risk AnalysisCambridge, UK 12-13 June 2009
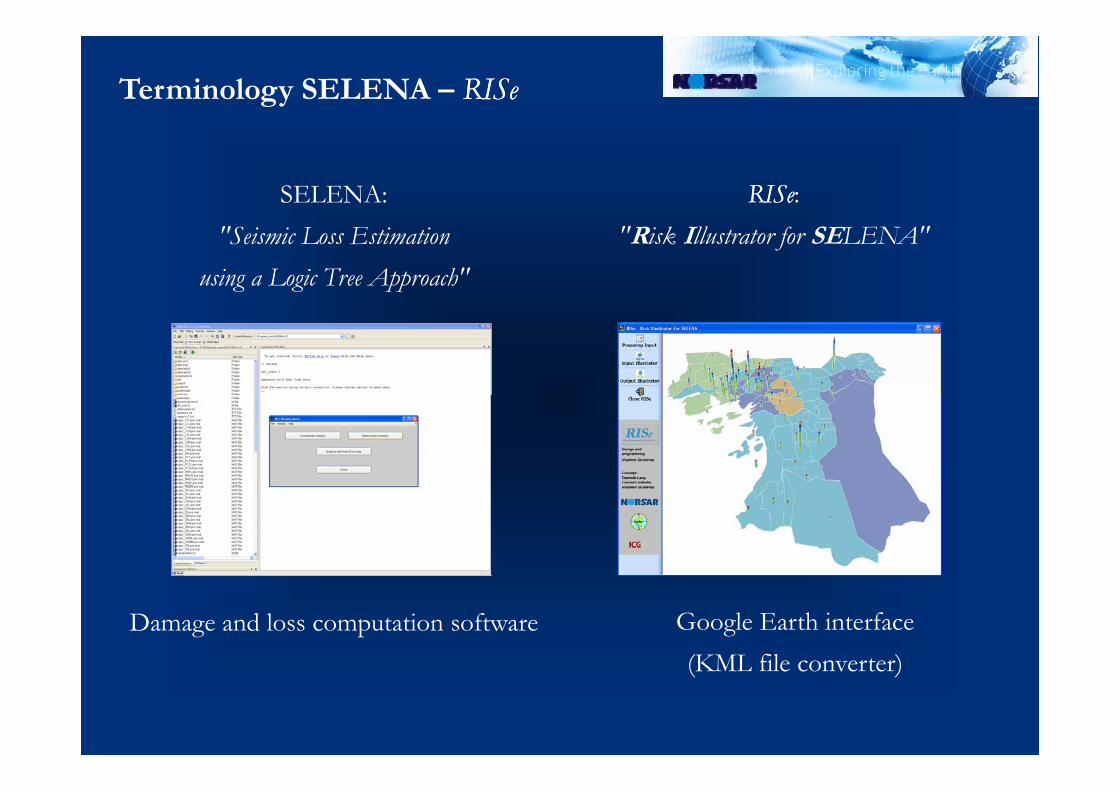
Terminology SELENA – RISeRISe
SELENA: RISeRISe: "Seismic Loss Estimation
using a Logic Tree Approach""Risk Illustrator for SELENA"
Damage and loss computation software Google Earth interface(KML file converter)(KML file converter)

SELENA – Basic features (1)
analytical (engineering) approach using capacity spectrum method (CSM) iterative procedure A of ATC-40 (1996) procedure C of MADRS (FEMA-440 2005) procedure C of MADRS (FEMA-440, 2005)
classification of physical damage following 'HAZUS damage states'following HAZUS damage states (FEMA, 2003)

SELENA – Basic features (2)
ground motion values (PGA, Sa) can be provided on three different ways:(1) deterministic scenario(2) grided data (e g given by probabilistic shake maps)(2) grided data (e.g. given by probabilistic shake maps)(3) randomly distributed data (e.g. coming from recording stations)
seismic demand in the Sa–Sd domain is represented by a code design spectrum→ currently incorporated: IBC-2006
Eurocode 8 – Type 1 & 2 (CEN 2002)Eurocode 8 Type 1 & 2 (CEN, 2002)Indian code IS 1893 (Part 1): 2002 (BIS, 2002)
→ respective soil classification schemes considered:
Soil type Shear wave velocity vs,30
IBC-2006 (NEHRP) Eurocode 8 IS 1893 (Part 1): 2002
hard rock > 1500 m/s AAA
Irock 760 – 1500 m/s B
stiff soil 360 – 760 m/s C B
soft soil 180 – 360 m/s D C II
very soft soil < 180 m/s E D III

SELENA – Basic features (2)
ground motion values (PGA, Sa) can be provided on three different ways:(1) deterministic scenario(2) grided data (e g given by probabilistic shake maps)(2) grided data (e.g. given by probabilistic shake maps)(3) randomly distributed data (e.g. coming from recording stations)
program sequence of a deterministic analysis:

SELENA – Basic features (3)
weighted logic tree computation scheme weighted results will provide expected mean values and confidence levels (percentiles)
d i i h d / il lifi i f→ ground motion with and w/o soil amplification factors→ damage probabilities and damage extent (no. of buildings or building floor area)→ casualties (injuries and fatalities)→ economic (monetary) loss
25 % 50 % 25 %
25 % 50 % 25 %
10 % 80 % 10 %10 % 80 % 10 %
20 % 60 % 20 %
25 % 50 % 25 %

Connection SELENA – RISeRISe
currently RISe RISe is solely customized to the SELENA file structure RISe RISe serves as an intermediary between SELENA and Google Earth
both input and output files are required/given in plain ASCII text format

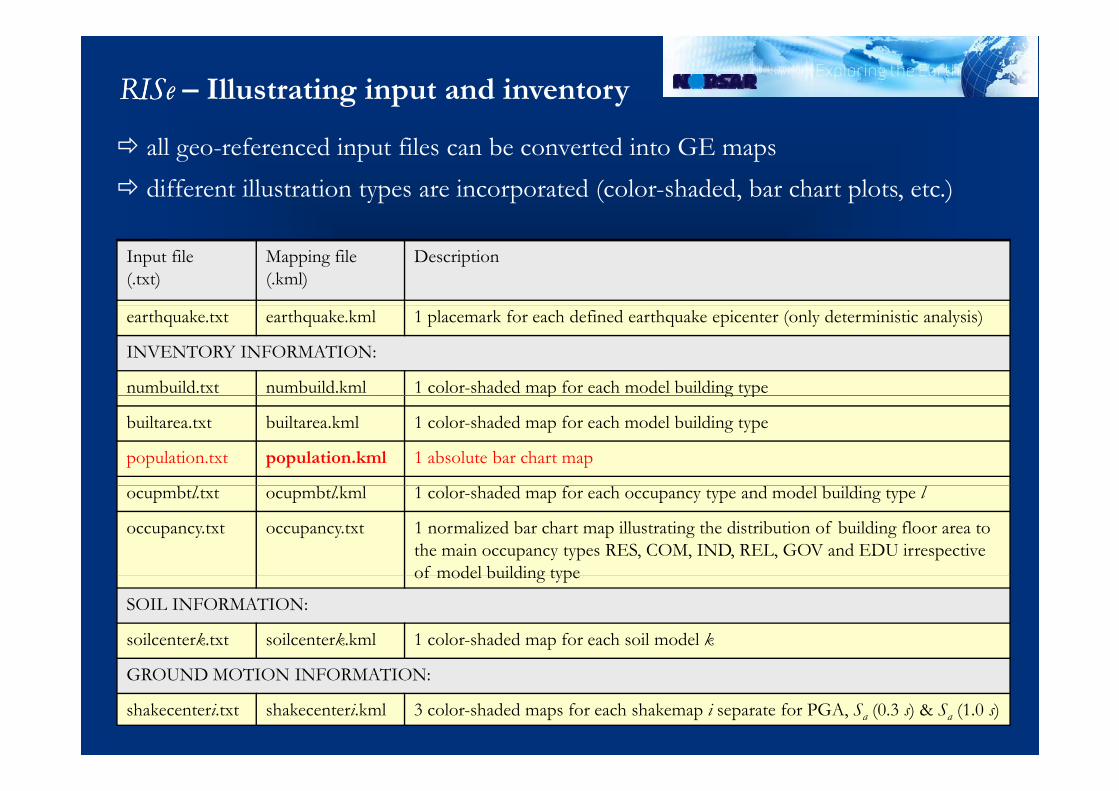
RISeRISe – Illustrating input and inventory
all geo-referenced input files can be converted into GE maps different illustration types are incorporated (color-shaded, bar chart plots, etc.)
Input file(.txt)
Mapping file(.kml)
Description
earthquake.txt earthquake.kml 1 placemark for each defined earthquake epicenter (only deterministic analysis)
INVENTORY INFORMATION:
numbuild.txt numbuild.kml 1 color-shaded map for each model building typep g yp
builtarea.txt builtarea.kml 1 color-shaded map for each model building type
population.txt population.kml 1 absolute bar chart map
ocupmbtl.txt ocupmbtl.kml 1 color-shaded map for each occupancy type and model building type l
occupancy.txt occupancy.txt 1 normalized bar chart map illustrating the distribution of building floor area to the main occupancy types RES, COM, IND, REL, GOV and EDU irrespective of model building typeof model building type
SOIL INFORMATION:
soilcenterk.txt soilcenterk.kml 1 color-shaded map for each soil model k
GROUND MOTION INFORMATION:
shakecenteri.txt shakecenteri.kml 3 color-shaded maps for each shakemap i separate for PGA, Sa (0.3 s) & Sa (1.0 s)

RISeRISe – Illustrating input and inventory
number of buildings disaggregated by MBT ( numbuild.kml)
RISeRISe – Illustrating input and inventory
all geo-referenced input files can be converted into GE maps different illustration types are incorporated (color-shaded, bar chart plots, etc.)
Input file(.txt)
Mapping file(.kml)
Description
earthquake.txt earthquake.kml 1 placemark for each defined earthquake epicenter (only deterministic analysis)
INVENTORY INFORMATION:
numbuild.txt numbuild.kml 1 color-shaded map for each model building typep g yp
builtarea.txt builtarea.kml 1 color-shaded map for each model building type
population.txt population.kml 1 absolute bar chart map
ocupmbtl.txt ocupmbtl.kml 1 color-shaded map for each occupancy type and model building type l
occupancy.txt occupancy.txt 1 normalized bar chart map illustrating the distribution of building floor area to the main occupancy types RES, COM, IND, REL, GOV and EDU irrespective of model building typeof model building type
SOIL INFORMATION:
soilcenterk.txt soilcenterk.kml 1 color-shaded map for each soil model k
GROUND MOTION INFORMATION:
shakecenteri.txt shakecenteri.kml 3 color-shaded maps for each shakemap i separate for PGA, Sa (0.3 s) & Sa (1.0 s)
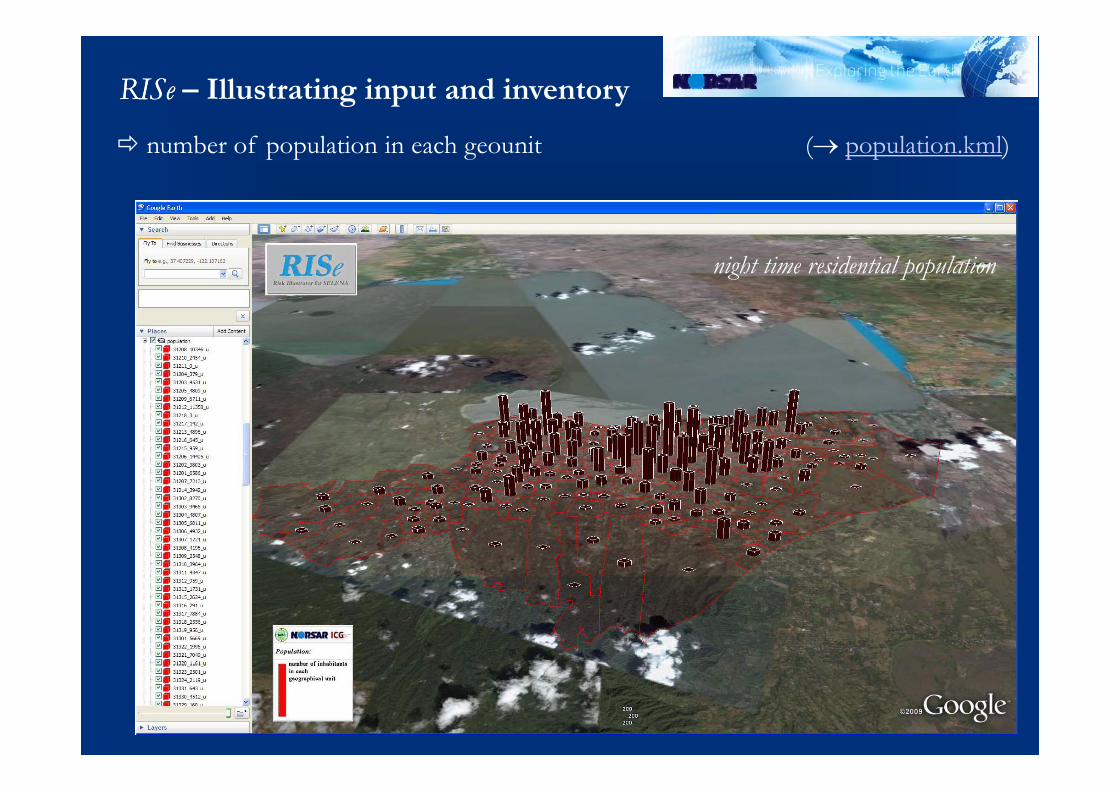
RISeRISe – Illustrating input and inventory
number of population in each geounit ( population.kml)
night time residential population

RISeRISe – Illustrating input and inventory
all geo-referenced input files can be converted into GE maps different illustration types are incorporated (color-shaded, bar chart plots, etc.)
Input file(.txt)
Mapping file(.kml)
Description
earthquake.txt earthquake.kml 1 placemark for each defined earthquake epicenter (only deterministic analysis)
INVENTORY INFORMATION:
numbuild.txt numbuild.kml 1 color-shaded map for each model building typep g yp
builtarea.txt builtarea.kml 1 color-shaded map for each model building type
population.txt population.kml 1 absolute bar chart map
ocupmbtl.txt ocupmbtl.kml 1 color-shaded map for each occupancy type and model building type l
occupancy.txt occupancy.txt 1 normalized bar chart map illustrating the distribution of building floor area to the main occupancy types RES, COM, IND, REL, GOV and EDU irrespective of model building typeof model building type
SOIL INFORMATION:
soilcenterk.txt soilcenterk.kml 1 color-shaded map for each soil model k
GROUND MOTION INFORMATION:
shakecenteri.txt shakecenteri.kml 3 color-shaded maps for each shakemap i separate for PGA, Sa (0.3 s) & Sa (1.0 s)

RISeRISe – Illustrating input and inventory
percental distribution of occupancy types in the geounits ( occupancy.kml)
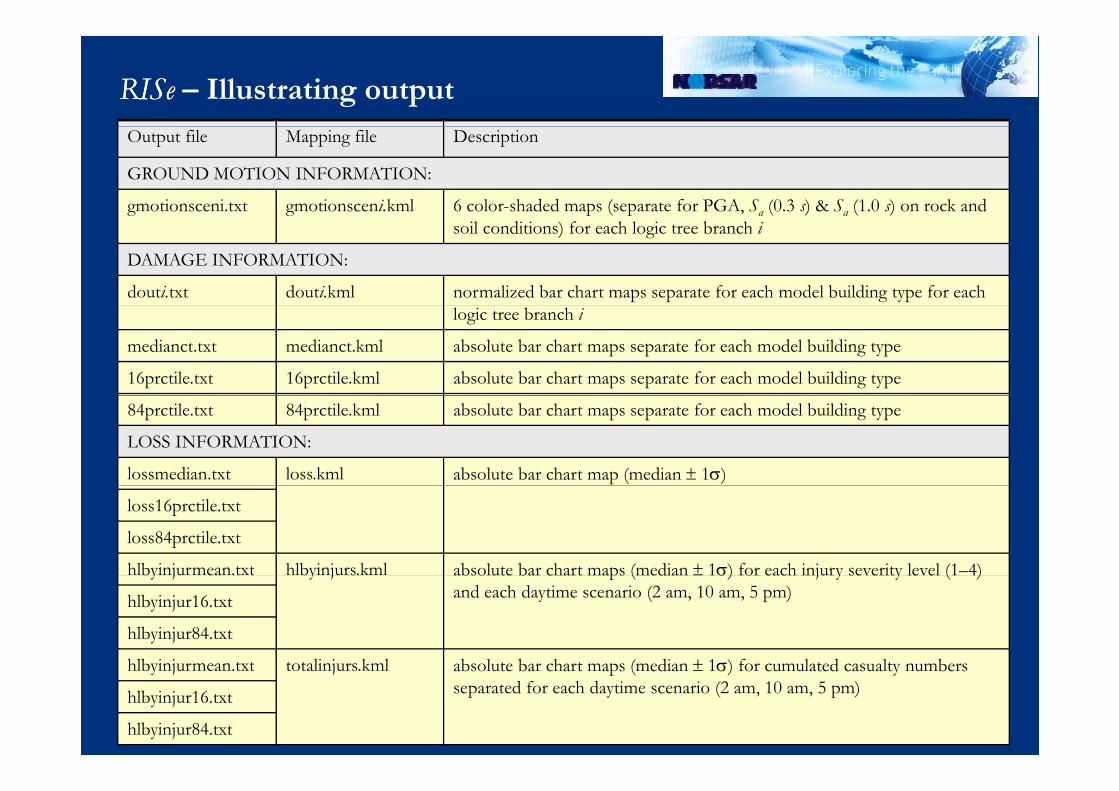
RISeRISe – Illustrating outputOutput file Mapping file Description
GROUND MOTION INFORMATION:
gmotionsceni.txt gmotionsceni.kml 6 color-shaded maps (separate for PGA, Sa (0.3 s) & Sa (1.0 s) on rock and soil conditions) for each logic tree branch i
DAMAGE INFORMATION:
douti.txt douti.kml normalized bar chart maps separate for each model building type for each logic tree branch i
medianct.txt medianct.kml absolute bar chart maps separate for each model building type
16prctile.txt 16prctile.kml absolute bar chart maps separate for each model building type
84prctile.txt 84prctile.kml absolute bar chart maps separate for each model building type
LOSS INFORMATION:
lossmedian.txt loss.kml absolute bar chart map (median 1)
loss16prctile.txt
loss84prctile.txt
hlbyinjurmean.txt hlbyinjurs.kml absolute bar chart maps (median 1) for each injury severity level (1–4)by ju ea .t t by ju s. absolute bar chart maps (median 1) for each injury severity level (1 4) and each daytime scenario (2 am, 10 am, 5 pm)hlbyinjur16.txt
hlbyinjur84.txt
hlbyinjurmean txt totalinjurs kml absolute bar chart maps (median 1) for cumulated casualty numbershlbyinjurmean.txt totalinjurs.kml absolute bar chart maps (median 1) for cumulated casualty numbers separated for each daytime scenario (2 am, 10 am, 5 pm)hlbyinjur16.txt
hlbyinjur84.txt

RISeRISe – Illustrating output
spectral ground motion maps (deterministic scenario) ( gmotionsceni.kml)

RISeRISe – Illustrating outputOutput file Mapping file Description
GROUND MOTION INFORMATION:
gmotionsceni.txt gmotionsceni.kml 6 color-shaded maps (separate for PGA, Sa (0.3 s) & Sa (1.0 s) on rock and soil conditions) for each logic tree branch i
DAMAGE INFORMATION:
douti.txt douti.kml normalized bar chart maps separate for each model building type for each logic tree branch i
medianct.txt medianct.kml absolute bar chart maps separate for each model building type
16prctile.txt 16prctile.kml absolute bar chart maps separate for each model building type
84prctile.txt 84prctile.kml absolute bar chart maps separate for each model building type
LOSS INFORMATION:
lossmedian.txt loss.kml absolute bar chart map (median 1)
loss16prctile.txt
loss84prctile.txt
hlbyinjurmean.txt hlbyinjurs.kml absolute bar chart maps (median 1) for each injury severity level (1–4)by ju ea .t t by ju s. absolute bar chart maps (median 1) for each injury severity level (1 4) and each daytime scenario (2 am, 10 am, 5 pm)hlbyinjur16.txt
hlbyinjur84.txt
hlbyinjurmean txt totalinjurs kml absolute bar chart maps (median 1) for cumulated casualty numbershlbyinjurmean.txt totalinjurs.kml absolute bar chart maps (median 1) for cumulated casualty numbers separated for each daytime scenario (2 am, 10 am, 5 pm)hlbyinjur16.txt
hlbyinjur84.txt

RISeRISe – Illustrating output
damage probabilities separate for each building typology ( douti.kml)

RISeRISe – Illustrating outputOutput file Mapping file Description
GROUND MOTION INFORMATION:
gmotionsceni.txt gmotionsceni.kml 6 color-shaded maps (separate for PGA, Sa (0.3 s) & Sa (1.0 s) on rock and soil conditions) for each logic tree branch i
DAMAGE INFORMATION:
douti.txt douti.kml normalized bar chart maps separate for each model building type for each logic tree branch i
medianct.txt medianct.kml absolute bar chart maps separate for each model building type
16prctile.txt 16prctile.kml absolute bar chart maps separate for each model building type
84prctile.txt 84prctile.kml absolute bar chart maps separate for each model building type
LOSS INFORMATION:
lossmedian.txt loss.kml absolute bar chart map (median 1)
loss16prctile.txt
loss84prctile.txt
hlbyinjurmean.txt hlbyinjurs.kml absolute bar chart maps (median 1) for each injury severity level (1–4)by ju ea .t t by ju s. absolute bar chart maps (median 1) for each injury severity level (1 4) and each daytime scenario (2 am, 10 am, 5 pm)hlbyinjur16.txt
hlbyinjur84.txt
hlbyinjurmean txt totalinjurs kml absolute bar chart maps (median 1) for cumulated casualty numbershlbyinjurmean.txt totalinjurs.kml absolute bar chart maps (median 1) for cumulated casualty numbers separated for each daytime scenario (2 am, 10 am, 5 pm)hlbyinjur16.txt
hlbyinjur84.txt

RISeRISe – Illustrating output
absolute damage extent separate for each building typology ( medianct.kml)

RISeRISe – Illustrating outputOutput file Mapping file Description
GROUND MOTION INFORMATION:
gmotionsceni.txt gmotionsceni.kml 6 color-shaded maps (separate for PGA, Sa (0.3 s) & Sa (1.0 s) on rock and soil conditions) for each logic tree branch i
DAMAGE INFORMATION:
douti.txt douti.kml normalized bar chart maps separate for each model building type for each logic tree branch i
medianct.txt medianct.kml absolute bar chart maps separate for each model building type
16prctile.txt 16prctile.kml absolute bar chart maps separate for each model building type
84prctile.txt 84prctile.kml absolute bar chart maps separate for each model building type
LOSS INFORMATION:
lossmedian.txt loss.kml absolute bar chart map (median 1)
loss16prctile.txt
loss84prctile.txt
hlbyinjurmean.txt hlbyinjurs.kml absolute bar chart maps (median 1) for each injury severity level (1–4)by ju ea .t t y j absolute bar chart maps (median 1) for each injury severity level (1 4) and each daytime scenario (2 am, 10 am, 5 pm)hlbyinjur16.txt
hlbyinjur84.txt
hlbyinjurmean txt totalinjurs kml absolute bar chart maps (median 1) for cumulated casualty numbershlbyinjurmean.txt totalinjurs.kml absolute bar chart maps (median 1) for cumulated casualty numbers separated for each daytime scenario (2 am, 10 am, 5 pm)hlbyinjur16.txt
hlbyinjur84.txt

RISeRISe – Illustrating output
casualties (mv) for 4 severity levels and 3 daytime scenarios ( hlbyinjurs.kml)
"Openess" of SELENA
FreeFree: distributed free of charge through the NORSAR/ICG website
Open sourceOpen source: open source code different formats now available Open sourceOpen source: open source code, different formats now available
(1) MATLAB code(2) "C" code which can be compiled into(2) C code which can be compiled into
a) stand-alone binary independent of MATLAB & toolboxes
b) binary (mex/oct) functions which can be used from within the MATLAB/Octave environment
Advantages:Advantages:- approximately 50 times faster than MATLAB code- code can be run in the free (open source) MATLAB ( p )
clone GNU Octave
Open documentation: open user manual in MS Word .doc and LATEX,Ope docu e tat o : ope use a ua S Wo d .doc a d T X,all figure files in gnuplot .gpl format

"Openess" of RISeRISe
FreewareFreeware: distributed free of charge through the NORSAR/ICG website
Open sourceOpen source: open source code coded in C# Open sourceOpen source: open source code, coded in C#
Advantages:- coding can be done in the Integrated Development Environmentcoding can be done in the Integrated Development Environment
(IDE) provided free of charge by Microsoft (MS Visual Studio C# Express Edition 2008)
- running the RISe software only requires an installation ofa) the free Microsoft .NET framework (at least version 2.0)b) G l E h' f ib) Google Earth's free version
Open documentation: open user manual currently only in MS Word .doc