rio tinto strategic report 2017 · the uk’s regulatory reporting requirement requires companies...
TRANSCRIPT

2017 Strategic report
riotinto.com/ar2017

Navigating through Rio Tinto’s Annual and Strategic reportThe UK’s regulatory reporting requirement requires companies to produce a strategic report. The intention is to provide investors with the option of receiving a document which is more concise tha the full annual report, and which is strategic in its focus.
The first 48 pages of Rio Tinto’s 2017 Annual report constitute its 2017 Strategic report. References to page numbers beyond 48 are references to pages in the full 2017 Annual report. Copies of Rio Tinto’s shareholder documents – the 2017 Annual report and 2017 Strategic report, along with the 2018 Notices of annual general meeting – are available to view on the Group’s website at riotinto.com/ar2017 and riotinto.com/agm2018. Shareholders may obtain a hard copy of these documents free of charge by contacting Rio Tinto’s registrars, whose details are set out at the back of this document.
Please visit Rio Tinto’s website to learn more about the Group’s performance in 2017.
Cautionary statement about forward-looking statements
This document contains certain forward-looking statements with respect to the financial condition, results of operations and business of the Rio Tinto Group. These statements are forward-looking statements within the meaning of Section 27A of the US Securities Act of 1933, and Section 21E of the US Securities Exchange Act of 1934. The words “intend”, “aim”, “project”, “anticipate”, “estimate”, “plan”, “believes”, “expects”, “may”, “should”, “will”, “target”, “set to” or similar expressions, commonly identify such forward-looking statements.
Examples of forward-looking statements in this Annual report include those regarding estimated ore reserves, anticipated production or construction dates, costs, outputs and productive lives of assets or similar factors. Forward-looking statements involve known and unknown risks, uncertainties, assumptions and other factors set forth in this document that are beyond the Group’s control. For example, future ore reserves will be based in part on market prices that may vary significantly from current levels. These may materially affect the timing and feasibility of particular developments. Other factors include the ability to produce and transport products profitably, demand for our products, changes to the assumptions regarding the recoverable value of our tangible and intangible assets, the effect of foreign currency exchange rates on market prices and operating costs, and activities by governmental authorities, such as changes in taxation or regulation, and political uncertainty.
In light of these risks, uncertainties and assumptions, actual results could be materially different from projected future results expressed or implied by these forward-looking statements which speak only as to the date of this Annual report. Except as required by applicable regulations or by law, the Group does not undertake any obligation to publicly update or revise any forward-looking statements, whether as a result of new information or future events. The Group cannot guarantee that its forward-looking statements will not differ materially from actual results.
For a description of certain factors that may affect Rio Tinto’s business, financial performance or results of operations, we urge you to look at the Risk management and Principal risks and uncertainties on pages 18 to 25 inclusive of this report.
Performance highlights 1Group overview 2Chairman’s letter 4Chief executive’s statement 5Market environment 7Group strategy 8Business model 12Key performance indicators 14Risk management 18Principal risks and uncertainties 20Portfolio management 26Sustainable development 28PwC Independent limited assurance 35Inclusion and diversity 36Rio Tinto’s commitment to pay equity 37Product groups Iron Ore 38 Aluminium 40 Copper & Diamonds 42 Energy & Minerals 44 Growth & Innovation 46Five year review 48Summary remuneration report iSingle total figure remuneration iiiSummary shareholder information vContact details viNotes viiFinancial calendar ix
Strategic report
KeyIndicates page reference for more information within this report (pages 1–48) or the Annual report (pages 49 – 258).
KPI Denotes key performance indicators.
The Group’s 2017 Strategic report complies with Australian and UK reporting requirements.
The auditors’ report on the Group’s 2017 annual accounts was unqualified. Within that report, the auditors’ statements under section 496 Companies Act 2006, confirming that the Strategic report and Directors’ report are consistent with the accounts, was also unqualified.
A copy of the auditors’ report on the Group’s 2017 Annual report is contained on pages 212 to 219 of that document.
Contents
To be more environmentally friendly, Rio Tinto is reducing the print run of all publications. We encourage you to visit the website to learn more about the Group’s performance in 2017 and to view all available PDFs of this Annual report and the Strategic report.
riotinto.com/ar2017
n

1Strategic report 2017 riotinto.com
STRA
TEGIC
REP
OR
T
Governance report Financial statements Production, reserves and operations Additional information
1
Performance highlights
Operating cash generation of US$13.9 billion, record full year dividend of US$5.2 billion and an additional US$1 billion share buy-back
Rio Tinto reported a strong set of results with operating cash flow of US$13.9 billion, a record full year dividend of US$5.2 billion and an additional US$1 billion share buy-back. This brings total cash returns to shareholders to US$9.7 billion declared for 2017.
The strength of the Group’s cash flow is a result of resilient prices during the year coupled with a robust operational performance and a focus on mine-to-market productivity.
The Group’s strong balance sheet, world-class assets and disciplined allocation of capital put Rio Tinto in the unique position of being able to invest in high-value growth through the cycle, and consistently deliver superior cash returns to shareholders.
2017 highlights
– Record full year ordinary dividend of US$5.2 billion, equivalent to 290 US cents per share, includes final dividend of US$3.2 billion, equivalent to 180 US cents per share.
– Achieved US$0.4 billion of additional free cash flow from mine-to-market productivity programme(3), against a backdrop of rising raw material costs across the industry.
– Additional share buy-back of US$1.0 billion in Rio Tinto plc shares, to be completed by the end of 2018.
– Investing in growth with Silvergrass in production, Amrun and Oyu Tolgoi projects on track.
– Generated operating cash flow of US$13.9 billion, underlying EBITDA(1) of US$18.6 billion and a ten-year record EBITDA margin(2) of 44 per cent.
– Reshaping the portfolio with US$2.7 billion of divestments in 2017.
– Delivered underlying earnings of US$8.6 billion and net earnings of US$8.8 billion.
– Reduced net debt to US$3.8 billion.
Results at a glance
Year to 31 December 2017 2016 Change
KPI ►114 Net cash generated from operating activities (US$ millions) 13,884 8,465 +64% Underlying EBITDA (1) (US$ millions) 18,580 13,510 +38% KPI ►132 Underlying earnings (1) (US$ millions) 8,627 5,100 +69% Net earnings (US$ millions) 8,762 4,617 +90% KPI ►131 Capital expenditure (4) (US$ millions) (4,482) (3,012 ) +49% Underlying earnings (1) per share (US cents) 482.8 283.8 +70% Basic earnings per share (US cents) 490.4 256.9 +91% Ordinary dividend per share (US cents) 290.0 170.0 +71% At 31 December 2017 2016 Change
KPI ►149 Net debt (5, 7) (US$ millions) 3,845 9,587 -60% Net debt to underlying EBITDA (6,8) 0.2 0.7 Net gearing ratio (7, 8) 7% 17%
The financial results are prepared in accordance with IFRS, as defined on page 118. (1) Underlying EBITDA and earnings are key financial performance indicators which management use internally to assess performance. They are presented here to provide greater
understanding of the underlying business performance of the Group’s operations. Net and underlying earnings relate to profit attributable to the owners of Rio Tinto. Underlying EBITDA and earnings are defined on page 132. Underlying earnings is reconciled to net earnings on page 133.
(2) EBITDA margin is defined as Group underlying EBITDA divided by product group total revenues as per the Financial information by business unit on page 206 where it is reconciled to profit on ordinary activities before finance items and taxation and consolidated sales revenue. This financial metric is used by management internally to assess performance, and therefore is considered relevant to users of the accounts.
(3) Mine-to-market productivity improvements refer to the additional free cash flow generated from post-tax operating cash cost improvements and post-tax volume gains from productivity programmes. This financial performance indicator is used by management internally to assess performance, and therefore is considered relevant to users of the accounts.
(4) Capital expenditure comprises the cash outflow on purchases of property, plant and equipment and intangible assets and is presented gross, before taking into account any cash inflows from disposals of property, plant and equipment.
(5) Net debt is defined and reconciled to the balance sheet on page 149 (6) Net debt to underlying EBITDA is defined as the period end net debt divided by the previous 12 months’ underlying EBITDA. (7) Net gearing ratio is defined as net debt divided by the sum of net debt and total equity at each period end. (8) These financial performance indicators are those which management use internally to assess performance, and therefore are considered relevant to users of the accounts.

2 riotinto.com Strategic report 2017
Strategic report Governance report Financial statements Production, reserves and operations Additional information
2
Group overview
Introduction to Rio Tinto
For 145 years, Rio Tinto has been pioneering the production of materials essential to human progress.
Our minerals and metals help make modern life work. They are found in buildings and infrastructure, in vehicles and transport networks, and throughout the home.
Through the products we deliver, and the partnerships we create and nurture, Rio Tinto works to make a difference in our local communities and in the world at large.
The portfolio we have created, and that we are continually optimising, provides us with a competitive advantage. By investing throughout the cycle, we have developed a suite of high-quality, expandable assets that are positioned for decades of premium production.
Our organisation is centred on these assets, which themselves are managed through four product groups: Iron Ore, Aluminium, Copper & Diamonds and Energy & Minerals. In turn, these four product groups are supported by our global and headquarters functions, and by our Growth & Innovation and Commercial groups.
Our strategy is founded on our asset portfolio, on building a high-performance culture across the business, and on maintaining discipline when allocating capital. This allows us to focus on maximising cash through a value-over-volume approach, and on delivering superior returns to our shareholders.
As they deliver our strategy, our 47,000 people worldwide work with a common code of conduct and the same set of values: safety, teamwork, respect, integrity and excellence. Safety is our number one priority, and always comes first at Rio Tinto.
We continue to pioneer progress for a better future. Every day, we look for ways to make our business stronger – driving productivity and performance from mine through to market.
Iron Ore Rio Tinto operates a world-class iron ore business, supplying the global seaborne iron ore trade. We are well positioned to benefit from the continuing demand across China, other Asian economies, and the developing world. Located in the Pilbara region of Western Australia, our Iron Ore product group’s operations are able to achieve industry-leading margins.
Products Iron ore Iron ore is the key ingredient in the production of steel, one of the most fundamental and durable products for modern-day living, with uses from railways to refrigerators, and pipes to paperclips.
Strategic advantages
– Strong presence in key markets.
– Proximity to key Asian markets.
– World-class assets, comprising an exclusive, integrated supply chain with extensive long-term optionality.
– A premium product suite, which drives strong customer relationships, supported by technical expertise.
– A high-margin (68 per cent FOB EBITDA margin) and low-cost position with a Pilbara cash unit cost of US$13.4 per tonne in 2017.
– Strong mineral resources providing multiple high-quality, low-cost options to sustain and grow our Pilbara operations.
– Industry leader in supply chain management, responsible mining, and technology and innovation.
Key production locations Key sales destinations
– Australia – Mainland China
– Japan
– South Korea – Taiwan
Full operating review ►38
Aluminium Building on more than a century of experience and expertise, Rio Tinto is a global leader in the aluminium industry. Our business includes high-quality bauxite mines, large-scale alumina refineries, and some of the world’s lowest-cost, most technologically-advanced aluminium smelters.
Products Bauxite Bauxite is the ore used to make aluminium. It is first refined into alumina, which is subsequently smelted into primary aluminium. Our wholly- and partly-owned bauxite mines are located in Australia, Brazil and Guinea.
Alumina Alumina (aluminium oxide) is extracted from bauxite via a refining process. Approximately four tonnes of bauxite are required to produce two tonnes of alumina, which in turn yield one tonne of aluminium. Our wholly- and partly-owned alumina refineries are located in Australia, Brazil and Canada.
Aluminium Aluminium is a versatile modern metal. Light, strong, flexible, corrosion-resistant and infinitely recyclable, it is one of the most widely-used materials in today’s world. The largest markets for aluminium are transportation, machinery and construction. Rio Tinto’s smelters are in Canada, France, Australia, New Zealand, Iceland and Oman.
Strategic advantages
– Access to large and high quality bauxite ore reserves, strategically located to meet growing demand in China.
– Among the lowest-cost bauxite producers.
– Exceptional hydropower position, which delivers significant cost and other advantages in an energy-intensive industry and an increasingly carbon-constrained world.
– The world’s first certified low carbon dioxide aluminium, RenewAl™, with a carbon footprint one third of the industry average.
Key production locations Key sales destinations
– Canada – Asia – Australia – Americas – Europe – Europe
Full operating review ►40

3Strategic report 2017 riotinto.com
STRA
TEGIC
REP
OR
T
Strategic report Governance report Financial statements Production, reserves and operations Additional information
3
Copper & Diamonds Rio Tinto’s Copper & Diamonds product group manages operations in Australia, Canada, Mongolia and the US. We also have interests in non-managed operations in Chile and Indonesia. We are the world’s ninth largest producer of copper and one of the world’s largest diamonds producers. As by-products of its copper production, the group also produces gold, silver, molybdenum and other materials such as sulphuric acid, rhenium, lead carbonate and selenium.
Products Copper Copper is a vital component for the world’s electricity infrastructure, digital communications and green technologies. Voice, data and information systems rely on copper, and it helps power wind energy and solar collection, as well as energy-efficient buildings and electric vehicles. Copper is also used in medical applications and drinking water infrastructure, where it is valued for its antimicrobial properties.
Diamonds Rio Tinto produces diamonds in a full range of sizes, qualities and colours for all established and emerging consumer markets.
Gold Gold is used as a financial instrument and a store of value, but it has medical, electronic and computing applications, as well as in jewellery.
Silver Silver is used in electronic devices, in aerospace and medical applications, and to make jewellery. As a precious metal, it is also used as an investment.
Molybdenum When combined with other metals, molybdenum creates more durable materials that are better able to resist high-temperatures and corrosion. It is often used to produce metal alloys such as stainless steel.
Strategic advantages – A portfolio of large, high-quality copper assets. – Attractive copper growth opportunities. – Global copper and diamond exploration, mining and processing
operations. – Strength in delivering mine-to-market productivity. – Leading technology and processes for underground mining. Key production locations Key sales destinations
– Australia – Australia – Chile – China – Mongolia – India – North America – Japan – Indonesia – North America – Europe
Full operating review ►42
Energy & Minerals
Rio Tinto’s Energy & Minerals product group comprises mining, refining and marketing operations in 14 countries, across six sectors: borates, coal, iron ore concentrate and pellets, salt, titanium dioxide and uranium. The Energy & Minerals group also includes the Jadar lithium-borate project in Serbia and the Simandou iron ore project in Guinea.
Products Borates Refined borates are used in hundreds of products and processes. They are a vital ingredient of many building materials and are essential micronutrients for crops. They are also commonly used in glass and ceramic applications, including fibreglass, television screens, floor and wall tiles, and heat-resistant glass.
Coal Coking coal, or metallurgical coal, is mixed in furnaces with iron ore to produce steel. Following the disposal of Coal & Allied during 2017, Rio Tinto now has only limited interests in thermal coal, which remains an important part of the energy mix in some parts of the world.
Salt Salt is one of the basic raw materials for the chemicals industry, and is indispensable to a wide array of automotive, construction and electronic products, as well as in water treatment, food and healthcare.
Titanium dioxide The minerals ilmenite and rutile, together with titanium dioxide slag, can be transformed into a white titanium dioxide pigment or titanium metal. The white pigment is a key component in paints, plastics, paper, inks, textiles, food, sunscreen and cosmetics. Titanium metal is lightweight, chemically inert and strong, making it ideal for use in medical applications and in the aerospace industry.
Uranium Uranium is one of the most powerful energy sources, and is used in the production of clean, stable, base-load electricity. After uranium is mined, it is processed into uranium oxide. This product is then sold for processing into fuel rods for use in nuclear power stations.
Other products from the Energy & Minerals product group include high-purity ductile iron, steel billets, metal powders and zircon. High-purity ductile iron is supplied to the foundry industry for ductile castings. Steel billets are transformed into seamless pipe for the oil and gas industry or wire rod, which has many applications from fasteners to automotive springs. Metal powders are used in a variety of industries, such as automotive, and in sintered components, food enrichment, friction, water treatment and welding. Zircon’s high refractive index and solid opacity makes it ideal for the ceramics industry, mainly for tiles and sanitaryware. It is also used to manufacture catalysts, refractories, and medical prosthetics, as well as being applied in nuclear reactors, chemical processing plants and foundries.
Strategic advantages – Demand-led, integrated operations that are responsive to the
changing external environment. – Minerals business poised to benefit from mid-to-late development-
cycle demand growth as consumption increases in emerging markets. – A lean, scalable operating model running cash-focused businesses.
Key production locations Key sales destinations
– North America – North America – Australia – China – Africa – Japan – Europe
Full operating review ►44
Growth & Innovation
The Growth & Innovation group supports Rio Tinto’s assets to achieve superior performance throughout their lifecycle by optimising value from the development of the initial concept to the point when a mine or processing facility is eventually closed. Growth & Innovation works in partnership with Rio Tinto’s product groups to find, study, develop and optimise assets to ensure they are safe, productive and profitable. Its centralised exploration, capital projects and technical capabilities enable Growth & Innovation to deliver portfolio growth and solutions to operational and business challenges through innovation, productivity and technology.
Full operating review ►46
Commercial
The Commercial group is focused on maximising the value of our products; growing value in the marketplace through partnership with the company’s customers, suppliers, product groups and Group functions. Headquartered in Singapore, and integrated with Rio Tinto’s assets, hubs, and offices globally, Commercial’s purpose is to provide the commercial insights to drive value along the mine-to-market value chain. Commercial incorporates and utilises the knowledge and capabilities of the global Sales & Marketing, Procurement, and Marine & Logistics organisations, supported by the Market Analysis, Commercial Treasury and other functions, to ensure our approach to business is driven by a commercially-astute and innovative mind-set. The Commercial group came under the leadership of the newly appointed chief commercial officer on 1 January 2018.
4 riotinto.com Strategic report 2017
Strategic report Governance report Financial statements Production, reserves and operations Additional information
4
Chairman’s letter
Dear shareholders, In 2017, your company delivered a strong �nancial performance and signi�cant cash returns to shareholders. These results were achieved through a focused strategy, disciplined capital allocation and the commitment of our employees around the world.
The cyclical nature of our industry is readily apparent. Just over two years ago, the prices for many commodities were at near decade lows. In 2017, prices for a number of our key products were higher than in 2016. This, combined with our strong cash and productivity focus, helped underpin Rio Tinto’s underlying earnings and cash generation.
Underlying earnings in 2017 were US$8.6 billion, up 69 per cent on 2016. Net earnings were US$8.8 billion (2016: US$4.6 billion) and operating cash �ow was US$13.9 billion (2016: US$8.5 billion).
Rio Tinto continued to realise considerable savings from its cost reduction programme, delivering US$0.6 billion of pre-tax improvements and reductions in 2017 and meeting its US$2.0 billion target for 2016 and 2017 six months earlier than scheduled.
The company ended the year with a strengthened balance sheet, with net debt reduced to US$3.8 billion.
Record shareholder returns
Rio Tinto declared cash returns to shareholders of US$9.7 billion for 2017, including record dividends.
We announced a �nal dividend of 180 US cents per share, equivalent to US$3.2 billion, bringing the full year 2017 ordinary dividend to 290 US cents per share, equivalent to US$5.2 billion. The �nal dividend is the largest in your company’s 145-year history.
For 2017, we announced buy-backs of US$2.0 billion, the �rst US$1.0 billion having been announced in August 2017 and completed in December 2017, and the second US$1.0 billion announced with our full year results in February 2018 and to be completed by the end of 2018.
A supplementary share buy-back of US$2.5 billion from the Coal & Allied sale proceeds was announced in September 2017.
Supporting our communities
Our shareholder returns are signi�cant, and so is the economic and social contribution we make in the countries in which we operate.
In 2017, more than a third of Rio Tinto’s direct economic contribution was through payments to suppliers – businesses large and small – for their goods and services.
Our contribution is not monetary alone; it is also shared through generations in education, skills development and community development.
In this report, and through our Sustainable development report, you will �nd examples of our work in action; be it delivering on our strong commitment to environmental management, building our relationship with governments and civil society, or building our community links through local procurement partnerships.
Rio Tinto seeks to act in ways that strengthen transparency, understanding and trust with all of its stakeholders and through pioneering publications, such as our Taxes paid report, we have sought to build awareness and understanding of the signi�cant economic contribution we make.
Board composition
In 2017, your directors visited Rio Tinto’s iron ore operations in the Pilbara region of Western Australia, aluminium assets in the Saguenay–Lac-Saint-Jean region of Quebec, Canada, as well as our global commercial centre in Singapore.
Such visits allow us to meet with employees and host governments to gain a greater understanding of our people and operations’ local contribution.
Board renewal was a feature of the past year. We said thank you and farewell to non-executive directors Robert Brown, Anne Lauvergeon and John Varley, and welcomed David Constable, Sam Laidlaw and Simon Henry to the board as non-executive directors.
On 15 February 2018, we also announced that, after more than ten years of service, Paul Tellier will be retiring from the board in early May 2018, as well as the appointment of Moya Greene as a new non-executive director. Moya will join the board in the second half of 2018.
On 5 March 2018, Simon Thompson will succeed me as chairman of Rio Tinto. Simon has served on the board since 2014 and has signi�cant experience of the industry, having led various extractive businesses in multiple geographies. I am pleased to be succeeded by Simon and know that he will do an outstanding job chairing your company.
Personal re�ections
I would like to thank the board of directors and you, our shareholders, for the opportunity to serve this company for the past nine years as chairman. It has been a privilege to work with many outstanding people across the organisation and to have learnt so much about an exciting industry that continues to provide the materials that are essential for modern life.
There is no doubt it has been both challenging and rewarding to chair a business that is so cyclical in nature. The industry’s move, some years ago, to sell iron ore by reference to spot prices rather than annually �xed prices, further introduced unprecedented levels of short-term volatility in an already cyclical industry.
The investment in 2011 of US$4 billion in Mozambique in what ultimately turned out to be inferior quality coal assets was undoubtedly a low point during my tenure. It was also a dif�cult moment for the board when we took the decision to notify the relevant authorities about contractual payments made in 2011 to a consultant providing advisory services on the Simandou project in Guinea.
Along with the obvious challenges, there have also been many highlights. Nine years ago, Rio Tinto had net debt of almost US$40 billion; net debt is now less than US$4 billion.
Shareholders contributed US$15 billion of much needed capital by way of a rights issue three months into my chairmanship. However, since the start of 2011, and including the US$6 billion that will be paid to shareholders during 2018, we will have returned in excess of US$40 billion in the form of dividends and share buy-backs.
In terms of share price performance and total shareholder return, over the last nine years we have outperformed the sector by a considerable margin.
Rio Tinto today has arguably the strongest balance sheet in the sector. Taken together with the quality of our assets, I therefore have every con�dence that, under the leadership of our chief executive J-S Jacques, Rio Tinto has a bright future.
Our people
Clearly, none of our achievements would have been possible without the incredible dedication and hard work of thousands of employees worldwide. My �nal thanks must therefore go to our people, many of whom I have met on my many visits to of�ces and operating sites. Without them Rio Tinto would simply not be the great company that it is. I wish them well.
Jan du Plessis Chairman 28 February 2018

5Strategic report 2017 riotinto.com
STRA
TEGIC
REP
OR
T
Strategic report Governance report Financial statements Production, reserves and operations Additional information
5
Chief executive’s statement
Dear shareholders, It is a great privilege to lead Rio Tinto, a company that has been pioneering progress for 145 years, with a commitment to delivering superior value for our shareholders over the short, medium and long term.
I am very pleased to report that in 2017 we delivered on this commitment, declaring total cash returns to shareholders of US$9.7 billion for the year, including a record full year dividend of US$5.2 billion. This was made possible by our relentless focus on our value-over-volume approach, disciplined capital allocation and the hard work of our 47,000 employees.
Across the company, we are looking to step up our performance, starting with safety.
Safety comes first Safety is one of Rio Tinto’s core values and will always be our first priority.
Overall, it is pleasing to report that our safety performance improved in 2017. Our critical safety indicators are moving in the right direction but we have more to do.
In October 2017, a colleague died at our Rio Tinto Kennecott copper smelter in the US. I met with his workmates at the operation and committed to share the learnings from the incident across the business.
In the same month, there was a health-related death of a colleague undertaking field reconnaissance work.
In 2017, three people died at our non-managed sites.
All of these tragedies are deeply distressing and we must do better. Our safety strategy has many components and, over the past year, we completed the roll out of our critical risk management (CRM) fatality prevention programme across more than 60 sites. CRM focuses on the tasks and critical risks within an individual’s direct control, and, during the year, more than 1.4 million critical control verifications were completed.
We also go beyond physical safety. For any given task, the state of mind and health and wellbeing of our people is also important. That is why we are actively involved in promoting mental health awareness programmes and fatigue management initiatives.
In 2018, we will do all we can to make our employees and operations safer in the year ahead.
Performance: Strong results Rio Tinto’s value-over-volume approach and an increase in prices for some of our commodities combined to deliver both higher company margins and cash generation in 2017.
We delivered US$18.6 billion of EBITDA and cash of US$13.9 billion in 2017. We improved margins to the best in a decade with an EBITDA margin for the year of 44 per cent.
The Iron Ore group delivered free cash flow of US$7.3 billion and FOB (free on board) EBITDA margins of 68 per cent as customers demanded our higher-quality product.
The Aluminium group delivered US$1.4 billion in free cash flow, with an integrated operations EBITDA margin of 35 per cent: our highest in more than a decade. This was achieved despite increases in input costs as a result of inflationary cost pressure in the industry more generally.
The Copper & Diamonds group delivered free cash flow of US$0.3 billion, including US$1.2 billion in capital expenditure as activity ramped up at the Oyu Tolgoi underground project.
The Energy & Minerals group delivered free cash flow of US$1.5 billion taking advantage of our latent capacity and better market conditions.
Our focus on cash generation and disciplined capital allocation saw Rio Tinto close the year with net debt of US$3.8 billion, and a balance sheet amongst the strongest in our sector.
The strength of our balance sheet meant that the proceeds from the sale of our Coal & Allied thermal coal business were returned to shareholders by way of a US$2.5 billion supplementary buy-back.
Mine-to-market productivity Across our business, from mine to market, we are looking to add value, not just cut costs, by harnessing thousands of productivity initiatives.
Lifting the performance of our US$50 billion asset base is among the most value-accretive programmes we can deliver within our direct control.
Since 2012, we have reduced our costs by US$8.3 billion and last year we committed to a five-year, US$5 billion productivity agenda. In 2017, we delivered US$0.4 billion of additional free cash flow from our mine-to-market productivity programme against a backdrop of rising raw material costs across the industry.
Our productivity agenda is multi-faceted and focused in four areas: securing and embedding gains through deploying best practice approaches; working with our partners; harnessing automation opportunities; and using the power of data in our business to lift the utilisation of our equipment and assets.
We have thousands of productivity initiatives across the company from lifting truck utilisation rates to energy management systems. Every tonne, every half per cent matters.
Rio Tinto prides itself on its pioneering approach to new technologies, to deliver faster and better processes, cleaner and greener outcomes.
There are many examples, from automated trucks and trains, to remote operated drills and drones. In exploration with indicator minerals, to construction with 3D modelling for new projects, to the many proprietary technologies in our Canadian smelters delivering efficiency, productivity and a competitive cost profile.
Our strategy, supported by the appointment of a chief commercial officer, also has a strong emphasis on better understanding the markets in which we operate and partnering with our customers to develop new products of most value to them, such as new aluminium alloys for the automotive industry.
We are also working with our equipment suppliers, making the best use of their expertise and insights to plan together and consider technology roadmaps for the smart mines of the future.
Portfolio: Developing a world-class asset portfolio The past year saw a strengthening of Rio Tinto’s portfolio, solid progress on our high-value return projects, and the exploration of new avenues for growth.
In terms of our growth projects, we completed construction of the Silvergrass mine in the Pilbara and now have studies under way for the Koodaideri project for early next decade to replenish and maintain the quality of our Pilbara iron ore blend.
In Mongolia, at Oyu Tolgoi, construction of the underground development proceeds at pace and first copper production from this world-class asset is due in 2020.
In Cape York, Australia, the Amrun bauxite project is now more than half complete. With equity interests in four of the world’s largest bauxite mines, we are in a prime position to grow.
Structural changes occurring in China’s aluminium sector, combined with an emerging carbon emissions scheme, provide us with the opportunity to look at a staged expansion of our hydro-powered low-cost Canadian smelters. We will advance these studies during 2018.
With a view to the future, within our Energy & Minerals group we established a unit to look at new opportunities in metals and minerals associated with new technologies, trends and the needs of an urbanising and changing world.
An example of this is our Jadar lithium-borates project. Lithium and borates are used in products as diverse as batteries for electrical vehicles, smartphones and fertiliser.
Our commitment to exploration remains strong. In 2017, we forged a global exploration collaboration agreement with China Minmetals Corporation, and around the world we are actively partnering, combining our global expertise with local knowledge and boots on the ground.

6 riotinto.com Strategic report 2017
Strategic report Governance report Financial statements Production, reserves and operations Additional information
6
People: Engaged and capable employees Our 47,000 employees in around 35 countries are focused on safety, cash generation, productivity and living our values. I had the opportunity to meet with many of our people during the year when visiting our operations, and also spent significant time with our customers and other partners.
The way we work – our code of conduct – is underpinned by our values: safety, teamwork, respect, integrity and excellence. These guide us every day, in the decisions we make, and in how we behave. In 2017, we spent considerable time communicating and discussing our values and code of conduct in a global programme which focused on engaging Rio Tinto leaders. This effort is now being pioneered by employee values champions right across the business.
In 2017 we introduced a new leadership development programme – Leading for Success – and revitalised our graduate and high-potentials programme as we build a pipeline of talented future leaders of our company. We are also investing in building technical and commercial capability in our workforce, which will enable us to lead the industry in both operational and commercial excellence.
Partnership: Partnering for progress At Rio Tinto, our partnerships help us deliver our strategy and we must continue to provide our partners with confidence that we produce the essential materials the world needs, responsibly.
We never take our licence to operate for granted. We know that, if we are to be successful, we must continue to build strong partnerships at every stage of our business – through exploration, development, operations and closure.
In this report, you will see examples of our contributions to sustainable development throughout the lifecycle of our operations. Right from the start of a project, we look for ways to provide work and business opportunities for our host communities, while protecting the environment. For example, at one of our key growth projects, Amrun in Australia, we are working in partnership with local businesses to maximise employment opportunities for local Aboriginal people.
In 2017, we strengthened our focus on engagement with our key stakeholders, including our host communities and governments, our employees, our supply chain partners, and with our industry peers through associations.
Our business invested US$176 million across nearly 1,300 programmes covering health, education, environmental protection, housing, agricultural and business development sectors.
Education remains a key focus. Often we are the education catalyst, working in partnership with schools, training providers and universities.
In Mongolia, programmes delivered by Oyu Tolgoi have seen more than 1,900 vocational teachers receive assistance. Last year, an
18-year-old son of a nomadic herder, trained by teachers from a participating school, represented his nation as a welder in an international competition.
In the US, the Resolution copper project supports science, technology, engineering and math (STEM) programmes in Arizona for children and teacher training for local high schools.
In Australia over many decades, we have partnered with a range of universities and organisations to deliver STEM initiatives.
In Beijing, China we extended our partnership with Tsinghua University focused on sharing best practice in resources, energy and sustainable development. This builds on our many partnerships with China.
Last year, with China’s Sinosteel Corporation, we celebrated 30 years of the Channar iron ore joint venture in Western Australia; a pioneering partnership that became a template for many others. In addition, we signed a Memorandum of Understanding with China’s State-owned Assets Supervision and Administration Commission (SASAC) to develop executive training for Central State-owned Enterprise leaders on areas including stakeholder engagement, licence to operate, environmental and economic assessments and community engagement.
Industry leadership
Our strong financial results for 2017 show the value of a world-class portfolio, a strong balance sheet, disciplined capital allocation and our excellent team.
Our aim is to ensure everyone goes home safe every day; to build on our productivity agenda; and to ensure our people, customers, suppliers and our communities, as our partners, continue to share in future success. We want to leave a positive and lasting legacy for those that follow in our footsteps.
We strive to be the most value-creating mining and metals company in the industry and I can assure you our ambition in 2018 remains to achieve this.
J-S Jacques Chief executive 28 February 2018

7Strategic report 2017 riotinto.com
STRA
TEGIC
REP
OR
T
Strategic report Governance report Financial statements Production, reserves and operations Additional information
7
Market environment
Global economy The ongoing recovery is expected to have produced global growth in the region of 3 per cent in 2017, up from 2.4 per cent in 2016. There was reduced volatility, with both advanced and emerging economies gaining momentum. Manufacturing output, global trade, and business and consumer sentiment picked up, while inflationary pressures remained largely muted.
Developed economy growth improved moderately in 2017, driven by rising investment, inventories and manufacturing exports, with the US and EU enjoying a manufacturing recovery over the first three quarters. Stronger demand, and dwindling spare capacity combined with higher input costs in the US, caused some manufacturers to implement price increases late in the fourth quarter. In the US and EU, many macroeconomic indicators are now at levels not seen since before the global financial crisis.
Although the US Federal Reserve increased rates three times in 2017, other major central banks maintained highly accommodative monetary policies. With inflation under control, both the European Central Bank and Bank of Japan were able to maintain loose monetary conditions to support continued recovery. In response, ten-year Treasury bond yields drifted gradually down to a low of 2.06 per cent in September before reversing course for the remainder of the year on concerns the US Government’s fiscal agenda would drive inflation higher.
China’s economic performance peaked in the first half, with full year growth of 6.9 per cent supported by export recovery, strong property sales and improved corporate earnings. By the fourth quarter, however, Chinese property sales were slowing, while supply-side reforms and tightened environmental controls increased pressure on production. The government also redoubled efforts to reduce credit growth, in particular local government borrowing. This latter element is expected to exert downward pressure on infrastructure investment growth.
Other emerging markets also experienced better economic conditions due to improved global trade, higher commodity prices and supportive monetary policy conditions. While aggregate credit growth in key emerging markets remains weak, Brazil still recovered from recession, Russia adjusted to lower oil prices over the year, and India moved past an extended period of weak corporate performance.
Drivers of commodity prices Long-term structural economic trends are important drivers of commodity prices through their effects on demand. The economic development and urbanisation of emerging countries goes through an initial investment-led growth phase, benefiting commodities such as steel and copper used in construction and infrastructure. As economies evolve, other commodities such as light metals, energy products and industrial minerals tend to take over as the main enablers of consumption-led growth.
The long-term nature of mining tends to result in cyclical investment patterns, translating into commodity price cyclicality. Over the past two years, the industry has recovered from a cyclical low. Investments made during the previous cycle have mostly been delivered and peak supply is evident in some commodities in a context of resilient Chinese demand and stronger global growth. With markets for most metals and minerals moving into balance, the industry remains focused on cash accumulation, conservative investment strategies and a rebalancing of asset portfolios. A focus on maintaining strong balance sheets while delivering cash returns to shareholders remains. Productivity and cost reduction initiatives continue as global reflation increases cost headwinds.
Commodity markets Commodity markets continued to strengthen in 2017, supported by stronger economic growth, particularly in China. Restructuring and capacity closures across the Chinese heavy industry complex led to improved profitability and supported significant increases in commodity prices. Copper prices rose over 20 per cent from the start of the year to average around US$3/lb in the fourth quarter – reaching a three-year high in the process. Strong supply growth in 2016 eased during 2017, a
function of fewer new mines and more frequent disruptions, helping to support prices.
Aluminium prices started 2017 at around US$1,700/tonne and increased by more than 20 per cent during the year to average around US$2,100/tonne in the fourth quarter. Chinese smelter capacity closures and tightened environmental regulations contributed to improving profitability and sentiment. However, margins were partially eroded by higher energy, carbon and alumina costs. Alumina prices rallied strongly, up over 75 per cent from lows of around US$275/tonne FOB (free on board) in the second quarter to over US$480/tonne in quarter four, as declining bauxite availability within China constrained alumina output. Bauxite did not match these increases, and average Chinese import prices fell moderately to just under US$50/tonne, as new supply from Guinea, Australia and Brazil replaced volumes lost to Malaysia’s export ban.
After a strong start to the year, iron ore prices corrected sharply in the second quarter, falling from over US$90/dry tonne CFR (cost and freight) to around US$55. This volatility was partially attributed to market concerns on improving seasonal iron ore availability, growing inventories and a less optimistic outlook on Chinese growth. Iron ore prices have since recovered, in line with the broad price strength observed in the commodity space.
Outlook Global economic growth is expected to improve further to around 3.2 per cent in 2018. Stronger-than-expected macro economic performance in 2017, benign central bank monetary policies, and improved global trade are increasing optimism that the global recovery will continue. Risks related to a rapid deceleration in China also appear to be somewhat reduced. There are, however, a number of unresolved issues around Brexit and concerns over both overinflated asset prices and potential US trade measures. Geopolitical tensions in the Middle East, Iran and between the US and North Korea also remain in a heightened state.
The US tax reduction package is improving business sentiment and investment, creating upside risks for US GDP growth. Prospects for a government infrastructure construction plan are less clear, however, given funding constraints and implications for the federal deficit. Downside risks include further monetary normalisation, rising inflation and the high valuations of US equities. Rising bond yields and higher inflation triggered a correction in the US equity market in late January 2018, signalling an end to a period of low volatility.
Eurozone growth prospects remain positive, at least into the first half of 2018, given high capital spending and strong consumer and business sentiment. In Japan, quantitative easing and supportive fiscal policy should also help boost business investment and prevent further deflation.
Emerging market prospects are supported by solid world trade growth, higher commodity prices, stronger capital inflows and a weaker US dollar. Further gradual rises in US interest rates could inhibit capital inflows in the second half, however.
In China’s case, growth is likely to slow only modestly due to slower property sales, construction and investment growth. Supply-side reform, tighter local government financing restrictions and environmental policies may reduce macro expenditure. Even so, downside pressures are likely to be offset to some extent by healthy external demand driven by stronger global growth.
Overall, the reflationary conditions that dominated global commodity markets over the last two years may be reaching their limits, though positive sentiment and further capacity cuts in China could provide support. Consensus now points to a moderate downside risk for commodity prices in the short to medium term, favouring producers at the lower end of the cost curve and those that can improve productivity.
Longer-term prospects remain positive. The industry is watching developments in new markets, such as electric vehicles, with interest. Growth opportunities in some commodities are amplified by mine depletion resulting from capital expenditure cutbacks. Rising costs are driving a renewed focus on productivity, particularly in steelmaking, improving premiums for higher-grade furnace feedstocks. For example, over the fourth quarter of 2017, the price of iron ore with a 62 per cent iron ore content was 70 per cent higher than iron ore with a 58 per cent iron ore content as steel mills minimised their environmental impact and maximised productivity.
8 riotinto.com Strategic report 2017
Strategic report Governance report Financial statements Production, reserves and operations Additional information
8
Group strategy
Supportive market conditions and strong value focus Following the volatile and depressed market conditions experienced over recent years, 2017 was a strong year for the mining sector. Many commodity markets continued to strengthen during the year, aided by economic expansion and positive consumer sentiment in advanced economies, and robust Chinese demand. Meanwhile, supply was impacted by a number of environmental, geopolitical and technical challenges, with the rate of new supply additions continuing to lag behind natural mine depletions across many commodities. These external tailwinds supported prices for a number of our commodities in 2017, helping to generate strong cash �ow, which we used to further strengthen our balance sheet and deliver signi�cant cash returns to shareholders.
While supportive market conditions are always welcome, we continue to focus on the value levers that are within our control. During 2017, we delivered further cost reductions, increased our productivity from mine to market and continued to allocate capital in line with our value-over-volume approach. Across the industry, and in view of
potential in�ationary cost headwinds, companies remain focused on maintaining strong balance sheets, reducing costs and improving productivity. Our early and consistent action in these areas continues to position us well: our balance sheet is among the strongest in the sector; our cost and productivity programmes are delivering results; and we have new volumes coming on line from our ongoing investment in organic growth.
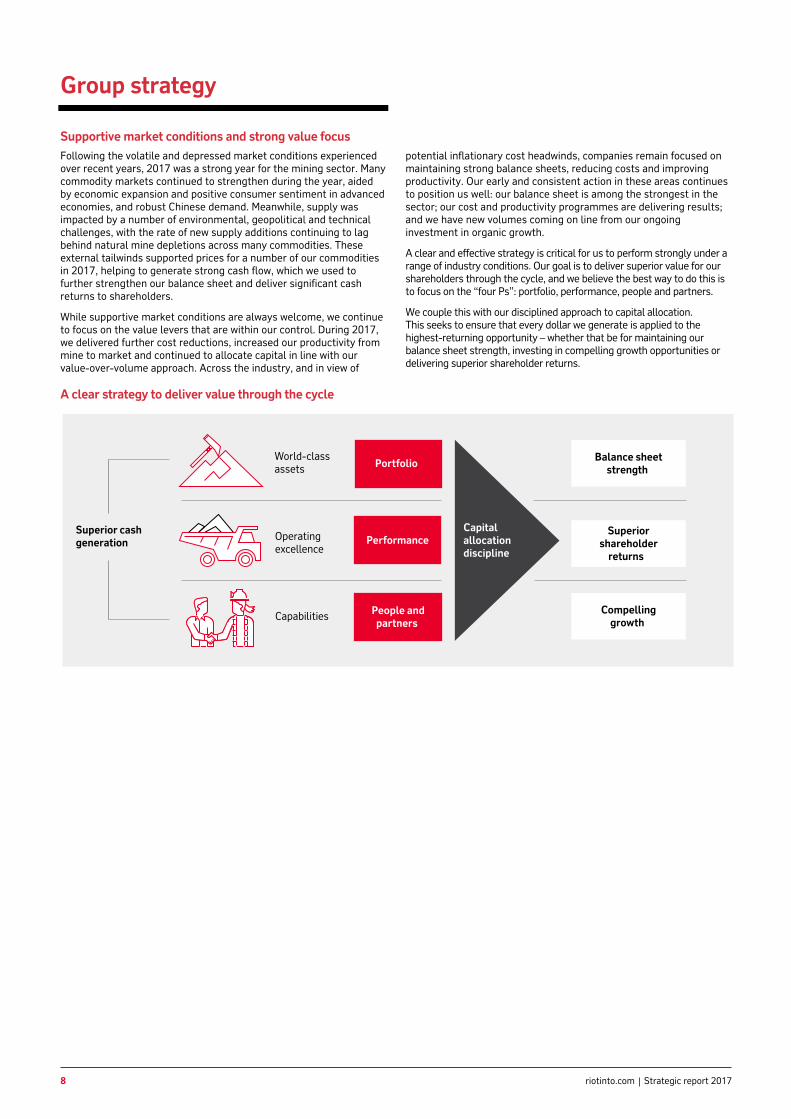
A clear and effective strategy is critical for us to perform strongly under a range of industry conditions. Our goal is to deliver superior value for our shareholders through the cycle, and we believe the best way to do this is to focus on the “four Ps”: portfolio, performance, people and partners.
We couple this with our disciplined approach to capital allocation. This seeks to ensure that every dollar we generate is applied to the highest-returning opportunity – whether that be for maintaining our balance sheet strength, investing in compelling growth opportunities or delivering superior shareholder returns.
A clear strategy to deliver value through the cycle
Superior cashgeneration
World-classassets Portfolio
Operatingexcellence
Performance
Capabilities People andpartners
Capitalallocationdiscipline
Balance sheetstrength
Superiorshareholder
returns
Compellinggrowth

9Strategic report 2017 riotinto.com
STRA
TEGIC
REP
OR
T
Strategic report Governance report Financial statements Production, reserves and operations Additional information
9
Superior cash generation
1. Portfolio
At the heart of our approach is a portfolio of world-class assets – from our Pilbara iron ore business, to our Queensland bauxite assets, our Canadian aluminium smelters and our global suite of copper mines. These are multi-decade assets that deliver attractive returns throughout the cycle, while providing material opportunities for growth over the long term. We use a clear strategic framework to assess our existing assets and new opportunities – taking into account the industry attractiveness and the competitive advantage of each asset, and its capacity to deliver strong and stable returns.
In 2017, we: – Invested US$2.0 billion in sustaining capital expenditure and US$2.5 billion in growth
opportunities, including our Silvergrass iron ore mine in Western Australia, the Oyu Tolgoi underground copper mine development in Mongolia and our Amrun bauxite project in Queensland.
– Opened our Silvergrass iron ore mine in Western Australia, having completed the construction of the mine safely, on budget and within 12 months.
– Continued lateral development and the sinking of Shaft 2 at the Oyu Tolgoi underground copper mine development in Mongolia.
– Completed installation of wharf modules and positioned process plant bene�ciation modules and transfer tower on location at the Amrun bauxite project in Queensland.
– Approved a US$368 million commitment (Rio Tinto share: 55 per cent or US$202 million) to further advance the Resolution Copper project in the US.
– Announced an increase to our Pilbara iron ore reserves in Western Australia.
– Completed the sale of our Coal & Allied thermal coal business for US$2.69 billion.
Priorities for 2018: – Continue to progress the development of the Oyu Tolgoi underground copper mine in
Mongolia and the Amrun bauxite project in Queensland.
– Continue to ramp-up production from the conveyor system at our Silvergrass iron ore mine.
– Complete the sale of Aluminium Dunkerque.
– Complete the sale of ISAL, Aluchemie and Aluminium Fluoride.
2. Performance
Safety is our number one priority and is core to everything we do. A well-run operation is a safe operation.
We seek to generate value at all stages of the value chain – from mine through to market. We prioritise value over volume in all of our operating and investment decisions. We have delivered substantial cost savings over recent years and this remains a key focus area. Beyond this, we continue to increase the productivity of our existing assets, as a substantial and low-risk source of incremental returns.
We have established a leading position in the development and use of technology and innovation – allowing us to deliver more tonnes more cheaply and with less risk. As the industry faces increasingly complex geological, environmental and cost pressures, our technology advantage will be an increasingly important value driver.
Our commercial activities seek to deliver the maximum value from each of our businesses. Our centralised marketing function works hand-in-hand with our operations, so that our resource management is fully aligned to the prevailing market.
Over the years we have leveraged our understanding of customer needs to create new markets for our products, including high-temperature Weipa bauxite, and champagne and pink diamonds. We deploy our capabilities in supply chain optimisation and a variety of logistics solutions across the Group – and have in-house centres of excellence for value-in-use analysis, pricing and contracting strategies. Together, these activities allow us to manage risk and capture value in all market conditions.
In 2017, we: – Suffered one safety fatality and one health fatality at our managed operations, and
therefore did not meet our goal of zero harm. – Completed over 1.4 million critical control veri�cations in our critical risk management
fatality prevention programme. – Announced a record full-year dividend of US$5.2 billion, as part of total shareholder
returns of US$9.7 billion declared with respect to 2017. – Paid US$6.3 billion in cash returns to shareholders, comprising US$4.2 billion in dividends
and US$2.1 billion in share buy-backs. – Reduced our net debt from US$9.6 billion to US$3.8 billion. – Delivered US$0.4 billion in post-tax free cash �ow from mine-to-market productivity initiatives.– Achieved US$2.2 billion of operating cash cost improvements in 2016 and 2017, achieving
our target of US$2.0 billion six months ahead of schedule. – Reinforced our focus on driving mine-to-market value with the appointment of a chief
commercial of�cer and further investment in a centralised Commercial group headquartered in Singapore.
– Made strong progress with the automation of the Pilbara iron ore train system (AutoHaulTM), with more than 60 per cent of all train kilometres now completed in autonomous mode with a driver on board for supervision.
Priorities for 2018: – Continue to implement our new Process Safety standards at all relevant operations. – Deliver US$1.1 billion in cumulative post-tax free cash �ow from mine-to-market
productivity initiatives over 2017 and 2018, as part of our target to deliver cumulative free cash �ow of US$5.0 billion from these initiatives from 2017 to 2021.
– Complete the AutoHaulTM project (automation of the Pilbara train system) by the end of 2018. – Establish a dedicated Rio Tinto closure team to oversee the responsible planning and
oversight of future mine closures – including near-term mine closures such as the Argyle diamond mine in Western Australia and the Gove alumina re�nery in Northern Territory.

10 riotinto.com Strategic report 2017
Strategic report Governance report Financial statements Production, reserves and operations Additional information
10
Group strategy
3. People
As our industry evolves, new capabilities will be required and we must attract, develop and retain the right people to meet this challenge. We continue to strengthen our technical and commercial capabilities in particular, through our centres of excellence around these areas. Beyond this, we are committed to building a diverse and inclusive workforce at all levels of the organisation.
In 2017, we: – Launched the new Rio Tinto purpose and enhanced our company values and global code of
business conduct, The way we work, to set a strong sense of direction, increase employee engagement and attract future talent.
– Enabled 1,500 leaders to improve their leadership skills through a six-month development programme called Leading for Success.
– Exceeded our target of 20 per cent women in senior management roles (with female representation of 22.4 per cent at year end 2017).
– Introduced a new global minimum standard for paid parental leave. – Successfully negotiated enterprise agreements at Rio Tinto Kennecott, Kitimat,
Havre-Saint-Pierre and Gove Aluminium, and with the European Works Council. – Refreshed our graduate programme and held our �rst graduate summit – bringing
together young leaders from around the world to build relationships and share ideas.
Priorities for 2018: – Continue to improve employee engagement through strong leadership and creating a
high-performing and inclusive workforce. – Deploy the Leading for Success development programme to all 6,500 leaders by the end of 2018. – Continue to improve the diversity of our workforce by creating an inclusive workplace and
building a diverse pipeline of talent. – Reposition the Group employee value proposition (EVP) to ensure we attract, retain,
galvanise and inspire our workforce. – Strengthen the approach to our people performance culture. – Implement technical career paths and continue to build deep technical capabilities.
4. Partners
As a global company, the environment in which we operate is becoming more complex. To secure access to new resources, while managing the varying risk pro�les of our businesses across the globe, we must partner with a range of external stakeholders. These include our customers, suppliers, investors, governments and local communities (see “Delivering value for all of our stakeholders” on page 13).
Partnerships are relevant at all stages of the value chain and mining life cycle – from exploration, through to operations, marketing and mine closure. Successful partnerships enable us to secure and maintain our licence to operate and are a key long-term success factor for our industry.
In 2017, we: – Strengthened our sustainable development partnership with Tsinghua University by
extending the tenure of the Tsinghua-Rio Tinto Joint Research Centre for Resources, Energy and Sustainable Development.
– Extended our Channar Mining joint venture in Australia’s Pilbara region and agreed to supply an additional 10 million tonnes of iron ore to the joint venture.
– Signed a Technical Collaboration Agreement with China Minmetals Corporation, formalising a collaborative partnership in mineral exploration both inside and outside China.
– Signed a Memorandum of Understanding (MoU) with the Government of Serbia to progress the Jadar lithium-borate project through the study and permitting phases.
– Signed a MoU with China’s State-owned Assets Supervision and Administration Commission (SASAC) to develop executive training for Central State-owned Enterprise leaders on areas including stakeholder engagement, licence to operate, environmental and economic assessments and community engagement.
Priorities for 2018: – Continue to progress the Oyu Tolgoi copper development, under our recently established
country of�ce and joint working group with the Government of Mongolia.
– Continue to build strong long-term partnerships with key stakeholders at every stage of our business – from exploration, to development, operations and through to mine closures.
– Continue to look at new opportunities in metals and minerals associated with new technologies, trends and the needs of an urbanising and changing world – under the leadership of our Rio Tinto Ventures unit.
– Build our partnership capabilities across the business to deal with external complexities and social performance opportunities.
– Deliver our communities investment strategy.

11Strategic report 2017 riotinto.com
STRA
TEGIC
REP
OR
T
Strategic report Governance report Financial statements Production, reserves and operations Additional information
11
Capital allocation discipline We adopt a consistent and disciplined approach to capital allocation. Our first allocation is to sustaining capital. Secondly, we fund dividends for our shareholders. Finally, we assess the best use of the remaining capital between compelling growth, debt management and further cash returns to shareholders. At each stage, we apply stringent governance and assessment criteria to ensure that every dollar is spent in the right way.
Balance sheet strength In a cyclical and capital-intensive industry such as mining, a strong balance sheet is essential to preserve optionality and generate shareholder value at all points in the cycle. At 31 December 2017, our balance sheet was in a very strong position, with net debt of US$3.8 billion and a net gearing ratio of 7per cent. We see this as a major competitive advantage – providing us with resilience against market and macroeconomic volatility, the ability to fund shareholder returns through the cycle and a readiness to take advantage of investment opportunities as they arise.
Quality growth We have a high-quality pipeline of near-term and longer-dated projects across the portfolio. By reinforcing capital discipline and reshaping our projects, we have retained significant, high-quality growth despite further reducing our capital expenditure.
Superior shareholder returns We are committed to delivering superior returns to shareholders over the long term, and the cash returns we pay out to shareholders are a vital component of this. In a cyclical industry such as mining, we believe the most prudent way to deliver strong returns is to allow the overall level of returns to vary with the cycle. Accordingly, we aim to deliver shareholders total cash returns of 40 to 60 per cent of underlying earnings through the cycle. This policy is sustainable during cyclical lows, and allows shareholders to participate more fully in the upside during high points in the cycle.
Our 2018 strategic priorities
We enter 2018 in a strong financial position and with good momentum. Throughout 2018, we will continue to focus on the “four Ps” (Portfolio, Performance, People, and Partners) and our value-over-volume approach, to generate superior returns for our shareholders over the short, medium and long term.
As always, safety will remain our number one priority – as measured both by the elimination of fatalities and minimising our all injury frequency rate and lost-time injuries. Our strong focus on operating and commercial excellence will continue in 2018, as we seek to extract efficiency improvements across our entire value chain and work towards delivering US$5.0 billion of incremental free cash flow from mine-to-market productivity initiatives by 2021.
We will continue to shape our portfolio of assets, ensuring that we focus only on the highest-returning, world-class assets in our preferred industry sectors and seeking to exit assets that do not fit these criteria. We will progress our high-return growth projects, including the Amrun bauxite project in Queensland and the underground expansion at Oyu Tolgoi. We expect to invest around US$5.5 billion in capital expenditure during 2018.
Investing in our people and our partnerships with external stakeholders remains a key focus for 2018. We are investing ever more in developing the technical and commercial capabilities that will enable us to unlock maximum value from our assets. In addition, we will continue building and maintaining strong partnerships across all stages of the value chain, founded on trusted relationships and our reputation for doing things the right way. Strong partnerships allow us to access and execute new opportunities, maximise value from our existing assets and manage licence-to-operate risks.
As we look ahead to 2018, we see reasons for both optimism and caution. Favourable macroeconomic conditions are expected to continue, and while we may see a slowdown in China’s growth during 2018, growth prospects in Europe and emerging markets look strong. We are also seeing increased demand for a number of materials that will underpin future growth and the decarbonisation of the economy. However, we expect cost inflation to increase across the industry during 2018, and at a macro level we see uncertainty in a number of areas – including ongoing geopolitical tensions, a rise in protectionism and threats from technological disruption and cyber security.
It is clear that we are living in a period of rapid change. In this environment, we will continue to apply our value-led approach to capital spending and will drive performance improvements right across our value chain. Maintaining balance sheet strength remains a priority, and we will continue to position Rio Tinto as an agile, open and collaborative company ready to respond to the opportunities and challenges that emerge.

12 riotinto.com Strategic report 2017
Strategic report Governance report Financial statements Production, reserves and operations Additional information
12
Business model
How we create value
Rio Tinto owns a global and diversi�ed portfolio of world-class assets: the result of investment decisions made in line with our long-standing strategy (see page 8).
We create value through the way we �nd, develop and operate these assets, how we market the minerals and metals they produce, and the legacy we leave at the end of their lives.
To optimise the value of our portfolio over time, we pursue opportunities for productivity improvements, cost reductions and focused growth. We are committed to running and growing our business in ways that are increasingly safer, smarter and more sustainable.
Our competitive advantages stem from our asset portfolio, our strong balance sheet, and the operating and commercial excellence achieved by our teams.
Coupled with our framework for managing risk effectively, these provide strength across the cycle, and through the challenges that the external environment presents.
Our approach is described in our business life cycle below, along with examples showing some of the ways we create value.
Our in-house exploration team has a multi-decade track record of discovering orebodies in both green�eld and brown�eld settings. To maintain our focus on targets that are important to Rio Tinto, we run most exploration programmes ourselves, but we also partner with others where this gives us access to skills or opportunities that we do not possess in-house.
Our exploration teams are often the �rst contact with communities we may work alongside for decades, so we explore respectfully and make sure we engage with them from an early stage.
Using our orebody knowledge, we develop our resources and position our products in the marketplace in ways that add value and support the Group’s investment decision-making. Our geological expertise gives us the con�dence to keep looking for the most elusive discoveries.
We have a strong tradition of developing innovative technologies to resolve speci�c exploration challenges. We apply these technologies, together with our tried and tested exploration techniques, to drive discovery success in the future.
Our approach is to develop orebodies so that they deliver value over the long term. We apply rigorous assessment and review processes that aim to ensure we only approve investments that offer attractive returns well above our cost of capital. We assess the spectrum of risk and how we will manage it (see page 18).
Once we have con�rmed the value of a resource and received internal and external approvals to develop it, the project moves into the implementation phase. The product groups work in partnership with Rio Tinto Projects – part of the Growth & Innovation group (see page 46).
As we develop an operation, we plan the most ef�cient con�guration for mining the orebody and getting the products to market – building in optionality to respond to changes in market conditions. We work closely with our customers to create demand that maximises the value of the deposit over its lifetime. We also work in partnership with host governments and communities, identifying ways in which we can deliver mutual bene�ts from the development of our operations.
We create value by operating our assets safely and ef�ciently, and by building on our leadership position in low-cost operations. With a global operating model, we can apply standard processes and systems across the Group in areas such as health, safety, environment and communities, procurement, operations and maintenance. This extends the life of our equipment and optimises the extraction of ore, meaning higher production, lower costs and maximised value. Our operations bring bene�t to local economies by providing employment opportunities, procurement, and the transparent payment of tax and royalties.
Our commitment to technology and innovation also sets Rio Tinto apart. It enables us to take advantage of opportunities that may not be available to others, improves our productivity and helps us tailor our products to customer needs. Through our Mine of the FutureTM programme, we �nd advanced ways to extract minerals deep within the Earth while reducing environmental impacts and further improving safety. We use our network of partnerships with academia, technology suppliers and other experts to tap into knowledge and technical prowess that augment our own capabilities.
Business model in action
Business model in action
Business model in action
We are using modern analytical techniques such as mineral chemistry, together with our decades of geotechnical expertise, to better understand our resources and maximise the value we generate from mining and processing, while minimising the environmental impact of our activities.
In constructing the export wharf for the Amrun bauxite project in Australia, we applied techniques from the oil and gas industry that have delivered safety and productivity bene�ts over traditional construction methods. Modules for the kilometre-long wharf were prefabricated off-site in China, allowing for more streamlined assembly at Amrun and eliminating more than 300,000 high-risk work hours on site.
At our Pilbara Iron Ore operations, we have been �nding new ways to keep our people safe by eliminating working with live equipment. Teams have improved work practices using tools and technologies, such as wireless and thermal cameras, to ensure they are always kept safe. Once trialled, these innovations are being rolled out across sites to deliver safe and practical improvements.
Explore and evaluate Develop Mine and process

13Strategic report 2017 riotinto.com
STRA
TEGIC
REP
OR
T
Strategic report Governance report Financial statements Production, reserves and operations Additional information
13
Delivering value for all of our stakeholders
To be successful, we must continue to build strong partnerships at all stages of our business model. Through our global footprint and diverse portfolio, we are able to create value for our stakeholders in a variety of ways.
Communities Our operations create jobs for local communities and can open up new markets for local suppliers. Communities often bene�t from the infrastructure we put in place and once our operations are closed, we restore the sites – for instance for community use, new industry, or back to native vegetation.
Customers We supply our customers with the right materials at the right time, so they can add value by turning them into the end products that society needs to sustain and enhance modern life. Through recycling, many of our products last well beyond the lifetime of our operations.
Governments We are often a major economic and social contributor to the local, state and national jurisdictions in which we operate. Our tax payments and sovereign equity participation enable governments to develop and maintain public works, services and institutions. We help create growth that endures far beyond the active life of our operations.
Our people We invest in our people throughout their careers, offering diverse employment prospects, opportunities for development, and competitive rewards and bene�ts that have a clear link to performance.
Shareholders Our primary objective is to deliver superior shareholder returns through the cycle. We do this by balancing disciplined investment with prudent management of our balance sheet and shareholder returns.
Suppliers By seeking the right balance of global, national and local supply capability, and supporting local supplier development wherever possible, we drive value for our shareholders and deliver economic bene�ts for the communities in which we operate.
Our business is based on the supply of high-quality products that have been developed to meet our customers’ needs. The minerals and metals we supply – mostly to industrial companies that process them further – form the basis of products that are used in everyday life and are essential to advancing standards of living and human progress. Our diverse portfolio allows us to respond to demand throughout countries’ economic development cycles, including in infrastructure, transport, machinery, energy and consumer goods.
Rio Tinto’s marketing teams work with our operations to align our resource management with market needs and to make sure we offer products and services that maximise value for our customers. We are strengthening our commercial capabilities, including through our Commercial organisation headquartered in Singapore, a strong sales and marketing presence in each of the markets we serve, value-focused organisations including Procurement and Marine & Logistics, and commercial insights from our market and industry analysts.
What we learn from our markets and customers helps us to re�ne our investment decisions. We deliver a number of products ourselves, with logistics capabilities that include our own networks of rail, ports and ships.
Closure planning is part of every asset’s life cycle. We start planning for closure from the earliest stages of investment and development to help optimise outcomes and minimise risk.
Where possible, we aim to progressively rehabilitate sites during the years of active operation. When a resource reaches the end of its life, we seek to minimise its �nancial, social and environmental impact by �nding sustainable and bene�cial future land uses.
We identify post-closure options that take into account stakeholders’ concerns while ful�lling regulatory requirements.
Business model in action
Business model in action
During 2017, we applied to have some of our Canadian aluminium assets certi�ed under the Aluminium Stewardship Initiative (ASI) – a global organisation set up to promote improvements in the environmental, social and governance impacts of aluminium production, use and recycling. The ASI’s new certi�cation programme will give customers, end users and other stakeholders greater visibility of the responsible footprint of aluminium products.
The main remediation works at the Holden copper mine in Washington State, US, were completed in 2017. Mining of the Holden mine ended in the 1950s. Rio Tinto never operated the mine, but inherited the site through acquisition, and has managed its remediation. The American Exploration & Mining Association recently awarded Rio Tinto an Environmental Excellence Award for its clean up of the legacy site.
Market and deliver Close down and rehabilitate

14 riotinto.com Strategic report 2017
Strategic report Governance report Financial statements Production, reserves and operations Additional information
14
Key performance indicators
Our key performance indicators (KPIs) enable us to measure our �nancial and sustainable development performance. Their relevance to our strategy and our performance against these measures in 2017 are explained on these pages. Some KPIs are used as a measure in the long-term incentive arrangements for the remuneration of executives. These are identi�ed with this symbol:
See the Remuneration Report
► 70
KPI trend data The Group's performance against each KPI, and explanations of the actions taken by management to maintain and improve performance against them, are covered in more detail in later sections of this Annual report. Explanations of the actions taken by management to maintain and improve performance against each KPI support the data.
Notes: (a) The data presented in this table accounts for the dual corporate structure of Rio Tinto.
The approach used to weight the two Rio Tinto listings, and produce a Group TSR �gure is consistent with the methodology used for the Performance Share Plan (PSP).
(b) The accounting information in these charts is extracted from the �nancial statements. (c) Underlying earnings is a key �nancial performance indicator which management uses
internally to assess performance. It is presented here as a measure of earnings to provide greater understanding of the underlying business performance of the Group’s operations and to enhance comparability of reporting periods. Items excluded from net earnings to arrive at underlying earnings are explained in note 2 to the 2017 �nancial statements. Both net earnings and underlying earnings deal with amounts net of tax attributable to the owners of Rio Tinto. However, IFRS requires that the pro�t for the year reported in the income statement should also include earnings attributable to non-controlling interests in subsidiaries.
All injury frequency rate (AIFR)
Per 200,000 hours worked
Relevance to strategy Safety is our number one priority, one of our core values and an essential component to everything we do. Our goal is zero harm, including, above all, the elimination of fatalities. We are committed to reinforcing our strong safety culture and key to this is improving safety leadership and simplifying the tools and systems used in operational tasks.
Our AIFR has improved 37 per cent over the last �ve years. At 0.42, our AIFR decreased in 2017 versus 2016. However, we did not meet our goal of zero fatalities. In 2017, one colleague died as a result of a safety incident while working at our Rio Tinto Kennecott smelter and there was a health-related death of a colleague undertaking exploration activities. Both fatalities were at Rio Tinto managed operations.
De�nition AIFR is calculated based on the number of injuries per 200,000 hours worked. This includes medical treatment cases, restricted work-day and lost-day injuries for employees and contractors at Rio Tinto-managed operations.
Associated risks – HSE risks, as our operations are inherently hazardous. – Operations, projects and people risks, including management of
major hazard and safety control frameworks.
Link to executive remuneration AIFR and other safety metrics are included in the short-term incentive plan for executives. Refer to the Remuneration Report on page 81.
Forward plan The Group will: – Maintain critical risk management implementation. – Strengthen collaboration with contractors and joint venture partners
to improve safety performance. – Continue to implement our major hazard standards with strong
assurance processes. – Simplify critical safety tools.
More information
► 30 – 31
$
2013
Performance
2014
2015
2016
2017
0.65
0.59
0.44
0.44
0.42
$

15Strategic report 2017 riotinto.com
STRA
TEGIC
REP
OR
T
Strategic report Governance report Financial statements Production, reserves and operations Additional information
15
Total shareholder return (�ve years) (TSR)(a)
%
Relevance to strategy The aim of our strategy is to maximise shareholder returns through the cycle. This KPI measures performance in terms of shareholder value over a period of time. We also measure relative TSR performance against the Euromoney Global Mining Index of peers and the MSCI World Index of large global companies.
Rio Tinto’s TSR performance from 2013 to 2017 was principally impacted by movements in commodity prices and changes in the global macro environment. There was a signi�cant recovery in the share prices of Rio Tinto plc and Rio Tinto Limited in 2017, driven by stronger pricing across most commodities and a steady improvement in the global economic outlook. The Group outperformed the Euromoney Global Mining index of peers over the �ve-year period by 34 percentage points but signi�cantly underperformed the MSCI World Index over the same time frame.
De�nition TSR combines share price appreciation, dividends paid and reinvested, to show the total return to the shareholder.
Associated risks – Market risks, such as variability in commodity prices and exchange
rates. – Stakeholder risks, including the actions of joint venture partners,
third parties and governments.
Link to executive remuneration Relative TSR over a �ve-year period, measured equally against the Euromoney Global Mining Index and the MSCI World Index, are the performance measures included in long-term incentive plans for executives.
Forward plan Management will continue to focus on generating free cash �ow from operations with the intention of maximising shareholder value, through an appropriate balance of cash returns to shareholders and investment in the business.
More information ► 94
Net cash generated from operating activities(b)
US$ millions
Relevance to strategy Net cash generated from operating activities is a measure demonstrating conversion of underlying earnings to cash. It measures our ability to generate cash from our businesses to fund investment, reduce our debt and return cash to shareholders.
Net cash from operating activities of US$13.9 billion was 64 per cent higher year-on-year, primarily due to higher prices partly offset by an increase in taxes paid driven by higher pro�ts.
De�nition Net cash generated from operating activities represents the cash generated by the Group’s consolidated operations, after receipt of dividends from equity-accounted units and payment of interest, taxes, and dividends to non-controlling interests in subsidiaries.
Associated risks – Market risks, such as variability in commodity prices and exchange
rates. – Operations, projects and people risks, including delivery of
productivity improvements. – Stakeholder risks, including the actions of joint venture partners,
third parties and governments.
Link to executive remuneration Net cash generated from operating activities is a component of the free cash �ow �nancial performance measure included in the short-term incentive plan for executives. In the longer term, the measure in�uences TSR which is included in long-term incentive plans for executives. Refer to the Remuneration Report on page 80.
Forward plan The Group is targeting US$5 billion in additional free cash �ow from its �ve-year productivity programme from 2017 to 2021.
More information ► 114
$ $
Performance
2013
2014
2015
2016
2017
15,078
14,286
9,383
8,465
13,884
2014
2015
2016
2017
2013 (0.8)
(15.6)
(32.6)
43.8
41.3
Performance

16 riotinto.com Strategic report 2017
Strategic report Governance report Financial statements Production, reserves and operations Additional information
16
Underlying earnings(b) (c)
US$ millions
Relevance to strategy Underlying earnings gives insight to cost management, production growth and performance ef�ciency on a like-for-like basis. We are focused on reducing operating costs, increasing productivity and generating maximum revenue from each of our assets.
Underlying earnings of US$8.6 billion were US$3.5 billion higher than 2016, driven by the US$4.1 billion (post-tax) impact of higher prices.
De�nition Underlying earnings represents net earnings attributable to the owners of Rio Tinto, adjusted to provide greater understanding of the underlying performance of the Group’s operations. Items excluded from net earnings to arrive at underlying earnings are explained in note 2 “Operating segments” to the 2017 �nancial statements.
Associated risks – Market risks, such as variability in commodity prices and exchange
rates. – Operations, projects and people risks, including delivery of
productivity improvements. – Stakeholder risks, including the actions of joint venture partners,
third parties and governments.
Link to executive remuneration Underlying earnings is a key measure of �nancial performance included in the short-term incentive plan for executives. In the longer term, the measure in�uences TSR and improvements in EBIT margin, which are both included in long-term incentive plans for executives. Refer to the Remuneration Report on page 80.
Forward plan The Group will continue to focus on delivery of returns through the cycle, driven by productivity improvements and value-accretive growth.
More information ► 132
Net debt(b)
US$ millions
Relevance to strategy Net debt is a measure of how we are managing our balance sheet and capital structure. A strong balance sheet is essential to remaining robust through the cycle and creating the ability to deliver appropriate shareholder returns.
Net debt decreased from US$9.6 billion to US$3.8 billion, principally as net cash generated from operating activities and disposal of businesses exceeded capital expenditure and cash returns to shareholders.
De�nition Net debt is calculated as: the net borrowings after adjusting for cash and cash equivalents, other liquid investments and derivatives related to net debt. This is further explained in note 24 “Consolidated net debt” to the 2017 �nancial statements.
Associated risks – Market risks, such as variability in commodity prices and exchange
rates. – Operations, projects and people risks, including delivery of
productivity improvements. – Stakeholder risks, including the actions of joint venture partners,
third parties and governments. – Financial risks, including the impact of external events and internal
discipline on group liquidity. – Strategic risks, such as the Group’s ability to successfully execute
divestments and acquisitions and its ability to develop new projects successfully.
Link to executive remuneration Net debt is, in part, an outcome of the Group’s free cash �ow performance. The free cash �ow �nancial performance measure is included in the short-term incentive plan for executives. In the longer term, the measure in�uences TSR which is included in long-term incentive plans for executives. Refer to the Remuneration Report on page 80.
Forward plan The Group believes that having a strong balance sheet is a major competitive advantage and is essential in a cyclical business, and will therefore continue to manage net debt carefully.
More information ► 149
$
Performance
2013
2014
2015
2016
2017
10,217
9,305
4,540
5,100
8,627
Performance
2013
2014
2015
2016
2017
18,055
12,495
13,783
9,587
3,845

17Strategic report 2017 riotinto.com
STRA
TEGIC
REP
OR
T
Strategic report Governance report Financial statements Production, reserves and operations Additional information
17
Capital expenditure(b)
US$ millions
Relevance to strategy Capital expenditure is necessary to sustain the productive capacity of our installed asset base and for growth. We are committed to a disciplined and rigorous investment process – investing capital only in projects that, after prudent assessment, offer attractive returns that are well above our cost of capital.
Total capital expenditure of US$4.5 billion in 2017 included US$2.0 billion of sustaining capital expenditure. Major capital projects in 2017 included the development of the Oyu Tolgoi underground copper mine, construction of key infrastructure at the Amrun bauxite project and completion of the Silvergrass iron ore mine.
De�nition Capital expenditure comprises the cash out�ow on purchases of property, plant and equipment, and intangible assets.
Associated risks – Financial risks, including the impact of external events and internal
discipline on Group liquidity, which is required to fund capital expenditure.
– Strategic risks, including the Group’s ability to develop new projects successfully.
– Operational risks, particularly in respect of sustaining capital expenditure.
Link to executive remuneration Sustaining capital expenditure is a component of the free cash �ow �nancial performance measure included in the short-term incentive plan for executives. In the longer-term, the measure in�uences TSR which is included in long-term incentive plans for executives. Refer to the Remuneration Report on page 80.
Forward plan The Group will continue to adopt a consistent and disciplined approach to capital allocation. Refer to the Group strategy report on pages 8 to 11 for further detail.
More information ► 131
Greenhouse gas (GHG) emissions intensity
Indexed relative to 2008 (2008 being equivalent to 100)
Relevance to strategy We are committed to reducing the energy intensity of our operations and the carbon intensity of our energy, including through the development and implementation of innovative technologies. Our GHG performance is an important indicator of this commitment and our ability to manage exposure to future climate policy and legislative costs.
(a) Number restated from that originally published to ensure comparability over time.
There was a 2 per cent reduction in GHG emissions intensity in 2017 versus 2016. This is largely a result of improvements in emissions intensities at several of our aluminium and alumina operations. We are on track to meet our target of 24 per cent reduction in total GHG emissions intensity between 2008 and 2020.
De�nition Our GHG emissions intensity measure is the change in total GHG emissions per unit of commodity production relative to a base year. Total GHG emissions are direct emissions, plus emissions from imports of electricity and steam, minus electricity and steam exports and net carbon credits purchased from or sold to recognised sources. The measure is indexed relative to 2008 (2008 being equivalent to 100).
Associated risks – Strategic risks, including those related to acquistions, divestments
and capital project delivery. – Operational risks, including failure to manage portfolio energy
requirements.
Link to executive remuneration There is no direct connection between executive remuneration and GHG emissions intensity performance.
Forward plan The Group will: – Continue to report on progress against our GHG emissions intensity
target. – Continue to improve our understanding, management and disclosure
of the resilience of our portfolio and of our physical assets to climate risks in a two degree Celsius temperature increase scenario.
More information
► 32
Performance
2013
2014
2015
2016
2017
13,001
8,162
4,685
3,012
4,482
2013
Performance
2014
2015
2016
2017 73.0
74.4(a)
79.7
81.7
83.2

18 riotinto.com Strategic report 2017
Governance report Financial statements Production, reserves and operations Additional information
18
Risk management
The risk management environment 2017 was a year where external uncertainty continued and internal risks required constant vigilance.
The geopolitical context for global trade remained unsettled. However, markets in general continued to grow. This combination drove a focus on external factors and the continuation of productivity initiatives in the Group to deliver our value-over-volume strategy. Enhancements to controls for managing operational risks (particularly cyber security and major hazards) sought to maintain and build resilience.
As stronger prices flowed through and supply was delivered in line with expectations, Rio Tinto retained its strong capital allocation discipline, returning cash to shareholders, further strengthening the balance sheet and investing in high-quality long-term green and brownfield projects.
Principal joint operations, managed and non-managed, and particularly those in jurisdictions with higher sovereign risk, continue to require close monitoring and active management.
Changes to the risk profile of the Group during 2017 are illustrated in the summary table below. Further detail on movements and monitoring of these exposures is provided in the relevant section of the Strategic report, including Market environment, Group strategy, product group overviews, the Directors’ report and the Notes to the 2017 financial statements.
Emerging risks Looking ahead, the external risk landscape continues to evolve. In the relatively near term, increased protectionism and geopolitical uncertainty present risk and uncertainty to the operating environment. In the medium term, technological disruption – from increased automation in mining and processing to greater use of cognitive learning and artificial intelligence – provides both threats and opportunities as companies seek to secure competitive advantage. In the longer term, the societal imperative to manage areas of environmental risk is expected to increase at the macro level, as concern about the ineffective management of “global commons” – the oceans, atmosphere and climate system – drives a search for sustainable solutions.
Internally, the strengthening of the commercial capability of the Group, through the appointment of a chief commercial officer and the development of a strong governance and risk framework to support co-located commercial operations in Singapore, will ensure appropriately rigorous management of this increasingly important part of the business. In addition, the establishment of a dedicated closure team will provide stronger planning and oversight of the growing activities associated with responsible future mine closure. Looking forward, managed and non-managed joint ventures as well as partnerships are likely to play a still larger role in the Group’s portfolio. These mechanisms provide growth opportunities for the Group but will also require the further development of the Group’s capability and capacity to manage and participate in these arrangements effectively.
Assessment The board confirms that, in conjunction with the consideration of the Group’s strategy and business plan, it has carried out a robust assessment of the principal risks of the Group as detailed below and has also tested the financial plans of the Group for each of these principal risks, and for a series of severe but plausible scenarios, made up of the concurrence or close sequence of a number of principal and material risks.
The Group will continue to monitor the potential impacts of the UK’s departure from the European Union as a result of the referendum that took place in June 2016, but no material impacts are expected at this time, irrespective of the path eventually followed or the outcome reached.
Longer-term viability statement Current business planning processes within Rio Tinto require the preparation of detailed financial plans over a three-year time horizon. The Group’s strategy is developed, and capital investment decisions are made, based on an assessment of cash flows over a multi-decade horizon, with financial investment capacity regularly tested to ensure capital commitments can be funded in line with the Group’s capital allocation model. This multi-year planning approach reflects our business model of investing in, and operating, long-life mining assets, whose outputs we sell into commodity markets over which we have limited influence.
The planning process requires modelling under macroeconomic scenarios and assumptions of both internal and external parameters. Key assumptions include: projections of economic growth, and thus commodity demand in major markets, primarily China; commodity prices and exchange rates, often correlated; introduction of technological and productivity advancements; cost and supply parameters for major inputs; and a series of assumptions around the schedule and cost of implementation of organic and inorganic growth programmes.
Reflecting the speed and degree of change possible in a number of these parameters, such as Chinese demand, commodity prices, and exchange rates, Rio Tinto has deemed a three-year period of assessment appropriate for the longer-term viability statement, consistent with the Group’s detailed planning horizon.
Robust stress-testing has been undertaken, as part of the business planning process, to further test and confirm the longer-term viability of the Group, beyond commodity price and exchange rate movements. Production and political and stakeholder risk related assumptions were also stressed, individually and collectively, to levels considered severe but plausible and well beyond those expected in the normal course of business.
The viability of the Group under these scenarios remained sound with the use of a suite of management actions available to redress material adverse changes, including accessing lines of credit and changing capital allocation levers.
Therefore, taking into account the Group’s current position and principal risks, the directors have assessed the prospects of the Group, over the next three years, and have a reasonable expectation that the Group will be able to continue to operate and meet its liabilities as they fall due over that period.
It is impossible to foresee all risks, and the combinations in which they could manifest, and there may be risks that currently or individually do not appear material that could turn out to be material, particularly if occurring in close sequence.
Principal risks and uncertainties exposure at a glance – 2017 trend
External Internal Internal and external
Increasing risk or uncertainty
▲ – Sovereign risk(a) – Attracting and retaining talent
No change in risk or uncertainty
▬ – Strategic partnerships
– Commodity prices
– China growth pathway
– Execution of acquisitions and divestments
– Capital project development
– HSEC
– Exploration and resources
– Operational excellence
– Regulation and regulatory
intervention Decreasing risk or uncertainty ▼ – Liquidity
(a) Sovereign risk includes both direct risk from actions of nation states and geopolitical uncertainty more broadly, and is present across all jurisdictions to which the Group has exposure.
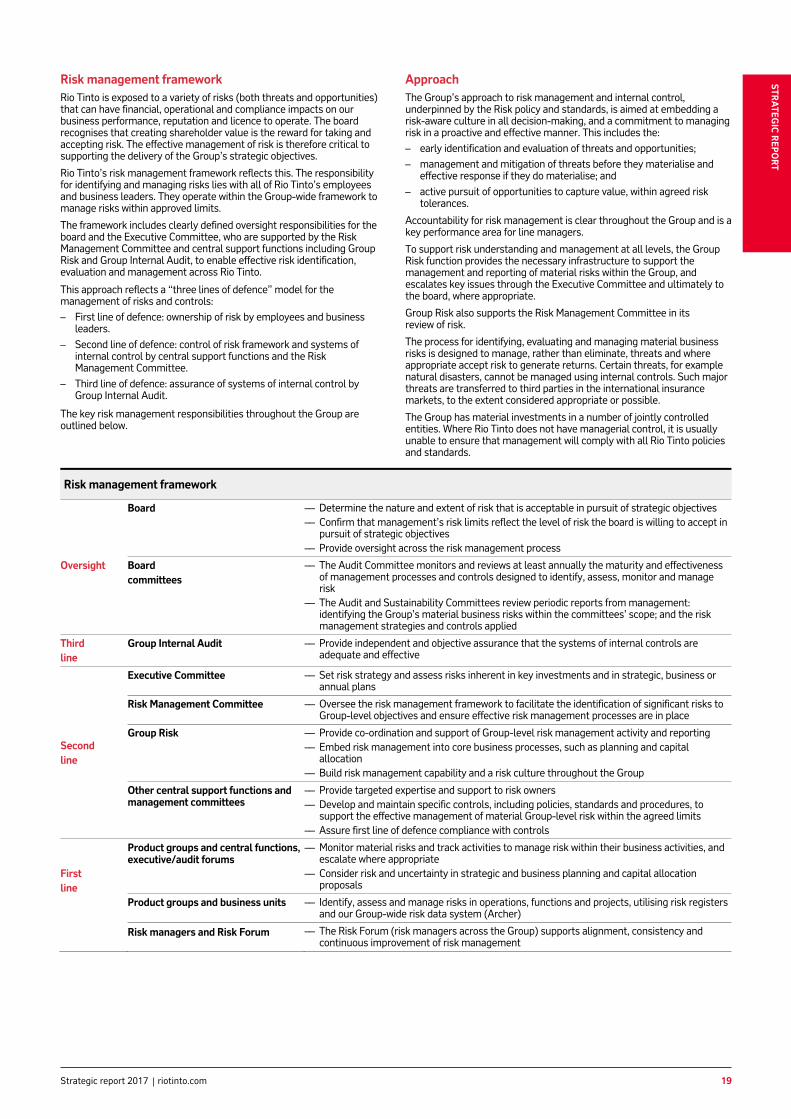
19Strategic report 2017 riotinto.com
STRA
TEGIC
REP
OR
T
Strategic report Governance report Financial statements Production, reserves and operations Additional information
19
Risk management framework Rio Tinto is exposed to a variety of risks (both threats and opportunities) that can have financial, operational and compliance impacts on our business performance, reputation and licence to operate. The board recognises that creating shareholder value is the reward for taking and accepting risk. The effective management of risk is therefore critical to supporting the delivery of the Group’s strategic objectives.
Rio Tinto’s risk management framework reflects this. The responsibility for identifying and managing risks lies with all of Rio Tinto’s employees and business leaders. They operate within the Group-wide framework to manage risks within approved limits.
The framework includes clearly defined oversight responsibilities for the board and the Executive Committee, who are supported by the Risk Management Committee and central support functions including Group Risk and Group Internal Audit, to enable effective risk identification, evaluation and management across Rio Tinto.
This approach reflects a “three lines of defence” model for the management of risks and controls: – First line of defence: ownership of risk by employees and business
leaders. – Second line of defence: control of risk framework and systems of
internal control by central support functions and the Risk Management Committee.
– Third line of defence: assurance of systems of internal control by Group Internal Audit.
The key risk management responsibilities throughout the Group are outlined below.
Approach The Group’s approach to risk management and internal control, underpinned by the Risk policy and standards, is aimed at embedding a risk-aware culture in all decision-making, and a commitment to managing risk in a proactive and effective manner. This includes the: – early identification and evaluation of threats and opportunities; – management and mitigation of threats before they materialise and
effective response if they do materialise; and – active pursuit of opportunities to capture value, within agreed risk
tolerances.
Accountability for risk management is clear throughout the Group and is a key performance area for line managers.
To support risk understanding and management at all levels, the Group Risk function provides the necessary infrastructure to support the management and reporting of material risks within the Group, and escalates key issues through the Executive Committee and ultimately to the board, where appropriate.
Group Risk also supports the Risk Management Committee in its review of risk.
The process for identifying, evaluating and managing material business risks is designed to manage, rather than eliminate, threats and where appropriate accept risk to generate returns. Certain threats, for example natural disasters, cannot be managed using internal controls. Such major threats are transferred to third parties in the international insurance markets, to the extent considered appropriate or possible.
The Group has material investments in a number of jointly controlled entities. Where Rio Tinto does not have managerial control, it is usually unable to ensure that management will comply with all Rio Tinto policies and standards.
Risk management framework
Board –– Determine the nature and extent of risk that is acceptable in pursuit of strategic objectives –– Confirm that management’s risk limits reflect the level of risk the board is willing to accept in
pursuit of strategic objectives –– Provide oversight across the risk management process
Oversight Board committees
–– The Audit Committee monitors and reviews at least annually the maturity and effectiveness of management processes and controls designed to identify, assess, monitor and manage risk
–– The Audit and Sustainability Committees review periodic reports from management: identifying the Group’s material business risks within the committees’ scope; and the risk management strategies and controls applied
Third line
Group Internal Audit –– Provide independent and objective assurance that the systems of internal controls are adequate and effective
Executive Committee –– Set risk strategy and assess risks inherent in key investments and in strategic, business or annual plans
Risk Management Committee –– Oversee the risk management framework to facilitate the identification of significant risks to Group-level objectives and ensure effective risk management processes are in place
Second line
Group Risk –– Provide co-ordination and support of Group-level risk management activity and reporting–– Embed risk management into core business processes, such as planning and capital
allocation –– Build risk management capability and a risk culture throughout the Group
Other central support functions and management committees
–– Provide targeted expertise and support to risk owners–– Develop and maintain specific controls, including policies, standards and procedures, to
support the effective management of material Group-level risk within the agreed limits –– Assure first line of defence compliance with controls
First line
Product groups and central functions, executive/audit forums
–– Monitor material risks and track activities to manage risk within their business activities, and escalate where appropriate
–– Consider risk and uncertainty in strategic and business planning and capital allocation proposals
Product groups and business units –– Identify, assess and manage risks in operations, functions and projects, utilising risk registers and our Group-wide risk data system (Archer)
Risk managers and Risk Forum –– The Risk Forum (risk managers across the Group) supports alignment, consistency and continuous improvement of risk management

20 riotinto.com Strategic report 2017
Strategic report Governance report Financial statements Production, reserves and operations Additional information
20
Principal risks and uncertainties
The principal risks and uncertainties outlined in this section reflect the inherent risks that could materially affect Rio Tinto or its ability to meet its strategic objectives, either directly or by triggering a succession of events that in aggregate become material to the Group.
Rio Tinto’s business units and functions assess the potential economic and non-economic consequences of their respective risks using the framework defined by the Group’s Risk standard. Once identified, each principal risk or uncertainty is reviewed and monitored by the relevant internal experts and by the Risk Management Committee, and as appropriate, by the relevant board committees and the board.
There may be additional risks unknown to Rio Tinto and other risks currently not believed to be material which could turn out to be material. A number of them, particularly those with longer-term potential impacts, are referred to in the sustainable development section of this Annual report on pages 28 to 37.
The principal risks and uncertainties should be considered in connection with any forward-looking statements in this Annual report and the cautionary statement on the inside front cover.
Inherent risk and uncertainty
Risk exposure 2017 trend
Potential impact on viability, HSEC and reputation
Potential upside impact (opportunities)
Market risks
Rio Tinto operates in global markets and accepts the impact of exchange rate movements and market-driven prices for our commodities, seeking premiums where possible.
Commodity prices, driven by demand and supply for the Group’s products, vary outside of expectations over time.
Exchange rate variations and geopolitical issues may offset or exacerbate this risk.
Anticipating and responding to market movements is inherently uncertain and outcomes may vary.
▬
– Business model – Future performance – Solvency – Liquidity – Group reputation
A rise in commodity prices, or favourable exchange rate movement, generates more cash flow from operations, enabling the Group to pursue growth options or capital expansions, pay down debt and/or increase returns to shareholders.
Capturing above-planned returns from commercial insights would deliver additional cash flow to the Group.
China’s growth pathway could impact demand for the Group’s products outside of expectations.
▬
– Business model – Future performance
Strong growth, positive policy decisions and reforms drive demand for commodities, resulting in rising prices which may justify capital expansion and increased shareholder returns in the short to medium term.
Financial risks
Rio Tinto maintains a strong balance sheet and liquidity position to preserve financial flexibility through the cycle.
External events and internal discipline may impact Group liquidity.
▼Balance sheet strengthened by stronger-than-forecast cash flows driven by higher commodity prices and cash from divestments.
– Future performance – Solvency – Liquidity – Group reputation
Favourable market conditions and strong internal discipline could increase Group liquidity and/or balance sheet strength and allow it to pursue investment or growth opportunities, pay down debt and enhance returns to shareholders.
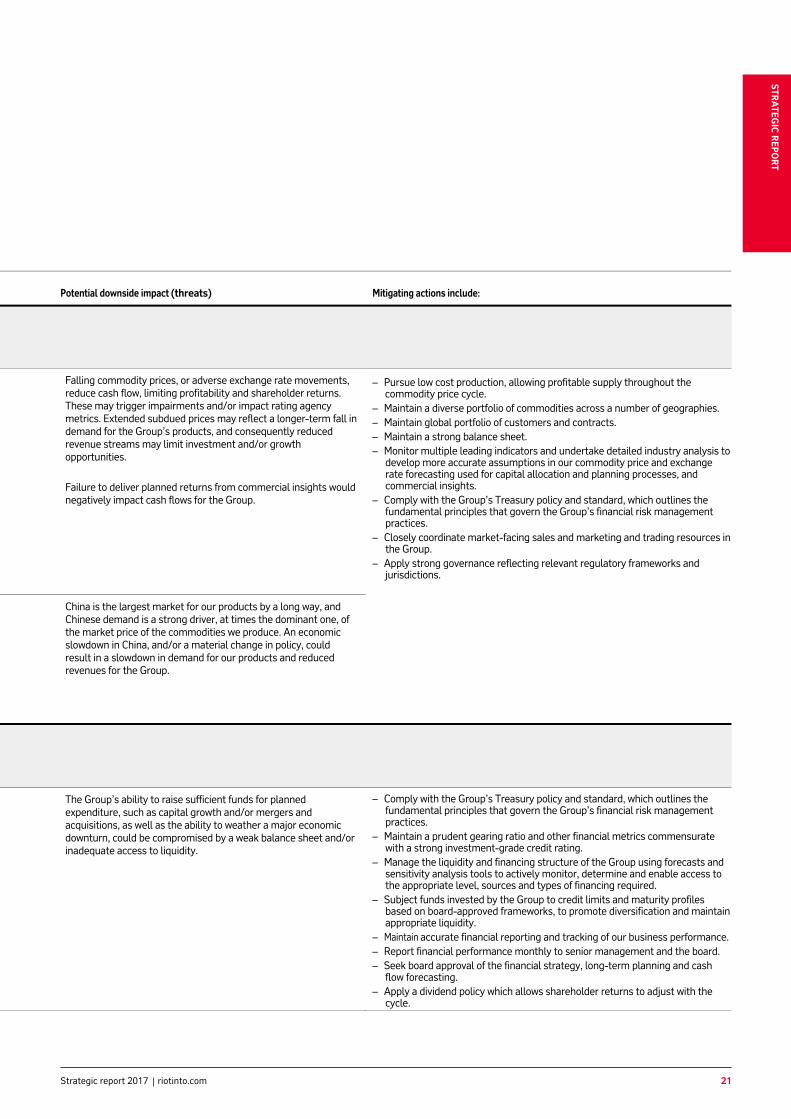
21Strategic report 2017 riotinto.com
STRA
TEGIC
REP
OR
T
Strategic report Governance report Financial statements Production, reserves and operations Additional information
21
Potential downside impact (threats) Mitigating actions include:
Falling commodity prices, or adverse exchange rate movements, reduce cash flow, limiting profitability and shareholder returns. These may trigger impairments and/or impact rating agency metrics. Extended subdued prices may reflect a longer-term fall in demand for the Group’s products, and consequently reduced revenue streams may limit investment and/or growth opportunities.
– Pursue low cost production, allowing profitable supply throughout the commodity price cycle.
– Maintain a diverse portfolio of commodities across a number of geographies. – Maintain global portfolio of customers and contracts. – Maintain a strong balance sheet. – Monitor multiple leading indicators and undertake detailed industry analysis to
develop more accurate assumptions in our commodity price and exchange rate forecasting used for capital allocation and planning processes, and commercial insights.
– Comply with the Group’s Treasury policy and standard, which outlines the fundamental principles that govern the Group’s financial risk management practices.
– Closely coordinate market-facing sales and marketing and trading resources in the Group.
– Apply strong governance reflecting relevant regulatory frameworks and jurisdictions.
Failure to deliver planned returns from commercial insights would negatively impact cash flows for the Group.
China is the largest market for our products by a long way, and Chinese demand is a strong driver, at times the dominant one, of the market price of the commodities we produce. An economic slowdown in China, and/or a material change in policy, could result in a slowdown in demand for our products and reduced revenues for the Group.
The Group’s ability to raise sufficient funds for planned expenditure, such as capital growth and/or mergers and acquisitions, as well as the ability to weather a major economic downturn, could be compromised by a weak balance sheet and/or inadequate access to liquidity.
– Comply with the Group’s Treasury policy and standard, which outlines the fundamental principles that govern the Group’s financial risk management practices.
– Maintain a prudent gearing ratio and other financial metrics commensurate with a strong investment-grade credit rating.
– Manage the liquidity and financing structure of the Group using forecasts and sensitivity analysis tools to actively monitor, determine and enable access to the appropriate level, sources and types of financing required.
– Subject funds invested by the Group to credit limits and maturity profiles based on board-approved frameworks, to promote diversification and maintain appropriate liquidity.
– Maintain accurate financial reporting and tracking of our business performance.– Report financial performance monthly to senior management and the board. – Seek board approval of the financial strategy, long-term planning and cash
flow forecasting. – Apply a dividend policy which allows shareholder returns to adjust with the
cycle.

22 riotinto.com Strategic report 2017
Strategic report Governance report Financial statements Production, reserves and operations Additional information
22
Inherent risk and uncertainty
Risk exposure 2017 trend
Potential impact on viability, HSEC and reputation
Potential upside impact (opportunities)
Strategic risks
Rio Tinto enforces disciplined capital allocation to the best returning opportunities (organic and inorganic growth projects or returns to shareholders).
Rio Tinto’s ability to secure planned value by successfully executing divestments and acquisitions may vary.
▬ – Business model – Future performance – Solvency – Liquidity – Group reputation
Proceeds realised from divested assets are greater than planned, allowing more capital to be returned to shareholders or redeployed into higher returning or more productive uses. The Group is successful in acquiring businesses that provide cash flow and/or future growth optionality.
The Group’s ability to deliver projects successfully may vary. ▬
– Future performance – HSEC – Group reputation – Solvency
An ability to develop projects on time and within budget enhances the Group’s licence to operate and investor confidence.
Strategic partnerships play a material role in delivering the Group’s production, cash and market positioning, and these may not always develop as planned.
▬ – Business model – Future performance – HSEC – Group reputation
Joint ventures and partnerships offer opportunities to access resources, increase shareholder returns, and reduce political and operational risks.
Health, safety, environment and community (HSEC) risks
Rio Tinto’s operations are inherently hazardous. We lead responsibly to preserve our licence to operate and ensure our employees and contractors go home safe and healthy.
Our operations and projects are inherently hazardous with the potential to cause illness or injury, damage to the environment, disruption to a community or a threat to personal security.
▬ – Future performance – HSEC – Group reputation
Delivering leading health, safety, environment and communities performance is essential to our business success. Meeting or exceeding our commitments in these areas contributes to sustainable development and underpins our continued access to resources, capital and a diverse workforce to sustain the organisation.
Good performance in legacy management (of closed sites) and closure can enhance our reputation and enable us to maintain access to land, resources, people and capital, so we can continue to establish new projects with the support of local communities.
Resources risks
Rio Tinto invests materially to accurately identify new deposits and develop orebody knowledge, underpinning our operations and projects.
The success of the Group’s exploration activity may vary. In addition, estimates of ore reserves are based on uncertain assumptions that, if changed, could result in the need to restate ore reserves and mine plans.
▬ – Business model – Future performance – Group reputation
The discovery of a new viable orebody can significantly improve future growth options.
The volume of ore is based on the available geological, commercial and technical information, which is by its nature, incomplete. As new information comes to light the economic viability of some ore reserves and mine plans can be restated upwards. As a result, projects may be more successful and of longer duration than initially anticipated.
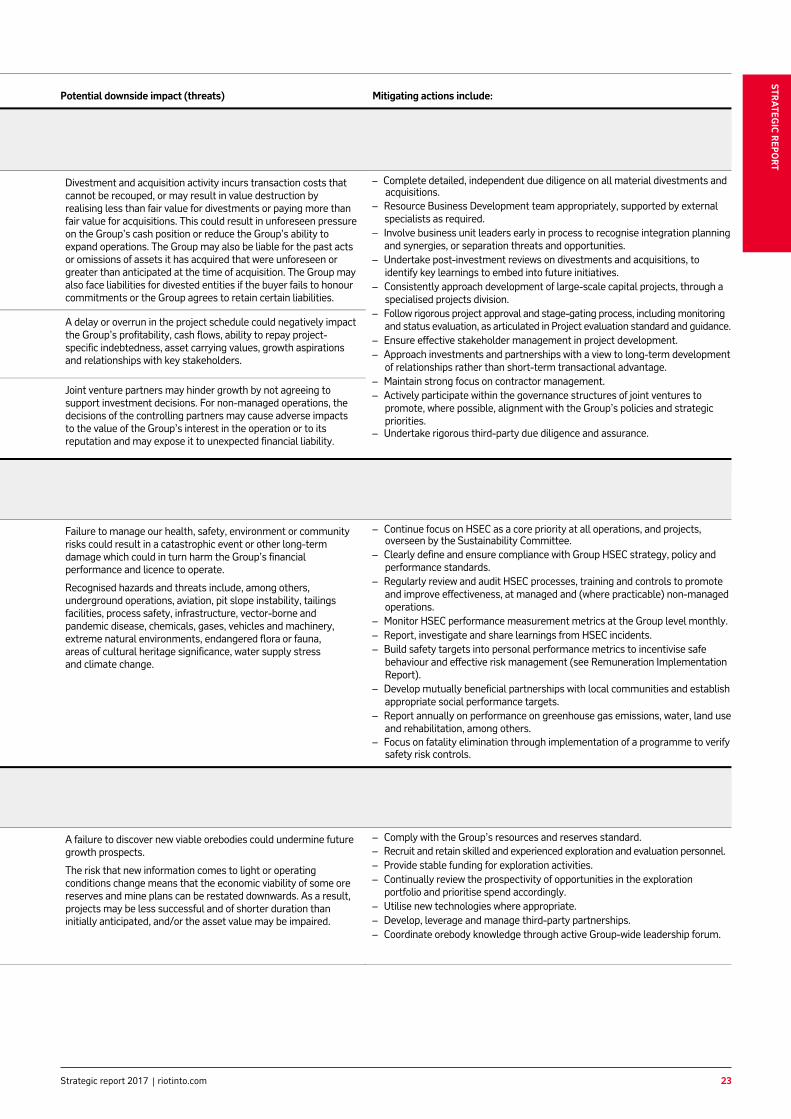
23Strategic report 2017 riotinto.com
STRA
TEGIC
REP
OR
T
Strategic report Governance report Financial statements Production, reserves and operations Additional information
23
Potential downside impact (threats) Mitigating actions include:
Divestment and acquisition activity incurs transaction costs that cannot be recouped, or may result in value destruction by realising less than fair value for divestments or paying more than fair value for acquisitions. This could result in unforeseen pressure on the Group’s cash position or reduce the Group’s ability to expand operations. The Group may also be liable for the past acts or omissions of assets it has acquired that were unforeseen or greater than anticipated at the time of acquisition. The Group may also face liabilities for divested entities if the buyer fails to honour commitments or the Group agrees to retain certain liabilities.
– Complete detailed, independent due diligence on all material divestments and acquisitions.
– Resource Business Development team appropriately, supported by external specialists as required.
– Involve business unit leaders early in process to recognise integration planning and synergies, or separation threats and opportunities.
– Undertake post-investment reviews on divestments and acquisitions, to identify key learnings to embed into future initiatives.
– Consistently approach development of large-scale capital projects, through a specialised projects division.
– Follow rigorous project approval and stage-gating process, including monitoring and status evaluation, as articulated in Project evaluation standard and guidance.
– Ensure effective stakeholder management in project development. – Approach investments and partnerships with a view to long-term development
of relationships rather than short-term transactional advantage. – Maintain strong focus on contractor management. – Actively participate within the governance structures of joint ventures to
promote, where possible, alignment with the Group’s policies and strategic priorities.
– Undertake rigorous third-party due diligence and assurance.
A delay or overrun in the project schedule could negatively impact the Group’s profitability, cash flows, ability to repay project-specific indebtedness, asset carrying values, growth aspirations and relationships with key stakeholders.
Joint venture partners may hinder growth by not agreeing to support investment decisions. For non-managed operations, the decisions of the controlling partners may cause adverse impacts to the value of the Group’s interest in the operation or to its reputation and may expose it to unexpected financial liability.
Failure to manage our health, safety, environment or community risks could result in a catastrophic event or other long-term damage which could in turn harm the Group’s financial performance and licence to operate.
Recognised hazards and threats include, among others, underground operations, aviation, pit slope instability, tailings facilities, process safety, infrastructure, vector-borne and pandemic disease, chemicals, gases, vehicles and machinery, extreme natural environments, endangered flora or fauna, areas of cultural heritage significance, water supply stress and climate change.
– Continue focus on HSEC as a core priority at all operations, and projects, overseen by the Sustainability Committee.
– Clearly define and ensure compliance with Group HSEC strategy, policy and performance standards.
– Regularly review and audit HSEC processes, training and controls to promote and improve effectiveness, at managed and (where practicable) non-managed operations.
– Monitor HSEC performance measurement metrics at the Group level monthly.– Report, investigate and share learnings from HSEC incidents. – Build safety targets into personal performance metrics to incentivise safe
behaviour and effective risk management (see Remuneration Implementation Report).
– Develop mutually beneficial partnerships with local communities and establish appropriate social performance targets.
– Report annually on performance on greenhouse gas emissions, water, land use and rehabilitation, among others.
– Focus on fatality elimination through implementation of a programme to verify safety risk controls.
A failure to discover new viable orebodies could undermine future growth prospects.
The risk that new information comes to light or operating conditions change means that the economic viability of some ore reserves and mine plans can be restated downwards. As a result, projects may be less successful and of shorter duration than initially anticipated, and/or the asset value may be impaired.
– Comply with the Group’s resources and reserves standard. – Recruit and retain skilled and experienced exploration and evaluation personnel.– Provide stable funding for exploration activities. – Continually review the prospectivity of opportunities in the exploration
portfolio and prioritise spend accordingly. – Utilise new technologies where appropriate. – Develop, leverage and manage third-party partnerships. – Coordinate orebody knowledge through active Group-wide leadership forum.

24 riotinto.com Strategic report 2017
Strategic report Governance report Financial statements Production, reserves and operations Additional information
24
Inherent risk and uncertainty
Risk exposure 2017 trend
Potential impact on viability, HSEC and reputation
Potential upside impact (opportunities)
Operations, projects and people risks
Rio Tinto seeks to achieve operational and commercial excellence, and to attract and retain the best people in the industry.
Operational excellence is derived from high operational and human productivity, which requires quality people, processes and systems.
▬ – Future performance – Liquidity – HSEC – Group reputation
Improved productivity and innovation from new systems can decrease costs and increase output, delivering additional cash flow.
Development and retention of talent enhances productivity, financial and HSEC outcomes.
Attracting and retaining talent as the company and industry evolves presents a constant challenge.
▲
– Business model – Future performance – Group reputation
Leveraging the evolving company and market to attract a diverse and engaged workforce will deliver a competitive advantage to the Group.
Stakeholder risks
Rio Tinto recognises positive engagement with a range of stakeholders, and seeks to develop collaborative and mutually beneficial partnerships though our “partner to operate” strategy.
The Group’s operations are located across a number of jurisdictions, which exposes the Group to a wide range of economic, political, societal and regulatory environments.
▲ – Business model – Future performance – Group reputation
Proactive engagement with governments, communities and other stakeholders can increase access to new resources, support stable and predictable investment frameworks and operational environments, and shape mutually beneficial policies and legal/regulatory frameworks.
Governance risks
Rio Tinto employees operate in compliance with The way we work – our global code of business conduct, the Group delegation of authorities and all Group policies, standards and procedures.
The Group’s reputation and regulatory licences are dependent upon appropriate business conduct and are threatened by a public allegation of potential misbehaviour or by regulatory investigation.
▬ – Business model – Future performance – Group reputation
Good corporate citizens are acknowledged to operate to a high ethical standard, thus attracting talent and securing access to resources and investment opportunities.

25Strategic report 2017 riotinto.com
STRA
TEGIC
REP
OR
T
Strategic report Governance report Financial statements Production, reserves and operations Additional information
25
Potential downside impact (threats) Mitigating actions include:
Business interruption may arise from a number of circumstances, including: – Operational difficulties such as extended industrial dispute,
delayed development, bottlenecks or interruptions to infrastructure for power, water and transportation, throughout the value chain.
– Operational failure such as a process safety incident, major pit slope, dump or tailings/water impoundment failure, underground incident.
– Cyber breach/incident of commercial and operational systems. – Natural disasters such as earthquakes, subsidence, drought,
flood, fire and storm can impact mines, smelters, refineries and infrastructure installations. Some of these risks are likely to increase through the impact of climate change.
Any of these events could result in a significant HSEC incident, an interruption to operations, or the inability to deliver products and a commercial loss.
– Preserve geographically diverse portfolio, limiting physical events/disruptions to a specific business, single infrastructure or logistical event.
– Comply with slope geotechnical, tailings management, underground mining and process safety technical and safety standards, supported by subject matter experts and audit protocols, reducing the risk (likelihood and consequence) of operational failure.
– Comply with the Acceptable use of information and electronic resources standard, supported by periodic reviews of IT infrastructure and security controls by dedicated (in-house) cyber-security team.
– Operate under strong human resources and employee relations framework. – Undertake business resilience planning and preparedness exercises for
execution of plans, across all operations.
For certain risks involving higher-value losses the Group purchases insurance. Risks not transferred to the external insurance market are retained within the business.
The inability to attract or retain key talent will constrain the Group’s ability to reach its goals within planned timeframes.
Improve HR processes in recruitment, development and leadership training. – Continue employee engagement programme and metrics, to enhance
engagement. – Enhance focus on inclusion and diversity, at all levels of the Group. – Refresh Group purpose and values statements.
Adverse actions by governments and others can result in operational/project delays or loss of licence to operate. Other potential actions can include expropriation, changes in taxation, and export or foreign investment restrictions, which may threaten the investment proposition, title, or carrying value of assets. Legal frameworks with respect to policies such as energy, climate change and mineral law may also change in a way that increases costs.
– Shape governance structures to ensure appropriate influence and engagement.
– Participate in strategic partnerships or financing structures to moderate political risk.
– Maintain geographically diverse portfolio to reduce concentration of exposure to changes in the particular locations.
– Monitor jurisdictional, including sovereign, risks and take appropriate action. – Develop long-term relationships with a range of international and national
stakeholders. – Comply with Group policies and standards which provide guidance concerning
risk management, human rights, cyber threat, data privacy, business integrity and external communications.
Fines may be imposed against Group companies for breaching antitrust rules, anti-corruption legislation, sanctions or human rights violations or for other inappropriate business conduct.
A serious allegation or formal investigation by increasingly connected regulatory authorities (regardless of ultimate finding) could result in a loss in share price value, and/or loss of business. Other consequences could include the criminal prosecution of individuals, imprisonment and/or personal fines, and fines, legal liabilities and reputational damage to the Group. There may also be considerable cost and disruption in responding to allegations or investigations and related litigation, and in taking remedial action.
– Identify and meet our regulatory obligations and respond to emerging requirements.
– Comply with Group policies, standards and procedures that provide guidance to our businesses and drive compliance with regulatory obligations.
– Dedicate legal and compliance teams to assist Group businesses in complying with regulatory obligations and internal standards and procedures.
– Maintain appropriate oversight and reporting, supported by training and awareness, to drive compliance with regulatory obligations.
– Continue to develop and deploy training across relevant sectors of the workforce.
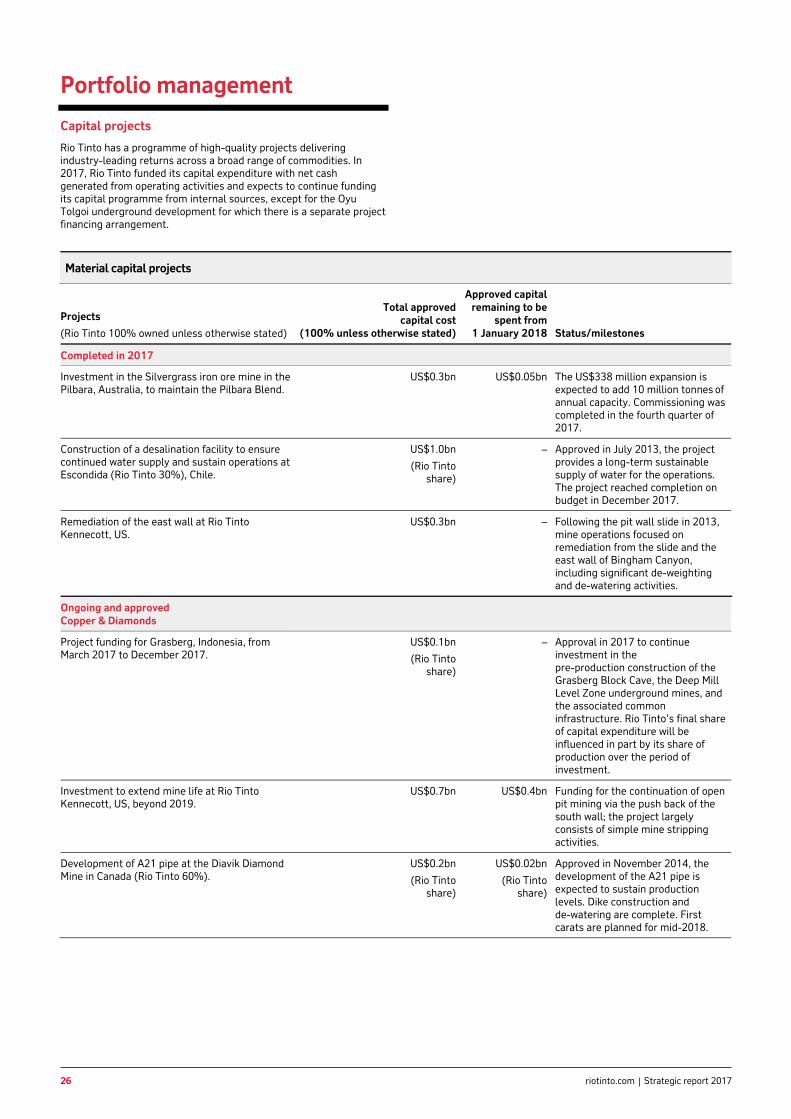
26 riotinto.com Strategic report 2017
Strategic report Governance report Financial statements Production, reserves and operations Additional information
26
Portfolio management
Capital projects
Rio Tinto has a programme of high-quality projects delivering industry-leading returns across a broad range of commodities. In 2017, Rio Tinto funded its capital expenditure with net cash generated from operating activities and expects to continue funding its capital programme from internal sources, except for the Oyu Tolgoi underground development for which there is a separate project financing arrangement.
Material capital projects
Projects
(Rio Tinto 100% owned unless otherwise stated)
Total approvedcapital cost
(100% unless otherwise stated)
Approved capital remaining to be
spent from1 January 2018
Status/milestones
Completed in 2017
Investment in the Silvergrass iron ore mine in the Pilbara, Australia, to maintain the Pilbara Blend.
US$0.3bn US$0.05bn The US$338 million expansion is expected to add 10 million tonnes of annual capacity. Commissioning was completed in the fourth quarter of 2017.
Construction of a desalination facility to ensure continued water supply and sustain operations at Escondida (Rio Tinto 30%), Chile.
US$1.0bn
(Rio Tinto share)
– Approved in July 2013, the project provides a long-term sustainable supply of water for the operations. The project reached completion on budget in December 2017.
Remediation of the east wall at Rio Tinto Kennecott, US.
US$0.3bn – Following the pit wall slide in 2013, mine operations focused on remediation from the slide and the east wall of Bingham Canyon, including significant de-weighting and de-watering activities.
Ongoing and approved Copper & Diamonds
Project funding for Grasberg, Indonesia, from March 2017 to December 2017.
US$0.1bn
(Rio Tinto share)
– Approval in 2017 to continue investment in the pre-production construction of the Grasberg Block Cave, the Deep Mill Level Zone underground mines, and the associated common infrastructure. Rio Tinto’s final share of capital expenditure will be influenced in part by its share of production over the period of investment.
Investment to extend mine life at Rio Tinto Kennecott, US, beyond 2019.
US$0.7bn US$0.4bn Funding for the continuation of open pit mining via the push back of the south wall; the project largely consists of simple mine stripping activities.
Development of A21 pipe at the Diavik Diamond Mine in Canada (Rio Tinto 60%).
US$0.2bn
(Rio Tinto share)
US$0.02bn
(Rio Tintoshare)
Approved in November 2014, the development of the A21 pipe is expected to sustain production levels. Dike construction and de-watering are complete. First carats are planned for mid-2018.

27Strategic report 2017 riotinto.com
STRA
TEGIC
REP
OR
T
Governance report Financial statements Production, reserves and operations Additional information
27
Material capital projects continued
Projects
(Rio Tinto 100% owned unless otherwise stated)
Total approvedcapital cost
(100% unless otherwise stated)
Approved capital remaining to be
spent from1 January 2018
Status/milestones
Ongoing and approved
Copper & Diamonds continued
Development of the Oyu Tolgoi underground mine in Mongolia (Rio Tinto 34%), where average copper grades of 1.66 per cent are more than three times higher than the open pit.
US$5.3bn US$4.3bn The project was approved in May 2016. An annual project review was completed in the fourth quarter of 2017 and construction of the first drawbell is expected in mid-2020. Lateral development is on plan, Shaft 2 sinking is complete and Shaft 5 sinking is expected to be complete by the end of the first quarter of 2018.
Aluminium
Investment in the Amrun bauxite mine on the Cape York Peninsula in north Queensland, Australia, with a planned initial output of 22.8 million tonnes a year.
US$1.9bn US$1.1bn Approved in December 2015, the project is advancing to plan. Output includes an expected 10 million tonne increase in annual exports with production commencing in the first half of 2019.
Investment in the Compagnie des Bauxites de Guinée (CBG) bauxite mine to expand capacity from 14.5 to 18.5 million tonnes a year. Rio Tinto’s share of capex is US$0.3bn.
US$0.7bn US$0.3bn Approved in 2016. Financing completed in November 2016. First incremental shipment expected in the fourth quarter of 2018.
Material acquisitions and divestments
ConsiderationAsset US$m StatusDivested in 2017 Coal & Allied Industries Limited 2,690 (a) Sold to Yancoal Australia Limited Divested in 2016 Bengalla Joint Venture 617(a) Sold to New Hope Corporation Limited
Lochaber 410(a) Sold to SIMEC Divested in 2015 There were no material divestments completed in 2015. (a) Before working capital and completion adjustments.
There were no material acquisitions in 2017, 2016 or 2015.
Further information on acquisitions and divestments is included in note 37 to the financial statements

28 riotinto.com Strategic report 2017
Strategic report Governance report Financial statements Production, reserves and operations Additional information
28
Sustainable development
For 145 years, Rio Tinto has been pioneering the production of materials essential to human progress. The minerals and metals we produce play a vital role in a host of everyday items and innovative technologies that help make modern life work. We recognise that the work we do has the potential to affect people, communities and the environment, both positively and negatively. We work in partnership with those affected to minimise our negative impacts and to share the wealth and benefits our business creates over the short and long term.
Rio Tinto’s contribution to sustainable development underpins our commercial results, is consistent with our partner-to-operate approach and is integrated into our strategic positioning. It benefits our shareholders, joint venture partners, neighbouring communities, suppliers, customers, employees, governments and society.
We recognise that we can always improve and work in partnership to find smarter ways of operating. We participate in industry organisations, such as the International Council on Mining & Metals (ICMM), and global initiatives such as the Extractive Industries Transparency Initiative and the UN Global Compact. We promote change locally and set sustainability standards that reflect societal expectations and challenges. We also work with non-governmental organisations to better understand and meet our stakeholders’ needs.
Rio Tinto’s Sustainability Committee reviews the company’s approach for consistency with our purpose and values, for the effective management of material sustainability risks, and for our overall contribution to sustainable development. Further information on this committee can be found on page 68, in the Governance report.
Materiality
Every year we review the sustainability topics that matter most to our business and stakeholders. This helps focus our response and aligns our sustainability reporting with the Global Reporting Initiative (GRI) Standards.
In 2017, to prioritise our material topics, we combined feedback from our internal leaders and subject matter experts, and considered stakeholder expectations and an analysis of the external environment. The Sustainability Committee reviewed and approved this assessment.
Topics prioritised as being highly material are core to our sustainability performance and are described below. Topics prioritised as material that could have localised or moderate impacts on our sustainability performance are described in our Sustainable development report.
A summary of our 2017 sustainability performance follows. Greater detail, including disclosure of performance metrics and the materiality assessment, is contained in our 2017 Sustainable development report, available at riotinto.com/sd2017.
Performance overview
In 2017, two employees lost their lives whilst working at Rio Tinto. One employee lost his life while working at our Rio Tinto Kennecott smelter in Utah, and there was a health-related death of a colleague undertaking exploration activities in the Pilbara, Australia. These tragedies are felt deeply across our company, by workmates, the local community, family and friends. They are further described on page 31. These incidents affect the way we view our sustainability performance and reinforces the importance of remaining focused on strong safety and health leadership, and the standards and procedures we live by every single shift and day. We believe that preventing all work-related fatalities is both achievable and essential for our business.
Our performance is assessed globally by external agencies. In 2017, Rio Tinto was again recognised by the Dow Jones Sustainability Index Metals & Mining Sustainability Leaders group and the FTSE4Good indices, and ranked in the top three in the 2017 Corporate Human Rights Benchmark.
We were also honoured in 2017 through the Canadian-American Business Council’s Corporate Leadership Award for our C$6.4 billion modernisation of the Kitimat aluminium smelter. The award recognises our innovation in producing some of the world’s lowest carbon aluminium, environmental benefits and our long-term partnership with the Kitimat community.
Other examples of our progress in 2017 – of finding smarter ways to deliver our programmes and improve our performance – include: – Launching the new Rio Tinto purpose and enhancing our company
values and global code of business conduct, The way we work, to set a strong sense of direction, increase employee engagement and attract future talent.
– Fully embedding critical risk management (CRM), our fatality prevention programme across more than 60 operational sites, and incorporating critical health fatality risks into CRM.
– Achieving our lowest all injury and lost time injury rates in our company history, although we did not meet the improvement in all injuries we were targeting.
– Introducing new fatigue risk management guidance. – Improving our major hazard standards that cover underground, slopes
and geotechnical, tailings and water storage risks. – Developing a new biodiversity protection and natural resource
management standard for introduction in 2018. – Reviewing and strengthening our approach to mine and facility
closure. – Achieving good progress against our climate target – 27 per cent
reduction in our greenhouse gas emissions intensity from 2008 – a 2 per cent improvement from 2016.
– Achieving a turnaround in our employee engagement score in the second half of 2017.
– Enabling 1,500 leaders to develop their leadership skills through a six-month development programme called Leading for Success.
– Exceeding our 20 per cent target for women in senior management. – Achieving strong gender (41 per cent female) and nationality
representation (29 per cent nationals from regions where we are developing new businesses) across our 2017 graduate intake.
– Introducing a new global minimum standard for paid parental leave. – Championing Australia’s White Ribbon (domestic violence) campaign,
publishing a guidance note for our Australian employees, providing awareness training and offering support to those affected by domestic violence.
– Celebrating 20 years of the Yandicoogina Agreement between Rio Tinto and the Gumala Aboriginal Corporation in the Pilbara.
– Launching our Talk to Peggy campaign to strengthen our Speak-OUT whistleblowing programme.
We reported no significant environmental incidents with a major or catastrophic impact. We paid US$89,502 in fines related to environmental compliance. Further information on the Group’s environmental regulation, including incidents and fines, is in the Directors’ report on page 109.
More information on our performance across each of the Rio Tinto product groups and Growth & Innovation can be found in further sections of this Annual report.

29Strategic report 2017 riotinto.com
STRA
TEGIC
REP
OR
T
Strategic report Governance report Financial statements Production, reserves and operations Additional information
29
Goals and targets
We set targets to communicate across the company the areas where we want to improve in sustainability performance and to stretch our thinking as to what is possible and acceptable. Our performance against these targets is summarised below. Actions to maintain or improve performance in these areas are described in the following pages. Further information on the risk framework we apply to identify these metrics can be found on pages 18 to 25.
Targets Outcomes in 2017
Our goal is zero harm, including, above all, the elimination of workplace fatalities.
Performance against this goal is measured by the number of fatalities and a year-on-year improvement in our all injury frequency rate (AIFR) per 200,000 hours worked.
One safety fatality and one health fatality at managed operations in 2017.
AIFR of 0.42, representing a five per cent improvement from 2016.
A year-on-year improvement in the rate of new cases of occupational illness per 10,000 employees annually.
43 per cent decrease in the rate of new cases of occupational illness compared with 2016.
By the end of 2018, all managed operations will be effectively controlling exposure to all identified critical fatality health risks by verifying that critical controls are controlling harmful exposure.
95 per cent of managed operations on track to achieve our target of verifying controls for critical fatality health risks. The remaining five per cent of operations are being provided additional assistance to implement the critical control verification process.
Our diversity goal is to employ people based on job requirements who represent the diversity of our surrounding communities.
We are targeting: – The increased representation of women in senior management
positions by two per cent year-on-year. – Women to represent 50 per cent of our 2017 graduate intake. – 30 per cent of our 2017 graduate intake to be nationals from regions
where we are developing new businesses.
Women represented 22.4 per cent of our senior management in 2017, up from 19.2 per cent in 2016.
Women represented 27.3 per cent of our Executive Committee in 2017.
Women represented 41 per cent of our 2017 graduate intake.
29 per cent of our 2017 graduate intake were nationals from regions where we are developing new businesses.
Women represented 18 per cent(a) of our total workforce.
From 2016, all operations will locally report on an annual basis, and by 2020 will demonstrably achieve: – Progress against a locally defined target that demonstrates the local
economic benefits of employment and procurement of goods and services.
– Effective capture and management of community complaints with year-on-year reduction in repeat and significant complaints.
42 per cent of managed operations are on track to meet their 2020 targets. The remaining operations are being provided additional assistance to resolve any barriers to achieving their targets.
24 per cent reduction in total greenhouse gas emissions intensity between 2008 and 2020.
We are on track to meet our 2020 target. Two per cent reduction in greenhouse gas emissions intensity in 2017 versus 2016.
All managed operations with material water risk will have achieved their approved local water performance targets by 2018.
77 per cent of managed operations are on track to meet their approved local water performance targets. Operations will continue to focus on material water risk and improving performance against their water targets during 2018.
(a) Gender distribution for our total workforce is based on managed operations (excludes non-managed operations and joint ventures) as of 31 December 2017. Less than one per cent of the workforce gender is undeclared.

30 riotinto.com Strategic report 2017
Governance report Financial statements Production, reserves and operations Additional information
30
Performance data A summary of our performance data is provided in the table below. The data are reported for calendar years and unless stated otherwise parameters are reported for all managed operations without adjustment for equity interests. Data relating to fatalities, all injury frequency rate and lost time injury frequency rate include all employee and contractor exposure hours and incidents. New cases of occupational illness are reported for employees only.
Data reported in previous years may be modified if verification processes detect material errors, or if changes are required to ensure comparability over time.
We have incorporated the requirements of the ten principles of the ICMM and the mandatory requirements set out in the ICMM position statements into our own policies, strategies and standards. We report in accordance with the GRI Standards and the requirements of other select reporting frameworks.
Further information on our data definitions, our reporting of GRI disclosure requirements and our alignment with the ICMM are available online at riotinto.com/sd2017.
Performance data 2013-2017 (a)
2017 2016 2015 2014 2013 Social Fatalities at managed operations from safety incidents 1 1 4 2 3 Fatalities at managed operations from health incidents 1 — — — — All injury frequency rate (per 200,000 hours worked) 0.42 0.44 0.44 0.59 0.65 Number of lost time injuries 199 206 220 381 500 Lost time injury frequency rate (per 200,000 hours worked) 0.25 0.26 0.25 0.37 0.42 New cases of occupational illness (per 10,000 employees) 27 47* 32* 17 16 Employees (number)(b) 47,000 51,000 55,000 60,000 66,000 Environment Greenhouse gas emissions intensity (indexed relative to 2008) 73.0 74.4* 79.7 81.7 83.2 Total energy use (petajoules) 439 458* 433 450 484 Freshwater used (billion litres) 465 467 460 465 436 Land footprint – disturbed (square kilometres) 3,616 3,696 3,629 3,592 3,556 Land footprint – rehabilitated (square kilometres) 497 541 533 502 472 Direct economic contribution Value add (US$ million)(d)(e) 27,734 20,065* 18,888 29,178 31,818 Payments to suppliers (US$ million)(d) 14,123 15,253* 17,896 21,370 26,054 Community contributions (US$ million) 176 168* 187* 264 332
(a) Data reported in previous years may be modified if verification processes detect material errors, or if changes are required to ensure comparability over time. Wherever possible, data for operations acquired prior to 1 October of the reporting period are included. Divested operations are included in data collection processes up until the transfer of management control.
(b) These figures include the Group’s share of joint ventures and associates (rounded to the nearest thousand). (c) The land footprint refers to the total inventory as of 31 December 2017. (d) These figures include the Group’s share of joint ventures and associates. (e) Value add is the sum of labour, payables to governments, returns on capital invested in operations and non-government payments. This figure includes the community
contribution total for the calendar year. * Numbers restated from those originally published to ensure comparability over time.
2018 priorities Our 2018 priorities for improving our sustainable development performance are to:
– Maintain momentum of the CRM programme and achieve our first fatality-free year.
– Collaborate with our contractors and joint venture partners to improve safety, health and environmental performance at both our managed and non-managed sites.
– Simplify our critical safety tools to make it easier for our workers to stay safe and be productive.
– Continue implementation of mental health and wellbeing initiatives. – Continue implementation of the global minimum standard for paid
parental leave for all our employees. – Extend the domestic violence support provided for employees in
Australia and New Zealand to other countries. – Continue the Leading for Success programme, such that all 6,500
leaders will participate by the end of 2018. – Continue to implement measures that increase the representation of
women in the workforce. – Improve our understanding and management of the resilience of our
portfolio and of our physical assets to climate change risks in a two degrees Celsius temperature increase scenario.
– Continue to embed our standards for process safety, underground safety, slopes and geotechnical, tailings and water storage facilities, and implement the new biodiversity protection and natural resource management standard.
– Establish organisation and performance indicators to support our operations to de-risk their future closure liabilities and to manage the closure of mines and facilities at the end of their economic life efficiently and responsibly.
– Develop, with the ICMM, new corrosivity tests for the safe bulk shipping of our products.
– Continue development of third party due diligence processes relating to suppliers and customers, and monitoring of our business integrity compliance.
– Improve the local employment and procurement content in our neighbouring communities.
– Improve human rights components of incident reporting, risk and impact assessments and complaints handling.
– Establish new water and health performance targets beyond 2018.
Our people Safety and health The safety and health of our people, contractors and suppliers is Rio Tinto’s top priority, one of our core values and an essential component to our sustainable development performance. We work to create a safe and healthy environment through visible and caring leadership, strong systems and verifications of critical controls. We believe all incidents that impact safety and health are preventable, and in partnerships across teams and contractors, we can raise our performance and promote wellbeing.
Our approach to safety and health is centred on eliminating fatalities and disabling injury or occupational illness, avoidance of major hazard risk events, and reduction in occupational illness and injury. Guided by our safety and health standards, we identify emerging issues and key risks, and apply and assure controls.
We introduced CRM in 2015 and it continues to be crucial to the elimination of fatalities. In 2017, we maintained the quantity of critical control verifications, while focusing on quality and coverage. As a complement, we explored our understanding of human behaviour to

31Strategic report 2017 riotinto.com
STRA
TEGIC
REP
OR
T
Strategic report Governance report Financial statements Production, reserves and operations Additional information
31
reduce human error. In 2017, over 1.4 million critical control verifications were completed. We added three critical health fatality risks to our existing 22 safety fatality risks to prevent harmful health exposures to the workforce. The three risks are thermal extremes, hazardous substances (chronic) and malaria.
Major hazard risks are characterised as low probability, high consequence events. These risks are managed through standards, detailed analysis and external reviews, which are overseen by our Major Hazard Risk Management Steering Committee. During 2017, we updated our standards and processes for underground safety, slopes and geotechnical, tailings and water storage facilities. A governance framework was also established.
Identification and verification of critical controls is a key aspect of managing process safety risk. In 2017, the Rio Tinto Investment Committee approved capital projects to mitigate process safety risks to people in occupied buildings, such as installing detection and protection technology, and replacing chlorine metal treatment units with new units that remove the use of chlorine.
In October, we experienced one fatality when an employee was exposed to sulphur dioxide while working near the flash smelting furnace at our Rio Tinto Kennecott copper smelter in Utah. At our Bell Bay smelter in Tasmania, an employee suffered severe burns from contact with molten material, causing a disabling injury. There was an explosion at our Sorel-Tracey metallurgical complex in Canada, in which no one was injured, but which resulted in a serious interruption to production.
In October, there was a health-related death of an employee conducting exploration activities. Our focus on fitness for work and wellness will continue and ongoing investigations will consider all lessons learned from this tragedy.
These tragedies continue to impact family, friends, workmates and their local communities. The business provided immediate support and counselling services and continues to do so. We complete full investigations as part of the process and share the learnings across Rio Tinto to seek to prevent incidents like these being repeated. These incidents reinforce our commitment to learn from our fatal and nearly fatal incidents. The ongoing focus on our learning critical lessons programme is designed to eliminate repeat incidents.
During 2017, we started to simplify the tools and systems used in operational tasks to ensure safe outcomes. We are doing this to enable our workforce to complete their work more efficiently and safely. We are strengthening controls by continual evaluation of information provided to leaders, which is an improvement on our site assurance process.
Mental health is a societal issue that impacts some of our employees and their families. In 2017, we established a Group-wide cross-functional wellbeing steering committee to update our wellbeing strategy and improve mental health management. We produced a series of videos and online learning modules to support awareness training for supervisors and employees, and continued to provide employee assistance programmes across our operations.
Fatigue is a critical risk in operations, projects and business travellers and during 2017 we introduced fatigue risk management guidance, produced a series of fatigue awareness videos and established a fatigue technology group. In conjunction with the Central Queensland University in Australia and the University of Witwatersrand in South Africa, we studied beliefs and attitudes about fatigue across sites in Africa and Australia. The study to date has confirmed effective practices and identified improvement opportunities such as risk identification and mitigation, and training.
The rate of new cases of occupational illness decreased by 43 per cent from 2016. This is due to an increased focus on health and partially attributed to a reduction of previously unreported historic noise-induced hearing loss (NIHL) cases. The main types of occupational illnesses in 2017 were musculoskeletal disorders (28 per cent), NIHL (36 per cent), and stress (19 per cent).
We continued to work with local governments and health organisations to ensure effective education in, control of and where necessary, treatment of our employees, contractors and communities surrounding our operations for vector-borne and infectious diseases such as tuberculosis, Ebola, malaria, plague, HIV/AIDS and Zika virus.
During 2017, we completed the first phase of the epidemiological study of the workforce at the Rössing uranium mine in Namibia. The objective of the study is to improve understanding of possible health effects from mine-related radiation exposure.
Employee relations Our approach to working with our people is centred on building and enabling a highly capable, high-performing, engaged and inclusive business. We understand the relationship between employee engagement, the health and safety of our employees, and productivity. We also want to be an attractive and competitive employer of choice.
We value the strength that a diverse workforce and an inclusive culture bring to our business. We employ people on the basis of job requirements and we do not discriminate on grounds of age, ethnic or social origin, gender, sexual orientation, politics, religion, disability or any other status. We do not employ forced, bonded or child labour. We employ people with disabilities and make considerable efforts to offer suitable alternative employment and retraining to employees who become disabled and can no longer perform their regular duties.
In 2017, we reset our employee relations focus. Our people survey indicates that while we have made progress we still have work to do to improve employee satisfaction and continue to make Rio Tinto a better place to work. The results in the second half of the year show improvement as a result of our work to simplify core processes, strengthen engagement and develop our people.
During the year, we introduced a new global minimum standard for paid parental leave, which is available to every employee regardless of their personal circumstances or location. We also produced a package to protect and support families affected by family and domestic violence, and are in the process of obtaining Australia’s White Ribbon accreditation.
We continue to focus on meeting our objectives for workforce diversity. We continue to increase the gender balance in senior management positions by creating opportunities at this level and partnering with recruitment agencies to increase the female employee pipeline and talent pool. During the year we worked on diversity targets to be introduced in 2018. We target 50 per cent representation of women in our graduate intake. Further information on inclusion and diversity can be found on page 36.
During 2017, we launched several leadership signature programmes to develop and recognise leaders. Over 100 participants from frontline to senior leader levels were selected to develop their global leadership and networking skills over a 12-month period. Supported by an executive sponsor, participants are also taught by other leaders and exposed to an internationally recognised business faculty.
More broadly, over 1,500 leaders across Australia, Canada, China, Mongolia, South Africa, the UK and the US completed a six-month Leading for Success programme and developed core leadership capabilities.
We recognise the right of all employees to choose to belong to a union and seek to bargain collectively. During the year, we successfully negotiated enterprise agreements at Rio Tinto Kennecott, Kitimat, Havre-Saint-Pierre and Gove Aluminium, and with the European Works Council. In France, agreements with unions were reached regarding salary policy, profit sharing and healthcare benefits. We also continued dialogue with union representatives at Richards Bay Minerals, QIT Madagascar Minerals and Rössing Uranium operations.
We remain one of the largest private sector employers of Indigenous Australians, with over 1,431 full time Indigenous employees who represented approximately eight per cent of our Australian employees in 2017.
In 2017, we employed 47,000 people, including the Group’s share of joint ventures and associates in around 35 countries. Of these, approximately 25,000 were located in Australasia, 14,000 in North America, 5,000 in Africa, 2,000 in Europe, and 1,000 in Central and South America. See page 207 for a breakdown of employees by business units.
Communities and regional development Our approach to Communities and Social Performance (CSP) is to establish relationships with host communities founded on trust and mutual respect. Using our local knowledge, we engage with communities and develop programmes that reflect mutually agreed priorities. Our CSP standard and
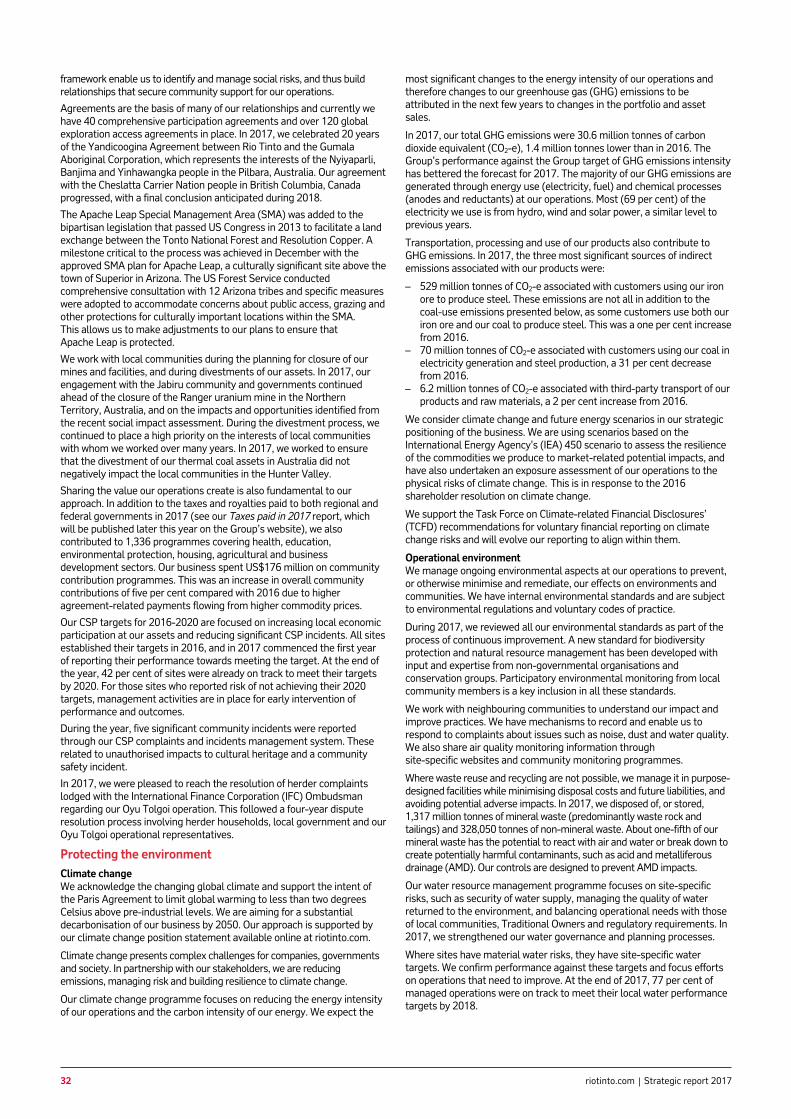
32 riotinto.com Strategic report 2017
Strategic report Governance report Financial statements Production, reserves and operations Additional information
32
framework enable us to identify and manage social risks, and thus build relationships that secure community support for our operations.
Agreements are the basis of many of our relationships and currently we have 40 comprehensive participation agreements and over 120 global exploration access agreements in place. In 2017, we celebrated 20 years of the Yandicoogina Agreement between Rio Tinto and the Gumala Aboriginal Corporation, which represents the interests of the Nyiyaparli, Banjima and Yinhawangka people in the Pilbara, Australia. Our agreement with the Cheslatta Carrier Nation people in British Columbia, Canada progressed, with a final conclusion anticipated during 2018.
The Apache Leap Special Management Area (SMA) was added to the bipartisan legislation that passed US Congress in 2013 to facilitate a land exchange between the Tonto National Forest and Resolution Copper. A milestone critical to the process was achieved in December with the approved SMA plan for Apache Leap, a culturally significant site above the town of Superior in Arizona. The US Forest Service conducted comprehensive consultation with 12 Arizona tribes and specific measures were adopted to accommodate concerns about public access, grazing and other protections for culturally important locations within the SMA. This allows us to make adjustments to our plans to ensure that Apache Leap is protected.
We work with local communities during the planning for closure of our mines and facilities, and during divestments of our assets. In 2017, our engagement with the Jabiru community and governments continued ahead of the closure of the Ranger uranium mine in the Northern Territory, Australia, and on the impacts and opportunities identified from the recent social impact assessment. During the divestment process, we continued to place a high priority on the interests of local communities with whom we worked over many years. In 2017, we worked to ensure that the divestment of our thermal coal assets in Australia did not negatively impact the local communities in the Hunter Valley.
Sharing the value our operations create is also fundamental to our approach. In addition to the taxes and royalties paid to both regional and federal governments in 2017 (see our Taxes paid in 2017 report, which will be published later this year on the Group’s website), we also contributed to 1,336 programmes covering health, education, environmental protection, housing, agricultural and business development sectors. Our business spent US$176 million on community contribution programmes. This was an increase in overall community contributions of five per cent compared with 2016 due to higher agreement-related payments flowing from higher commodity prices.
Our CSP targets for 2016-2020 are focused on increasing local economic participation at our assets and reducing significant CSP incidents. All sites established their targets in 2016, and in 2017 commenced the first year of reporting their performance towards meeting the target. At the end of the year, 42 per cent of sites were already on track to meet their targets by 2020. For those sites who reported risk of not achieving their 2020 targets, management activities are in place for early intervention of performance and outcomes.
During the year, five significant community incidents were reported through our CSP complaints and incidents management system. These related to unauthorised impacts to cultural heritage and a community safety incident.
In 2017, we were pleased to reach the resolution of herder complaints lodged with the International Finance Corporation (IFC) Ombudsman regarding our Oyu Tolgoi operation. This followed a four-year dispute resolution process involving herder households, local government and our Oyu Tolgoi operational representatives.
Protecting the environment Climate change We acknowledge the changing global climate and support the intent of the Paris Agreement to limit global warming to less than two degrees Celsius above pre-industrial levels. We are aiming for a substantial decarbonisation of our business by 2050. Our approach is supported by our climate change position statement available online at riotinto.com.
Climate change presents complex challenges for companies, governments and society. In partnership with our stakeholders, we are reducing emissions, managing risk and building resilience to climate change.
Our climate change programme focuses on reducing the energy intensity of our operations and the carbon intensity of our energy. We expect the
most significant changes to the energy intensity of our operations and therefore changes to our greenhouse gas (GHG) emissions to be attributed in the next few years to changes in the portfolio and asset sales.
In 2017, our total GHG emissions were 30.6 million tonnes of carbon dioxide equivalent (CO2-e), 1.4 million tonnes lower than in 2016. The Group's performance against the Group target of GHG emissions intensity has bettered the forecast for 2017. The majority of our GHG emissions are generated through energy use (electricity, fuel) and chemical processes (anodes and reductants) at our operations. Most (69 per cent) of the electricity we use is from hydro, wind and solar power, a similar level to previous years.
Transportation, processing and use of our products also contribute to GHG emissions. In 2017, the three most significant sources of indirect emissions associated with our products were:
– 529 million tonnes of CO2-e associated with customers using our iron ore to produce steel. These emissions are not all in addition to the coal-use emissions presented below, as some customers use both our iron ore and our coal to produce steel. This was a one per cent increase from 2016.
– 70 million tonnes of CO2-e associated with customers using our coal in electricity generation and steel production, a 31 per cent decrease from 2016.
– 6.2 million tonnes of CO2-e associated with third-party transport of our products and raw materials, a 2 per cent increase from 2016.
We consider climate change and future energy scenarios in our strategic positioning of the business. We are using scenarios based on the International Energy Agency's (IEA) 450 scenario to assess the resilience of the commodities we produce to market-related potential impacts, and have also undertaken an exposure assessment of our operations to the physical risks of climate change. This is in response to the 2016 shareholder resolution on climate change.
We support the Task Force on Climate-related Financial Disclosures’ (TCFD) recommendations for voluntary financial reporting on climate change risks and will evolve our reporting to align within them.
Operational environment We manage ongoing environmental aspects at our operations to prevent, or otherwise minimise and remediate, our effects on environments and communities. We have internal environmental standards and are subject to environmental regulations and voluntary codes of practice.
During 2017, we reviewed all our environmental standards as part of the process of continuous improvement. A new standard for biodiversity protection and natural resource management has been developed with input and expertise from non-governmental organisations and conservation groups. Participatory environmental monitoring from local community members is a key inclusion in all these standards.
We work with neighbouring communities to understand our impact and improve practices. We have mechanisms to record and enable us to respond to complaints about issues such as noise, dust and water quality. We also share air quality monitoring information through site-specific websites and community monitoring programmes.
Where waste reuse and recycling are not possible, we manage it in purpose-designed facilities while minimising disposal costs and future liabilities, and avoiding potential adverse impacts. In 2017, we disposed of, or stored, 1,317 million tonnes of mineral waste (predominantly waste rock and tailings) and 328,050 tonnes of non-mineral waste. About one-fifth of our mineral waste has the potential to react with air and water or break down to create potentially harmful contaminants, such as acid and metalliferous drainage (AMD). Our controls are designed to prevent AMD impacts.
Our water resource management programme focuses on site-specific risks, such as security of water supply, managing the quality of water returned to the environment, and balancing operational needs with those of local communities, Traditional Owners and regulatory requirements. In 2017, we strengthened our water governance and planning processes.
Where sites have material water risks, they have site-specific water targets. We confirm performance against these targets and focus efforts on operations that need to improve. At the end of 2017, 77 per cent of managed operations were on track to meet their local water performance targets by 2018.

33Strategic report 2017 riotinto.com
STRA
TEGIC
REP
OR
T
Strategic report Governance report Financial statements Production, reserves and operations Additional information
33
Management of tailings and structures We operate tailings and large water storage facilities at 30 sites and have closed impoundments that we monitor at eight sites.
We continue to review and audit facilities (including independent external reviews) to ensure that practices at all managed tailings and major water storage facilities conform to our Management of tailings and water storage facilities standard. We align our approach to the ICMM position statement on tailings management. Assurance over these storage facilities by internal and independent third-party reviews remains a focus. We also work with our joint venture partners to minimise the environmental and social impacts and risks associated with tailings management at our non-managed operations.
During 2017, we improved our tailings governance and data reporting processes and we completed detailed analyses of practices at �ve operations. From these analyses we will adopt further improvements in 2018.
We are working with mining and metals industry peers to better understand and implement best practices to manage risks associated with tailings and water storage facilities. We are collaborating on two research projects led by the University of Western Australia to understand static liquefaction in mine tailings and the placement of �ltered tailings on top of conventional wet tailings.
Value chain
Sharing part of the wealth created from our operations with communities, regions and countries associated with our purchases, operations and sales provides long-term opportunities. Responsible supply practices are critical to our partner-to-operate approach, establishing sustainable supply chains for our customers and meeting expectations for greater transparency about our supply chain.
Our contributions include the payment of tax to local and national governments, dividends to shareholders, the direct and indirect employment we generate, procurement opportunities and investment in community programmes. The payments we make to our suppliers represent a signi�cant part of our global economic contribution. The �gures in this section include the Group’s share of joint ventures and associates.
Globally, the Group’s direct economic contribution was US$41.8 billion in 2017. This includes:
– US$27.7 billion in value add, made up of payments to employees, payables to governments and returns to capital.
– US$14.1 billion as payments to suppliers for goods and services.
Our capital investment was US$4.5 billion.
We are a major employer and tax contributor to local, state and national jurisdictions. We promote governance over the bene�ts of mining that �ow through to host communities and governments by being transparent in the payments we make and by providing local employment and procurement opportunities. Details of the payments (including corporate income tax, royalties and other taxes) we made to governments will be published in our Taxes paid in 2017 report, and made available online.
During 2017, we continued improvements to our Know your supplier procedure which establishes a process to understand legal, ethical and reputational risks arising from use of a supplier, and continued with our Supplier code of conduct. Both include human rights considerations. We also progressed work on third-party risk-based due diligence assessments on our commercial relationships.
Our local procurement practices aim to deliver bene�ts for communities, suppliers and businesses. In 2017, our Iron Ore business introduced a local procurement programme, including an online portal for local businesses to register their interest and view upcoming procurement opportunities.
During 2017, we of�cially opened Silvergrass, the 16th mine in our Pilbara iron ore operations, and continued to build the Amrun bauxite project and the underground copper mine expansion at Oyu Tolgoi. These growth developments enable us to continue sharing wealth and opportunities. Details of these and other developments can be found in the product groups and Growth & Innovation pages of this Annual report.
Governance Business integrity We are �rmly committed to operating with integrity and being accountable for our actions. The key principles that guide our behaviour in The way we work are supported by standards that cover antitrust, bribery and corruption, con�icts of interest, bene�ts, sponsorships and donations, data privacy, fraud and third-party due diligence. All these are reinforced annually through workforce training both online and face to face. In 2017, we launched our new company purpose and promoted the values of safety, teamwork, respect, integrity and excellence. This was supported by face-to-face sessions using real scenarios to promote discussion and understanding.
We maintain a strict stance against bribery and corruption, which is prohibited in all forms. Any Rio Tinto employee found to be not complying with anti-bribery and anti-corruption laws will face disciplinary action, up to and including termination. Details of regulatory matters can be found on page 50 in the chairman’s governance review of this Annual report.
Our business integrity compliance programme is aligned with the risk-based approach included in our business integrity standard. Our training programme and materials are updated to ensure they remain engaging and relevant to the risks employees encounter. During 2017, we provided additional training to targeted audiences on speci�c areas of our programme.
Speak-OUT, the Group’s con�dential and independently operated whistleblowing programme, enables employees, suppliers, contractors and community members to report anonymously, subject to local law, any signi�cant concerns about the business, or behaviour of individuals.
We are committed to a culture of transparency and encourage employees to speak up about their issues and concerns, whether through their management, human resources team or through Speak-OUT.
As part of our efforts to continually improve our Speak-OUT programme, we launched our Talk to Peggy campaign during 2017. The campaign gives Speak-OUT a human face that engenders trust and con�dence that reports are taken seriously and we respond to the facts. This is helping us to create a safe environment in which to report.
We have also centralised our reporter management process and improved engagement with whistleblowers through regular and personalised contact. This has resulted in better quality of investigations and improvement in case cycle time.
These actions have contributed to an increase in reporting rate and changed the feedback received from reporters, from negative and demonstrating lack of con�dence in the process, to positive, including reporters interacting more openly with investigators. We are also seeing employees raising concerns face to face, outside of the hotline, as well as using Speak-OUT to seek advice on an emerging issue.
In 2017, 712 incidents were reported through Speak-OUT, compliance managers or management, representing an increase of approximately six per cent on last year. The increase is mainly due to a higher volume of incidents raised outside of the hotline. Thirty-three per cent of cases raised this year were substantiated, resulting in corrective and preventative actions, representing an increase of seven points on 2016. These include business integrity issues in general, but also issues relating to safety violations, environmental procedures, human rights, �nancial reporting, harassment and bullying, and retaliation for reporting.
We remain dedicated to open and transparent dealings with our stakeholders. Information on the Group’s operational, �nancial and sustainable development performance is issued on time through a number of channels, such as media releases and regulatory �lings. We communicate views to governments and others on matters affecting our business interests.

34 riotinto.com Strategic report 2017
Strategic report Governance report Financial statements Production, reserves and operations Additional information
34
Respecting human rights Wherever we operate, we respect and support human rights consistent with the Universal Declaration of Human Rights. We have a human rights policy and procedures and have made voluntary commitments to the OECD Guidelines for Multinational Enterprises, the UN Global Compact and the Voluntary Principles on Security and Human Rights (VPSHR). Our human rights approach is consistent with the United Nations Guiding Principles on Business and Human Rights (UNGPs). Where our standards and procedures are stricter than local laws, we apply our own standards.
Our most salient human rights issues include those relating to security, land access and resettlement, Indigenous people’s rights including cultural heritage, environment including access to water, labour rights and in-migration-related impacts on local communities such as access to health services.
In 2017, we engaged investors, civil society and community members on land access, cultural heritage, environment, labour rights, and modern slavery issues.
We undertake due diligence activities in line with the UNGPs to identify, prevent and mitigate adverse human rights impacts of our operations. Human rights considerations are included in our social risk analysis and impact assessment processes. We conduct human rights studies and programmes at high-risk sites when required. In 2017, all employees were required to complete business integrity training including a human rights module. Training sessions on modern slavery were also conducted on a targeted basis with our procurement, ethics and compliance teams.
To support our Communities and Social Performance target for 2016-2020, operations collect data on the effective capture and management of community complaints. All operations are required to have a complaints, disputes and grievance mechanism in line with the effectiveness criteria for operational-level grievance mechanisms in the UNGPs. We strive for the free, prior and informed consent of Indigenous communities as defined in the 2012 International Finance Corporation Performance Standard 7 and the ICMM position statement on Indigenous Peoples and Mining.
In 2017, we progressed a pilot embedding human rights considerations in tender documentation for major construction projects. We have further included human rights into our risk and incident management framework.
We publish our annual slavery and human trafficking statement in compliance with the UK Modern Slavery Act 2015, which outlines the steps taken during the year to ensure that slavery and human trafficking are not taking place in any of our operations or supply chains. The statement is published online at riotinto.com. In 2017, Rio Tinto made a formal submission to the Australian Parliament’s Joint Standing Committee on Foreign Affairs, Defence and Trade regarding its inquiry into establishing a Modern Slavery Act in Australia. Further information on Rio Tinto’s support of the introduction can also be found on riotinto.com.
We provide training for security personnel and conduct security and human rights analysis in support of our security arrangements. Our online VPSHR training is mandatory for all security personnel at high-risk sites and elsewhere it is strongly recommended. During the year, we conducted VPSHR and use-of-force training at five of our locations in South Africa, Madagascar, Namibia and Jamaica. As a participant in the Voluntary Principles Initiative we also contributed to the design of a VPSHR training package for private security personnel and public security forces.
Closure The metals and mining industry is entering a new stage in its life cycle, with Rio Tinto and many of our peers developing detailed planning to enable the closure of a number of large operations over the next decade. Rio Tinto’s planning and cost provisioning for closure of mines and facilities starts during project development and extends across the asset life cycle to ensure that post-closure outcomes are achievable and that impacts and risks are minimised. The work is governed by our Closure Steering Committee.
During 2017, we reviewed our closure strategy so that our approach to closure is consistent and effective across the full life of each asset. A result of the review is the establishment of a dedicated centralised closure group to support our businesses and sites to manage closure activities across the life of all assets and to manage post-production decommissioning and deconstruction, rehabilitation, remediation and any long-term management obligations.
We work with local communities and regulators to evaluate potential post-closure land uses and develop closure objectives. During 2017, we continued detailed closure planning for a number of large operations that will reach the end of their commercially viable life over the next ten years.
We manage a range of non-operational legacy sites, including those inherited through acquisitions and mergers. During 2017, 11 of the sites progressed to the point where we can relinquish them.
In many jurisdictions we maintain long-term responsibility for monitoring and managing closed sites. We are also learning from the commitments and expectations associated with operations we have relinquished. During 2017, we conducted a post investment review of the Holden mine remediation in Washington State, US and are now applying the lessons learned when planning future closures.
In many jurisdictions where we operate, regulatory frameworks for large mine closure remain undeveloped or untested. In collaboration with our peers, we are improving our understanding of opportunities, seeking solutions to challenges and engaging governments to establish good closure policies and regulations.
We aim to progressively rehabilitate land as we operate an asset. In 2017, 25 per cent of our disturbed land (excluding land disturbed for hydroelectricity dams) had been rehabilitated.
Non-managed operations and arrangements We hold interests in companies and joint ventures we do not manage, across a range of commodities, the two largest being the Grasberg copper-gold mine in Indonesia and the Escondida copper mine in Chile. Details of other non-managed joint ventures are included in the Production, reserves and operations section on page 223.
We actively engage with our partners in these larger joint ventures through formal governance structures and technical exchanges to learn and improve performance. We endeavour to ensure that the principles in The way we work are applied and we encourage our partners to embed a strong safety, security and human rights culture in their workforces.
PT Freeport Indonesia (PTFI), a subsidiary of Freeport-McMoRan, Inc., owns and operates the Grasberg mine. We have a joint venture interest attributable to the 1995 mine expansion. We engage with PTFI through five forums: the Operating, Technical, Exploration and Sustainable Development committees, and the Tailings Management board.
The largest of these, the multidisciplinary Technical Committee, enables discussion of joint venture activities such as environmental management, orebody knowledge, project execution, worker health and safety, communities, mine planning, processing and tailings management. Rio Tinto is represented by a senior environmental manager on the PTFI tailings management board, which meets twice a year at Grasberg and includes third-party experts. A Rio Tinto senior safety professional based in Indonesia also works closely with PTFI on issues of strategic significance such as fatality prevention programmes.
Rio Tinto has a 30 per cent interest in Escondida, which is managed by BHP Billiton. Our seats on the Owners’ Council enable us to give regular input on strategic and policy matters. During 2017, construction of the Escondida Water Supply desalination project was completed, and the system became fully operational. By utilising seawater, the plant will significantly reduce demand on fresh groundwater resources around the mine which is located in an extremely arid climate.
Tragically, there were three fatalities at the operations of our non-managed joint arrangements in 2017. Two fatalities occurred at PTFI: one contractor died in a landslide resulting from heavy rains and flash flooding; and one contract employee died when preparing a mine area for production activities. One employee working at the Alumar alumina refinery in Brazil died from burns while working on a washer tank in the refinery. Rio Tinto has a 10 per cent interest in Alumar, which is managed by Alcoa.
We continue to work with our partners to share fatality prevention initiatives, including CRM and learning critical lessons, to ensure the circumstances leading to incidents are not repeated. The exchange is two-way, as we learn from their efforts as well.
Assurance We engaged an independent external assurance organisation, PricewaterhouseCoopers, to provide the directors of Rio Tinto with assurance on selected sustainable development subject matters, as explained on page 35.
PricewaterhouseCoopers’ assurance statement satisfies the requirements of subject matters 1 to 4 of the ICMM assurance procedure.
Further information on external auditors and internal assurance is included in the Governance report on pages 65 and 66.

35Strategic report 2017 riotinto.com
STRA
TEGIC
REP
OR
T
Strategic report Governance report Financial statements Production, reserves and operations Additional information
35
Independent limited assurance report
What we found Based on the work described below, nothing has come to our attention that causes us to believe that the selected subject matter for the year ended 31 December 2017 has not been prepared, in all material respects, in accordance with the Reporting criteria.
To the directors of Rio Tinto plc and Rio Tinto Limited (together Rio Tinto)
What we did Rio Tinto engaged us to perform a limited assurance engagement on the selected subject matter within the Sustainable development sections of the Rio Tinto 2017 Annual report and the Rio Tinto 2017 Strategic report for the year ended 31 December 2017.
Selected subject matter • Rio Tinto’s assertion that it has incorporated the requirements of the
10 sustainable development principles of the International Council on Mining and Metals (ICMM) and the mandatory requirements set out in ICMM Position Statements into its own policies.
• Rio Tinto’s assertions regarding the approach that it has adopted to identify and prioritise its material sustainable development risks and opportunities
• Rio Tinto’s assertions regarding the existence and status of implementation of systems and approaches used to manage the following selected sustainable development risk areas: • Safety • Greenhouse gas emissions • Energy use • Water management
• The following Rio Tinto performance data related to the selected sustainable development risk areas: • Number of fatalities • All injury frequency rate • Lost time injury frequency rate • Number of lost time injuries • Total greenhouse gas emissions • Greenhouse gas emissions intensity • Total energy use • Percentage of managed operations with material water risk
that are on track to achieving their approved local water performance targets
Reporting criteria The subject matter above has been assessed against the ICMM Sustainable Development Framework and the definitions and approaches within the Glossary which will be presented at www.riotinto.com/sd2017 as at 9 March 2018.
Our Independence and Quality Control We have complied with relevant ethical requirements related to assurance engagements, which are founded on fundamental principles of integrity, objectivity, professional competence and due care, confidentiality and professional behaviour.
The firm applies Auditing Standard ASQC 1 Quality Control for Firms that Perform Audits and Reviews of Financial Reports and Other Financial Information, Other Assurance Engagements and Related Services Engagements and accordingly maintains a comprehensive system of quality control including documented policies and procedures regarding compliance with ethical requirements, professional standards and applicable legal and regulatory requirements.
Responsibilities PricewaterhouseCoopers Our responsibility is to express a conclusion based on the work we performed.
Rio Tinto Rio Tinto management is responsible for the preparation and presentation of the selected subject matter in accordance with the Reporting criteria.
What our work involved We conducted our work in accordance with the International Standard on Assurance Engagements 3000 (Revised) Assurance Engagements Other than Audits or Reviews of Historical Financial Information and (for selected subject matter relating to greenhouse gas emissions) the International Standard on Assurance Engagements 3410 Assurance Engagements on Greenhouse Gas Statements. These Standards require that we comply with independence and ethical requirements and plan the engagement so that it will be performed effectively.
Main procedures performed • Making enquiries of relevant management of Rio Tinto regarding the
processes and controls for capturing, collating and reporting the performance data within the selected subject matter, and evaluating the design and effectiveness of these processes and controls
• Validating the operation of controls over the accuracy of injury classification and assessing the final injury classification applied for a sample of injuries reported during the year ended 31 December 2017
• Testing the arithmetic accuracy of a sample of calculations of performance data within the selected subject matter
• Assessing the appropriateness of the greenhouse gas emission factors applied in calculating the Total greenhouse gas emissions and Greenhouse gas emissions intensity
• Testing performance data, on a selective basis, substantively at both an operational and corporate level, which included testing at a selection of operations from across Aluminium, Copper & Diamonds, Energy & Minerals, and Iron Ore
• Undertaking analytical procedures over the performance data within the selected subject matter
• Making enquiries of relevant management and reviewing a sample of relevant management information and documentation supporting assertions made in the selected subject matter
We believe that the information we have obtained is sufficient and appropriate to provide a basis for our conclusion.
Liza Maimone PricewaterhouseCoopers Partner ABN 52 780 433 757 28 February 2018 Melbourne Liability limited by a scheme approved under Professional Standards Legislation
Inherent limitations Inherent limitations exist in all assurance engagements due to the selective testing of the information being examined. Therefore fraud, error or non-compliance may occur and not be detected. Additionally, non-financial data may be subject to more inherent limitations than financial data, given both its nature and the methods used for determining, calculating and sampling or estimating such data.
Restriction on use This report has been prepared in accordance with our engagement terms to assist Rio Tinto in reporting its sustainable development performance. We do not accept or assume responsibility for the consequences of any reliance on this report for any other purpose or to any other person or organisation. Any reliance on this report by any third party is entirely at its own risk.
We consent to the inclusion of this report in the Rio Tinto 2017 Annual report and the Rio Tinto 2017 Strategic report to assist Rio Tinto’s members in assessing whether the directors have discharged their
responsibilities by commissioning an independent assurance report in connection with the selected subject matter.
Limited assurance
This engagement is aimed at obtaining limited assurance for our conclusions. As a limited assurance engagement is restricted primarily to enquiries and analytical procedures and the work is substantially less detailed than that undertaken for a reasonable assurance engagement, the level of assurance is lower than would be obtained in a reasonable assurance engagement.
Professional standards require us to use negative wording in the conclusion of a limited assurance report.

36 riotinto.com Strategic report 2017
Strategic report Governance report Financial statements Production, reserves and operations Additional information
36
Inclusion and diversity
Our commitment to inclusion and diversity We are a global company and, wherever we operate and across every part of our business, we strive to create an inclusive culture where diversity is recognised and valued. By bringing together men and women from diverse backgrounds and giving each person the opportunity to contribute their skills, experience and perspectives, we believe that we are able to develop the best solutions to challenges and deliver value for Rio Tinto and its stakeholders. This approach is re�ected and put into effect through the company’s Diversity and Inclusion policy, which is available on our website.
What inclusion and diversity means for Rio Tinto
– Embracing workforce diversity – age, gender, race, national or ethnic origin, religion, language, political beliefs, sexual orientation and physical ability.
– Valuing diversity of perspective – leveraging the diverse thinking, skills, experience and working styles of our employees and other stakeholders.
– Building a �exible organisation – providing opportunities for work arrangements that accommodate the diverse needs of individuals at different career and life stages.
– Respecting stakeholder diversity – developing strong and sustainable relationships with diverse shareholders, communities, employees, governments, customers and suppliers.
Our current focus Our goal is to have a workforce that is representative of the countries and communities in which we operate, and to have a culture that is inclusive where all people feel heard, valued and respected. Currently our focus is to improve the representation of women and of people from nationalities representative of our current and future footprint, and to continue to build an inclusive culture in which all talent can thrive.
Some of our activities and initiatives relating to diversity during 2017 and our plans for 2018 include:
– A global minimum standard for paid parental leave for all employees. With a successful roll-out in the US during 2017, in 2018 we will implement the changes through the organisation so that all employees will be able to access a minimum standard of paid parental leave, regardless of their personal circumstances.
– Rio Tinto took a stand against family and domestic violence, including implementing standard support available to affected employees. This was launched in Australia with plans to roll out further in 2018. Our Australia business undertook the path of White Ribbon accreditation, which recognises workplaces that are taking active steps to stop violence against women.
– Through innovative online focus groups, we heard directly from over 500 employees about their views on inclusion and diversity and what matters to them. Using these insights, in 2018 we will be developing a stronger narrative to engage our whole population on the diversity journey.
– Building leadership capability is a key enabler of inclusion and diversity. Our Leading for Success programme was launched and 1,500 of our senior leaders completed the programme, including the chief executive and Executive Committee. During 2018 a further 5,000 middle and front-line leaders will participate in the programme.
– The Rio Tinto Graduate Talent programme was re-launched, with a focus on bringing diverse graduates into the business on a two-year development programme. Forty one per cent of the graduates we hired were women and 29 per cent were nationals from regions where we are developing new businesses. In 2018, we aim to hire 50 per cent women and 30 per cent from regions where we are developing new businesses.
– Our sites all over the world continue to invest in building local capability and increasing the representation of Indigenous employees in our workforce.
– Ongoing active involvement in local Women in Mining groups, professional women’s associations and other key diversity groups.
– Local inclusion and diversity committees and interest groups across the organisation continue to bring tangible actions to life.
Proportion of women employees and board members As at 31 December 2017, the proportion of women on the board was 18 per cent (two female; nine male). This is set to increase to 30 per cent in 2018 as a result of planned succession changes at the board level.
The proportion of women on the Executive Committee was 27.3 per cent (three female; eight male). The proportion of women in senior management was 22.4 per cent and in the overall workforce was 18 per cent. For these purposes, “senior management” are employees in business unit or functional leadership roles who are direct reports of Executive Committee members, and those at general manager, Group adviser and chief adviser levels.
Subsidiary board diversity Women represented 12 per cent of the directors of our principal controlled subsidiary undertakings during 2017 (15 female; 110 male).
Progress continues to be made in meeting our measurable objectives for workforce diversity and we will continue to put strong focus on increasing thesemeasures for 2018.
In 2017, we increased the graduate pool from 69 (2016) to 150 and maintained the focus for gender diversity and intake of graduates who werenationals from regions where we are growing new businesses. Through strategic business impacts (ie divestments) we were able to maintain our genderbalance and increase under-represented nationalities. Strong focus will continue in 2018 for our graduate intake with measures of 50/50 gender splitand 30 per cent under-represented nationalities.
Measurable objectives and progress
19.2% 22.4%
Percentage of women representedin our senior management
2016 2017
46.4% 41%
Percentage of women representedin our graduate intake
2016 2017
36.2% 29%
Percentage of our graduate intake whowere nationals from regions where we are growing new businesses
2016 2017

37Strategic report 2017 riotinto.com
STRA
TEGIC
REP
OR
T
Strategic report Governance report Financial statements Production, reserves and operations Additional information
37
Rio Tinto’s commitment to pay equity
Rio Tinto strives to create an inclusive culture where all people are heard, valued and respected. We embrace workforce diversity and value differences. Consistent with our vision for inclusion and diversity, we are committed to ensuring that employees with similar skills, knowledge, qualifications, experience and performance are paid equally for the same or comparable work. Both the ‘equal pay gap’ and the ‘gender pay gap’ measure pay differences between women and men in the workplace, but they measure two different things:
- An ‘equal pay gap’ arises when men and women employed by the same company, in the same location, performing equal work, do not receive the same pay.
- The ‘gender pay gap’ is a measure of the difference between men’s and women’s average earnings across an organisation or industry, regardless of the roles that each are performing. It is normally expressed as a percentage of men’s earnings.
Equal pay Equal pay is at the core of Rio Tinto’s approach to pay equity. We use a like-for-like approach to measure and monitor equal pay across the Group (irrespective of the regulatory requirements and methodologies that we are required to adopt for local reporting). This means that we compare the pay of employees performing the same roles in the same location or country.
This like-for-like approach is used for all jobs where both females and males are represented, and it is weighted based on the number of female incumbents in each job. A positive percentage indicates an equal pay gap in favour of men. A negative percentage indicates an equal pay gap in favour of women. Rio Tinto’s equal pay gap on 1 February 2018 was three per cent*. Rio Tinto will continue to monitor
equal pay to ensure that any differences are due to legitimate factors, and will take action as appropriate.
Gender pay gap The gender pay gap, unlike equal pay, is also influenced by the relative seniority of men and women in an organisation or industry. Across the entire Group, the gender pay gap on 1 February 2018 was just under one per cent*. However, this apparently good result for the Group as a whole reflects the large sample size and marks a less favourable posit on at our head office in the UK. Across the entire workforce, as the equal pay gap suggests, there is relatively little difference between the average pay of men and women, but there is still a relatively low level of gender diversity in the most senior management positions. Rio Tinto is addressing this issue through a number of initiatives, including a target to increase the representation of women in senior management roles by two per cent year on year, and for women to represent 50 per cent of our graduate intake in 2018. Both the equal pay gap and the Group-wide gender pay gap are measured and monitored on a voluntary basis by Rio Tinto, in parallel with country-specific mandatory reporting requirements. Under UK regulations, while none of our UK employing entities meet the minimum reporting threshold of 250 employees, details of the gender pay gap for the largest entity (Rio Tinto London Limited) have been voluntarily disclosed on our website at riotinto.com/payequity. * Note: Defined as full time equivalent, contractual base salary; excludes Pacific Aluminium due to insufficient data being available
i

38 riotinto.com Strategic report 2017
Governance report Financial statements Production, reserves and operations Additional information
38
Iron Ore
Financial performance
2017 US$ million
2016US$ million
Gross revenue (a) 18,251 14,605Net cash generated from operating activities 8,466 5,959Underlying earnings 6,692 4,611Capital expenditure (a) 1,201 868Net operating assets 16,537 16,359Underlying EBITDA 11,520 8,526
Iron Ore Company of Canada and Simandou are reported within Energy & Minerals (see page 45), reflecting management responsibility.
(a) Gross revenue and capital expenditure are defined on page 208 under Notes to financial information by business unit.
Strategy and priorities The Iron Ore product group’s strategy is focused on delivering optimal value from a fully integrated system of assets.
The business strategy is guided by the following principles:
– Exclusive use of assets in a fully integrated system that delivers consistent returns throughout the cycle.
– Mine-to-market productivity that maximises free cash flow from the existing asset base.
– Sequencing resource development to optimise mines and product. – Quality people and partners driving innovation. – Making a lasting and positive contribution that will enable strong
partnerships.
The product group’s strategic priorities are to:
– Run safe, healthy and fatality-free operations. – Fully engage all employees and contract partners. – Sustain the competitive advantage of premium products, the
flagship of which is Pilbara Blend. – Realise the full potential of the system to maximise cash flow and
productivity from the existing asset base. – Harness innovation and technology to help drive superior
performance. – Follow a disciplined, value-over-volume strategy. – Engage with highly valued partners and support sustainable local
and regional investment.
Safety In 2017, there was a 19 per cent reduction in potential fatal incidents (PFIs). This improvement was supported by the critical risk learning programme, which facilitated engagement sessions focusing on application of incident learnings at a team level.
Despite this reduction, we maintain a vigilant approach to our safety risks. We continue to embed our critical risk management fatality prevention programme, focusing relentlessly on control to support fatality elimination.
The all injury frequency rate decreased by 2 per cent from 2016 to 0.48. Throughout 2017 and continuing into 2018, the focus is on the basics; quality leadership in the field, improving the effectiveness of safety interactions and pre-start meetings, and leader coaching to enable quality verifications.
The product group continues its work to improve the wellbeing of our employees through wellbeing training and the peer support programme.
Iron Ore’s commitment to safety was recognised at the Western Australian Department of Mines, Industry Regulation and Safety Awards for Excellence ceremony in October. Rio Tinto had six finalists across three award categories that focused on safety and health, environmental excellence, as well as community partnerships. Innovative work on a rail-mounted platform – to eliminate risks associated with working at heights – won the engineering category in the Safety and Health section.
Greenhouse gas emissions Throughout 2017, the Iron Ore product group continued to reduce its greenhouse gas emissions intensity compared with the baseline target set in 2008. Since 2008, the product group’s greenhouse gas emissions intensity has improved by 5.3 per cent.
Review of operations In the Pilbara region of Western Australia, Rio Tinto operates the world’s largest integrated portfolio of iron ore assets. This system comprises 16 mines, four independent port terminals, over 1,700km of the largest privately owned heavy freight railway in Australia, and supporting infrastructure, all linked by the Operations Centre in Perth. Five highly valued products are sold to over 100 customers globally.
In 2017, Rio Tinto opened Silvergrass, its 16th mine. The US$338 million mine will produce low-phosphorous ore crucial to maintaining the premium Pilbara Blend product.
In May, Rio Tinto reached the historic milestone of five billion tonnes of iron ore exported from the Pilbara.
In August, Rio Tinto and Sinosteel marked the 30th anniversary of their historic Channar Mining Joint Venture. The event was attended by former Australian Prime Minister Bob Hawke, who was present at the original signing ceremony in 1987. Rio Tinto has delivered more than 250 million tonnes under the joint venture.
In December, the 15th anniversary of the Bao-HI Joint Venture, involving Rio Tinto and China Baowu Group, was celebrated. More than 150 million tonnes have been delivered into the joint venture since it was created in 2002.
In 2017, the Iron Ore product group’s underlying earnings increased by US$2,081 million, up 45 per cent on 2016. This was achieved through record sales volumes, continued cash cost savings and higher iron ore prices.
Iron ore shipments for 2017 met guidance at 330.1 million tonnes (Rio Tinto share: 272 million tonnes), an increase of 1 per cent on 2016. Initial guidance for 2017 of 330 million to 340 million tonnes was revised in July to 330 million tonnes due to lower first half production and rail maintenance. Production of 329.8 million tonnes (Rio Tinto share: 271.3 million tonnes) in 2017 was in line with 2016 output. A stronger performance in the second half offset the impacts of adverse weather conditions in the first quarter and accelerated rail maintenance in the second quarter.
In 2017, China’s crude steel production remained well-supported at an all-time high of almost 900 million tonnes for the second year in a row. Broad-based steel demand across key end-use sectors, including construction, manufacturing and infrastructure, kept steel inventories well below average throughout the year. Meanwhile, supply-side reforms were reflected in a structural boost to steel-making capacity utilisation – to rates significantly above historical trends both in China and the other major steel producing regions.
Concurrently, the Chinese Government’s focus on air quality improvement made the need for productivity and the reduction in emissions paramount. This in turn incentivised demand for high-grade, low-impurity iron ore products, such as the Pilbara Blend. The reduction of small-scale secondary steelmaking capacity meant that more scrap became available to the large integrated steel producers.
However, these producers had to expand their output to compensate for the closures of inefficient mills, which, coupled with the preference for higher quality products, lifted China’s iron ore imports for the seventh consecutive year, reaching an estimated record figure of almost 1.1 billion tonnes. Port inventories also rose by more than 30 million tonnes to end the year at around 145 million tonnes, though the growth was primarily driven by lower-grade ores.
The Platts 62 per cent Fe CFR (cost and freight) iron ore price peaked at US$95 per tonne in late February, but this was followed by a sharp decline to US$54 per tonne in June. Prices oscillated around the US$65 per tonne level during the fourth quarter of 2017.
A strong pipeline of initiatives implemented in 2017 resulted in pre-tax cash cost reductions of US$341 million. The Iron Ore product group has now delivered US$1.7 billion of cumulative savings, compared with the 2012 base, making a significant contribution to the wider Rio Tinto Group pre-tax savings. Further efficiency improvements reduced the Pilbara cash unit costs to US$13.4 per tonne in 2017, compared with US$13.7 per tonne in 2016.

39Strategic report 2017 riotinto.com
STRA
TEGIC
REP
OR
T
Strategic report Governance report Financial statements Production, reserves and operations Additional information
39
Operating cost initiatives included optimising maintenance strategies and tactics and partnering with suppliers for improved commercial outcomes. Productivity improvements included increasing ore train payloads and decreasing cycle times.
The Iron Ore product group continues to be a leader in safe autonomous mining technologies. The Operations Centre controls and operates major assets, including autonomous haul trucks and drills, processing plants, train loading and unloading, and stockyard stacking and reclaiming machines.
A fourth site enabled by an Autonomous Haulage System (AHS) was opened during the year at Silvergrass. In addition, retrofitting projects at the Marandoo and Brockman 4 mines will see the fleet expand to more than 140 AHS-enabled trucks by the end of 2019. The automated truck fleet continues to provide advantages relating to safety, productivity and operating costs. On average, the autonomous fleet operated an additional 700 hours and at 15 per cent lower load and haul cost in 2017 than comparable conventional haul trucks.
The performance of autonomous trucks and the increased utilisation of all trucks, together with improvements in payload, has reduced fleet requirements, resulting in lower capital expenditure and operating costs.
Automated haul trucks have also been shown to offer significant safety benefits with zero injuries attributed to AHS-enabled trucks since deployment.
Considerable progress was made by the AutoHaulTM project during 2017. More than 60 per cent of all train kilometres are now completed in autonomous mode with a driver on board for supervision.
A pilot run was completed in September with the train making a nearly 100 kilometre journey without a driver on board: the first fully autonomous heavy haul train journey ever completed in Australia.
The project is on schedule to be completed by the end of 2018. The total approved spend for the AutoHaulTM project is US$940 million.
Throughout 2017, the Iron Ore product group maintained its focus on supporting Traditional Owners, local businesses and communities within its operational footprint. The product group continued actively implementing the Regional Framework Deed and its ten land access agreements with Pilbara Traditional Owners.
Iron Ore has agreements with all Pilbara Traditional Owner groups on whose land it operates. These agreements incorporate mutual obligations to deliver positive outcomes in areas such as employment, education and training, cultural heritage management, environmental management and land access. Five reviews of Benefits Management Structures established under these agreements were completed during 2017, with joint participation by Traditional Owner and Rio Tinto representatives. Over 100 heritage surveys were undertaken in 2017 across the Pilbara footprint, with the full involvement of Traditional Owner representatives.
The Iron Ore product group employs approximately 960 Indigenous employees, including 437 Pilbara Aboriginal people (PAP) as at 31 December 2017. In May 2017, the Pilbara Aboriginal employment target was met for the first time with a result of 12.4 per cent against a target of 12.2 per cent. The PAP target is based on the latest census data. Total Indigenous employment was 8.2 per cent across the product group as at 31 December 2017. With this result Iron Ore also exceeded the Indigenous employment target of 8 per cent in the national Reconciliation Action Plan for Australia.
The Iron Ore product group continues to support programmes and initiatives across the Pilbara, and its fly-in, fly-out (FIFO) source communities in regional Western Australia and Perth. The ten-year anniversary of FIFO operations from Busselton in the South West to operations in the Pilbara was celebrated in August.
The Community Infrastructure and Services Partnerships (CISP) with the City of Karratha and the Shire of Ashburton were extended a further five years, helping to improve infrastructure and services in the region. Rio Tinto will contribute a further A$7.7 million to the City of Karratha CISP and A$5.7 million to the Shire of Ashburton CISP over a period of five years.
Rio Tinto will contribute A$8 million towards the construction of the Wickham Community Hub and a further A$7.5 million toward its operation. The Hub will feature a public library, a water playground, a skate park and multi-purpose facilities.
During the year the company partnered with the country’s leading science and research agency, the Commonwealth Scientific and Industrial Research Organisation (CSIRO) to implement a new community sentiment survey in the Pilbara – to better understand
the views of local communities near our operations and improve regional and community planning.
Rio Tinto began working with the West Australian Government and TAFE Western Australia to pioneer a new curriculum for the mining industry’s jobs of the future. The company will provide up to A$2 million toward the Vocational Education Training initiative.
Development projects The Iron Ore product group’s mineral resources position increased in 2017 as part of ongoing resource development drilling programmes. This continues to support sustaining production and growth options. Managing this resource base efficiently will create a development sequence that maximises the value of assets and maintains the required delivery of product. Ore reserves also increased after mine depletion. Given their significance to the business and its customers, the focus continues on the premium Pilbara Blend products.
Since 2012, the product group has followed a disciplined, value-accretive, low-cost brownfield approach to expansion. The addition of Silvergrass, comprising the installation of a satellite crusher and an overland conveyer, added an extra 10 million tonnes of capacity.
The Koodaideri project is being studied as the next major replacement mine and is a low-cost option that would help underpin the Pilbara Blend product. An investment of US$30.9 million was approved in May to complete the feasibility study.
The study is assessing a number of options, including a 40 million tonne per annum capacity dry crushing and screening plant, non-process infrastructure, product stockyards, a rail loop and load-out and a 170 kilometre rail link to the main line. It has a suggested capital requirement of approximately US$2.2 billion, with the potential for construction to begin in 2019. The feasibility study will build on this work and consider a range of capital, timing and scale options.
A number of sustaining mine developments also progressed in 2017 including Yandi Oxbow and West Angelas Deposit F, which provide high-quality, low-cost options to sustain existing production. New projects in development include Yandi Billiard South which will benefit greatly from an in situ processing plant and infrastructure, and will utilise the existing Yandicoogina automated truck fleet.
Around US$2 billion has been allocated for replacement mine capital over the next three years, the majority of which is still to be approved and includes some spend on Koodaideri.
Outlook Having exceeded 100 million tonnes in both 2015 and 2016, Chinese steel exports reversed trend and declined more than 30 per cent to approximately 75 million tonnes in 2017. This was in spite of robust Chinese steel production in 2017, as strong demand and higher prices in the domestic market led to a decline in exports.
Lower Chinese steel exports in turn incentivised restarts and commissioning of new steelmaking capacities in the rest of Asia. The combination of supply-side reform in the Chinese steel industry, together with synchronised global economic growth, is likely to result in a continuation of the trend of rising steel output across the rest of Asia. Augmented by cyclical recoveries in developed regions, Rio Tinto expects ex-China crude steel production to significantly outpace China in growth terms and reach a record of more than 850 million tonnes in 2018, exceeding levels not seen since before the global financial crisis.
However, contestable seaborne iron ore supply is also expected to continue to expand in 2018, with the ramp-up of major producers’ expansion projects to nameplate capacity.

40 riotinto.com Strategic report 2017
Governance report Financial statements Production, reserves and operations Additional information
40
Aluminium
Financial performance
2017 2016 US$ million US$ million Gross revenue 11,005 9,458 Net cash generated from operating activities 2,648 2,278 Underlying earnings 1,583 947 Capital expenditure 1,436 916 Net operating assets 16,346 15,782 Underlying EBITDA 3,423 2,472
Strategy and priorities
Rio Tinto’s Aluminium product group remains focused on delivering industry-leading performance and value creation throughout the cycle. Safety and health continue to be the product group’s number one priority. Central to its strategy is a continuing emphasis on mine-to-market productivity improvements. These are designed to optimise performance and returns from its high-quality asset base, while also enhancing the bauxite and smelting growth options embedded within the portfolio, where the priority is always on value over volume. The Aluminium product group bene�ts from a sector-leading bauxite position, cost-competitive alumina re�neries and a smelter portfolio with average costs in the �rst quartile of the global industry cost curve. Its Canadian smelters are positioned in the �rst decile. Each of the three areas of the business – bauxite, alumina and primary metal – has its own targets and strategies, summarised below: – In bauxite, the emphasis is on capturing value from expanding
seaborne demand. This involves continuing to enhance performance and output at current operations, while developing Tier 1 growth opportunities, such as the Amrun project currently under way in Queensland, Australia.
– In alumina, providing security of supply to the product group’s smelter portfolio is essential. The focus is on aggressively driving down costs to improve the re�neries’ position on the industry cost curve, while providing reliable supply.
– In primary metal, the Aluminium product group focuses on leveraging its low-cost, low-carbon power position – a signi�cant and sustainable competitive advantage.
Commercial excellence is crucial to Aluminium’s overall mine-to-market productivity agenda. The three product areas are supported by a single global commercial organisation managed from Singapore, tasked with maximising value across the product group. One of the team’s main areas of focus is partnering with customers to develop new applications that will drive increased sales of higher-margin, value-added products. In 2017, Rio Tinto announced that a suite of three operational assets (the ISAL smelter and the non-managed Aluchemie and Alu�uor joint ventures) were being placed under strategic review. On 10 January 2018, Rio Tinto received a binding offer from Liberty House to acquire the Aluminium Dunkerque smelter in northern France for US$500 million, subject to �nal adjustments. These actions re�ect the continuing strategic focus for the portfolio on high-quality assets in the �rst quartile of the cost curve. On 26 February 2018, Rio Tinto received a binding offer from Hydro of US$345 million, subject to �nal adjustments, to acquire Rio Tinto’s ISAL smelter in Iceland, its 53.3 per cent share in the Aluchemie anode plant in the Netherlands and its 50 per cent share in the Aluminium �uoride plant in Sweden. The board of Rio Tinto made the decision to permanently shut the Gove re�nery in October 2017.
Safety
Rio Tinto’s Aluminium product group achieved a third consecutive fatality-free year in our managed operations in 2017. The all injury frequency rate continued its downward trend, ending the year at 0.44, compared with 0.46 at the end of 2016 and representing another record. Lost-time injuries reduced by more than 24 per cent to 28, which was also a record. The product group has deployed a comprehensive systems-
based approach, including the roll-out of the critical risk management fatality prevention programme during 2017. In September, a contractor employee died from burns while working on a washer tank at the non-managed joint venture re�nery, Alumar in Brazil. Rio Tinto has a 10 per cent interest in Alumar, which is managed by Alcoa.
Greenhouse gas emissions
The Aluminium product group’s success in dramatically reducing its carbon footprint has been instrumental in positioning Rio Tinto to capitalise on the increasing market demand for “responsible metal”. Its pioneering RenewAl™ brand of aluminium boasts one of the lowest greenhouse gas (GHG) footprints in the industry, based on a life-cycle analysis approach. The product group’s footprint is 50 per cent lower than the global industry average – thanks to a combination of low-carbon sources of electricity and Rio Tinto’s world-leading smelting technology. Since 2008, the Aluminium product group has reduced its GHG emissions by 50 per cent in absolute terms and by 39.5 per cent in intensity. GHG emissions intensity of primary aluminium production had reduced by 42 per cent by 2017, compared with 2008, due to portfolio management. Almost 81 per cent of the Aluminium product group’s total power needs are supplied through carbon-free sources, with 57 per cent coming from self-generated hydropower, compared with around 30 per cent for the industry in both cases.
Review of operations
In 2017, the Aluminium product group achieved EBITDA of US$3.42 billion – an increase of 38 per cent versus 2016 (US$2.47 billion), and underlying earnings of US$1.58 billion – 67 per cent higher than in 2016 (US$947 million). This represents sector-leading performance with an integrated operations EBITDA margin of 35 per cent (2016: 28 per cent). Cash generated from operating activities was US$2.65 billion – a 16 per cent increase on 2016 (US$2.28 billion) – which re�ected the strong EBITDA, partly offset by higher trade working capital related to higher pricing. Market sentiment improved considerably as China’s supply-side reforms and environmental measures in the winter months were implemented and global inventory levels dropped to around ten weeks. Global primary aluminium demand remained strong in 2017, increasing by six per cent, driven by �rm Chinese growth and higher intensity of use in global automotive production. As a consequence, the average realised price for alumina improved by 28 per cent year-on-year, while the average realised price for primary metal, including regional and product premia, improved by 21 per cent to US$2,231 per tonne. The improved pricing environment was partially offset by a strengthening of the Australian and Canadian dollars, as well as by increases in the prices of raw materials – most notably caustic soda, petroleum coke and tar pitch – relating mainly to the same underlying drivers supporting the aluminium and alumina prices. Cost headwinds related to these raw materials are expected to be ongoing in 2018. Volume creep (or gradual increase), cost improvements and value-added product initiatives executed by the product group over the course of 2017 totalled US$198 million, and more than offset the negative impact of the higher raw material input costs (US$149 million higher than in 2016). The Aluminium product group has now delivered US$1.6 billion of cash cost improvements, compared with the 2012 base, consolidating its position as the leading business in the aluminium sector. Alumina production for 2017 was in line with 2016 levels, with a strong performance at Yarwun partially offset by marginally lower production at the Queensland Alumina re�nery. Production of primary metal was one per cent lower than in 2016. Production creep of one per cent achieved at the product group’s wholly owned Canadian smelters was more than offset by a partial production curtailment at the Boyne smelter in Australia, prompted by higher power prices, and a production incident at the non-managed Sohar smelter in Oman. Central to Aluminium’s performance has been the continuous drive to creep the capacity of its assets at minimal cost to enhance margin, while always maintaining a focus on value over volume. Bauxite production increased six per cent, with Gove up 23 per cent and Weipa up �ve per cent, re�ecting the successful execution of this

41Strategic report 2017 riotinto.com
STRA
TEGIC
REP
OR
T
Strategic report Governance report Financial statements Production, reserves and operations Additional information
41
strategy. This enabled the product group to ship 32 million tonnes of bauxite to third parties in 2017, a ten per cent increase compared with 2016, further reinforcing Rio Tinto’s position as the global leader in the seaborne bauxite trade. The Aluminium product group has initiated an ambitious productivity and commercial capability improvement programme that aims to deliver an additional after-tax free cash flow of US$0.5 billion per annum by 2021, compared with the 2016 baseline. At the end of 2017, more than 2,400 improvement initiatives were under way across its various operations and functions.
Development projects
The high quality and expandable nature of its asset portfolio means the Aluminium product group is very well positioned to pursue value-driven growth as warranted by the market, and to generate attractive returns. The development pipeline focuses primarily on its bauxite and Canadian smelting businesses, and it is in these areas that the product group continues to progress from option-rich to option-ready. Construction continued during 2017 on the Amrun bauxite project in Queensland, Australia. Amrun is a long-life, low-cost and strategically located project, that represents a step-change in Rio Tinto’s bauxite business and is expandable to satisfy increasing demand for seaborne bauxite. At the end of 2017, the project was 62 per cent complete, and proceeding on time and on budget (total approved US$1.9 billion) towards its scheduled first shipment during the first half of 2019. Planned initial output for Amrun is 22.8 million tonnes per annum. The expansion of the partially owned Compagnie des Bauxites de Guinée (CBG) from 14.5 to 18.5 million tonnes is also progressing on budget (total approved US$0.7 billion) and on schedule with first bauxite planned for delivery in the fourth quarter of 2018.
Outlook
Aluminium demand is expected to remain strong and the product group forecasts growth of three to four per cent per year over the next five years. Robust demand growth is expected to continue over the next 15 years, underpinned especially by the growth in the transport sector, with the uptake in electric vehicles offering further potential upside. The fundamentals of the supply side of the smelting industry are now looking increasingly favourable, with Chinese pollution controls and cuts of illegal capacity driving market tightness. The curtailed capacity is expected to be restarted, but timing remains uncertain. More significantly, over the medium to longer term, Rio Tinto expects that China is likely to be broadly balanced in aluminium, which will have implications for rest-of-world supply. When combined with strength in demand, this is expected to result in a return to balanced inventory levels of seven to eight weeks before the end of this decade, much earlier than previously expected. In bauxite, demand is expected to remain robust given the continued strong growth in aluminium production. Chinese growth in alumina production will remain a major driver of seaborne demand.

42 riotinto.com Strategic report 2017
Governance report Financial statements Production, reserves and operations Additional information
42
Copper & Diamonds
Financial performance
2017US$ million
2016US$ million
Gross revenue 4,842 4,524Net cash generated from operating activities (1) 1,695 977Underlying earnings/(loss) 263 (18)Capital expenditure (2) 1,374 924Net operating assets 11,743 11,530Underlying EBITDA 1,904 1,387
(a) Net cash generated from operating activities excludes the operating cash flows of an
equity accounted unit (Escondida) but includes dividends received from the equity accounted units.
(b) Capital expenditure excludes the capital expenditure of an equity accounted unit (Escondida).
Strategy and priorities The Copper & Diamonds product group’s portfolio of large, high-quality assets includes interests in three of the world’s Tier 1 copper mines.
The product group’s strategy is to deliver sustainable value by:
– Driving continuous improvements in health, environment and safety – the number one priority and value.
– Maximising value from existing operations through improvements in productivity.
– Developing brownfield copper growth options and new, world-class greenfield projects in low-risk jurisdictions.
– Focusing on cost control and cash generation. – Developing people and partnerships, and engaging employees.
Safety In 2017, the all injury frequency rate for Copper & Diamonds’ managed operations(a) was 0.80, compared with 0.67 in 2016. Product group operations are focused on addressing this trend by embedding safety activities through education, leadership and workplace improvements.
Tragically, a Rio Tinto Kennecott employee suffered a fatal injury when exposed to sulphur dioxide gases while performing regular work to remove debris from a boiler. There were also two fatalities at the Grasberg mine, in which Rio Tinto is a joint venture partner.
In addition to its efforts to reduce injuries, Copper & Diamonds has continued to embed the company’s critical risk management fatality prevention programme and process safety programmes into all its operations. These are aimed at identifying and mitigating the risks that can lead to fatalities and catastrophic events. In the spirit of continuous improvement, the product group also continues to learn from and share leading safety practices with its joint venture partners.
Greenhouse gas emissions At 3.4 million tonnes of carbon dioxide equivalent (tCO2-e), Copper & Diamonds’ greenhouse gas (GHG) emissions(a) increased by 0.1 million tonnes CO2-e compared with 2016. An intensity improvement at Argyle from an increased production was offset by marginal increases in intensity at Rio Tinto Kennecott, Oyu Tolgoi and Diavik.
Review of operations The product group has four copper assets and two diamonds assets in production. In 2017, total mined copper decreased by 9 per cent, and total diamonds production increased by 20 per cent.
Rio Tinto was the world’s ninth largest copper supplier in 2017 and one of the largest diamond producers. During the year, the product group produced 478 thousand tonnes of mined copper (Rio Tinto share), and 22 million carats of rough diamonds (Rio Tinto share). In addition, the Copper & Diamonds group produced 260 thousand ounces of mined gold, 4,194 thousand ounces of mined silver and five thousand tonnes of molybdenum as by-products. (a) Safety measures reported for Copper & Diamonds exclude those
for Oyu Tolgoi; these are included within Growth & Innovation. Refer to page 46.
Copper & Diamonds’ underlying earnings were US$263 million, compared with an underlying loss of US$18 million in 2016. The change in underlying earnings was driven by improved prices and cost reductions together with final the insurance settlement relating to the Manefay slide at Kennecott in 2013, which more than offset the one-off impacts of the Escondida strike (US$176 million) and a deferred tax asset write-down at Grasberg (US$144 million). The product group achieved pre-tax cash cost improvements in 2017 of US$160 million, bringing total savings delivered across Copper & Diamonds since 2012 to US$1.4 billion. Net cash generated from operating activities (inclusive of dividends received from Escondida) of US$1,695 million was 73 per cent higher than 2016, with all managed operations being cash flow positive before capital expenditure as a result of higher prices and cost reductions. Increased capital expenditure of US$1,374 milllion included US$820 million for development of the Oyu Tolgoi underground mine in Mongolia.
Rio Tinto Kennecott Rio Tinto Kennecott (Rio Tinto: 100 per cent) operates a mine, concentrator, smelter, copper refinery and precious metal plant in the US state of Utah. Rio Tinto Kennecott accounts for almost 11 per cent of the US’s annual copper production and is one of the largest copper producers in the country. The operation is focused on maximising value through asset optimisation and operational excellence at all stages of its value chain. Rio Tinto Kennecott’s mined copper production was 3 per cent lower than 2016, with lower grades partially offset by higher mill throughput. The operation produced 126 thousand tonnes of refined copper, 204 thousand ounces of refined gold, and five thousand tonnes of molybdenum in 2017. Improved utilisation and payload increased truck productivity in 2017 resulting in higher volumes of total material moved compared with 2016. In addition, the operation maximised available smelter capacity by the receipt of 161 thousand tonnes of third-party concentrate for tolling in 2017. In April 2017, Rio Tinto Kennecott reached a labour contract agreement with four unions representing its employees.
Oyu Tolgoi Located in Mongolia’s South Gobi Desert, Oyu Tolgoi (Rio Tinto: 33.5 per cent indirect interest through a 50.8 per cent interest in Turquoise Hill Resources Ltd) is one of the world’s largest copper-gold developments. Since 2012, operations have been mining ore from the Oyu Tolgoi open pit and producing copper-gold concentrate at a facility located adjacent to the mine site. Open-pit operations produced 157 thousand tonnes of copper, 114 thousand ounces of mined gold and 974 thousand ounces of silver (100 per cent basis) during 2017. Mined copper production for 2017 was 22 per cent lower than 2016 with production from the open pit reducing as anticipated due to lower head grades, as phases two and three, which were sources of higher grade ore, were fully depleted by the end of 2016.
Escondida Located in Chile’s Atacama Desert, Escondida (Rio Tinto: 30 per cent interest), is the world’s largest copper-producing mine. Escondida’s two open-cut pits currently feed three concentrator plants, as well as two leaching operations. In 2017, Escondida produced 903 thousand tonnes of mined copper (100 per cent basis). Mined copper production was 11 per cent lower than 2016 due to a 43-day labour strike. Concentrator throughput increased towards the end of 2017 following commissioning of the Los Colorados Extension. The construction of a desalination facility (approved in 2013) to provide a long-term sustainable supply of water for the operations reached completion on budget in December 2017. Grasberg Located in the province of Papua, Indonesia, Grasberg is one of the world’s largest copper mines. Grasberg is owned and operated by PT Freeport Indonesia (PTFI), a subsidiary of US-based Freeport-McMoRan, Inc. (“Freeport”). Through a joint venture with Freeport, Rio Tinto is entitled to a 40 per cent share of production above an agreed threshold until the end of 2021 and 40 per cent of all production thereafter. Rio Tinto’s full participation has been delayed due to the application of force majeure provisions in the joint venture agreement. The first full year in which Rio Tinto will participate to the full extent of 40 per cent of production is now expected to be 2023.

43Strategic report 2017 riotinto.com
STRA
TEGIC
REP
OR
T
Strategic report Governance report Financial statements Production, reserves and operations Additional information
43
Rio Tinto’s share of mined copper production at Grasberg was approximately six thousand tonnes of copper in 2017. Rio Tinto’s share of mined gold was nil due to the minimum production threshold not being met.
In January and February 2017, the Indonesian Government issued new mining regulations to address exports of unrefined metals, including copper concentrates, and other matters related to the mining sector. These regulations impact PTFI’s operating rights, including its right to continue to export concentrate without restriction, and, as a result, had a significant impact on Rio Tinto’s share of production in 2017. In March 2017, the Indonesian Government amended the regulations and issued a permit to PTFI that allowed concentrate exports to resume in April 2017. On 19 February 2018, PTFI received an extension of its export permit to 19 February 2019. PTFI continues to engage with the Indonesian Government in relation to the basis upon which operations at Grasberg will continue beyond 2021 with regard to the rights conferred by its Contract of Work and the Government’s stated intention to apply the provisions of the 2009 Minerba Law and associated regulations. Argyle Diamond Mine Located in the remote east Kimberley region of Western Australia, Argyle (Rio Tinto: 100 per cent) is one of the world’s largest producers of diamonds by volume. In 2017, Argyle’s carat production increased by 23 per cent, compared with 2016, as a result of the reprocessing of higher-grade recovery tailings. A combination of lower production volumes compared with forecast, a smaller than expected contribution from productivity improvements and lower realised prices triggered a reassessment of the recoverable value of Argyle’s assets. In assessing the recoverable value, it was determined that the property, plant and equipment was fully impaired resulting in a pre-tax impairment charge of US$172 million. The lower than previously forecast diamond production has resulted in a reduction to reserves and the elimination of resources. The remaining reserves underpin the operation until 2020, with opportunities to extend subject to technical and financial performance. A JORC Table 1 supporting the changes will be released to the ASX in conjunction with this Annual report (riotinto.com/JORC).
Diavik Diamond Mine Diavik (Rio Tinto: 60 per cent) is located in Canada’s remote Northwest Territories, producing predominantly large, white gem-quality diamonds. Carats recovered in 2017 were 12 per cent higher than 2016 due primarily to an improvement in the grade of the ore.
Development projects
At Rio Tinto Kennecott the South Wall Pushback project continued in 2017. This development project will extend the life of the mine and remains on track for completion in 2020 to underpin over a decade of high-quality cash flow and a return to higher grades from 2021. In addition, depressurisation activities performed prior to and during 2017 reduced geotechnical risk within the mine. Rio Tinto Kennecott is also in the process of refining its closure planning, which looks beyond the operational stage in the life cycle of the mine to its post-mining future. This is a complex process due to the size, complexity and longevity of the operation. Throughout the closure planning process, engagement with affected and interested parties will take place, thereby better positioning the business for strategic decisions that are an essential part of maintaining the licence to operate. Work to develop Oyu Tolgoi’s underground mine (approved project spend of US$5.3 billion before power supply) continued in 2017 and remains on track. The total project workforce was over 6,600 at the end of 2017, more than 85 per cent of whom are Mongolian nationals. Lateral development is on schedule; Shaft 2 sinking completed in January 2018 and completion of Shaft 5 sinking is expected by the end of the first quarter of 2018. The underground mine is expected to be fully ramped up in 2027, with the highest grades anticipated between 2024 and 2026. First production tonnes are expected in 2020. Rio Tinto continues to work with its partners to develop the best solution for a domestic power supply for the Oyu Tolgoi operation, following the Government of Mongolia’s withdrawal from the Tavan Tolgoi Power Project (TTPP). The Government of Mongolia has terminated the Southern Region Power Sector Cooperation Agreement (PSCA) such that the TTPP project is no longer a viable option. As a result, and in line with the terms of the 2009 Investment Agreement, Oyu Tolgoi is obliged to
source all of its power requirements for the operation from domestic sources within four years from 15 February 2018.
Oyu Tolgoi LLC is continuing to evaluate all viable power options, including the construction of an Oyu Tolgoi site-based power plant. The cost and means of financing the power plant will be finalised between shareholders. Rio Tinto will continue to review its capital expenditure forecasts for the project but has already earmarked US$250 million per annum for the development of a power station in Mongolia in its 2019 and 2020 capital expenditure forecasts. The Resolution Copper project (Rio Tinto: 55 per cent) located in Arizona, US, is one of the world’s largest known undeveloped copper deposits. Drilling, proposed development and engineering studies continue and the permitting process is on schedule. In 2017, Resolution Copper executed an Agreement To Initiate with the United States Forest Service and the Bureau of Land Management, which establishes the schedule for completion of the pre-conditions to full implementation of the Southeast Arizona Land Exchange and Conservation Act. In December 2017, Rio Tinto approved a US$368 million commitment (Rio Tinto share: US$202 million) to further advance the Resolution Copper project. The funding will improve infrastructure and facilitate mine planning as part of the pre-feasibility study. The Grasberg mine is in the process of developing large-scale, high-grade underground orebodies located beneath and near the Grasberg open pit. Work on the underground orebodies is expected to ramp up over several years following the anticipated transition from the Grasberg open pit. During 2017, Diavik continued to advance the development of the A21 kimberlite pipe. The A21 pipe is expected to be at full production capacity by the fourth quarter of 2018. Outlook
The copper market experienced an eventful start to 2017, when two major disruptions of mine supply resulted in a price spike to a three-year high. After three consecutive years of supply surplus, 2017 recorded a moderate deficit, conditions that Rio Tinto expects to continue over the next two years. During this period, China will remain a key driver of copper fundamentals from both supply and demand perspectives. The Chinese Government’s ambition to improve environmental standards may disrupt metal production and trade flows, although policy aimed at widespread adoption of green technologies will boost growth in copper consumption. Outside of China, favourable conditions in the industrial sector across most major economies are expected to underpin sustained demand in 2018. Meanwhile, supply growth will remain constrained by low grades and major mine depletion, as well as challenges to mine extension plans and greenfield start-ups. Global rough diamond supply grew in 2017 and volumes may remain at a similar level in 2018. Prices partially recovered in 2017 as the downstream sentiment improved, and the outlook for jewellery retail markets in 2018 appears healthy across major regions. Key indicators of demand have turned positive in the EU, remained positive in the US, and are strengthening in India and China. Market sentiment is improving as polished dealers expect restocking to occur on strong seasonal demand. Mixed signals emanated from Indian diamond cutters and polishers, who make up the bulk of the industry’s midstream operators. Financial and fiscal policies in India have helped trading conditions, although stocks of low-grade rough diamonds have coincided with weak prices and some bankruptcies of midstream participants.

44 riotinto.com Strategic report 2017
Governance report Financial statements Production, reserves and operations Additional information
44
Energy & Minerals
Financial performance
2017 US$ million
2016US$ million
Gross revenue 7,764 6,734Net cash generated from operating activities 1,939 1,370Underlying earnings 1,242 612Capital expenditure 467 141Net operating assets 6,313 7,049Underlying EBITDA 2,803 1,806
Iron Ore Company of Canada and Simandou are reported within Energy & Minerals, reflecting management responsibility.
Strategy and priorities The Energy & Minerals product group has a portfolio of high-quality mining, refining and marketing operations and projects. These connect customers and consumers around the world with products that enhance their quality of life and contribute to human progress. Demand growth for industrial minerals typically comes mid-to-late in the economic development cycle, following peak requirements for commodities such as iron ore and copper. The product group’s strategy is focused on operating low-cost, demand-led businesses. Through its integrated marketing strategies and insight, the product group creates and grows global markets for its products to deliver value for Rio Tinto and its shareholders. Energy & Minerals’ strategy focuses on:
– Safety as the number one priority. – Prioritising value over volume. – Operating demand-led, integrated operations that can respond quickly
to the changing external environment. – Creating and growing global markets through technical research and
development and market insight. – Enhancing operating performance by driving productivity, cost
optimisation and by streamlining the organisation. – Strengthening its position in traditional segments and entering
attractive new markets.
Rio Tinto Ventures Rio Tinto Ventures was formed in early 2017. The team’s principal objective is to identify, evaluate and acquire new, value accretive advanced projects and operating businesses, across a spectrum of commodities, principally those which are not currently represented in the Group’s portfolio and which Rio Tinto believes will benefit from macro-economic trends such as urbanisation and disruptive technology. This is to provide options for and support execution of the Group’s growth agenda and capital allocation strategy to create value for Rio Tinto shareholders.
Safety The product group is committed to supporting the Group’s approach to ensuring its teams’ safety, health and wellbeing. With a workforce spanning multiple geographies, languages and cultures, and processes that range from underground mining to smelting, the Energy & Minerals product group faces diverse health and safety risks. It continues to focus on fostering a culture of accountability, visible and engaged leadership, and teamwork across employees and contractors. The product group’s primary focus is the elimination of work-related fatalities. This has been supported by a focused implementation of the critical risk management fatality prevention programme, with an emphasis on critical control verification for fatality risks and process safety exposures. In 2017, there were no fatalities in the product group for a second consecutive year and a continued year-on-year reduction in potential fatal incidents (PFIs). The primary causes of PFIs involved driving, working at height and isolation. The explosion at Rio Tinto Iron & Titanium’s Sorel-Tracy facility – involving the carbon monoxide gas collection system – underlined the importance of the process safety work. The all injury frequency rate reduced from 0.47 in 2016 to 0.43 in 2017. The Energy & Minerals product group continued to embed learnings from PFIs, and to carry out PFI review processes through peer reviews to reduce control breaches. The product group also developed a new approach for process safety, which uses internal and external resources,
tracks progress centrally, and ensures the Process Safety standard requirements are met.
Greenhouse gas emissions Since 2008, the product group’s greenhouse gas emissions intensity has improved by 4.5 per cent. Iron Ore Company of Canada began implementation of a coke reduction strategy resulting in an improved intensity of 0.062 tonnes of carbon dioxide equivalent per tonne of iron concentrate and pellets produced, compared with 0.064 tonnes in 2016.
Review of operations Energy & Minerals’ underlying earnings of US$1,242 million were US$630 million higher than 2016, reflecting higher prices, primarily for coal, iron ore and the majority of Rio Tinto Iron & Titanium’s products, along with higher volumes and cash cost improvements across many of the operations. These more than offset stronger local currencies and the impact of Cyclone Debbie which affected coal production in early 2017. Coal & Allied’s thermal coal operations are included up to their sale on 1 September 2017: the 2016 comparative therefore includes an additional four months of Coal & Allied earnings, equivalent to US$109 million, compared with 2017. Gross sales revenues for the product group in 2017 of US$7,764 million were 15 per cent higher than 2016 as a result of higher prices and higher sales volumes across most products. The exception was coal, which was impacted by the cyclone and disposal of Coal & Allied. Pre-tax cash cost improvements achieved by the product group in 2017 were US$116 million and Energy & Minerals has now delivered US$1.5 billion of cumulative savings compared with the 2012 base. Net cash generated from operating activities of US$1,939 million was 42 per cent higher than 2016, benefiting from higher prices and further cost improvements. The 2016 comparative included cash flows generated from Coal & Allied for the last four months of US$136 million. The increase in capital expenditure included the development of the Wabush 3 open pit mine at Iron Ore Company of Canada. 2016 capital expenditure was presented net of the US$192 million proceeds from the sale of the Mount Pleasant thermal coal assets. The resulting free cash flow achieved during 2017 of US$1,467 million was 19 per cent higher than in 2016. Energy & Minerals also contributed US$2.5 billion disposal proceeds to the Group following the sale of Coal & Allied in September 2017.
Borates Rio Tinto Borates (Rio Tinto: 100 per cent) supplies approximately 30 per cent of the world’s refined borates from its world-class deposit in Boron, California. It also has borates refineries and/or shipping facilities in China, France, Malaysia, the Netherlands, Spain and the US, as well as the Jadar lithium-borate project (Rio Tinto: 100 per cent) in Serbia. Rio Tinto Borates production of 517,000 tonnes boric oxide equivalent was 3 per cent higher than in 2016, with production aligned to market demand. Gross revenue of US$630 million was comparable to 2016, and earnings of US$126 million were 8 per cent higher, which included a gain on the sale of mineral rights in 2017. Following a review of the technical and economic support for treatment of calcium borate ore types, this material has been written back to mineral resources at Boron and a revised life of mine is now 2042. A Joint Ore Reserves Committee (JORC) Table 1 release supporting the changes will be released to the Australian Securities Exchange (ASX) in conjunction with this Annual report.
Coal Rio Tinto Coal Australia (RTCA) manages the Hail Creek (Rio Tinto: 82 per cent) and Kestrel (Rio Tinto: 80 per cent) coal mines. On 24 January 2017, Rio Tinto announced it had reached a binding agreement for the sale of its 100 per cent shareholding in Coal & Allied Industries Limited to Yancoal Australia Limited. The transaction completed on 1 September 2017 for a consideration of US$2.69 billion, before working capital and other adjustments. Hard coking coal production of 7.7 million tonnes (Rio Tinto share) was 5 per cent lower than in 2016 due to the impact of Cyclone Debbie in the first quarter of 2017. The sale of Coal & Allied, coupled with mine production sequencing changes at Hunter Valley Operations and Mount Thorley Warkworth, resulted in semi-soft coking coal production of 2.0 million tonnes and thermal coal production of 13.9 million tonnes. These figures were lower than in 2016 by 51 per cent and 17 per cent respectively. Revenues increased to US$2,829 million, a 7 per cent increase on 2016, as the impact of higher prices outweighed the impact of the sale of Coal & Allied and Cyclone Debbie. This was also the main reason for earnings increasing from US$382 million to US$716 million. As at the year end, RTCA run-of-mine reserves and resources were 398 million tonnes and 2,153 million tonnes respectively (100 per cent

45Strategic report 2017 riotinto.com
STRA
TEGIC
REP
OR
T
Strategic report Governance report Financial statements Production, reserves and operations Additional information
45
basis), reflecting the loss of Coal & Allied tonnes following the divestment on 1 September 2017.
Iron Ore Company of Canada (IOC) IOC (Rio Tinto: 58.7 per cent) operates a mine, a concentrator and a pelletising plant in the Canadian province of Newfoundland and Labrador, together with rail and port facilities in Sept-Îles, Quebec. IOC continued as a supplier of high-quality, premium pellets and high-quality, low-contaminant concentrate. The company remains focused on further increasing productivity and increasing production to nameplate capacity (the full-load sustainable output of the facility) following completion of the Concentrate Expansion Project in 2014. The development of the Wabush 3 open pit mine, approved in the first quarter of 2017, is progressing as planned and is expected to be in production in the second half of 2018. IOC achieved full year production of 11.2 million tonnes (Rio Tinto share) of saleable production. Pellet production of 6.1 million tonnes was 7 per cent higher than 2016, with pellet demand continuing to be strong and product mix being optimised to meet customer demand. Concentrate production of 5.0 million tonnes was 2 per cent higher than 2016. Revenues of US$1.9 billion were 41 per cent higher than 2016, mainly associated with higher prices and volumes, resulting in a US$171 million increase in earnings to US$235 million.
Rio Tinto Iron & Titanium (RTIT) RTIT is the world’s largest producer of high-grade titanium dioxide feedstocks. It mines ilmenite at its wholly-owned Rio Tinto Fer et Titane (RTFT) operation in Canada, its managed Richards Bay Minerals (RBM) operation in South Africa (Rio Tinto: 74 per cent), and its managed QIT Madagascar Minerals operation (Rio Tinto: 80 per cent). RTIT produces high-grade titanium dioxide feedstocks at its world-class metallurgical complexes at RTFT and RBM, as well as valuable co-products that include high-purity ductile iron, steel billets, metal powders and zircon. At 1.3 million tonnes, titanium dioxide slag production was 25 per cent higher in 2017 than in 2016, as RTIT continued to optimise production to match demand. One of nine furnaces at RTFT remains idle, along with one of four furnaces at Richards Bay Minerals. RTIT’s revenues increased by 24 per cent, due to the higher sales volumes and prices for titanium dioxide feedstocks and metallic products, along with higher prices for zircon. Earnings improved by US$115 million to US$201 million and, coupled with the higher sales volumes and prices, reflected cash cost improvements.
Salt Dampier Salt (Rio Tinto: 68.4 per cent), the world’s largest solar salt exporter, produces industrial salt by solar evaporation of seawater at Dampier and Port Hedland, and from underground brine at Lake MacLeod, all in Western Australia. Salt is sold principally to base chemical industry markets in Asia. Salt production of 5.1 million tonnes (Rio Tinto share) was comparable to 2016, with a 2 per cent reduction to align to market demand. Earnings of US$3 million were US$22 million lower than 2016 reflecting lower prices.
Uranium The Uranium business comprises Energy Resources of Australia Ltd (ERA, Rio Tinto: 68.4 per cent), which operates the Ranger Mine in the Northern Territory of Australia, and Rössing Uranium Limited (Rio Tinto: 68.6 per cent) in Namibia, together with the Roughrider project (Rio Tinto: 100 per cent) in Canada’s Athabasca Basin, which is managed by the Group’s central exploration division. Uranium production of 6.7 million pounds (Rio Tinto share) was 5 per cent higher than in 2016 due to higher grades and mill throughput at Rössing. ERA continued to process existing stockpiles in 2017. The higher sales volumes were more than offset by lower prices, resulting in revenues decreasing by 9 per cent, and a loss incurred of US$26 million (2016: earnings of US$10 million). Also included in the loss was an expense to increase the provision for closure at ERA.
An impairment charge of US$177 million (post-tax, Rio Tinto share) was recognised during 2017 relating to Rössing, due to oversupply in the uranium market resulting in structural changes to forecast prices. This charge was excluded from underlying earnings.
Development projects The Jadar project in Serbia is a lithium-borate deposit that was discovered by Rio Tinto in 2004. If developed, it could supply a significant proportion of the global demand for lithium and borates. Findings so far are encouraging, and prefeasibility assessments are ongoing to confirm the economic business case for the project and to advance its environmental and socioeconomic impact assessments. On 24 July 2017, Rio Tinto signed a Memorandum of Understanding with the Government of Serbia to form a joint working group to progress the study and permitting phase of the project.
Work continued on the feasibility study for the Zulti South mine expansion at RBM in South Africa, which will maintain RBM’s low-cost smelting capacity and zircon production. The project remains one of the best undeveloped mineral sand deposits in the industry, given its large ilmenite resource with high rutile and zircon content in the overall mineral suite. Rio Tinto remains in discussion with North Atlantic Potash Inc. (NAPI), a subsidiary of JSC Acron, a world leader in fertiliser production, regarding the optimum development pathway for their exploration joint venture in Saskatchewan, Canada. On 28 October 2016, Rio Tinto and Chinalco signed a non-binding agreement to sell Rio Tinto’s entire stake in the Simandou project in Guinea to Chinalco. The Heads of Agreement (HOA) set out the proposed principal terms of the sale with the aim of signing a binding agreement. Considering uncertainties in development timing and selection of final infrastructure options, the project ore reserves have been written back to mineral resources. A JORC Table 1 release supporting the changes will be released to the ASX in conjunction with this Annual report (riotinto.com/JORC).
Outlook In 2017, metallurgical coal has been characterised by stronger than expected demand in China, coupled with supply disruptions, both in China and for seaborne exporters. 2017 premium hard coking coal prices averaged US$190 per tonne, supported by synchronous steel demand and production growth across all major metallurgical coal demand regions; a trading environment not observed since before the global financial crisis. Robust Chinese steel margins have supported a push for mill productivity, resulting in increased demand for higher quality coking coal, and encouraging coastal mills to increase seaborne imports. However, supply disruptions, such as Cyclone Debbie in early 2017, removed more than 10 million tonnes of Australian supply from the market, and this was followed by port maintenance and logistics bottlenecks in Queensland during the fourth quarter of 2017.
Meanwhile, supply-side reforms and new environmental policies in China removed Chinese domestic supply, creating a tightly constrained market and elevating prices well above marginal costs. Additional supply is expected to come to the market from Australia, Mozambique and the US in 2018 and 2019, potentially leading to lower prices than those achieved in 2017.
The uranium market remained oversupplied in 2017, with many market players along the value chain reporting excess inventories. The uranium spot price fell from US$26/lb in the first quarter to below US$21/lb for much of the year, until capacity curtailment announcements boosted spot prices as the year drew to a close. Adverse policy shifts in South Korea and Japan, as well as an increasingly competitive energy market in the US, have dampened the expected demand growth in these markets.
Market conditions for titanium dioxide continued to improve in 2017, with strengthening pigment prices supported by low inventory and tight supply. Consequently, feedstock demand has improved year-on-year, with RTIT’s sales volumes up significantly. RTIT will continue to flex production capacity to meet demand, while optimising working capital. Improved conditions have also been evident in the zircon market. The medium- and long-term view of these markets will continue to be driven by improving global economic conditions, urbanisation and demand growth in emerging markets, as per capita incomes rise.
Borates demand growth was primarily driven by the agriculture and construction sectors in 2017. Offtake across most regions held firm, although borates demand in China was impacted by environmental-related shutdowns during the third quarter. Rio Tinto Borates is focused upon increasing its share of higher value products to capture higher margin growth opportunities, while also improving safety performance and its cost position.

46 riotinto.com Strategic report 2017
Strategic report Governance report Financial statements Production, reserves and operations Additional information
46
Growth & Innovation
Growth & Innovation is responsible for finding, studying, developing and optimising assets so they are safe, productive and profitable. It supports Rio Tinto’s assets and helps them to achieve superior performance throughout their lifecycle by optimising value from the initial concept through to when a mine or processing facility is eventually closed. It works with, and through, Rio Tinto’s product groups to effectively deliver portfolio growth, drive innovative solutions, replicate and share best practice, and provide support for quality decision-making.
Strategy and strategic priorities Safety is the number one priority. It is a shared core value and Growth & Innovation is aligned to this integral part of Rio Tinto’s strategy when delivering in these key areas, in partnership with the product groups: ‒ Exploration: discovering or acquiring new high-quality deposits that
create business opportunities for Rio Tinto. ‒ Strategic planning: executing strategic shaping and long-term
production planning to ensure the right projects proceed with the optimal business case.
‒ Projects: providing centralised leadership to ensure Rio Tinto delivers successful major studies, and delivering major capital projects safely and efficiently, on time and on budget (or better), and ready for a seamless handover to operations.
‒ Oyu Tolgoi: managing the existing Oyu Tolgoi operations and the underground project in Mongolia to ensure Growth & Innovation safely maximises value delivery and ultimately transfers a successful business to the Copper & Diamonds product group.
‒ Productivity and support: Productivity & Technical Support is leading a step change in the Group’s mine to market productivity, as well as providing technical support to manage major hazard risks and support operational performance, and overseeing Rio Tinto’s innovation and automation platforms.
‒ Technology: Information Systems & Technology is delivering support in industrial and operational technology and delivery of enterprise services to Rio Tinto’s businesses.
Safety In 2017, there was a health-related death of a senior exploration field technician undertaking field reconnaissance work in the Pilbara. This was a solemn reminder of the critical health risks the team faces each day. The loss of a colleague has a profound effect on the entire team and galvanises the commitment to keeping health and safety priority number one.
Growth & Innovation achieved an all injury frequency rate of 0.26, representing a19 per cent improvement compared with 2016. Rio Tinto Projects reported an all injury frequency rate of 0.35, compared with 0.66 in 2016, during a year of increased high-risk activity. However, Exploration’s all injury frequency rate was 0.43 compared with 0.31 in 2016. Oyu Tolgoi underground project recorded the best safety performance of all Rio Tinto’s underground mines in 2017 with an all injury frequency rate of 0.39. The Bundoora Technical Development Centre, which celebrated 25 years of operation this year, achieved five years free of lost time injuries in May.
Putting safety first, driving down the number of injuries, and embedding the critical risk management (CRM) fatality prevention programme, have been priorities for Growth & Innovation in 2017. Exploration has piloted, adapted and implemented CRM. Rio Tinto Projects is completing more than 15,000 CRM verifications each month, with leaders focusing on identifying critical risks and verifying controls are in place.
Growth & Innovation is leading the implementation of Rio Tinto’s major hazard risk programme. These major hazard risks are underground safety, geotechnical and slope failures, tailings and water storage, and process safety risks. With the product groups, Growth & Innovation is implementing a programme of integrated risk assessments, leadership training, critical control verifications, improved assurance and transparent reporting and monitoring.
The East Waste Rock Extension project was awarded the Utah Safety Council’s prestigious Award of Merit for outstanding achievements in corporate safety programmes. This project completed significant works at Bingham Canyon Mine to prepare mined land for reclamation.
Performance Exploration Exploration creates value for Rio Tinto by safely delivering quality growth options to the Group through greenfield and brownfield opportunities and disciplined divestment of non-core discoveries. It also provides orebody knowledge and resource evaluation support to existing operations, new projects and opportunities identified through Rio Tinto Ventures.
At the end of 2017, Exploration was active in 15 countries and continued to assess opportunities across a range of commodities, including copper, nickel, iron ore, bauxite, diamonds and mineral sands. In 2017, Exploration’s commercial activities continued, providing access to new opportunities. Exploration partnerships were established in Chile, Canada, Zambia, Tanzania, Australia and China.
Along with bringing projects into the pipeline, Exploration actively reviews its portfolio, and seeks to exit and monetise projects that no longer meet target criteria. This active recycling of the portfolio provides additional cash flow to Rio Tinto and has, in certain periods, led to Exploration being a cash flow positive business. In the past decade, Rio Tinto has spent approximately US$1.8 billion on centrally controlled exploration, and has in turn generated US$1.9 billion from divestments.
A post-tax impairment of US$257 million was recognised relating to the Roughrider uranium deposit in Canada. Roughrider’s recoverable amount was determined to be nil following a decision in the first half of 2017 to cease further expenditure on the project. This charge was excluded from underlying earnings.
In 2017, Exploration increased investment and effort in the Pilbara region of Western Australia, to reinvigorate the search for high-grade iron ore mineralisation closer to existing infrastructure, while seeking opportunities in a range of other commodities. Rio Tinto also signed a partnership with Shore Gold on their Star-Orion South diamond project while also securing multiple other early-stage diamond opportunities in Canada. The signing of a technical collaboration agreement in 2017 between Rio Tinto and China’s Minmetals allows for the combination of knowledge, data and expertise in specific areas both inside and outside of China subject to future agreement.
The targeted capture of publicly available data and a focus on data accuracy and availability delivered efficiency improvements. In 2017, modern analytical techniques for mineral geochemistry, enabling better exploration targeting, were applied across several regions.
Expenditure on exploration and evaluation in 2017 was US$445 million. This represented a 10 per cent decrease compared with 2016 expenditure of US$497 million. Of the 2017 spend, US$204 million relates to centrally controlled exploration and evaluation activity. In total, Rio Tinto’s 2017 exploration and evaluation activity covered eight commodities across a range of greenfield and brownfield environments.
Evaluation Rio Tinto evaluates discoveries and projects, which are aligned to company strategy, ensuring the right projects proceed with the optimal business case. During evaluation, Growth & Innovation engages a broad range of stakeholders to protect and enhance our partner-to-operate position. The enduring relationships built during the exploration and evaluation stages are essential to future operational success.
Throughout 2017, Growth & Innovation applied a range of strategic planning processes and expertise to identify, analyse and select the optimal configuration and timing of greenfield and brownfield projects. This support was provided to projects in all of the product groups.
Extensive work continued on developing a pilot process for the Jadar project to enable production of both borates and lithium from the newly discovered mineral jadarite.
The Group’s major evaluation projects in 2017 were:
Project Commodity Country
La Granja Copper Peru
Resolution Copper US
Pilbara Iron ore Australia
Zulti South Mineral sands South Africa
Jadar Lithium/borates Serbia
Weipa Bauxite Australia
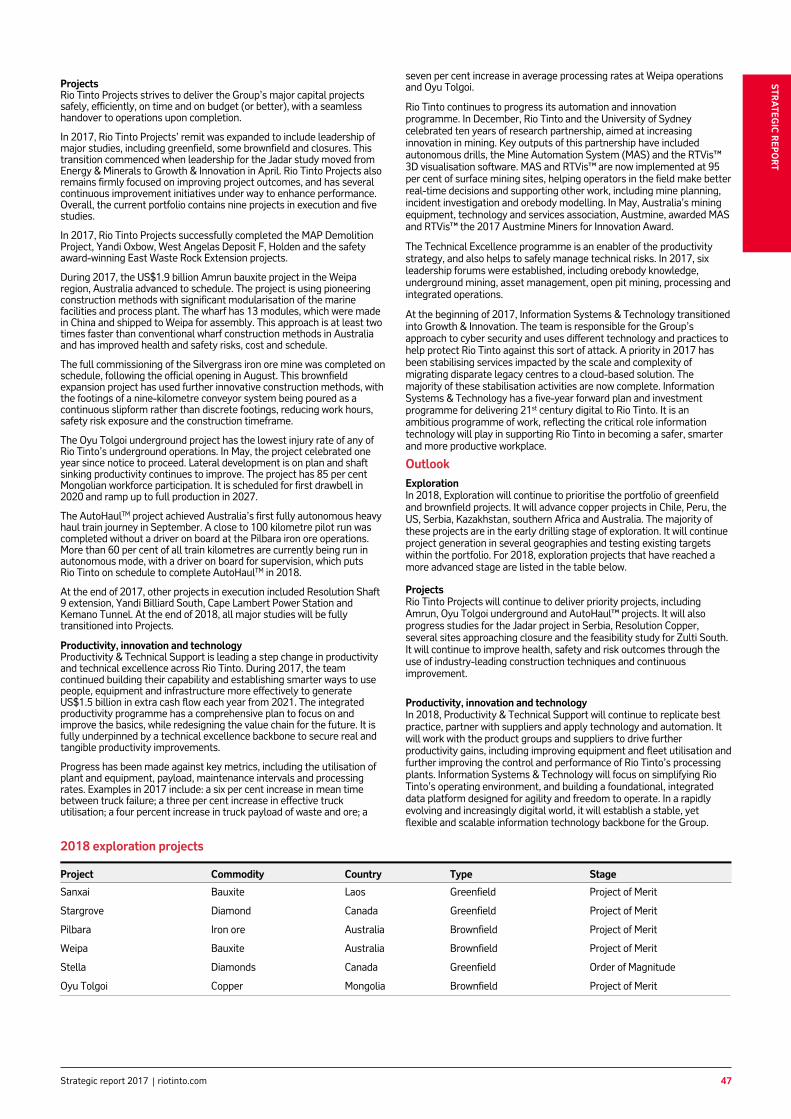
47Strategic report 2017 riotinto.com
STRA
TEGIC
REP
OR
T
Strategic report Governance report Financial statements Production, reserves and operations Additional information
47
Projects Rio Tinto Projects strives to deliver the Group’s major capital projects safely, efficiently, on time and on budget (or better), with a seamless handover to operations upon completion.
In 2017, Rio Tinto Projects’ remit was expanded to include leadership of major studies, including greenfield, some brownfield and closures. This transition commenced when leadership for the Jadar study moved from Energy & Minerals to Growth & Innovation in April. Rio Tinto Projects also remains firmly focused on improving project outcomes, and has several continuous improvement initiatives under way to enhance performance. Overall, the current portfolio contains nine projects in execution and five studies.
In 2017, Rio Tinto Projects successfully completed the MAP Demolition Project, Yandi Oxbow, West Angelas Deposit F, Holden and the safety award-winning East Waste Rock Extension projects.
During 2017, the US$1.9 billion Amrun bauxite project in the Weipa region, Australia advanced to schedule. The project is using pioneering construction methods with significant modularisation of the marine facilities and process plant. The wharf has 13 modules, which were made in China and shipped to Weipa for assembly. This approach is at least two times faster than conventional wharf construction methods in Australia and has improved health and safety risks, cost and schedule.
The full commissioning of the Silvergrass iron ore mine was completed on schedule, following the official opening in August. This brownfield expansion project has used further innovative construction methods, with the footings of a nine-kilometre conveyor system being poured as a continuous slipform rather than discrete footings, reducing work hours, safety risk exposure and the construction timeframe.
The Oyu Tolgoi underground project has the lowest injury rate of any of Rio Tinto’s underground operations. In May, the project celebrated one year since notice to proceed. Lateral development is on plan and shaft sinking productivity continues to improve. The project has 85 per cent Mongolian workforce participation. It is scheduled for first drawbell in 2020 and ramp up to full production in 2027.
The AutoHaulTM project achieved Australia’s first fully autonomous heavy haul train journey in September. A close to 100 kilometre pilot run was completed without a driver on board at the Pilbara iron ore operations. More than 60 per cent of all train kilometres are currently being run in autonomous mode, with a driver on board for supervision, which puts Rio Tinto on schedule to complete AutoHaulTM in 2018.
At the end of 2017, other projects in execution included Resolution Shaft 9 extension, Yandi Billiard South, Cape Lambert Power Station and Kemano Tunnel. At the end of 2018, all major studies will be fully transitioned into Projects.
Productivity, innovation and technology Productivity & Technical Support is leading a step change in productivity and technical excellence across Rio Tinto. During 2017, the team continued building their capability and establishing smarter ways to use people, equipment and infrastructure more effectively to generate US$1.5 billion in extra cash flow each year from 2021. The integrated productivity programme has a comprehensive plan to focus on and improve the basics, while redesigning the value chain for the future. It is fully underpinned by a technical excellence backbone to secure real and tangible productivity improvements.
Progress has been made against key metrics, including the utilisation of plant and equipment, payload, maintenance intervals and processing rates. Examples in 2017 include: a six per cent increase in mean time between truck failure; a three per cent increase in effective truck utilisation; a four percent increase in truck payload of waste and ore; a
seven per cent increase in average processing rates at Weipa operations and Oyu Tolgoi.
Rio Tinto continues to progress its automation and innovation programme. In December, Rio Tinto and the University of Sydney celebrated ten years of research partnership, aimed at increasing innovation in mining. Key outputs of this partnership have included autonomous drills, the Mine Automation System (MAS) and the RTVis™ 3D visualisation software. MAS and RTVis™ are now implemented at 95 per cent of surface mining sites, helping operators in the field make better real-time decisions and supporting other work, including mine planning, incident investigation and orebody modelling. In May, Australia’s mining equipment, technology and services association, Austmine, awarded MAS and RTVis™ the 2017 Austmine Miners for Innovation Award.
The Technical Excellence programme is an enabler of the productivity strategy, and also helps to safely manage technical risks. In 2017, six leadership forums were established, including orebody knowledge, underground mining, asset management, open pit mining, processing and integrated operations.
At the beginning of 2017, Information Systems & Technology transitioned into Growth & Innovation. The team is responsible for the Group’s approach to cyber security and uses different technology and practices to help protect Rio Tinto against this sort of attack. A priority in 2017 has been stabilising services impacted by the scale and complexity of migrating disparate legacy centres to a cloud-based solution. The majority of these stabilisation activities are now complete. Information Systems & Technology has a five-year forward plan and investment programme for delivering 21st century digital to Rio Tinto. It is an ambitious programme of work, reflecting the critical role information technology will play in supporting Rio Tinto in becoming a safer, smarter and more productive workplace.
Outlook Exploration In 2018, Exploration will continue to prioritise the portfolio of greenfield and brownfield projects. It will advance copper projects in Chile, Peru, the US, Serbia, Kazakhstan, southern Africa and Australia. The majority of these projects are in the early drilling stage of exploration. It will continue project generation in several geographies and testing existing targets within the portfolio. For 2018, exploration projects that have reached a more advanced stage are listed in the table below.
Projects Rio Tinto Projects will continue to deliver priority projects, including Amrun, Oyu Tolgoi underground and AutoHaul™ projects. It will also progress studies for the Jadar project in Serbia, Resolution Copper, several sites approaching closure and the feasibility study for Zulti South. It will continue to improve health, safety and risk outcomes through the use of industry-leading construction techniques and continuous improvement.
Productivity, innovation and technology In 2018, Productivity & Technical Support will continue to replicate best practice, partner with suppliers and apply technology and automation. It will work with the product groups and suppliers to drive further productivity gains, including improving equipment and fleet utilisation and further improving the control and performance of Rio Tinto’s processing plants. Information Systems & Technology will focus on simplifying Rio Tinto’s operating environment, and building a foundational, integrated data platform designed for agility and freedom to operate. In a rapidly evolving and increasingly digital world, it will establish a stable, yet flexible and scalable information technology backbone for the Group.
2018 exploration projects
Project Commodity Country Type Stage
Sanxai Bauxite Laos Greenfield Project of Merit
Stargrove Diamond Canada Greenfield Project of Merit
Pilbara Iron ore Australia Brownfield Project of Merit
Weipa Bauxite Australia Brownfield Project of Merit
Stella Diamonds Canada Greenfield Order of Magnitude
Oyu Tolgoi Copper Mongolia Brownfield Project of Merit

48 riotinto.com Strategic report 2017
Governance report Financial statements Production, reserves and operations Additional information
48
Five year review
Selected �nancial data
The selected consolidated �nancial information below has been derived from the historical audited consolidated �nancial statements of the Rio Tinto Group. The selected consolidated �nancial data should be read in conjunction with, and quali�ed in their entirety by reference to, the 2017 �nancial statements and notes thereto. The �nancial statements as included on pages 112 to 201 have been prepared in accordance with IFRS as de�ned in note 1.
Rio Tinto Group Income statement data
For the years ending 31 December Amounts in accordance with IFRS
2017US$m
2016US$m
2015 US$m
2014 US$m
2013US$m
Consolidated sales revenue 40,030 33,781 34,829 47,664 51,171 Group operating pro�t/(loss)(a) 14,135 6,795 3,615 11,346 7,430
Pro�t/(loss) for the year 8,851 4,776 (1,719 ) 6,499 1,079 Basic earnings/(losses) for the year per share (US cents) 490.4 256.9 (47.5 ) 353.1 198.4 Diluted earnings/(losses) for the year per share (US cents)(b) 486.9 255.3 (47.5 ) 351.2 197.3
Dividends per share 2017 2016 2015 2014 2013 Dividends declared during the year US cents – interim 110.0 45.0 107.5 96.0 83.5 – �nal 180.0 125.0 107.5 119.0 108.5 UK pence – interim 83.13 33.80 68.92 56.9 54.3 – �nal 129.43 100.56 74.21 78.0 65.8 Australian cents – interim 137.7 59.13 144.91 103.1 93.0 – �nal 228.5 163.62 151.89 153.0 120.14 Dividends paid during the year (US cents) – ordinary 235.0 152.5 226.5 204.5 178.0 Weighted average number of shares – basic (millions) 1,786.7 1,797.3 1,824.7 1,848.4 1,847.3 Weighted average number of shares – diluted (millions)(b) 1,799.5 1,808.6 1,824.7 1,858.7 1,857.7
Balance sheet data
at 31 December Amounts in accordance with IFRS
2017US$m
2016US$m
2015 US$m
2014 US$m
2013US$m
Total assets 95,726 89,263 91,564 107,827 111,025 Share capital/premium 8,666 8,443 8,474 9,053 9,410 Total equity/Net assets 51,115 45,730 44,128 54,594 53,502 Equity attributable to owners of Rio Tinto 44,711 39,290 37,349 46,285 45,886 (a) Group operating pro�t or loss includes the effects of charges and reversals resulting from impairments (other than impairments of equity accounted units) and pro�t and loss on disposals of interests in
businesses. Group operating loss or pro�t amounts shown above exclude equity accounted operations, �nance items, tax and discontinued operations.
(b) The effects of dilutive securities has not been taken into account when calculating diluted loss per share for the year ended 31 December 2015, in accordance with IAS 33 “Earnings Per Share”.
Directors’ approval statement
This Strategic report is delivered in accordance with a resolution of the board, and has been signed on behalf of the board by:
Jan du Plessis Chairman 28 February 2018

iStrategic report 2017 riotinto.com
STRA
TEGIC
REP
OR
T
Strategic report Governance report Financial statements Production, reserves and operations Additional information
i
Summary Remuneration Report: Annual statement by the Remuneration Committee chairman
Dear shareholders, On behalf of the board, I am pleased to introduce our 2017 directors’ remuneration report (the Remuneration Report).
The Remuneration Report has been prepared in accordance with applicable legislation and corporate governance guidelines in the UK and Australia. Australian legislation requires disclosures in respect of “key management personnel”, being those persons having authority and responsibility for planning, directing and controlling the activities of the Group. The key management personnel are, in addition to the directors, the members of the Executive Committee who are not directors. Throughout this Remuneration Report, the members of the Executive Committee are collectively referred to as “executives”. They are listed on page 55, with details of the positions held during the year and dates of appointment to those roles.
In addition to this introduction, the Remuneration Report is divided into two parts: the statement of remuneration policy, which summarises our policies and practices (the Remuneration Policy); and the annual report on remuneration, which shows how the Remuneration Policy has been applied (the Implementation Report).
Under UK legislation, the Remuneration Policy is subject to a triennial binding vote, while the Implementation Report (including this introduction) is subject to an annual advisory vote. The Remuneration Policy was last approved by shareholders in 2015 and accordingly will be submitted for shareholder approval at our AGMs in 2018. Under Australian legislation, the Remuneration Report as a whole is subject to an advisory vote. All remuneration related resolutions will be voted on at the AGMs as Joint Decision Matters by Rio Tinto plc and Rio Tinto Limited shareholders.
Remuneration Policy
As part of the triennial review of our Remuneration Policy, we consulted shareholders and other stakeholders in the UK and Australia.
While there was broad-based support for many of the changes and enhancements that we proposed, including an increased focus on fatalities in the safety component of the Short-Term Incentive Plan (STIP), our most significant proposal – to substitute Restricted Stock for the performance share awards (PSA) granted under the Long- Term Incentive Plan (LTIP) and significantly reduce the maximum quantum of the award – received a more mixed response.
The board and management remain of the view that Restricted Stock has considerable merits in a long-term cyclical industry such as mining. However, the new UK threshold, of an 80 per cent vote in favour for an “acceptable” outcome, represents a significant impediment for any company seeking to introduce an innovative remuneration scheme, particularly given the range of opinions that currently exist within the investor community. Following the shareholder consultation, we therefore decided to withdraw this proposal and to revert to a conventional LTIP structure. However, we are proposing to remove the performance measure relating to relative EBIT margin improvement for PSA granted under the LTIP, as it is complex, opaque and impossible to track during the performance period. As a result, vesting for PSA granted for 2018 will be subject to two equally weighted measures of relative total shareholder return (TSR) against the Euromoney Global Mining Index and the MSCI World Index. The combination of these two measures will align executives and shareholders by rewarding long-term, relative outperformance against the mining sector and the broader market. They also have the merit of being simple and transparent. We are also seeking shareholder approval for a new umbrella agreement – the Equity Incentive Plan (EIP) – that will govern all future long-term, share-based remuneration, including PSA and the
deferred element of the STIP as well as restricted share awards granted to employees below Executive Committee level. The EIP is being introduced to simplify, consolidate and ensure consistency between the provisions of various existing long-term incentive plans, notably with respect to malus and claw-back. Awards under the EIP will be granted in accordance with the prevailing Remuneration Policy. If approved, the 2018 PSA and deferred element of the STIP will be granted to executives under this Plan.
2018 decisions Consistent with prior practice, annual salary increases for executives are in line with the base salary increases applying to the broader employee population. The maximum opportunity for executives under the STIP also remains the same as last year. The 2018 safety measures, weightings and targets are fully disclosed on page 91. We expect to disclose the 2018 financial and individual targets retrospectively in the 2018 Implementation Report.
The level of PSA to be granted to executives in May 2018, as a percentage of base salary, will be broadly equivalent to those made in 2017. Consistent with our practice since 1998, the awards made are calculated using the average share price over the previous calendar year. As such, the PSA awards granted in 2018 will be calculated using the 2017 average share prices of £34.10 and A$65.23. Our decision to use average prices over the year, rather than spot prices, is intended to mitigate the impact of share price volatility. The performance conditions for the 2018 PSA are set out in the Implementation Report.
2017 performance and remuneration The 2017 single total figure of remuneration for the chief executive, Jean-Sébastien Jacques, is higher than the previous year, mainly because 2017 was J-S’s first full year as chief executive.
For the chief financial officer, Chris Lynch, the single total figure of remuneration is also higher than in 2016. This is mainly due to the higher value of share awards vesting in 2017, partly offset by a lower STIP award.
Short-Term Incentive Plan On pages 82, 84 and 86 of this Report, we retrospectively disclose the financial and individual STIP targets, set by the board for 2017. While most of the 2017 targets were achieved, the overall 2017 STIP awards for both executive directors, expressed as a percentage of the maximum award, are lower than last year. Further details are given below.
Short-Term Incentive Plan – Safety In October 2017, a colleague died at our Rio Tinto Kennecott operation in Utah and there was a health related death of a colleague undertaking field reconnaissance work in the Pilbara, Australia. As a result, we did not achieve our goal of zero fatalities during calendar year 2017.
Given that fatalities occurred in 2017, reductions were applied as required by the Policy, with the safety results for the chief executive and the chief financial officer being reduced from 49.5 per cent of maximum to 37 per cent and 42 per cent, respectively. These adjustments reflect the level of oversight they had for safety leadership during the year. Similarly, downward adjustments were made for certain other executives.
The combined performance against our all injury frequency rate (AIFR), lost time injury (LTI) and critical risk management (CRM) fatality prevention programme targets resulted in a STIP safety result for the Group broadly equal to ‘‘target’’, with one product group achieving an above ‘‘target’’ STIP safety result and three product groups achieving below ‘‘target’’ STIP safety results.
Short-Term Incentive Plan – Financial The underlying ‘‘unflexed’’ earnings and STIP free cash flow achieved by the Group in 2017 were between ‘‘target’’ and ‘‘outstanding’’. The underlying ‘‘flexed’’ earnings and STIP free cash flow results were slightly below ‘‘target’’.
The Committee made adjustments to the targets in 2017 to take account of events outside management’s control and to ensure a like-for-like comparison with the targets.
The most significant adjustment in 2017 related to the impact on iron ore shipments of unfavourable weather conditions across northern Western Australia in 2017 that significantly exceeded 2017 plan assumptions. Other significant adjustments related to the disposal of Coal & Allied in September 2017, the strike in the non-managed

ii riotinto.com Strategic report 2017
Strategic report Governance report Financial statements Production, reserves and operations Additional information
ii
operations in Escondida, and the write-down of deferred tax assets in relation to the Grasberg operation.
The net impact of all adjustments, both positive and negative, increased the Group’s result against the financial targets from 56 per cent of maximum to 67 per cent of maximum (2016: from 83.5 per cent to 83 per cent of the maximum). This was a larger net impact than in previous years, and therefore the Committee paid particular attention to all the proposed adjustments to ensure that they were in accordance with agreed principles.
Long-Term Incentive Plan The PSA granted under the LTIP in 2013 had three equally weighted performance metrics: TSR relative to the Euromoney Global Mining Index; TSR relative to the MSCI World Index; and improvement in EBIT margin relative to global mining comparators.
Rio Tinto outperformed against the Mining Index, but under-performed against the MSCI World Index, resulting in a 33.3 per cent award under these two components, out of a maximum of 66.7 per cent. This outcome reflects the design intention that executives should not unduly benefit from windfall gains when commodity prices are high, nor suffer when prices are low.
The estimated performance against the EBIT margin measure is that Rio Tinto ranked no.3 against a comparator group of 11, which would result in a vesting of 90.98 per cent for this measure (representing 30.33 per cent of the total award). We can only provide an estimate at this time as we do not have the reported data for all the comparator companies. As noted above, we propose to remove this measure from PSA granted under the LTIP from 2018.
Overall, the estimated vesting for the award when the TSR and EBIT margin portions are combined is 63.66 per cent of maximum. The
Committee gave consideration to the Group’s overall performance during the five-year performance period and concluded that vesting of awards was justified. As a consequence, the portion of the award relating to TSR vested on 19 February 2018. The Committee will make a final determination of the relative improvement in EBIT margin measure when the details of the margin performance of the comparator group companies become available in May 2018. If applicable, this portion of the award will vest on 31 May 2018.
Gender pay The Company continues to monitor both equal pay and the gender pay gap across the Group. While we have made good progress in ensuring equal pay for equal work, we need to focus on the relatively low level of gender diversity in senior management roles in order to continue to close the gender pay gap in all locations. Further details of both equal pay and the gender pay gap, together with the steps we are taking to address this issue, are provided on page 37 of the Report. Yours sincerely,
Simon Thompson
Remuneration Committee chairman
References to page numbers in this letter and the pages following are references to relevant page numbers in the 2017 Annual report. This is available online at riotinto.com/ar2017

iiiStrategic report 2017 riotinto.com
STRA
TEGIC
REP
OR
T
Strategic report Financial statements Production, reserves and operations Additional information
iii
Remuneration Summary - Single total figure of remuneration
The table below provides the single total figure of remuneration for each individual who acted as an executive director during 2017, with appropriate prior year comparison figures, in accordance with UK legislation. The amounts in this table are stated in currency of actual payment. This is in addition to the Australian statutory disclosure requirements set out in US dollars in Table 1a on pages 97 and 98 of the 2017 Annual report which include theoretical accounting values relating to various parts of the remuneration package, most notably Performance Share Awards (PSA) granted under the Group’s Long-Term Incentive Plan (LTIP) arrangements, and require a different methodology for calculating the pension value.
Jean-Sébastien Jacques (chief executive)
(stated in £‘000) 2017 2016 2015Base salary paid 1,080 887 546STIP payment – cash 792 732 465STIP payment – deferred shares(b) 793 732 465Total short-term pay 2,665 2,351 1,476Value of LTIP awards vesting(c) 694 497 58Pension(d) 269 225 130Other benefits(e) 58 43 31Single total figure of remuneration 3,686 3,116 1,695Percentage change in total remuneration (2017 versus 2016; 2016 versus 2015) 18.3% 83.8% Percentage of total remuneration provided as performance-related pay (STIP and LTIP) 61.8% 62.9% 58.3%Percentage of total remuneration provided as non-performance-related pay (base salary, pension and other benefits) 38.2% 37.1% 41.7%Percentage of maximum STIP awarded(f) 73.4% 82.4% 84.0%Percentage of maximum STIP forfeited 26.6% 17.6% 16.0%Percentage of target STIP awarded 122.3% 139.9% 168.1%Percentage of PSA vesting(g) 63.7% 50.5% 65.4%Percentage SOP award vesting(g) – – –
The increase in the single total figure of remuneration is due mainly to the higher base salary paid and the higher STIP award in 2017 compared with 2016 due to 2017 being Jean-Sébastien’s first full year as chief executive. The value of LTIP awards vesting was also higher in 2017.
(a) Salary paid in the financial year to 31 December. Salaries are generally reviewed with effect from 1 March. However, in 2016 Jean-Sébastien’s base salary was increased from £553,300 to £800,000 on appointment as deputy chief executive with effect from 17 March 2016 and increased to £1,080,000 on appointment as chief executive with effect from 2 July 2016. The salary and single figure of remuneration for 2015 relates to his positions as chief executive, Copper & Coal for the period 1 March 2015 to 31 December 2015 and as chief executive, Copper for the period 1 January 2015 to 28 February 2015.
(b) Value of STIP deferred, the vesting of which is subject to the Plan rules.
(c) Based on the estimated value of the PSA, including dividend shares where applicable, which vested on 19 February 2018 (TSR portion) and which are anticipated to vest at the end of May 2018 (EBIT margin portion) for the performance period that ended 31 December 2017 and the PSA which vested for the performance periods that ended 31 December 2016 and 31 December 2015. A total of 25,683 shares were granted under the 2013 PSP which had a performance period which ended on 31 December 2017. It is estimated that a total of 19,126 shares, inclusive of an estimated 2,777 dividend shares will vest. The Rio Tinto plc share price used to calculate the estimated value of the award vesting with respect to 2017 is the average share price over the last quarter of 2017 of £36.27. The performance conditions for awards vesting for the period ending 31 December 2017 are detailed in the notes to table 3 on page 104.
The estimated value of LTIP awards for 2016 included in the 2016 Annual report was £501,000 compared with the restated actual value of £497,000. This was calculated based on an estimate of the vesting of the EBIT margin portion of the award of 100 per cent resulting in a total estimated vesting of 58.0 per cent. The lower actual vesting of the EBIT margin portion of the award of 77.5 per cent, based on a rank of no.3 against the comparator group of 11, resulted in a total actual vesting of 50.5 per cent. The impact of the lower vesting level was offset by higher share prices at the time of vesting (£36.18 for the TSR portion which vested on 20 February 2017 and £31.08 for the EBIT margin portion which vested on 31 May 2017) compared with the average share price over the last quarter of 2016 of £29.30 which was used to calculate the estimated value.
(d) Pension reflects the value of the pension contribution and payment in lieu of pension paid during the year.
(e) Includes healthcare, allowance for professional tax services and car allowance.
(f) The maximum potential STIP award is 200 per cent of base salary.
(g) Jean-Sébastien has received no awards under the Share Option Plan (SOP).
Chris Lynch (chief financial officer)
(stated in £‘000) 2017 2016 2015Base salary paid(a) 853 836 834STIP payment – cash 615 717 690STIP payment – deferred shares(b) 616 718 690Total short-term pay 2,084 2,271 2,214Value of LTIP awards vesting(c) 1,407 1,008 0Pension(d) 221 209 208Other benefits(e) 97 144 151Single total figure of remuneration 3,809 3,632 2,573Percentage change in total remuneration (2017 versus 2016; 2016 versus 2015) 4.9% 41.2% Percentage of total remuneration provided as performance-related pay (STIP and LTIP) 69.3% 67.3% 53.6%Percentage of total remuneration provided as non-performance-related pay (base salary, pension and other benefits) 30.7% 32.7% 46.4%Percentage of maximum STIP awarded(f) 71.9% 85.8% 82.5%Percentage of maximum STIP forfeited 28.1% 14.2% 17.5%Percentage of target STIP awarded 119.8% 143.0% 137.5%Percentage of PSA vesting(g) 63.7% 50.5% –Percentage SOP award vesting(g) – – –
The increase in the single total figure of remuneration is due mainly to the higher value of LTIP awards vesting in 2017 compared with 2016, partly offset by the lower STIP award in 2017 compared with 2016.
(a) Salary paid in the financial year to 31 December. Salaries are generally reviewed with effect from 1 March. Chris received a 2.4 per cent salary increase effective 1 March 2017.
(b) Value of STIP deferred, the vesting of which is subject to the Plan rules. (c) Based on the estimated value of the PSA, including dividend shares, which vested on
19 February 2018 (TSR portion) and which are anticipated to vest at 31 May 2018 (EBIT margin portion) for the performance period that ended 31 December 2017 and PSA which vested for the performance periods that ended 31 December 2016 and 31 December 2015. A total of 52,085 shares were granted under the 2013 PSP which had a performance period which ended on 31 December 2017. It is estimated that a total of 38,790 shares, inclusive of an estimated 5,633 dividend shares will vest. The Rio Tinto plc share price used to calculate the estimated value of the award vesting with respect to 2017 is the average share price over the last quarter of 2017 of £36.27. The performance conditions for awards vesting for the period ending 31 December 2017 are detailed in the notes to table 3 on page 104.
The estimated value of the LTIP awards for 2016 included in the 2016 Annual report was £1,016,000 compared with the restated actual value of £1,008,000. This was calculated based on an estimate of the vesting of the EBIT margin portion of the award of 100 per cent resulting in a total estimated vesting of 58.0 per cent. The lower actual vesting of the EBIT margin portion of the award of 77.5 per cent, based on a ranking of no.3 against the comparator group of 11, resulted in a total actual vesting of 50.5 per cent. The impact of the lower vesting level was offset by higher share prices at the time of vesting (£36.18 for the TSR portion which vested on 20 February 2017 and £31.08 for the EBIT margin portion which vested on 31 May 2017) compared with the average share price over the last quarter of 2016 of £29.30 which was used to calculate the estimated value.
(d) Pension reflects the value of the pension contribution and payment in lieu of pension paid during the year.
(e) Includes healthcare, allowance for professional tax services and car allowance. (f) The maximum potential STIP award is 200 per cent of base salary. (g) Chris had no LTIP awards vest in respect of the performance periods that ended prior to
31 December 2016 as he received no LTIP awards prior to the award made in 2013. He has received no awards under the SOP.
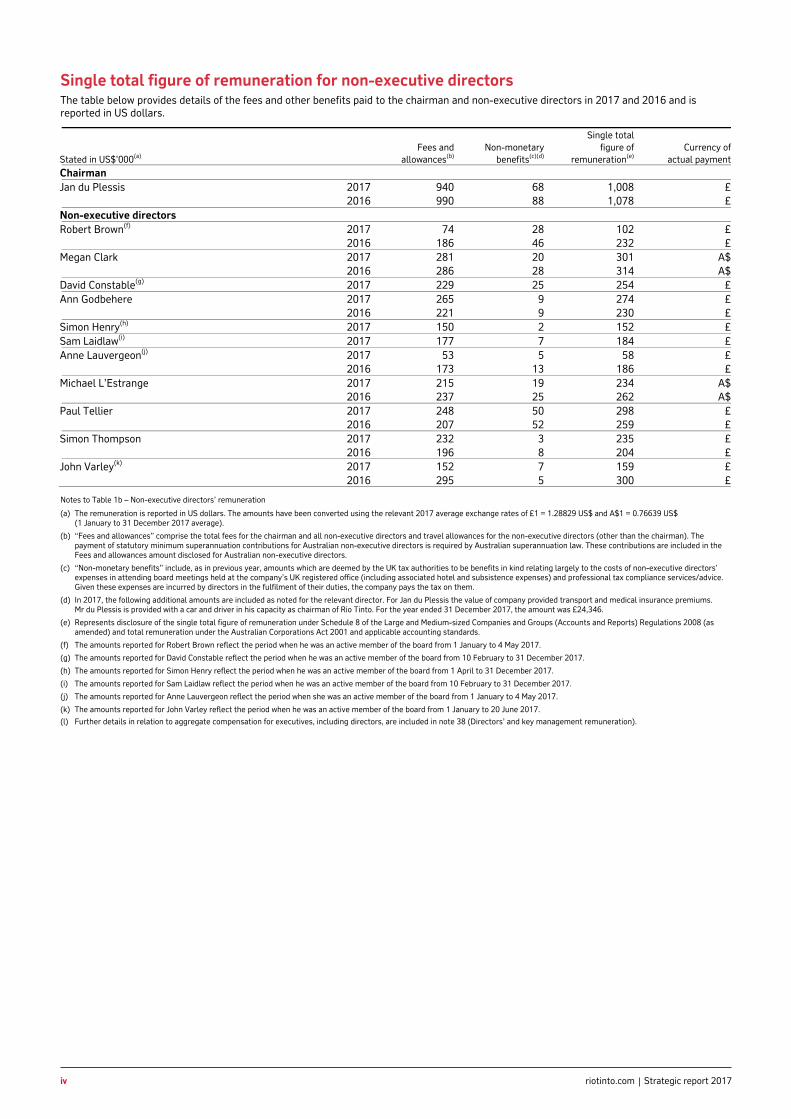
iv riotinto.com Strategic report 2017
Strategic report Financial statements Production, reserves and operations Additional information
iv
Single total figure of remuneration for non-executive directors The table below provides details of the fees and other benefits paid to the chairman and non-executive directors in 2017 and 2016 and is reported in US dollars.
Single total Fees and Non-monetary figure of Currency ofStated in US$’000(a) allowances(b) benefits(c)(d) remuneration(e) actual paymentChairman Jan du Plessis 2017 940 68 1,008 £ 2016 990 88 1,078 £Non-executive directors Robert Brown(f) 2017 74 28 102 £ 2016 186 46 232 £Megan Clark 2017 281 20 301 A$ 2016 286 28 314 A$David Constable(g) 2017 229 25 254 £Ann Godbehere 2017 265 9 274 £ 2016 221 9 230 £Simon Henry(h) 2017 150 2 152 £Sam Laidlaw(i) 2017 177 7 184 £Anne Lauvergeon(j) 2017 53 5 58 £ 2016 173 13 186 £Michael L’Estrange 2017 215 19 234 A$ 2016 237 25 262 A$Paul Tellier 2017 248 50 298 £ 2016 207 52 259 £Simon Thompson 2017 232 3 235 £ 2016 196 8 204 £John Varley(k) 2017 152 7 159 £ 2016 295 5 300 £ Notes to Table 1b – Non-executive directors’ remuneration
(a) The remuneration is reported in US dollars. The amounts have been converted using the relevant 2017 average exchange rates of £1 = 1.28829 US$ and A$1 = 0.76639 US$ (1 January to 31 December 2017 average).
(b) “Fees and allowances” comprise the total fees for the chairman and all non-executive directors and travel allowances for the non-executive directors (other than the chairman). The payment of statutory minimum superannuation contributions for Australian non-executive directors is required by Australian superannuation law. These contributions are included in the Fees and allowances amount disclosed for Australian non-executive directors.
(c) “Non-monetary benefits” include, as in previous year, amounts which are deemed by the UK tax authorities to be benefits in kind relating largely to the costs of non-executive directors’ expenses in attending board meetings held at the company’s UK registered office (including associated hotel and subsistence expenses) and professional tax compliance services/advice. Given these expenses are incurred by directors in the fulfilment of their duties, the company pays the tax on them.
(d) In 2017, the following additional amounts are included as noted for the relevant director. For Jan du Plessis the value of company provided transport and medical insurance premiums. Mr du Plessis is provided with a car and driver in his capacity as chairman of Rio Tinto. For the year ended 31 December 2017, the amount was £24,346.
(e) Represents disclosure of the single total figure of remuneration under Schedule 8 of the Large and Medium-sized Companies and Groups (Accounts and Reports) Regulations 2008 (as amended) and total remuneration under the Australian Corporations Act 2001 and applicable accounting standards.
(f) The amounts reported for Robert Brown reflect the period when he was an active member of the board from 1 January to 4 May 2017.
(g) The amounts reported for David Constable reflect the period when he was an active member of the board from 10 February to 31 December 2017.
(h) The amounts reported for Simon Henry reflect the period when he was an active member of the board from 1 April to 31 December 2017.
(i) The amounts reported for Sam Laidlaw reflect the period when he was an active member of the board from 10 February to 31 December 2017.
(j) The amounts reported for Anne Lauvergeon reflect the period when she was an active member of the board from 1 January to 4 May 2017.
(k) The amounts reported for John Varley reflect the period when he was an active member of the board from 1 January to 20 June 2017.
(l) Further details in relation to aggregate compensation for executives, including directors, are included in note 38 (Directors’ and key management remuneration).

vStrategic report 2017 riotinto.com
STRA
TEGIC
REP
OR
T
Summary shareholder information
Dividends Both companies have paid dividends on their ordinary shares every year since incorporation in 1962. The process by which Rio Tinto shareholders receive dividends is explained under the description of the DLC structure on page 250.
Dividend policy The dividend policy adopted by the board in February 2016 provides that, at the end of each financial period, the board will determine an appropriate total level of ordinary dividend per share, taking into account the results for the financial year, the outlook for our major commodities, the board’s view of the long-term growth prospects of the business and the company’s objective of maintaining a strong balance sheet. The intention is that the balance between the interim and final dividend is weighted to the final dividend.
The board expects total cash returns to shareholders over the longer term to be in a range of 40 to 60 per cent of underlying earnings in aggregate through the cycle.
The board is committed to maintaining an appropriate balance between cash returns to shareholders and investment in the business, with the intention of maximising shareholder value.
Acknowledging the cyclical nature of the industry, in periods of strong earnings and cash generation, it is the board’s intention to supplement the ordinary dividends with additional returns to shareholders.
Dividend determination The majority of our sales are transacted in US dollars, making this the most appropriate measure for our global business performance. It is our main reporting currency and, consequently, the natural currency for dividend determination. Dividends determined in US dollars are translated at exchange rates prevailing two days prior to the declaration and payable in sterling by Rio Tinto plc and in Australian dollars by Rio Tinto Limited.
On request, shareholders of Rio Tinto plc can elect to receive dividends in Australian dollars and Rio Tinto Limited shareholders can elect to receive dividends in pounds sterling. If such an election is made, the dividend amounts received will be calculated by converting the declared dividend using the exchange rates applicable to sterling and Australian dollars – five days prior to the dividend payment date.
Shareholders who wish to receive their dividends in any other currencies should contact the companies’ share registrars, who offer payment services in other currencies, subject to a fee.
2017 dividends The 2017 interim and final dividends were determined at 110.00 US cents and at 180.00 US cents per share respectively and the applicable conversion rates for the interim and final dividend were US$1.32315 and US$1.39075 to the pound sterling and US$0.79875 and US$0.78765 to the Australian dollar respectively. For those Rio Tinto plc shareholders who elected to receive their interim dividend in Australian dollars the applicable conversion rate was A$1.67325 to the pound sterling and for Rio Tinto Limited shareholders who elected to receive their dividend in sterling the applicable conversion rate was £0.59764 to the Australian dollar.
Final dividends of 129.43 pence or 228.53 Australian cents per share will be paid on 12 April 2018. For those Rio Tinto plc shareholders requesting the 2017 final dividend be paid in Australian dollars, those holders of Rio Tinto plc ADRs (each representing one share) and those Rio Tinto Limited shareholders requesting the 2017 final dividend be paid in pounds sterling, the applicable conversion rates will be determined on 5 April 2018.
Dividend reinvestment plan (DRP) Rio Tinto offers a DRP to registered shareholders, which provides the opportunity to use cash dividends to purchase Rio Tinto shares in the market.

vi riotinto.com Strategic report 2017
Strategic report Governance report Financial statements Production, reserves and operations Additional information
vi
Contact details
Registered offices Rio Tinto plc 6 St James’s Square London SW1Y 4AD Registered in England No. 719885 Telephone: +44 (0) 20 7781 2000 Website: riotinto.com
Rio Tinto Limited Level 7 360 Collins Street Melbourne Victoria 3000 ABN 96 004 458 404
Telephone: +61 (0) 3 9283 3333 Fax: +61 (0) 3 9283 3707 Website: riotinto.com
Rio Tinto’s agent in the US is Cheree Finan, who may be contacted at Rio Tinto Services Inc. 80 State Street Albany, NY 12207-2543
Shareholders Please refer to the Investor Centre of the respective registrar if you have any queries about your shareholding.
Rio Tinto plc Computershare Investor Services PLC The Pavilions Bridgwater Road Bristol BS99 6ZZ
Telephone: +44 (0) 370 703 6364 Fax: +44 (0) 370 703 6119 UK residents only, Freephone: 0800 435021 Website: computershare.com
Holders of Rio Tinto American Depositary Receipts (ADRs) Please contact the ADR administrator if you have any queries about your ADRs.
ADR administrator JPMorgan Chase & Co PO Box 64504 St. Paul, MN 55164-0854
Telephone: +1 (651) 453 2128 US residents only, toll free general: (800) 990 1135 US residents only, toll free Global invest direct: (800) 428 4267 Website: adr.com Email: [email protected]
Rio Tinto Limited Computershare Investor Services Pty Limited GPO Box 2975 Melbourne Victoria 3001
Telephone: +61 (0) 3 9415 4030 Fax: +61 (0) 3 9473 2500 Australian residents only, toll free: 1800 813 292 New Zealand residents only, toll free: 0800 450 740 Website: computershare.com
Former Alcan Inc. shareholders Computershare Investor Services Inc. 8th Floor 100 University Avenue Toronto, ON M5J 2Y1
Telephone: +1 514-982-7555 North American residents only, toll free: +1 (800) 564-6253 Website: computershare.com
Investor Centre Investor Centre is Computershare’s free, secure, self-service website, where shareholders can manage their holdings online. The website enables shareholders to:
– View share balances – Change address details – View payment and tax information – Update payment instructions
In addition, shareholders who register their email address on Investor Centre can be notified electronically of events such as annual general meetings, and can receive shareholder communications such as the Annual report or Notice of meeting electronically online.
Rio Tinto plc shareholders Website: investorcentre.co.uk/riotinto
Rio Tinto Limited shareholders Website: investorcentre.com/rio

viiStrategic report 2017 riotinto.com
STRA
TEGIC
REP
OR
T
Notes

viii riotinto.com Strategic report 2017
Notes

Financial calendar
201815 January Fourth quarter 2017 operations review (Sydney 16 January)
7 February Announcement of results for 2017
1 March Rio Tinto plc and Rio Tinto Limited ordinary shares quoted “ex-dividend” for the 2017 final dividend
1 March Rio Tinto plc ADRs quoted “ex-dividend” for the 2017 final dividend
1 March Publication of 2017 Annual report, 20-F and Notices of annual general meetings
2 March Record date for the 2017 final dividend for Rio Tinto plc and Rio Tinto Limited shares and Rio Tinto plc ADRs
20 March Final date for elections under the Rio Tinto plc and Rio Tinto Limited dividend reinvestment plans and under facilities for dividends to be paid in alternative currency for the 2017 final dividend
5 April Dividend currency conversion date (Rio Tinto plc holders electing to receive Australian dollars and Rio Tinto Limited holders electing to receive pounds sterling)
11 April Annual general meeting for Rio Tinto plc, London
12 April Payment date for the 2017 final dividend to holders of ordinary shares and ADRs
17 April First quarter 2018 operations review (Sydney 18 April)
2 May Annual general meeting for Rio Tinto Limited, Melbourne
16 July Second quarter 2018 operations review (Sydney 17 July)
1 August Announcement of half year results for 2018
9 August Rio Tinto plc and Rio Tinto Limited ordinary shares quoted “ex-dividend” for the 2018 interim dividend
9 August Rio Tinto plc ADRs quoted “ex-dividend” for the 2018 interim dividend
10 August Record date for the 2018 interim dividend for Rio Tinto plc and Rio Tinto Limited shares and Rio Tinto plc ADRs
30 August Final date for elections under the Rio Tinto plc and Rio Tinto Limited dividend reinvestment plans and under facilities for dividends to be paid in alternative currency for the 2018 interim dividend
13 September Dividend currency conversion date (Rio Tinto plc holders electing to receive Australian dollars and Rio Tinto Limited holders electing to receive pounds sterling)
20 September Payment date for the 2018 interim dividend to holders of ordinary shares and ADRs
15 October Third quarter 2018 operations review (Sydney 16 October)
2019January Fourth quarter 2018 operations review
February Announcement of results for 2018
April Annual general meeting for Rio Tinto plc, London
April First quarter 2019 operations review
May Annual general meeting for Rio Tinto Limited, Perth
July Second quarter 2019 operations review
August Announcement of half year results for 2019
October Third quarter 2019 operations review
ixStrategic report 2017 riotinto.com

Printed by Park Communications on FSC® certified paper.
Park is an EMAS-certified company and its Environmental Management System is certified to ISO 14001.
100% of the inks used are vegetable oil based, 95% of press chemicals are recycled for further use and, on average 99% of any waste associated with this production will be recycled.
This document is printed on Edixion Offset, a paper containing 100% Environmental Chlorine Free (ECF) virgin fibre sourced from well-managed, responsible, FSC® certified forests.
Designed by SampsonMay sampsonmay.com
Typesetting and formatting by Donnelley Financial Solutions dfsco.com
Get more information onlineFind out more about our business and performance:riotinto.com
View our 2017 Annual report:riotinto.com/ar2017
View our 2017 Sustainable development online report:riotinto.com/sd2017