ring trial final report with appendix 1 and 2
TRANSCRIPT

Government Chemist CBD Food and Cosmetic Ring Trial Final Report Cannabidiol and controlled cannabinoids T. Hambidge

Page 2 of 62 Government Chemist CBD Food and Cosmetic Ring Trial – T. Hambidge
Government Chemist CBD Food and Cosmetic Ring Trial Final Report
LGC
Queens Road
Teddington
Middlesex
TW11 0LY
Contact Point:
Chris Hopley
Tel: 020 8943 7678
Prepared by:
Tabatha Hambidge
Authorised by:
Julian Braybrook
Date: 10 June 2021

Page 3 of 62 Government Chemist CBD Food and Cosmetic Ring Trial – T. Hambidge
This project was generously funded by the Department for Business, Energy &
Industrial Strategy (BEIS), the Food Standards Agency (FSA), the Home Office and
the Office for Product Safety & Standards (OPSS). This project was also carried out
in collaboration with Food Standards Scotland (FSS) and the Defence Science and
Technology Laboratory (DSTL).

Page 4 of 62 Government Chemist CBD Food and Cosmetic Ring Trial – T. Hambidge
1 Contents 1 Contents ........................................................................................................................ 4
2 Summary ....................................................................................................................... 5
3 Samples ......................................................................................................................... 6
3.1 LGC-RT/20/A .......................................................................................................... 6
3.2 LGC-RT/20/B .......................................................................................................... 6
3.3 LGC-RT/20/C .......................................................................................................... 6
4 Homogeneity .................................................................................................................. 7
5 Shipping ......................................................................................................................... 8
6 Ring Trial Results ........................................................................................................... 8
6.1 Technologies .......................................................................................................... 8
6.2 CBD ...................................................................................................................... 10
6.2.1 Method Information ........................................................................................ 10
6.2.2 CBD Consensus Values ................................................................................ 11
6.2.3 CBD z-Score Calculations and Interpretations ............................................... 12
6.3 Controlled Cannabinoids ....................................................................................... 19
6.3.1 Method Information ........................................................................................ 19
6.3.2 Cannabinoid Consensus Values .................................................................... 20
6.3.3 Cannabinoid Z-Score Calculations and Interpretations .................................. 21
6.3.5 THCV Results ................................................................................................ 22
6.3.6 CBN Results .................................................................................................. 25
6.3.7 ∆9-THC .......................................................................................................... 31
6.3.8 ∆8-THC .......................................................................................................... 36
6.3.9 ∆9THCA-A ..................................................................................................... 37
6.4 Result Trends ....................................................................................................... 37
6.5 Controlled Status in the UK ................................................................................... 38
7 Conclusions ................................................................................................................. 38
8 Participating Laboratories ............................................................................................ 39
9 Appendix 1 - Protocol ................................................................................................... 40
10 Appendix 2 – Results Template ................................................................................ 60

Page 5 of 62 Government Chemist CBD Food and Cosmetic Ring Trial – T. Hambidge
2 Summary Cannabidiol (CBD) products have rapidly entered the UK market in a variety of forms, including food and cosmetics. Laboratories across the UK need to be able to accurately measure the CBD content as well as the controlled cannabinoid content in commercially available products. CBD and cannabinoids have been highlighted as difficult compounds to analyse, and so a ring trial began under the Government Chemist programme to assess laboratories’ performance in measuring these analytes. The aim of the ring trial was to share and compare methods for quantifying CBD and controlled cannabinoids in food and cosmetics among testing laboratories. LGC shared details of their CBD and controlled cannabinoid methods. Participating laboratories could either use LGC’s method or their own to analyse provided samples for CBD and, optionally, controlled cannabinoids (Table 1). Three commercial samples were sourced from a high street retailer and analysed for the presence of any CBD or controlled cannabinoid content. Each sample was mixed in bulk and then distributed into > 40 bottles. The samples were then tested for homogeneity. The bottles were dispatched to 35 laboratories (16 UK, 19 International). Participants were asked to analyse the samples in singlicate on three separate days. A reporting template was provided for participants to fill out and return to LGC. 32 result templates were returned to LGC (14 UK, 18 international), however, not all of them were completed sets. Overall, the ring trial was a successful international study. There was good agreement of results between most laboratories. An interesting set of data was shared including instrument types and limits of detection which helped assess the capability of testing laboratories.
Table 1. Cannabinoids of interest.
Cannabinoid Abbreviation CAS Number Controlled Status Cannabidiol CBD 13956-29-1 No
Delta-9-tetrahydrocannabinol*
∆9-THC 1972-08-3 Yes
Delta-9-tetrahydrocannabivarin*
THCV 31262-37-0 Yes
Cannabinol* CBN 521-35-7 Yes Delta-8-
tetrahydrocannabinol* ∆8-THC 5957-75-5 Yes
Delta 9-Tetrahydrocannabinolic
acid* ∆9THCA-A 23978-85-0
No - but readily converts to THC
*Optional

Page 6 of 62 Government Chemist CBD Food and Cosmetic Ring Trial – T. Hambidge
3 Samples The samples were sourced from a high street retailer in November, 2020. The samples were stored at ambient temperature throughout analysis and shipping. The samples were prepared as follows:
3.1 LGC-RT/20/A
– 5% CBD Hemp Oil, 30 mL (Food) After initial testing, the sample was found to contain high levels of controlled cannabinoids. It was therefore diluted five times in olive oil. ~ 60 mL of sample (two bottles) were diluted in 240 mL olive oil in a DURAN® bottle. The sample was mixed overnight with a magnetic stirrer bar. While the sample was still being mixed, 5.2 mL aliquots were transferred into 8 mL plastic bottles labelled LGC-RT/20/A CBD Hemp Oil. The sample was aliquoted in bottle order 1 – 41. The sample was then reanalysed and determined suitable for shipping. Sample A had an expiry date of September, 2022 stated on the commercial bottle.
3.2 LGC-RT/20/B
– 400 mg CBD in MCT Oil Spray, 30 mL (Food) The sample was initially analysed and found to have suitable levels of controlled cannabinoids for shipping. ~240 mL of sample (eight bottles) was decanted into a DURAN® bottle and mixed overnight with a magnetic stirrer. While the sample was still being mixed, 5.1 mL aliquots were transferred into 8 mL plastic bottles labelled LGC-RT/20/B CBD Oil. The sample was aliquoted in bottle order 1 – 41. Sample B had an expiry date of August, 2021 stated on each commercial bottle.
3.3 LGC-RT/20/C
– CBD Body Wash, 100 mL (Cosmetic) The sample was initially analysed and found to have suitable levels of controlled cannabinoids for shipping. ~300 mL of sample (three bottles) was decanted into a DURAN® bottle and mixed overnight with a magnetic stirrer. The bottle was sonicated and then put back on the magnetic stirrer while 5.2 mL aliquots were transferred into 8 mL plastic bottles labelled LGC-RT/20/C CBD Cosmetic. The sample was aliquoted in bottle order 1 – 41. Sample C did not have an expiry date stated on the commercial bottle.
One 8 mL bottle of each sample was placed into a plastic bag and stored at ambient temperature until being shipped to participating laboratories.

Page 7 of 62 Government Chemist CBD Food and Cosmetic Ring Trial – T. Hambidge
4 Homogeneity All samples were tested for homogeneity using LGC’s analysis method for CBD. Three bottles were taken from the beginning, middle and end of the bottling numbers (1, 20 and 41) and analysed in triplicate (Figure 1). Using a one way ANOVA (p = < 0.05), it was found there was no statistically significant difference between the bottles, and therefore they were all considered homogeneous. Sample A: F(2,6) = 3.017, p = 0.12 Sample B: F(2,6) = 1.406, p = 0.32 Sample C: F(2,6) = 3.041, p = 0.12
Figure 1. CBD homogenity results for three ring trial samples – each bottle was analysed in triplicate for CBD.
-1.50
-1.00
-0.50
0.00
0.50
1.00
1.50
Bottle 1 Bottle 20 Bottle 41
Conc
entr
atio
n m
g/m
L (d
iffer
ence
from
mea
n)
Bottle Number
Homogenity LGC-RT/20/A CBD
-2.50
-2.00
-1.50
-1.00
-0.50
0.00
0.50
1.00
1.50
2.00
2.50
Bottle 1 Bottle 20 Bottle 41
Conc
entr
atio
n m
g/m
L (d
iffer
ence
from
mea
n)
Bottle Number
Homogenity LGC-RT/20/B CBD
-1.00
-0.80
-0.60
-0.40
-0.20
0.00
0.20
0.40
0.60
0.80
1.00
Bottle 1 Bottle 20 Bottle 41
Conc
entr
atio
n m
g/m
L (d
iffer
ence
from
mea
n)
Bottle Number
Homogenity LGC-RT/20/C CBD

Page 8 of 62 Government Chemist CBD Food and Cosmetic Ring Trial – T. Hambidge
5 Shipping The bottled samples were distributed to 35 laboratories (16 UK, 19 International) at room temperature during January and February, 2021. Participants were asked to quantify the samples for CBD and, optionally, controlled cannabinoids in singlicate on three separate days. A reporting template was provided to participants to fill out and return to LGC. The reporting template required: method details (Extraction Type, Dilution Factor, Instrument LOQ, and Analysis Techniques), analysis details (Bottle Number, Extraction and Analysis Dates, and Internal Standard) and results (CBD Concentration [mg/mL], Controlled Cannabinoid Concentrations [µg/mL], Concentration [per pack] and Controlled Status of Samples [UK only]).
6 Ring Trial Results 32 result templates were returned to LGC (14 UK, 18 international), however, not all of them were completed sets.
6.1 Technologies
A range of technologies were used by testing laboratories to measure CBD and controlled cannabinoids (Table 2, 3 and Figure 2). There was good split between using either Mass Spectrometry or Spectroscopy techniques.
Table 2. Acronyms for measurement technologies.
Acronym Measurement Technology Technique LC-DAD/PDA Liquid Chromatography with Diode Array Detector or Photodiode Array Detector Spectroscopy
LC-UV Liquid Chromatography with Ultraviolet Detection Spectroscopy LC-MS/MS Liquid Chromatography with Tandem Mass Spectrometry Mass
Spectrometry LC-QTOF-MS Liquid Chromatography with Quadrupole Time-of-Flight Mass Spectrometry Mass
Spectrometry GC-MS Gas Chromatography with Mass Spectrometry Mass
Spectrometry GC-FID Gas Chromatography with Flame Ionisation Detection Flame Ionisation

Page 9 of 62 Government Chemist CBD Food and Cosmetic Ring Trial – T. Hambidge
Table 3. Extraction method and analysis technique for each participating laboratory.
Institute/ Laboratory
Number
CBD Extraction Method
CBD Analysis Technique
Cannabinoid Extraction Method
Cannabinoid Analysis Technique
1 Dilution LC-MS/MS Dilution LC-MS/MS 2 Liquid-Liquid
Extraction LC-DAD/PDA Liquid-Liquid Extraction LC-DAD/PDA
3 Dilution LC-UV Dilution LC-MS/MS 4 Dilution LC-MS/MS Dilution LC-MS/MS 5 Not Reported LC-DAD/PDA Not Reported LC-DAD/PDA 6 Solid-Phase
Extraction LC-DAD/PDA Solid-Phase Extraction LC-DAD/PDA
7 Dilution LC-DAD/PDA Dilution LC-DAD/PDA 8 Liquid-Liquid
Extraction LC-MS/MS Liquid-Liquid Extraction LC-MS/MS
9 Dilution LC-MS/MS Dilution LC-MS/MS 10 Dilution LC-DAD/PDA Dilution LC-DAD/PDA 11 Dilution LC-MS/MS - - 12 Dilution LC-QTOF-MS Dilution LC-QTOF-MS 13 Liquid-Liquid
Extraction LC-UV Liquid-Liquid Extraction LC-UV
14 Dilution LC-MS/MS Dilution LC-MS/MS 15 Dilution LC-UV Dilution LC-UV / GC-MS* 16 Dilution LC-MS/MS Dilution LC-MS/MS 17 Dilution GC-MS Dilution GC-MS 18 Dilution LC-UV Dilution LC-MS/MS 19 Dilution GC-MS Dilution GC-MS 20 Dilution LC-MS/MS Dilution LC-MS/MS 21 Dilution GC-FID / LC-
DAD/PDA - -
22 Dilution LC-MS/MS Dilution LC-MS/MS 23 Dilution LC-MS/MS Dilution LC-MS/MS 24 Dilution LC-MS/MS Dilution LC-MS/MS 25 Solid-Phase
Extraction LC-UV Solid-Phase Extraction LC-UV
26 Dilution LC-DAD/PDA Liquid-Liquid Extraction LC-MS/MS 27 Liquid-Liquid
Extraction LC-DAD/PDA Liquid-Liquid Extraction LC-DAD/PDA
28 Dilution LC-DAD/PDA Dilution LC-MS/MS 29 Dilution Not Reported Dilution Not Reported 30 Dilution LC-MS/MS Dilution LC-MS/MS 31 QuEChERS LC-MS/MS - - 32 Dilution LC-MS/MS Dilution LC-MS/MS
*GC-MS used for ∆9-THC only

Page 10 of 62 Government Chemist CBD Food and Cosmetic Ring Trial – T. Hambidge
Figure 2. Instruments used by participating laboratories in the analysis of CBD and cannabinoids.
6.2 CBD
6.2.1 Method Information 30 laboratories reported results for the quantification of CBD in all three samples. One laboratory reported results for LGC-RT/20/A and LGC-RT/20/B only. A further one laboratory reported results for LGC-RT/20/C only. Therefore, 31 results were received for each sample. The majority of laboratories used their own extraction and analysis methods, with a few using LGC’s method or modifying the LGC method (Table 4). The most popular extraction technique was dilution with liquid-liquid, solid-phase and QuEChERS also being used by a few laboratories (Table 5). A range of instrument limit of detections (LODs) were reported (Figure 3). Total lower limit of quantifications (LLOQs) were not reported because laboratories used different dilution factors for each sample. A range of internal standards were used, however, the majority of laboratories did not use an internal standard (Table 6).
Table 4. Methods used when analysing ring trial samples for CBD.
LGC Modified LGC
Own method
CBD Extraction Method 6 2 23
CBD Analysis Method 3 1 27
Table 5. Type of extraction used by laboratories for extracting CBD from ring trial samples.
Extraction Number of Laboratories Dilution 24
Liquid-Liquid 4 Solid Phase 2 QuEChERS 1
N/R 1
02468
1012141618
LC-DAD/PDA LC-UV LC-MS/MS LC-QTOF-MS GC-MS GC-FID Not Reported
Num
ber o
f Lab
orat
orie
sMeasurement Technologies
CBD Cannabinoid

Page 11 of 62 Government Chemist CBD Food and Cosmetic Ring Trial – T. Hambidge
Figure 3. Instrument limit of detection of participating laboratories when measuring CBD.
Table 6. Internal Standards used by participating laboratories when measuring CBD.
Internal Standard Number of Laboratories
∆9-THC-D3 1
Benzonitrile 1
CBD-D3 9
N/R 2
None 16
Squalene 1
Tribenzylamine 1
6.2.2 CBD Consensus Values Overall, there was good agreement with the majority of laboratories. The data was examined using plots and tables. Figures 4 to 6 (in section 6.2.3) show the CBD concentration measurements obtained by the different laboratories for sample A, B and C. In each case there is a clear consensus level, but the results cover more than one order of magnitude. From the shape of the plots, the distribution is approximately symmetrical, but departs from normal distribution. This is expected behaviour for inter-laboratory studies, which typically contain outliers and long distribution tails. Given the lack of normal distribution and the presence of extreme values in the data, a calculation of the mean and standard error is inappropriate. Of the two possible approaches (outlier removal or robust statistics), the latter is preferred because it avoids decisions regarding the removal of extreme data while reducing their influence. Robust methods are
0 1 2 3 4 5 6
0.1 - 1
>1 - 10
>10 - 100
>100
Instrument LOD ng/mL CBD
LC-DAD/PDA
LC-UV
LC-MS/MS
LC-QTOF-MS
GC-MS
GC-FID
Not Reported

Page 12 of 62 Government Chemist CBD Food and Cosmetic Ring Trial – T. Hambidge
also standard practice in inter-laboratory studies, and the same approach has been followed here. Since the dispersion between institutes is relatively large compared to their standard uncertainties, only a single estimate for each institute is needed to compute a consensus value for each analyte, typically the mean or median. The most commonly used robust estimator for the population mean is the median, which has a standard uncertainty given by equation 1.
Equation 1.
Where MAD is the median absolute deviation of the individual estimates, scaled to be an equivalent estimator for the population standard deviation, and 𝑛 is the number of replicate values. Here, 𝑛 is the number of institutes. Table 7 shows the CBD results. In all three cases, every institute submitted either a minimum of two positive results or three non-detect results; There were no mixtures of non-detects and detected results. The institute means were therefore used to compute the consensus values. Degrees of freedom were sufficient for a coverage factor 𝑘 = 2 to be used for the expanded uncertainty.
Table 7. Calculated CBD concentration consensus value and uncertainty, expressed as mg/mL. The median is the median of institute means and 𝑛 is the number of institutes which reported a result for the indicated sample.
Sample Median (mg/mL)
𝑛 MADE
(mg/mL) 𝑢 𝑘 𝑈 𝑈(%)
Sample A 9.583 31 2.4758 0.5573 2 1.115 11.63 Sample B 12.167 31 1.6406 0.3693 2 0.739 6.07 Sample C 0.468 30 0.0542 0.0124 2 0.025 5.29
6.2.3 CBD z-Score Calculations and Interpretations The CBD z-scores for each laboratory were calculated by equation 2.
Equation 2.
Where 𝑥 is the mean result reported by the participant, 𝑥 is the consensus value and 𝜎 is the
robust estimate of the standard deviation. This is the median absolute deviation (MAD) which is calculated as follows: for each result, the absolute difference between its value and the overall median is calculated. The MAD is the median of the absolute differences. To obtain a scaled equivalent to the standard deviation, the MAD is then multiplied by 1.483. In normal circumstances, ~ 95 % of z-scores will be in the range |𝑧| ≤ 2. These scores are designated “satisfactory”.

Page 13 of 62 Government Chemist CBD Food and Cosmetic Ring Trial – T. Hambidge
A rate of 1 in 20 would be expected for z-scores in the range 2 < |𝑧| ≤ 3. These scores may require further investigation. Scores where |𝑧| > 3 are to be expected at a rate of about 1 in 300. These z-scores indicate that the result is not fit-for-purpose and certainly requires investigation.
6.2.3.1 LGC-RT/20/A The stated CBD concentration on the package was 50 mg/mL, however the sample was diluted five times before shipping and therefore the concentration should be ~ 10 mg/mL. Overall, there was good agreement with the majority of laboratories. Participants were asked to run each sample in singlicate on three separate days. Generally, there was good agreement between replicates – this is shown by the error bars in Figure 4. Notably, Institutes 3, 17 and 19 have submitted very low values. After sharing the preliminary results, laboratories 3, 17, 19 and 32 expressed that they had found a dilution error in their calculations. As the corrected concentrations were received after the results were no longer blinded, the amended results were not accepted. However, this explains why these results are outliers. The results did not need to be removed from the calculation of the consensus value due to the use of robust statistics, meaning the outlier results do not affect the consensus value. These z-scores have been highlighted in red as known errors. 27 laboratories had satisfactory z-scores, out of 31 laboratories that submitted a results this equates to 87%. If the results are calculated excluding the laboratories that have found errors, the z-score increases to 96%.

Page 14 of 62 Government Chemist CBD Food and Cosmetic Ring Trial – T. Hambidge
Table 8. Individually calculated z-scores for CBD in LGC-RT/20/A. Where green are satisfactory scores and
orange are scores that need further investigation. Laboratories marked in red had already found a calculation error after preliminary results were shared but before the final report.
Sample LGC-RT/20/A CBD
Laboratory Mean
concentration (mg/mL)
z-score
1 10.7 0.43 2 9.7 0.07 3 0.0 -3.87 4 7.6 -0.82 5 12.1 1.02 6 9.4 -0.08 7 10.2 0.23 8 12.2 1.06 9 9.7 0.03
10 9.6 0.00 11 9.4 -0.06 12 10.1 0.21 13 9.0 -0.22 14 11.3 0.67 15 8.5 -0.44 16 9.3 -0.11 17 0.2 -3.81 18 9.3 -0.11 19 0.1 -3.82 20 1.0 -3.46 21 9.7 0.04 22 7.2 -0.96 23 13.9 1.74 24 10.3 0.28 25 7.8 -0.71 26 9.6 0.00 27 11.5 0.79 28 11.9 0.92 29 12.7 1.24 30 7.2 -0.96 32 4.8 -1.95

Page 15 of 62 Government Chemist CBD Food and Cosmetic Ring Trial – T. Hambidge
Figure 4. Calculated concentrations of CBD in LGC-RT/20/A by all participating laboratories. Error bars represent
the standard uncertainty of the laboratories’ replicate results.
6.2.3.2 LGC-RT/20/B The stated CBD concentration on the package was 13.3 mg/mL. Overall, there was good agreement with the majority of laboratories. Participants were asked to run each sample in singlicate on three separate days. Generally there was good agreement between replicates – this is shown by the error bars in Figure 5. Notably, Institutes 3, 17 and 19 have submitted very low values. After sharing the preliminary results, laboratories 3, 17, 19 and 32 expressed that they had found a dilution error in their calculations. As the corrected concentrations were received after the results were no longer blinded, the amended results were not accepted. However, this explains why these results are outliers. The results did not need to be removed from the calculation of the consensus value due to the use of robust statistics, meaning the outlier results do not affect the consensus value. These z-scores have been highlighted in red as known errors. 21 laboratories had satisfactory z-scores, out of 31 laboratories that submitted a results, this equates to 68%. If the results are calculated excluding the laboratories that have found errors, the z-score increases to 78%.

Page 16 of 62 Government Chemist CBD Food and Cosmetic Ring Trial – T. Hambidge
Table 9. Individually calculated z-scores for CBD in LGC-RT/20/B. Where green are satisfactory scores and orange are scores that need further investigation. Laboratories marked in red had already found a calculation
error after preliminary results were released but before the final report.
Sample LGC-RT/20/B CBD
Laboratory Mean
concentration (mg/mL)
z-score
1 14.0 1.14 2 12.8 0.39 3 0.0 -7.41 4 7.0 -3.18 5 15.7 2.17 6 11.4 -0.48 7 13.8 1.01 8 15.8 2.21 9 13.0 0.49
10 12.4 0.12 11 12.3 0.07 12 12.5 0.23 13 11.8 -0.21 14 13.3 0.67 15 11.1 -0.67 16 12.0 -0.13 17 0.2 -7.28 18 13.1 0.55 19 0.2 -7.32 20 2.4 -5.96 21 12.2 0.00 22 9.7 -1.48 23 17.2 3.06 24 11.2 -0.57 25 11.0 -0.70 26 12.5 0.23 27 12.7 0.30 28 16.0 2.36 29 11.5 -0.41 30 9.4 -1.66 32 5.4 -4.15

Page 17 of 62 Government Chemist CBD Food and Cosmetic Ring Trial – T. Hambidge
Figure 5. Calculated concentrations of CBD in LGC-RT/20/B by all participating laboratories. Error bars represent
the standard uncertainty of the laboratories’ replicate results.
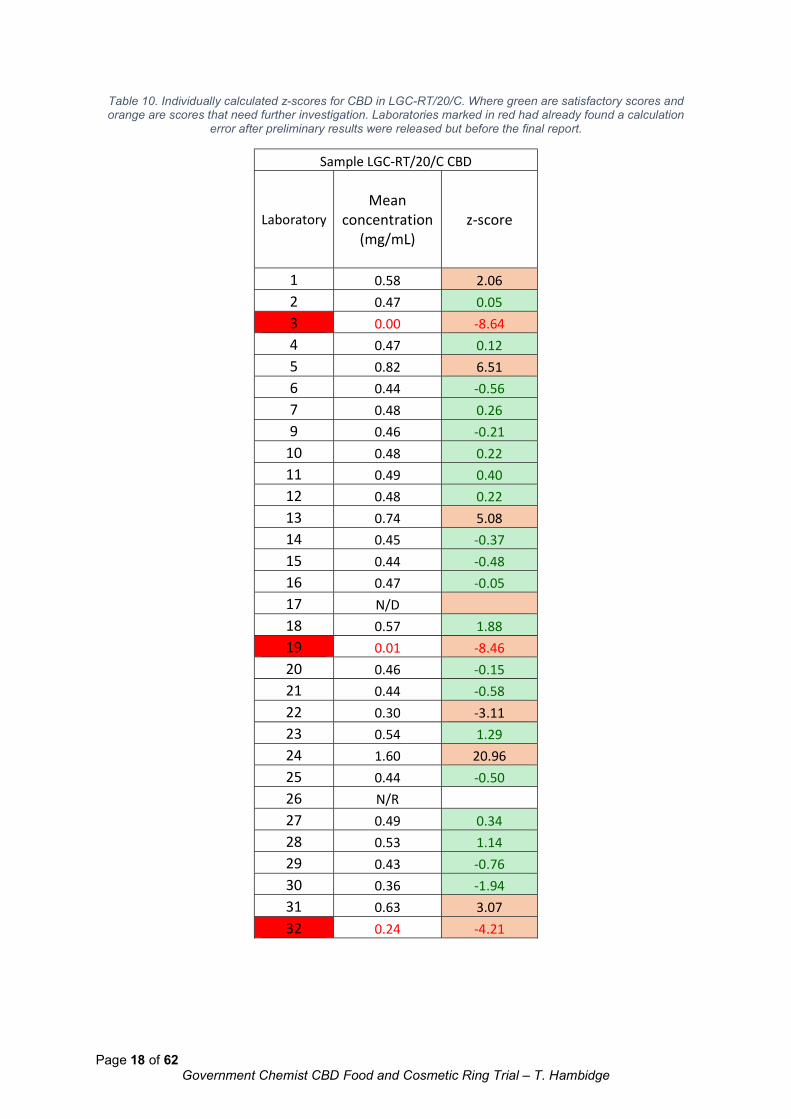
6.2.3.3 LGC-RT/20/C The stated CBD concentration on the package 0.5 mg/mL. Overall, there was good agreement with the majority of laboratories. Participants were asked to run each sample in singlicate on three separate days, generally there was good agreement between replicates – this is shown by the error bars in Figure 6. Notably, Institutes 3 and 19 have submitted very low values and institute 17 stated CBD was either ‘not detected’ or below LOQ (N/D). Conversely, Institute 24 reported a high outlier compared to the others. Institute 26 did not report a result (N/R). After sharing the preliminary results, Institutes 3, 19 and 32 expressed that they had found a dilution error in their calculations. As the corrected concentrations were received after the results were no longer blinded, the amended results were not accepted. However, this explains why these results are outliers. The results did not need to be removed from the calculation of the consensus value due to the use of robust statistics, meaning the outlier results do not affect the consensus value. These z-scores have been highlighted in red as known errors. 20 laboratories had satisfactory z-scores, out of 30 laboratories that submitted a results, this equates to 67%. If the results are calculated excluding the laboratories that have found errors, the z-score increases to 74%. Results that were reported as not detected, zero or below LOQ (N/D) are included in this calculation. However, results that were not reported (N/R) were not included.
Page 18 of 62 Government Chemist CBD Food and Cosmetic Ring Trial – T. Hambidge
Table 10. Individually calculated z-scores for CBD in LGC-RT/20/C. Where green are satisfactory scores and orange are scores that need further investigation. Laboratories marked in red had already found a calculation
error after preliminary results were released but before the final report.
Sample LGC-RT/20/C CBD
Laboratory Mean
concentration (mg/mL)
z-score
1 0.58 2.06 2 0.47 0.05 3 0.00 -8.64 4 0.47 0.12 5 0.82 6.51 6 0.44 -0.56 7 0.48 0.26 9 0.46 -0.21
10 0.48 0.22 11 0.49 0.40 12 0.48 0.22 13 0.74 5.08 14 0.45 -0.37 15 0.44 -0.48 16 0.47 -0.05 17 N/D 18 0.57 1.88 19 0.01 -8.46 20 0.46 -0.15 21 0.44 -0.58 22 0.30 -3.11 23 0.54 1.29 24 1.60 20.96 25 0.44 -0.50 26 N/R 27 0.49 0.34 28 0.53 1.14 29 0.43 -0.76 30 0.36 -1.94 31 0.63 3.07 32 0.24 -4.21

Page 19 of 62 Government Chemist CBD Food and Cosmetic Ring Trial – T. Hambidge
Figure 6. Calculated concentrations of CBD in LGC-RT/20/C by all participating laboratories. Error bars represent
the standard uncertainty of the laboratories’ replicate results.
6.3 Controlled Cannabinoids
6.3.1 Method Information 29 laboratories reported cannabinoid results for the quantification of all three samples, although not every laboratory looked for all five cannabinoids. The majority of laboratories used their own extraction and analysis methods, with a few using LGC’s method or modifying the LGC method (Table 11). The most popular extraction technique was dilution with liquid-liquid and solid-phase extractions also being used by a few laboratories (Table 12). A range of instrument LODs were reported (Figures 7, 10, 14, 18 and 19). Total LLOQs were not reported because laboratories used different dilution factors for each sample. A range of internal standards were used, however, the majority of laboratories did not use an internal standard (Table 13).
Table 11. Methods used when analysing ring trial samples for controlled cannabinoids.
LGC Modified LGC
Own Method
Cannabinoid Extraction Method 4 2 22
Cannabinoid Analysis Method 2 1 25
Table 12. Type of extractions used when extracting cannabinoids from the ring trial samples.
Extraction Number of Laboratories Dilution 21
Liquid-Liquid 5 Solid Phase 2
N/R 1

Page 20 of 62 Government Chemist CBD Food and Cosmetic Ring Trial – T. Hambidge
Table 13. Internal standards used when analysing the samples for controlled cannabinoids.
Number of Laboratories CBN THCV ∆8-THC ∆9-THC ∆9THCA-A
None 10 9 9 10 11
CBN-D3 6 3 0 0 0
∆9-THC-D3 4 3 8 12 1
CBD-D3 1 1 0 1 1
∆9-THCA-A-D3 0 0 0 0 6
Tribenzylamine 0 0 0 1 0
Benzonitrile 0 0 0 1 0
N/R 8 13 12 4 10
6.3.2 Cannabinoid Consensus Values The data was examined using plots and tables. Figures 8, 9, 11, 12, 13, 15, 16 and 17 (in sections 6.3.5 and 6.3.6) show the CBN, ∆9-THC and THCV concentration measurements obtained by the different laboratories for sample A, B and C. Laboratories were asked to run each sample in singlicate on three separate days. Generally there was good agreement between replicates – this is shown by the error bars on these figures. Although all three samples were analysed for 5 analytes (20 datasets), only three datasets had sufficient usable data for a meaningful consensus and uncertainty to be computed. These were from Sample A. Not enough usable data for statistical analysis was obtained from sample B or C due to the amount of ‘not detected’ and ‘not reported’ results. Therefore Table 14 has only three rows instead of 20. From the shape of the useable plots, the distribution is approximately symmetrical, but departs from normal distribution. This is expected behaviour for inter-laboratory studies, which typically contain outliers and long distribution tails. Given the lack of normal distribution and the presence of extreme values in the data, a calculation of the mean and standard error is inappropriate. Of the two possible approaches (outlier removal or robust statistics), the latter is preferred because it avoids decisions regarding the removal of extreme data while reducing their influence. Robust methods are also standard practice in inter-laboratory studies, and the same approach has been followed here. Since the dispersion between institutes is relatively large compared to their standard uncertainties, only a single estimate for each institute is needed to compute a consensus value for each analyte, typically the mean or median. The most commonly used robust estimator for the population mean is the median, which has a standard uncertainty given by equation 1.
Equation 1.

Page 21 of 62 Government Chemist CBD Food and Cosmetic Ring Trial – T. Hambidge
Where MAD is the median absolute deviation of the individual estimates, scaled to be an equivalent estimator for the population standard deviation, and 𝑛 is the number of replicate values. Here, 𝑛 is the number of institutes. Table 14 Calculated cannabinoid consensus concentrations, expressed as µg/mL and shown by sample and analyte. Only results for which both a quantifiable estimate and a non-zero uncertainty were obtained are included. Degrees of freedom were sufficient for a coverage factor 𝑘 = 2 to be used for the expanded uncertainty.
Sample Analyte Median (µg/mL)
MADE
(µg/mL) 𝑛 𝑢 𝑘 𝑈 𝑈(%)
Sample A CBN 65.2375 10.0635 22 2.6892 2.0796 5.5925 8.57 Sample A THCV 1.9160 2.8405 16 0.8901 2.1314 1.8972 99.01 Sample A Δ9-THC 80.3380 22.8432 28 5.4108 2.0518 11.1021 13.82
6.3.3 Cannabinoid Z-Score Calculations and Interpretations The cannabinoid z-scores for each laboratory were calculated by
Equation 2.
Where 𝑥 is the mean result reported by the participant, 𝑥 is the consensus value and 𝜎 is the
robust estimate of the standard deviation. This is the median absolute deviation (MAD) which is calculated as follows: for each result, the absolute difference between its value and the overall median is calculated. The MAD is the median of the absolute differences. To obtain a scaled equivalent to the standard deviation, the MAD is then multiplied by 1.483. In normal circumstances, ~ 95 % of z-scores will be in the range |𝑧| ≤ 2. These scores are designated “satisfactory”. A rate of 1 in 20 would be expected for z-scores in the range 2 < |𝑧| ≤ 3. These scores may require further investigation. Scores where |𝑧| > 3 are to be expected at a rate of about 1 in 300. These z-scores indicate that the result is not fit-for-purpose and certainly requires investigation.

Page 22 of 62 Government Chemist CBD Food and Cosmetic Ring Trial – T. Hambidge
6.3.5 THCV Results
Figure 7. Instrument limit of detection of participating laboratories when measuring THCV.
6.3.5.1 LGC-RT/20/A 9 laboratories detected THCV in the sample. 7 laboratories reported they either could not detect THCV, it was zero, or <LOQ (N/D). 13 laboratories did not report THCV (N/R). Although a consensus value for THCV in LGC-RT/20/A was calculated, the observed relative standard deviation was over 100% suggesting a skewed distribution. Therefore, individual z-scores were not calculated because it is assumed that z is a normally distributed variable. Therefore, only the reported concentrations have been listed in Table 15. Notably, Institute 24 has reported a high result. However, the result did not need to be removed from the calculation of the consensus value due to the use of robust statistics, meaning the outlier result does not affect the consensus value. The data is shown both with and without institute 24 in Figure 8 and 9. Of the nine laboratories that reported a concentration for THCV, eight of them used LC-MS/MS whereas one used LC-DAD/PDA, suggesting LC-MS/MS is the more sensitive technique for THCV analysis.
0 1 2 3 4 5 6 7 8
0.05 - 1
>1 - 10
>10 - 100
>100
N/R
Instrument LOD THCV (ng/mL)
LC-DAD/PDA
LC-UV
LC-MS/MS
LC-QTOF-MS
GC-MS
GC-FID
Not Reported

Page 23 of 62 Government Chemist CBD Food and Cosmetic Ring Trial – T. Hambidge
Table 15. Median reported concentrations for THCV in LGC-RT/20/A.
Sample LGC-RT/20/A THCV
Laboratory Median
concentration (µg/mL)
1 2.4 2 13.1 3 2.9 4 N/R 5 N/D 6 N/R 7 N/D 8 N/R 9 N/R
10 N/D 12 N/R 13 N/D 14 6.4 15 N/D 16 2.1 17 N/R 18 N/D 19 N/R 20 N/R 22 3.2 23 N/R 24 212.3 25 N/R 26 2.2 27 N/R 28 N/R 29 N/R 30 N/D 32 1.8

Page 24 of 62 Government Chemist CBD Food and Cosmetic Ring Trial – T. Hambidge
Figure 8. Reported concentrations of THCV in LGC-RT/20/A by all participating laboratories. Error bars represent
the standard uncertainty of the laboratories’ replicate results (K=1).
Figure 9. Reported concentrations of THCV in LGC-RT/20/A where laboratory 24 has been removed. Error bars represent the standard uncertainty of the laboratories’ replicate results (K=1).
Cannabinoid A (THCV)
Institute
Co
nce
ntr
atio
n (
µg
/mL
)
5 7 10 13 15 18 30 32 16 26 1 3 22 14 2
0
5
10
15

Page 25 of 62 Government Chemist CBD Food and Cosmetic Ring Trial – T. Hambidge
6.3.5.2 LGC-RT/20/B 2 laboratories detected THCV in the sample. Notably, Institute 24 reported a high result of 252.1 µg/ml, whereas Institute 14 reported a low result of 0.1 µg/ml. 14 laboratories reported they either could not detect THCV, it was zero, or <LOQ. 13 laboratories did not report THCV.
6.3.5.3 LGC-RT/20/C Zero laboratories detected THCV.
6.3.6 CBN Results
Figure 10. Instrument limits of detection when analysing for CBN.
0 1 2 3 4 5 6 7
0.05 - 1
>1 - 10
>10 - 100
>100
N/R
Instrument LOD CBN (ng/mL)
LC-DAD/PDA
LC-UV
LC-MS/MS
LC-QTOF-MS
GC-MS
GC-FID
Not Reported

Page 26 of 62 Government Chemist CBD Food and Cosmetic Ring Trial – T. Hambidge
6.3.6.1 LGC-RT/20/A 21 laboratories detected CBN in the sample. 1 laboratory reported they either could not detect CBN, it was zero, or <LOQ (N/D). 7 laboratories did not report CBN (N/R). After sharing the preliminary results, Institute 27 found a dilution factor error in their calculations. As the corrected concentration was received after the results were no longer blinded, the amended result was not accepted. However, this explains why this result is an outlier. The result did not need to be removed from the calculation of the consensus value due to the use of robust statistics, meaning the outlier result does not affect the consensus value. This z-score has been highlighted in red as a known error. 16 laboratories had satisfactory z-scores, out of the 22 laboratories that submitted a results, this equates to 73%. Results that were reported as not detected, zero or below LOQ (N/D) are included in this calculation. However, results that were not reported (N/R) were not included. If you calculate the results without the laboratory that found an error, the z-score increases to 76%.

Page 27 of 62 Government Chemist CBD Food and Cosmetic Ring Trial – T. Hambidge
Table 16. Individually calculated z-scores for CBN in LGC-RT/20/A. Where green are satisfactory scores and orange are scores that need further investigation. Laboratories marked in red had already found a calculation
error after preliminary results were released but before the final report.
Sample LGC-RT/20/A CBN
Laboratory Median
concentration (µg/mL)
z-score
1 63.0 -0.22 2 67.8 0.26 3 77.8 1.25 4 N/R 5 77.0 1.17 6 N/R 7 69.1 0.39 8 68.7 0.34 9 70.3 0.51
10 65.5 0.03 12 56.8 -0.84 13 41.3 -2.38 14 110.6 4.50 15 25.3 -3.97 16 65.5 0.02 17 N/R 18 65.0 -0.02 19 N/R 20 N/R 22 60.3 -0.49 23 85.8 2.04 24 N/D 25 N/R 26 66.4 0.12 27 33.0 -3.20 28 48.1 -1.70 29 N/R 30 48.5 -1.66 32 61.5 -0.37

Page 28 of 62 Government Chemist CBD Food and Cosmetic Ring Trial – T. Hambidge
Figure 11. Reported concentrations of CBN in LGC-RT/20/A by all participating laboratories. Error bars represent
the standard uncertainty of the laboratories’ replicate results (K=1).
6.3.6.2 LGC-RT/20/B 11 laboratories detected CBN in the sample. 10 laboratories reported they either could not detect CBN, it was zero or <LOQ. 8 laboratories did not report CBN. Institute 15 has reported a notably high result that has therefore been removed from Figure 13. Due to the lack of reported concentrations, there was not enough statistically significant data to calculate a consensus value or z-scores. Therefore, only the concentrations are listed in Table 17.

Page 29 of 62 Government Chemist CBD Food and Cosmetic Ring Trial – T. Hambidge
Table 17. Median concentrations for CBN in LGC-RT/20/B.
Sample LGC-RT/20/B CBN
Laboratory Median
concentration (µg/mL)
1 1.0
2 N/D
3 3.5
4 N/R
5 N/D
6 N/R
7 N/D
8 1.8
9 1.7
10 N/D
12 N/D
13 N/D
14 1.8
15 52.6
16 1.7
17 N/R
18 N/D
19 N/R
20 N/R
22 1.6
23 N/D
24 N/D
25 N/R
26 1.5
27 N/R
28 N/D
29 N/R
30 3.6
32 1.6

Page 30 of 62 Government Chemist CBD Food and Cosmetic Ring Trial – T. Hambidge
Figure 12. Reported concentrations of CBN in LGC-RT/20/B by all participating laboratories. Error bars represent
the standard uncertainty of the laboratories’ replicate results (K=1).
Figure 13. Reported concentrations of CBN in LGC-RT/20/B without laboratory 15. Error bars represent the standard uncertainty of the laboratories’ replicate results (K=1).
6.3.6.3 LGC-RT/20/C Zero laboratories detected CBN in LGC-RT/20/C.

Page 31 of 62 Government Chemist CBD Food and Cosmetic Ring Trial – T. Hambidge
6.3.7 ∆9-THC
Figure 14. Instrument limits of detection when analysing for ∆9-THC.
6.3.7.1 LGC-RT/20/A 25 laboratories reported a concentration for ∆9-THC. 1 laboratory combined the ∆8-THC and ∆9-THC concentration but is included in the Figure 15 and Table 18. One laboratory could not confirm the presence of ∆9-THC, one laboratory could not detect ∆9-THC (N/D), and one laboratory did not report ∆9-THC (N/R). 24 laboratories had satisfactory z-scores out of the 28 laboratories that submitted a result, this equates to 86%. Results that were reported as not detected, zero or below LOQ (N/D) are included in this calculation. However, results that were not reported (N/R) were not included.
0 2 4 6 8 10
0.05 - 1
>1 - 10
>10 - 100
>100
N/R
Instrument LOD ∆9-THC ng/mL
LC-DAD/PDA
LC-UV
LC-MS/MS
LC-QTOF-MS
GC-MS
GC-FID
Not Reported

Page 32 of 62 Government Chemist CBD Food and Cosmetic Ring Trial – T. Hambidge
Table 18. Individually calculated z-scores for ∆9-THC in LGC-RT/20/A. Where green are satisfactory scores and orange are scores that need further investigation.
Sample LGC-RT/20/A ∆9-THC
Laboratory Median
concentration (µg/mL)
z-score
1 Not confirmed 2 73.6 -0.30 3 96.3 0.70 4 64.5 -0.69 5 85.0 0.20 6 81.0 0.03 7 96.2 0.70 8 84.3 0.17 9 82.1 0.08
10 71.3 -0.40 12 60.9 -0.85 13 82.9 0.11 14 89.6 0.41 15 102.2 0.96 16 80.7 0.01 17 17.7 -2.74 18 76.0 -0.19 19 N/D 20 56.1 -1.06 22 99.6 0.84 23 N/R 24 150.6 3.08 25 58.1 -0.97 26 80.0 -0.01 27 68.8 -0.51 28 65.3 -0.66 29 93.4 0.57 30 38.1 -1.85 32 101.0 0.91

Page 33 of 62 Government Chemist CBD Food and Cosmetic Ring Trial – T. Hambidge
Figure 15. Reported concentrations of ∆9-THC in LGC-RT/20/A by all participating laboratories. Error bars
represent the standard uncertainty of the laboratories’ replicate results (K=1).
6.3.7.2 LGC-RT/20/B 11 laboratories reported a concentration for ∆9-THC. 1 laboratory combined the ∆8-THC and ∆9-THC concentration but is included in Figure 16 and Table 19 as the combined value. 14 laboratories either could not detect ∆9-THC, reported it was zero or reported as <LOQ. One laboratory could not confirm the presence of ∆9-THC and two laboratories did not report ∆9-THC. Due to the lack of reported concentrations, there was not enough statistically significant data to calculate a consensus value or z-scores. Therefore, only the concentrations are listed in Table 19.

Page 34 of 62 Government Chemist CBD Food and Cosmetic Ring Trial – T. Hambidge
Table 19. Median concentrations for ∆9-THC in LGC-RT/20/B.
Sample LGC-RT/20/B ∆9-THC
Laboratory Median
concentration (µg/mL)
1 Not confirmed
2 N/D
3 5.6
4 N/D
5 N/D
6 8.1
7 N/D
8 3.4
9 3.4
10 N/D
12 N/D
13 11.6
14 4.2
15 N/D
16 5.5
17 N/D
18 N/D
19 N/D
20 2.6
22 9.4
23 N/R
24 N/D
25 N/D
26 6.9
27 N/R
28 N/D
29 3.1
30 N/D
32 6.8

Page 35 of 62 Government Chemist CBD Food and Cosmetic Ring Trial – T. Hambidge
Figure 16. Reported concentrations of ∆9-THC in LGC-RT/20/B by all participating laboratories. Error bars
represent the standard uncertainty of the laboratories’ replicate results (K=1).
6.3.7.3 LGC-RT/20/C 5 laboratories reported a concentration for ∆9-THC, two of which were high results (0.2 µg/ml, 0.2 µg/ml, 0.4 µg/ml, 75 µg/ml, and 143 µg/ml). 22 laboratories either could not detect ∆9-THC, reported it was zero or reported as <LOQ. Two laboratories did not report ∆9-THC.
Figure 17. Reported concentrations of ∆9-THC in LGC-RT/20/C by all participating laboratories. Error bars
represent the standard uncertainty of the laboratories’ replicate results (K=1).

Page 36 of 62 Government Chemist CBD Food and Cosmetic Ring Trial – T. Hambidge
6.3.8 ∆8-THC
Figure 18. Instrument limits of detection when analysing for ∆8-THC.
6.3.8.1 LGC-RT/20/A 6 laboratories reported a concentration for ∆8-THC over a wide range (3 µg/ml, 5 µg/ml, 13 µg/ml, 24 µg/ml, 43 µg/ml and 62 µg/ml). 1 laboratory combined the ∆8-THC and ∆9-THC. One laboratory could not confirm the presence ∆8-THC. 10 laboratories either could not detect ∆8-THC, reported it was zero or reported as <LOQ. 11 laboratories did not report ∆8-THC.
6.3.8.2 LGC-RT/20/B 3 laboratories reported a concentration for ∆8-THC (2 µg/ml, 4 µg/ml and 7 µg/ml). 1 laboratory combined the ∆8-THC and ∆9-THC concentration. 14 laboratories either could not detect ∆8-THC, reported it was zero or reported as <LOQ. 11 laboratories did not report ∆8-THC.
6.3.8.3 LGC-RT/20/C Zero laboratories detected ∆8-THC.
0 1 2 3 4 5 6
0.05 - 1
>1 - 10
>10 - 100
>100
N/R
Instrument LOD ∆8-THC ng/mL
LC-DAD/PDA
LC-UV
LC-MS/MS
LC-QTOF-MS
GC-MS
GC-FID
Not Reported

Page 37 of 62 Government Chemist CBD Food and Cosmetic Ring Trial – T. Hambidge
6.3.9 ∆9THCA-A
Figure 19. Instrument limits of detection when analysing for ∆9-THCA-A.
6.3.9.1 LGC-RT/20/A 3 laboratories reported a concentration for ∆9-THCA-A over a large range (0.1 µg/ml, 131 µg/ml and 339 µg/ml). 19 laboratories could not detect or confirm ∆9-THCA-A, reported it was zero or reported as <LOQ. 7 laboratories did not report ∆9-THCA-A.
6.3.9.2 LGC-RT/20/B Zero laboratories detected ∆9-THCA-A.
6.3.9.3 LGC-RT/20/C Zero laboratories detected ∆9-THCA-A.
6.4 Result Trends
Trends in results when compared with instrumentation type and use of internal standard were initially plotted but the results were scattered and no deeper analysis was completed. However, further statistical analysis may be able to pull out trends in the reported results. It is, however, noted that LC-MS/MS is the more sensitive instrumentation to be used according to instrument LODs. This could be crucial in controlled cannabinoid analysis as these analytes can be present at lower levels. This is shown in this study in sample LGC-RT/20/A for analyte THCV, where 8 of the 9 laboratories that reported a concentration were using LC-MS/MS. Although there were no trends in internal standard use, it is best practice to use an internal standard, preferably labelled, to account for matrix effects. Since the CBD food and cosmetics come in a variety of forms, there is always a possibility of matrix effects.
0 1 2 3 4 5 6
0.05 - 1
>1 - 10
>10 - 100
>100
N/R
Instrument LOD ∆9-THCA-A (ng/mL)
LC-DAD/PDA
LC-UV
LC-MS/MS
LC-QTOF-MS
GC-MS
GC-FID
Not Reported

Page 38 of 62 Government Chemist CBD Food and Cosmetic Ring Trial – T. Hambidge
6.5 Controlled Status in the UK
Of the 14 UK laboratories, 13 reported results for controlled cannabinoids. 10 laboratories reported that sample LGC-RT/20/A should be controlled. 1 reported that LGC-RT/20/B should be controlled. Zero reported that LGC-RT/20/C should be controlled.
7 Conclusions The ring trial was very successful. 35 international laboratories signed up and samples were sent to all laboratories. 32 data sets were returned. There was an interesting range of methods and instrument types shared. The data shows good agreement between most laboratories. CBD measurement was considered a success, with most institutes agreeing. The consensus concentrations were similar to the stated pack concentrations. On average, 82% of laboratories reported satisfactory results for CBD. Controlled cannabinoid measurement was more varied with a wider spread of results. Most laboratories quantified CBN and ∆9-THC in LGC-RT/20/A, with 76% and 86% of laboratories respectively reporting satisfactory results. The THCV consensus value in LGC-RT/20/A was calculated as a low concentration, which lead to more variable results and a large portion of laboratories reporting they could not detect THCV. All cannabinoids in LGC-RT/20/B and LGC-RT/C had variable results; many of laboratories reported they could not detect the cannabinoids and therefore there was not enough statistically significant data to calculate consensus values. From the limit of detection data shared, LC-MS/MS is the more sensitive instrumentation to be used. This could be crucial in controlled cannabinoid analysis as these analytes can be present at lower levels, as shown in this study in sample LGC-RT/20/A for analyte THCV. There did not appear to be significant trends in technology or internal standard used, however, it is best practice to use an internal standard to account for matrix effects.

Page 39 of 62 Government Chemist CBD Food and Cosmetic Ring Trial – T. Hambidge
8 Participating Laboratories The data is anonymous and therefore randomised. The participating laboratories listed below are not named in order of laboratory number.
– Advanced Development and Safety Laboratory Ltd, UK – AGES Institute for Food Safety Vienna, Austria – Amt für Verbraucherschutz und Veterinärwesen (AVSV), Switzerland – British American Tobacco Group R&D, UK – Bridge Farm Group, UK – CBD Health Foods Ltd, UK – Croatian Institute of Public Health, Croatia – CVUA Karlsruhe Kosmetic, Germany – CVUA Karlsruhe ZSL-HPLC, Germany – Eurofins Food Testing UK Ltd, UK – Fera Science Ltd, UK – Glasgow Scientific Services, UK – Health Sciences Authority, Singapore – Instititute of Public Health of Belgrade, Serbia – Kent County Council, UK – King’s Forensics, UK – Landeslabor-bbb, Germany – LGC, UK – Masdiag/HempEkspert, Poland – MHRA, UK – Minton Treharne & Davies Limited (MTD), UK – National Analytical Forensic Services (NAFS), South Africa – National Laboratory of Health, Environment and Food, Slovenia – Phytovista Laboratories, UK – Sample Control d.o.o., Croatia – SOCOTEC, UK – State General Laboratory of Cyprus – The Public Analyst Laboratory Dublin, Ireland – The State Laboratory, Ireland

Page 40 of 62 Government Chemist CBD Food and Cosmetic Ring Trial – T. Hambidge
9 Appendix 1 - Protocol

Page 1 of 19 Government Chemist CBD Food and Cosmetic Ring Trial – T. Hambidge
Ring Trial Protocol - Analysis of Cannabidiol and Controlled Cannabinoids in Food and Cosmetic Samples
T. Hambidge

Page 2 of 19 Government Chemist CBD Food and Cosmetic Ring Trial – T. Hambidge
Ring Trial Protocol - Analysis of Cannabidiol and Controlled Cannabinoids in Food and Cosmetic Samples LGC Queens Road Teddington Middlesex TW11 0LY
Contact Point: Chris Hopley Email: [email protected] Tel: 020 8943 7678
Prepared by: Tabatha Hambidge

Page 3 of 19 Government Chemist CBD Food and Cosmetic Ring Trial – T. Hambidge
10 Contents 1 Contents ........................................................................................................................ 4
2 Summary ....................................................................................................................... 5
3 Samples ......................................................................................................................... 6
3.1 LGC-RT/20/A .......................................................................................................... 6
3.2 LGC-RT/20/B .......................................................................................................... 6
3.3 LGC-RT/20/C .......................................................................................................... 6
4 Homogeneity .................................................................................................................. 7
5 Shipping ......................................................................................................................... 8
6 Ring Trial Results ........................................................................................................... 8
6.1 Technologies .......................................................................................................... 8
6.2 CBD ...................................................................................................................... 10
6.2.1 Method Information ........................................................................................ 10
6.2.2 CBD Consensus Values ................................................................................ 11
6.2.3 CBD z-Score Calculations and Interpretations ............................................... 12
6.3 Controlled Cannabinoids ....................................................................................... 19
6.3.1 Method Information ........................................................................................ 19
6.3.2 Cannabinoid Consensus Values .................................................................... 20
6.3.3 Cannabinoid Z-Score Calculations and Interpretations .................................. 21
6.3.5 THCV Results ................................................................................................ 22
6.3.6 CBN Results .................................................................................................. 25
6.3.7 ∆9-THC .......................................................................................................... 31
6.3.8 ∆8-THC .......................................................................................................... 36
6.3.9 ∆9THCA-A ..................................................................................................... 37
6.4 Result Trends ....................................................................................................... 37
6.5 Controlled Status in the UK ................................................................................... 38
7 Conclusions ................................................................................................................. 38
8 Participating Laboratories ............................................................................................ 39
1 Ring Trial Introduction .................................................................................................... 6
2 Timeline ......................................................................................................................... 6
3 LGC Supplied Samples .................................................................................................. 7
3.1 LGC-RT/20/A Food ................................................................................................. 7
3.2 LGC-RT/20/B Food ................................................................................................. 7
3.3 LGC-RT/20/C Cosmetic .......................................................................................... 7
4 Ring Trial Requirements ................................................................................................ 7
Page 4 of 19 Government Chemist CBD Food and Cosmetic Ring Trial – T. Hambidge
4.1 CBD ........................................................................................................................ 7
4.2 Controlled Cannabinoids (Optional) ........................................................................ 7
5 Reporting Results .......................................................................................................... 8
6 Appendix 1 – CBD Method ............................................................................................. 9
6.1 Scope ..................................................................................................................... 9
6.2 Background and Method Principle .......................................................................... 9
6.3 Apparatus ............................................................................................................... 9
6.4 Reagents .............................................................................................................. 10
6.5 Calibration Preparation ......................................................................................... 10
6.5.1 Stock Standard .............................................................................................. 10
6.5.2 Intermediate Standard ................................................................................... 10
6.5.3 Calibration Line .............................................................................................. 10
6.5.4 Autosampler Vial ............................................................................................ 10
6.6 Internal Standard Preparation ............................................................................... 10
6.6.1 Stock Standard .............................................................................................. 10
6.6.2 Intermediate Standard ................................................................................... 10
6.6.3 Working Standard .......................................................................................... 10
6.7 Sample Preparation .............................................................................................. 11
6.7.1 Food Oil Samples .......................................................................................... 11
6.7.2 Cosmetic Body Wash Samples (no centrifuging) ........................................... 11
6.8 HPLC Conditions .................................................................................................. 12
6.9 MS Condition ........................................................................................................ 13
7 Appendix 2 - Controlled Cannabinoid Method .............................................................. 14
7.1 Scope ................................................................................................................... 14
7.2 Background and Method Principle ........................................................................ 14
7.3 Apparatus ............................................................................................................. 14
7.4 Reagents .............................................................................................................. 15
7.5 Calibration Preparation ......................................................................................... 15
7.5.1 Stock Standard .............................................................................................. 15
7.5.2 Individual Intermediate Standard.................................................................... 15
7.5.3 Mixed Intermediate Standard ......................................................................... 15
7.5.4 Calibration Line .............................................................................................. 15
7.5.5 Autosampler Vial ............................................................................................ 15
7.6 Internal Standard Preparation ............................................................................... 16
7.6.1 Stock Standard .............................................................................................. 16
7.6.2 Individual Intermediate Standards .................................................................. 16

Page 5 of 19 Government Chemist CBD Food and Cosmetic Ring Trial – T. Hambidge
7.6.3 Working Standard .......................................................................................... 16
7.7 Sample Preparation .............................................................................................. 16
7.7.1 Food Oil Samples .......................................................................................... 16
7.7.2 Cosmetic Body Wash Sample (No Centrifuging) ............................................ 17
7.8 HPLC Conditions .................................................................................................. 18
7.9 MS Conditions ...................................................................................................... 18

Page 6 of 19 Government Chemist CBD Food and Cosmetic Ring Trial – T. Hambidge
1 Ring Trial Introduction Cannabidiol (CBD) products have rapidly entered the UK market in a variety of forms, including food and cosmetics. As regulations are introduced to help govern the influx of CBD products; laboratories across the UK need to be able to accurately measure the CBD content as well as the controlled cannabinoid content in commercially available products. This ring trial aims to share and compare methods for quantifying CBD and controlled cannabinoids in food and cosmetics among UK testing laboratories. While CBD analysis is required, controlled cannabinoid analysis is optional. LGC will provide the protocol and details of their CBD and controlled cannabinoid methods. Laboratories will receive three different samples to analyse consisting of two foods and one cosmetic. Participating laboratories may use LGC’s method or their own method to analyse the samples for CBD and controlled cannabinoids (optional) listed in Table 1. A report template will be provided to fill out and return to LGC once analysis is completed. Participating laboratories will be anonymised when results are reported. Table 20. Cannabinoids of Interest
Cannabinoid Abbreviation CAS Number Controlled Status Cannabidiol CBD 13956-29-1 No
Delta-9-tetrahydrocannabinol*
∆9-THC 1972-08-3 Yes
Delta-9-tetrahydrocannabivarin*
THCV 31262-37-0 Yes
Cannabinol* CBN 521-35-7 Yes Delta-8-
tetrahydrocannabinol* ∆8-THC 5957-75-5 Yes
Delta 9-Tetrahydrocannabinolic
acid* ∆9THCA-A 23978-85-0
No - but readily converts to THC
*Optional
2 Timeline Table 21. Ring Trial Timeline
Date Action 29th January, 2021 Deadline for Registration 18th January – 5th February, 2021 Sample Distribution 12th March, 2021 Deadline for Submission of Results April, 2021 Reporting of Results

Page 7 of 19 Government Chemist CBD Food and Cosmetic Ring Trial – T. Hambidge
3 LGC Supplied Samples
3.1 LGC-RT/20/A Food
Sample Type: CBD Hemp Food Oil CBD range: 0.01 – 5% CBD Volume of commercial package: 30 mL Volume supplied to participating laboratories: 5 mL
3.2 LGC-RT/20/B Food
Sample Type: CBD Food Oil CBD range: 0.01 – 5% CBD Volume of commercial package: 30 mL Volume supplied to participating laboratories: 5 mL
3.3 LGC-RT/20/C Cosmetic
Sample Type: CBD Cosmetic CBD range: 0.01 – 5% CBD Volume of commercial package: 100 mL Volume supplied to participating laboratories: 5 mL
4 Ring Trial Requirements
4.1 CBD
You may use your own method or LGC’s Extract each sample in singlicate on three separate days Quantify all three samples for CBD content Please report your results in the report template provided in a separate email and
return to LGC (Section 6).
4.2 Controlled Cannabinoids (Optional)
You may use your own method or LGC’s Extract each sample in singlicate on three separate days Quantify all three samples for the five cannabinoids listed in Table 1 (∆9-THC, THCV,
CBN, ∆8-THC and ∆9THCA-A) Please report your results in the report template provided in a separate email and
return to LGC (Section 6).

Page 8 of 19 Government Chemist CBD Food and Cosmetic Ring Trial – T. Hambidge
5 Reporting Results Please report results via the excel report template that is provided. Results required – method details (limits of detection, dilution factors, instrumentation, internal standards, etc) and calculated concentrations of CBD and optional cannabinoids of each sample per mL and per pack. Please return your completed results template to [email protected] and [email protected] by 12th March, 2021.

Page 9 of 19 Government Chemist CBD Food and Cosmetic Ring Trial – T. Hambidge
6 Appendix 1 – CBD Method
6.1 Scope
This method is suitable for the quantification of Cannabidiol (CBD) in CBD food oil and cosmetic body wash.
6.2 Background and Method Principle
Cannabidiol (CBD) products have recently entered UK food markets. Laboratories need to be able to accurately measure the CBD content to check authenticity of samples and consumer safety. The food and cosmetic matrices are diluted into propan-2-ol, acetonitrile and then acetonitrile/water 50/50 v/v. The extracts are than analysed via LC-MS/MS.
6.3 Apparatus
General laboratory glassware, including beakers, bottles and cylinders Falcon Tubes and Eppendorfs of various sizes 2 mL autosampler vials and vials caps, PTFE lined Positive displacement pipettes, delivering volumes in the range of 10 μL – 1000 μL Larger volume pipettes, multi-pipettes or volumetric glassware capable of dispensing
larger volumes (1-50 mL) Vortex Mixer Sonicator Centrifuge capable of 3220 G and 15700 G HPLC column: BEH C8 2.5 μm, 2.1x100 mm or equivalent. HPLC System Mass Spectrometer Detector

Page 10 of 19 Government Chemist CBD Food and Cosmetic Ring Trial – T. Hambidge
6.4 Reagents
All reagents must be of analytical reagent quality or better. 1. Methanol (Honeywell, Fisher UK) 2. Stock Cannabidiol (Cerilliant, part numbers listed in 6.5.1, 6.6.1) 3. Acetonitrile (Honeywell, Fisher UK) 4. Ultra high purity water (≥18.2mΩ) e.g. Elga 5. Acetonitrile/Water 50/50 v/v
Mix 200 mL of acetonitrile with 200 mL of water. This solution is stable for one month when stored at room temperature.
6. Propan-2-ol (Fisher, UK) 7. Formic Acid (Sigma-Aldrich, UK) 8. Mobile Phase A - 0.1 % Formic Acid in Water
Mix 1 L of water with 1 mL of formic acid. This solution is stable for one week when stored at room temperature.
9. Mobile Phase B - 0.1 % Formic Acid in Acetonitrile Mix 1 L of acetonitrile with 1 mL of formic acid. This solution is stable for two weeks when stored at room temperature.
6.5 Calibration Preparation
6.5.1 Stock Standard The stock is acquired from Merck - Cerilliant 1 mg/mL CBD solution P/N: C-045
6.5.2 Intermediate Standard An intermediate solution in 100% methanol is prepared to form a 100 μg/mL solution.
6.5.3 Calibration Line The intermediate solution is then used to prepare a calibration line in acetonitrile/water 50/50 v/v at 500, 400, 300, 200, 100 and 5 ng/mL.
6.5.4 Autosampler Vial In an autosampler vial place 500 µL of calibration standard (6.5.3) and 100 µL Internal Standard working solution (6.6.3).
6.6 Internal Standard Preparation
6.6.1 Stock Standard The stock is acquired from Merck - Cerilliant 100 µg/mL CBD-D3 solution P/N: C-084.
6.6.2 Intermediate Standard An intermediate solution in 100% methanol is prepared to form a 10 μg/mL solution.
6.6.3 Working Standard The intermediate solution is then used to prepare a working solution in acetonitrile/water 50/50 v/v at 500 ng/mL.

Page 11 of 19 Government Chemist CBD Food and Cosmetic Ring Trial – T. Hambidge
6.7 Sample Preparation
For each sample, dilute to fit within the calibration curve. 6.7.1 Food Oil Samples
6.7.1.1 Dilution 1 1. Vigorously vortex mix the sample, if bubbles form, wait for bubbles to dissipate
before taking an aliquot for analysis. 2. Take a minimum of 500 µL of sample. 3. Dilute firstly with propan-2-ol. 4. Vortex mix. 5. Sonicate for 30 minutes. 6. Vortex mix. 7. Centrifuge for 10 minutes at 4000 RPM (3220 G).
6.7.1.2 Dilution 2 8. If layers are formed, aliquot from the top layer of previous dilution. 9. Dilute with acetonitrile. 10. Vortex mix. 11. Sonicate for 10 minutes. 12. Vortex mix. 13. Centrifuge for 10 minutes at 4000 RPM (3220 G).
6.7.1.3 Dilution 3 14. If layers are formed, aliquot from the top layer of previous dilution. 15. Dilute with acetonitrile/water 50/50 v/v. 16. Vortex mix. 17. Sonicate for 10 minutes. 18. Vortex mix. 19. If the solution is clear then centrifuge at 4000 RPM (3220 G) for 10 minutes. If the
solution is cloudy, centrifuge at 12000 RPM (15700 G) for 10 minutes. 20. Add 500 µL of sample to 100 µL of internal standard working solution (6.6.3) in an
autosampler vial. 6.7.2 Cosmetic Body Wash Samples (no centrifuging) For each sample, dilute to fit within the calibration curve.
6.7.2.1 Dilution 1 1. Vigorously vortex mix the sample, if bubbles form, wait for bubbles to dissipate before
taking an aliquot for analysis. 2. Take a minimum of 500 µL of sample. 3. Dilute firstly with propan-2-ol. 4. Vortex mix. 5. Sonicate for 30 minutes. 6. Vortex mix.

Page 12 of 19 Government Chemist CBD Food and Cosmetic Ring Trial – T. Hambidge
6.7.2.2 Dilution 2 7. Dilute with acetonitrile. 8. Vortex mix. 9. Sonicate for 10 minutes. 10. Vortex mix.
6.7.2.3 Dilution 3 11. Dilute with acetonitrile/water 50/50 v/v. 12. Vortex mix. 13. Sonicate for 10 minutes. 14. Vortex mix. 15. Add 500 µL of sample to 100 µL of internal standard working solution (6.6.3) in an
autosampler vial.
6.8 HPLC Conditions
LC: Accela UPLC Column: BEH C8 2.5 μm, 2.1x100 mm Mobile phases: A – Deionised water with 0.1% formic acid (v/v), B – Acetonitrile with 0.1% formic acid (v/v). Column temperature: 30 °C Sample temperature: 10 °C Injection volume: 10 μL Flow Rate: 0.2 mL/min Gradient Elution: Table 22. CBD Gradient Elution
Time (min) %A %B
0.00 50 50
1.00 50 50
8.00 0 100
11.00 0 100
11.10 50 50
15.00 50 50

Page 13 of 19 Government Chemist CBD Food and Cosmetic Ring Trial – T. Hambidge
6.9 MS Condition
Mass Spectrometer: Thermo Scientific TSQ Vantage Ionisation mode: ESI+ S-Lens: 35 Table 4. CBD MRMs
Analyte Transition 1 Pre-cursor (m/z)
Transition 1 Product (m/z)
Transition 2 Pre-cursor (m/z)
Transition 2 Product (m/z)
Collision energy (V)
CBD 315.2 193.2 315.2 235.2 20 CBD-D3 318.2 196.2 318.2 238.2 20

Page 14 of 19 Government Chemist CBD Food and Cosmetic Ring Trial – T. Hambidge
7 Appendix 2 - Controlled Cannabinoid Method
7.1 Scope
This method is suitable for the quantification of controlled cannabidiol (CBN, THCV, ∆9-THC, ∆8-THC and ∆9THCA-A in CBD food oil and cosmetic body wash.
7.2 Background and Method Principle
Cannabidiol (CBD) products have recently entered UK food markets. Laboratories need to be able to accurately measure the controlled cannabinoid content of the products to check the compliance of samples to the Home Office regulations as well as consumer safety. The food and cosmetic matrices are diluted into propan-2-ol, acetonitrile and then acetonitrile/water 50/50 v/v. The extracts are than analysed via LC-MS/MS.
7.3 Apparatus
General laboratory glassware, including beakers, bottles and cylinders Falcon Tubes and Eppendorfs of various sizes 2 mL autosampler vials and vials caps, PTFE lined Positive displacement pipettes, delivering volumes in the range of 10 μL - 1000 μL Larger volume pipettes, multi-pipettes or volumetric glassware capable of dispensing
larger volumes (1-50 mL) Vortex Mixer Sonicator Centrifuge capable of 3220 G and 15700 G HPLC column: BEH C8 2.5 μm, 2.1x100 mm or equivalent HPLC System Mass Spectrometer Detector

Page 15 of 19 Government Chemist CBD Food and Cosmetic Ring Trial – T. Hambidge
7.4 Reagents
All reagents must be of analytical reagent quality or better.
1. Methanol (Honeywell, Fisher UK) 2. Stock Cannabinoids (Cerilliant, part numbers listed in 7.5.1, 7.6.1) 3. Acetonitrile (Honeywell, Fisher UK) 4. Ultra high purity water (≥18.2mΩ) e.g. Elga 5. Acetonitrile/Water 50/50 v/v
Mix 200 mL of acetonitrile with 200 mL of water. This solution is stable for one month when stored at room temperature.
6. Propan-2-ol (Fisher, UK) 7. Formic Acid (Sigma-Aldrich, UK) 8. Mobile Phase A - 0.1 % Formic Acid in Water
Mix 1 L of water with 1 mL of formic acid. This solution is stable for one week when stored at room temperature.
9. Mobile Phase B - 0.1 % Formic Acid in Acetonitrile Mix 1 L of acetonitrile with 1 mL of formic acid. This solution is stable for two weeks when stored at room temperature.
7.5 Calibration Preparation
7.5.1 Stock Standard The stock is acquired from Merck - Cerilliant 1 mg/mL CBN (P/N: C-046), THCV (P/N: T-094), ∆9-THC (P/N: T-4764), ∆8-THC (P/N: T-032) and ∆9THCA-A (P/N: T-093) solution.
7.5.2 Individual Intermediate Standard Individual intermediate solutions in 100% methanol are prepared to form 5 individual 100 μg/mL solutions.
7.5.3 Mixed Intermediate Standard The intermediates are then mixed to make a working solution containing all 5 cannabinoids in acetonitrile/water 50/50 v/v at 10 μg/mL.
7.5.4 Calibration Line The mixed working solution is the used to prepare a calibration line in acetonitrile/water 50/50 v/v to form the following points: 250, 200, 150, 100, 50, 5, and 1 ng/mL.
7.5.5 Autosampler Vial In an autosampler vial place 200 µL of calibration standard (7.6.34) and 50 µL internal standard working solution (7.6.3).

Page 16 of 19 Government Chemist CBD Food and Cosmetic Ring Trial – T. Hambidge
7.6 Internal Standard Preparation
7.6.1 Stock Standard The stock is acquired from Merck - Cerilliant 100 µg/mL CBN-D3 (P/N: C-115), ∆9THCA-A-D3 (P/N: T-145), ∆9-THC-D3 (P/N: T-003) solutions.
7.6.2 Individual Intermediate Standards Individual intermediate solutions in 100% methanol are prepared to form 3 individual 10 μg/mL solutions.
7.6.3 Working Standard Dilute further and combine in acetonitrile/water 50/50 v/v to a mixed working solution of 500 ng/mL.
7.7 Sample Preparation
As cannabinoid concentrations are completely unknown – initially aim to dilute all samples to maximum of 0.1 mg/mL CBD concentration. The majority of the CBD peak should then be redirected to waste at its retention time. This is because overloading CBD causes contamination issues in the mass spectrometer. The dilution can then be altered if the samples are over calibration range. 7.7.1 Food Oil Samples
7.7.1.1 Dilution 1 1. Vigorously vortex mix the sample, if bubbles form, wait for bubbles to dissipate
before taking an aliquot for analysis. 2. Take a minimum of 500 µL of sample. 3. Dilute firstly with propan-2-ol. 4. Vortex mix. 5. Sonicate for 30 minutes. 6. Vortex mix. 7. Centrifuge for 10 minutes at 4000 RPM (3220 G).
7.7.1.2 Dilution 2 8. If layers are formed, aliquot from the top layer of previous dilution. 9. Dilute with acetonitrile. 10. Vortex mix. 11. Sonicate for 10 minutes. 12. Vortex mix. 13. Centrifuge for 10 minutes at 4000 RPM (3220 G).

Page 17 of 19 Government Chemist CBD Food and Cosmetic Ring Trial – T. Hambidge
7.7.1.3 Dilution 3 14. If layers are formed, aliquot from the top layer of previous dilution. 15. Dilute with acetonitrile/water 50/50 v/v. 16. Vortex mix. 17. Sonicate for 10 minutes. 18. Vortex mix. 19. Centrifuge for 10 minutes at 12000 RPM (15700 G). 20. Add 200 µL of sample to 50 µL of internal standard working solution (7.6.3) in an
autosampler vial.
7.7.2 Cosmetic Body Wash Sample (No Centrifuging)
7.7.2.1 Dilution 1 1. Vigorously vortex mix the sample, if bubbles form, wait for bubbles to dissipate
before taking an aliquot for analysis. 2. Take a minimum of 500 µL of sample. 3. Dilute firstly with propan-2-ol. 4. Vortex mix. 5. Sonicate for 30 minutes. 6. Vortex mix.
7.7.2.2 Dilution 2 7. Dilute with acetonitrile. 8. Sonicate for 10 minutes. 9. Vortex mix.
7.7.2.3 Dilution 3 10. Dilute with acetonitrile/water 50/50 v/v. 11. Vortex mix. 12. Sonicate for 10 minutes. 13. Vortex mix. 14. Add 200 µL of sample to 50 µL of internal standard working solution (7.6.3) in an
autosampler vial.

Page 18 of 19 Government Chemist CBD Food and Cosmetic Ring Trial – T. Hambidge
7.8 HPLC Conditions
LC: Acquity H-Class UPLC Column: BEH C8 2.5 μm, 2.1x100 mm Mobile phases: A – Deionised water with 0.1% formic acid (v/v), B – Acetonitrile with 0.1% formic acid (v/v). Column temperature: 30 °C Sample temperature: 10 °C Injection volume: 20 μL Flow Rate: 0.3 mL/min Table 5. Cannabinoid Gradient
Time (min) %A %B 0.0 50 50 12.0 43 57 15.5 20 80 17.0 0 100 20.0 0 100 20.5 50 50 28 50 50
A divert valve cuts the flow to waste from 12 - 13.7 minutes to cut out the CBD peak.
7.9 MS Conditions
Mass Spectrometer: ABI Sciex 4000 Qtrap Ionisation mode: ESI+ and ESI- Temperature: 650°C Ion spray voltage: 5500 V Ion source gas 1&2: 50 Curtain gas: 10 Entrance potential: 10 V Collision cell exit potential: 15 V MRM windows are used to limit the number of analytes scanned for. Dwell times are adjusted to give a reasonable amount of points across the peaks.

Page 19 of 19 Government Chemist CBD Food and Cosmetic Ring Trial – T. Hambidge
Table 6. Cannabinoid MRMs
Analyte Transition 1 Pre-cursor
(m/z)
Transition 1 Product
(m/z)
Transition 2 Pre-cursor
(m/z)
Transition 2 Product
(m/z)
Declustering potential (V)
Collision energy (V)
THCV 287.2 165.1 287.2 231.2 60 30
CBN 311.0 223.5 311.0 241.5 75 30
CBD* 315.2 193.2 315.2 235.0 60 30
∆9-THC 315.2 193.2 315.2 235.2 60 30
∆8-THC 315.2 193.2 315.2 235.2 60 30
∆9THCA-A **
359.5 Pos 219.5 359.5 261.5 80 40
357.2 Neg 313.2 357.2 245.0 -50 -35
CBN-D3 314.0 223.0 314.0 241.0 75 30
∆9-THC-D3
318.0 196.0 318.0 238.0 60 30
∆9THCA-A-D3 **
362.5 Pos 264.5 362.5 222.5 80 40
360.0 Neg 316.0 360.0 248.0 -50 -35
*CBD should not be observed in chromatagram – the peak should elute when the flow is cut to waste ** ∆9THCA-A can be analysed in either positive ESI or negative ESI depending on instrument capability and sensitivity.

Page 60 of 65 Government Chemist CBD Food and Cosmetic Ring Trial – T. Hambidge
10 Appendix 2 – Results Template
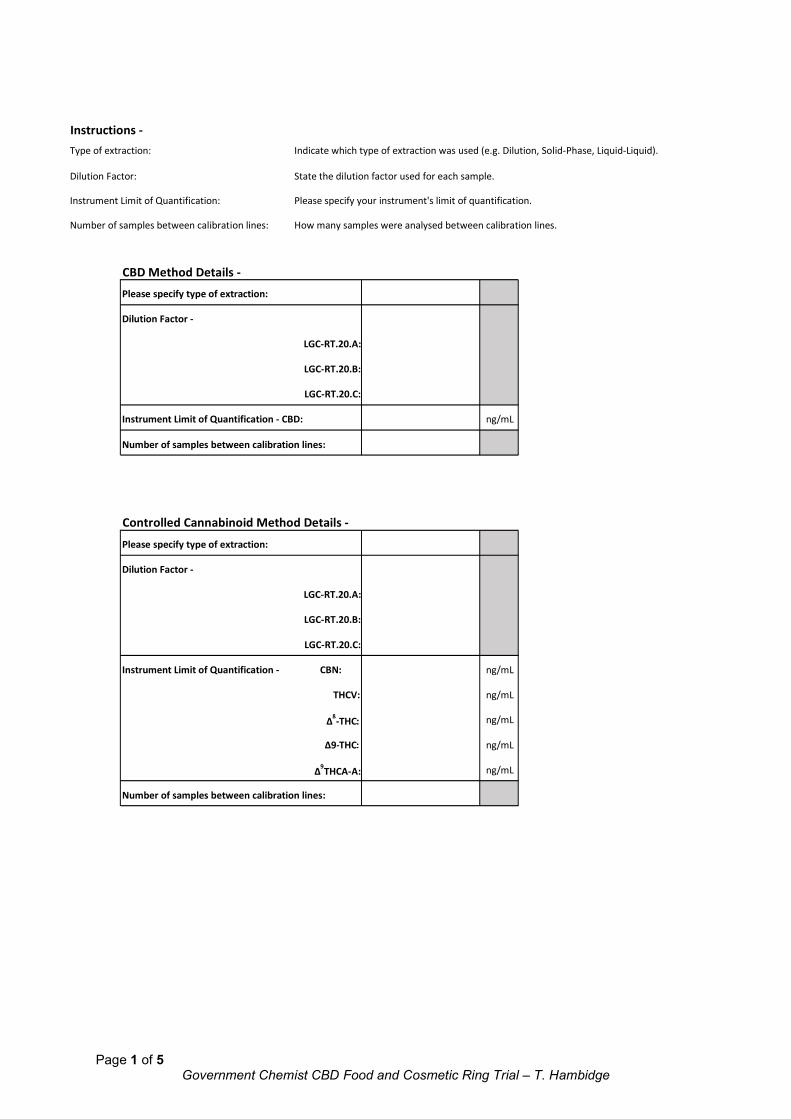
Page 1 of 5 Government Chemist CBD Food and Cosmetic Ring Trial – T. Hambidge
CBD Method Details - Please specify type of extraction:
Dilution Factor -
LGC-RT.20.A:
LGC-RT.20.B:
LGC-RT.20.C:
Instrument Limit of Quantification - CBD: ng/mL
Number of samples between calibration lines:
Controlled Cannabinoid Method Details -
Please specify type of extraction:
Dilution Factor -
LGC-RT.20.A:
LGC-RT.20.B:
LGC-RT.20.C:
Instrument Limit of Quantification - CBN: ng/mL
THCV: ng/mL
∆ 8 - THC : ng/mL
∆9- : THC ng/mL
∆ 9 THCA-A: ng/mL
Number of samples between calibration lines:
Instructions - Type of extraction: Indicate which type of extraction was used (e.g. Dilution, Solid-Phase, Liquid-Liquid).
Dilution Factor: State the dilution factor used for each sample.
Instrument Limit of Quantification: Please specify your instrument's limit of quantification.
Number of samples between calibration lines: How many samples were analysed between calibration lines.

Page 2 of 5 Government Chemist CBD Food and Cosmetic Ring Trial – T. Hambidge
Meta Data Instructions - Institute: State the name of your institute. Replicate: Extract your sample in singlicate on three separate days. Bottle Number: Indicate the bottle number of the sample you received. Extraction Date: Date sample was extracted. CBD Extraction Method: Indicate which institutes extraction method was used (e.g. LGC, Own Method). CBD Analysis Method: Indicate which institutes analysis method was used (e.g. LGC, Own Method). Instrument Analysis Date: Date sample was analysed on the instrument. Technique: Indicate the analysis technique used (e.g. LC-MS/MS, GC-MS, GC-FID). Internal Standard: Indicate which internal standard was used (e.g. CBD-d3) or, if no internal standard was used for the analyte, type none.CBD Calculated Concentration mg/mL: Calculate the concentration of CBD in the sample in mg/mL. CBD Calculated Concentration mg per pack: Calculate the concentration of CBD in the sample in mg per pack.
LGC-RT/20/A CBD Hemp Food Oil - CBD Results Pack Size: 30 mL
Institute Replicate Bottle Number
Extraction Date CBD Extraction Method CBD Analysis Method
Instrument Analysis
Date Technique Internal Standard CBD Calculated
Concentration mg/mL CBD Calculated
Concentration mg per pack
1
2
3 LGC-RT/20/B CBD Food Oil - CBD Results Pack Size: 30 mL
Institute Replicate Bottle Number
Extraction Date CBD Extraction Method CBD Analysis Method
Instrument Analysis
Date Technique Internal Standard CBD Calculated
Concentration mg/mL CBD Calculated
Concentration mg per pack
1
2
3 LGC-RT/20/C CBD Cosmetic - CBD Results Pack Size: 100 mL
Institute Replicate Bottle Number
Extraction Date CBD Extraction Method CBD Analysis Method
Instrument Analysis
Date Technique Internal Standard CBD Calculated
Concentration mg/mL CBD Calculated
Concentration mg per pack
1
2
3

Page 3 of 5 Government Chemist CBD Food and Cosmetic Ring Trial – T. Hambidge
Meta Data Instructions - Institute: State the name of your institute. Replicate: Extract your sample in singlicate on three separate days. Bottle Number: Indicate the bottle number of the sample you received. Extraction Date: Date sample was extracted. Cannabinoid Extraction Method: Indicate which institutes extraction method was used (e.g. LGC, Own Method). Cannabinoid Analysis Method: Indicate which institutes analysis method was used (e.g. LGC, Own Method). Instrument Analysis Date: Date sample was analysed on the instrument. Technique: Indicate the analysis technique used (e.g. LC-MS/MS, GC-MS, GC-FID). Internal Standard: Indicate which internal standard was used (E.g. CBN-d3, ∆9-THC-d3, ∆9-THCA-A-d3) or, if no internal standard was used for
the analyte, type none. Calculated Concentration µg/mL: Calculate the concentration of each analyte in the sample in µg/mL. Calculated Concentration µg per pack: Calculate the concentration of each analyte in the sample in µg per pack. Controlled Status: State whether this sample - in its commercial pack size - should be controlled.
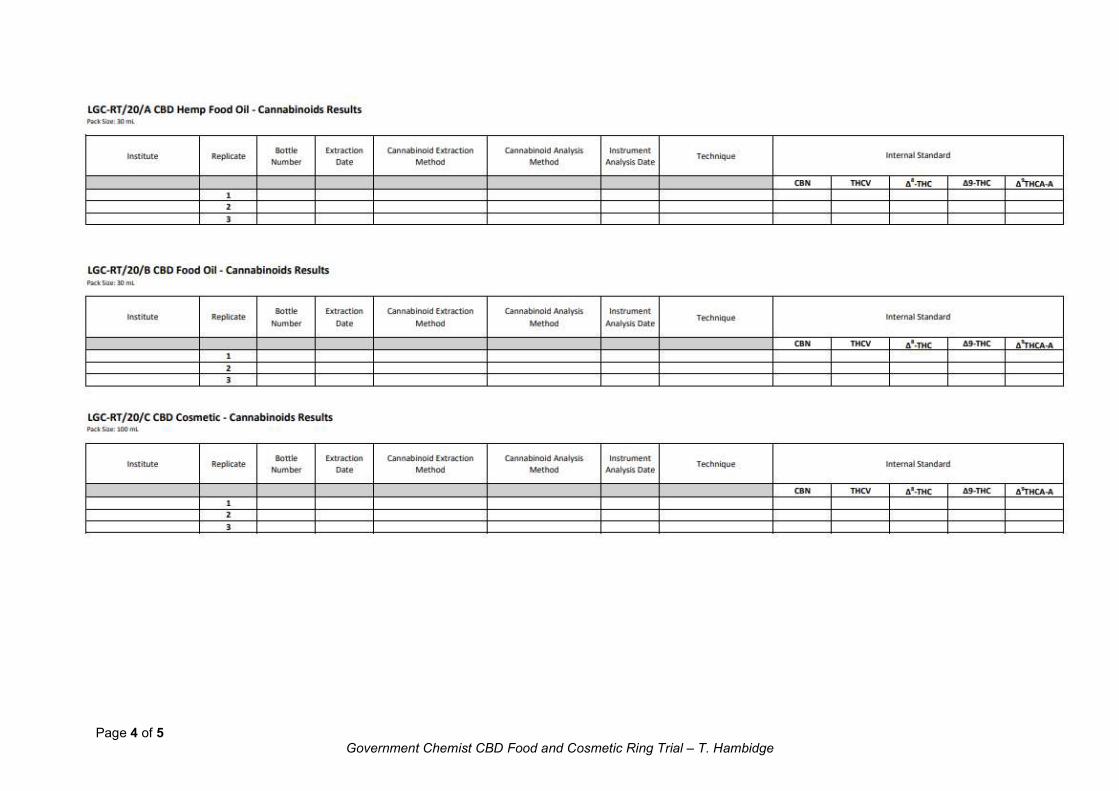
Page 4 of 5 Government Chemist CBD Food and Cosmetic Ring Trial – T. Hambidge

Page 5 of 5 Government Chemist CBD Food and Cosmetic Ring Trial – T. Hambidge