ril – rpl merger analyst presentation - aceanalyser meet/100325_20090302.pdf · ril – rpl...
TRANSCRIPT
RIL – RPL Merger Analyst Presentation
2 March 2009

2
Business Highlights

3
India’s largest private sector enterprise with strong financials:
– Revenue exceeds $ 33 billion*
– Exports of about $ 21 billion*
– EBITDA of over $ 5 billion*
Significant global player in Refining and Petrochemicals - contribute 98% to revenues
RIL at an inflection point
– Production of gas and oil from KG D6 to double India’s gas availability
– Investment in a world-class, complex refinery asset
Reliance Industries
RIL is India’s most valuable company* 9 Months FY09 figures annualized
Criteria
2008 2007
Net Sales 206 269
Net Worth 161 190
Total Assets 273 299
Net Profit 103 179
Global Ranking
Global Ranks (Fortune Global 500 )

4
Robust Growth Since IPO
CAGR % CAGR %
(in US$ Million) 31 Years 5 Years
Turnover 76 13,701 34,713 22% 20%
Net Profit 3 864 3,804 26% 35%
Cash Profit 5 1,593 6,282 26% 32%
Total Assets 38 13,422 37,348 25% 23%
NetWorth 11 6,387 20,311 27% 26%
Exports 7 2,424 20,811 29% 54%
Market Cap* 11 8,129 39,507 30% 37%
FY 1977 FY 2002-03 FY 2007-08
Data of as on March 31 each year; * Market Cap data as on 27th February 2009
Consistent growth through business cycles
Net Profit increase greater than 20% per annum in any 5-year period since IPO

5
RIL Refining – Mantras for Success
In 1999, RIL commissioned a large, world class, complex refinery in record
time at competitive capital cost
Created industry benchmarks across various operating parameters
Product slate designed to cater to fast growing transportation fuels
segment and stringent product specifications, across regions
Processed over 80 heavy/sour crude variants from across the world
Consistently demonstrated higher GRMs compared to global benchmarks
RIL has an enviable track record in its decade long refining operations

6
RIL: Unparalleled Refining Efficiency
Premium quality of assets enabled consistent highest operating rate
86% 86%88%
99%
Asia Pacific Europe North America RIL
Average Capacity Utilization (%) - 2001-2008
Source: BP Statistical Review

7
RIL’s Refining Performance
High quality of refining asset and operations resulting in consistent and
superior performance across business cycles
Cracking margins Source: Reuters / Company Data
02468
10121416
Q1
FY03
Q3
FY03
Q1
FY04
Q3
FY04
Q1
FY05
Q3
FY05
Q1
FY06
Q3
FY06
Q1
FY07
Q3
FY07
Q1
FY08
Q3
FY08
Q1
FY09
Q3
FY09
US$/
bbl
0
2
4
6
8
10RIL GRM Singapore Complex Premium over Sing

8
RPL Highlights
Crude processing capacity of 580,000 barrels/day, completed in a record
time of 36 months
Higher complexity: Nelson Complexity Index of 14.0
– Among the top 5% refineries globally with capability to process ultra-
heavy crude (Average API of 24)
– Built to supply ultra-clean fuels to meet the world’s evolving needs
– Focus on high growth transportation fuel segment
Lowest US$/complexity-barrel cost among recently built refinery projects
Crude refining commenced on 25th Dec ‘08 and first parcel of product
exported in Jan ‘09
World class refinery with minimal project risk; ready to deliver superior returns

9
Merger Highlights

10
Merger Rationale
Unlock synergies from combined operations
– Crude sourcing, Product placement, Supply Chain Optimization
Greater flexibility in operations planning
Expansion of refined product range
Optimized utilization of secondary process units and infrastructure
Efficient utilization of combined cash flows
Integrated energy companies consistently get higher valuations vis-à-vis
pure refiners; Mitigate Holding Company discount
EPS accretive
RIL to enhance its competitiveness in energy value chain
11
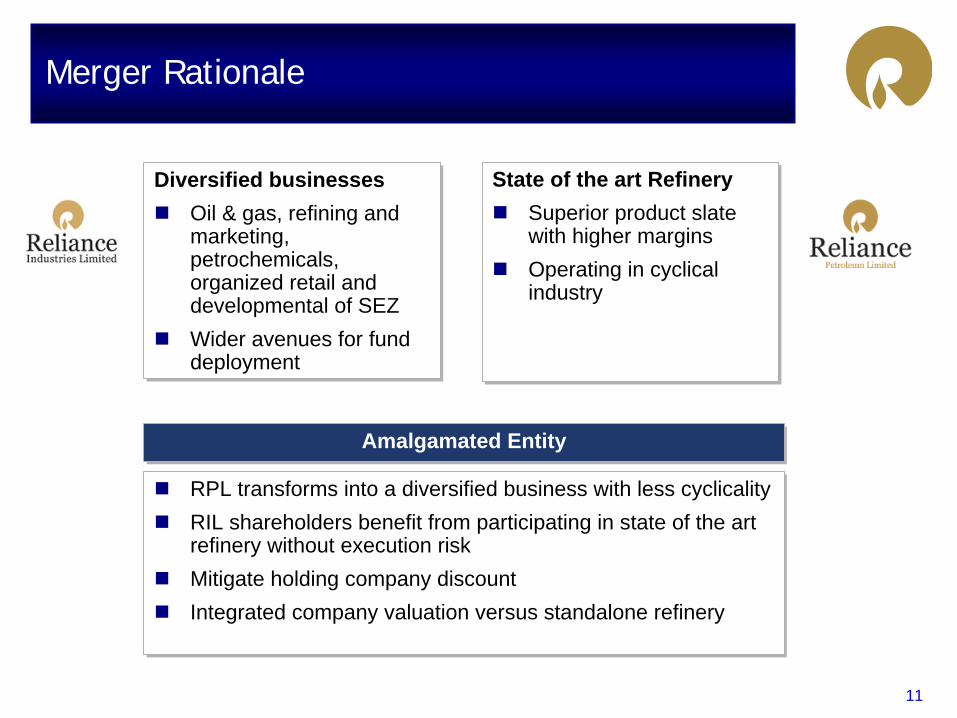
Diversified businesses Oil & gas, refining and marketing, petrochemicals, organized retail and developmental of SEZWider avenues for fund deployment
Diversified businesses Oil & gas, refining and marketing, petrochemicals, organized retail and developmental of SEZWider avenues for fund deployment
RPL transforms into a diversified business with less cyclicalityRIL shareholders benefit from participating in state of the art refinery without execution riskMitigate holding company discountIntegrated company valuation versus standalone refinery
RPL transforms into a diversified business with less cyclicalityRIL shareholders benefit from participating in state of the art refinery without execution riskMitigate holding company discountIntegrated company valuation versus standalone refinery
Amalgamated EntityAmalgamated Entity
State of the art RefinerySuperior product slate with higher marginsOperating in cyclical industry
State of the art RefinerySuperior product slate with higher marginsOperating in cyclical industry
Merger Rationale

12
Integrated vs Standalone - Historical
-
2
4
6
8
10
12
14
16
1997
1998
1999
2000
2001
2002
2003
2004
2005
2006
2007
2008
Pure Refiners Integrated
On a longer-term, sustainable basis, markets ascribe superior valuations to integrated energy companies vis-a-vis standalone refiners
Source: Bloomberg
10-Yr Avg. Premium of 26%5-Yr Avg. Premium of 16%
-
10
20
30
1997
1998
1999
2000
2001
2002
2003
2004
2005
2006
2007
2008
Pure Refiners Integrated
10-Yr Avg. Premium of 26%5-Yr Avg. Premium of 18%
PE Ratio EV / EBIDTA

13
RIL vs RPL - Historical
RIL and RPL have outperformed the Sensex since RPL IPO
RIL’s superior performance relative to RPL demonstrates its evolution as a world-class integrated energy company
0
50
100
150
200
250
300
350
May-06
Aug-06
Nov-06
Feb-07
May-07
Aug-07
Nov-07
Feb-08
May-08
Aug-08
Nov-08
Feb-09
Sensex RIL RPL
Indexed Stock Performance
Source: Bloomberg

14
Current valuation reflects premium for integrated players across all parameters
Current Valuations
Source: Research Reports
CY09 / FY09
CY10 / FY11
CY09 / FY09
CY10 / FY11
CY09 / FY09
CY10 / FY11
Reliance Industries 9.7 7.9 7.5 6.1 1.5 1.2
Reliance Petroleum 7.0 5.0 6.1 4.4 2.3 1.7
Asian Refiners 9.9 7.4 6.5 4.1 1.3 1.1
European Refinerw 10.7 9.5 4.7 4.5 0.7 0.6
US Refiners 8.8 6.6 4.7 3.6 1.4 0.9
Global Refining Average 9.8 7.8 5.3 4.1 1.1 0.9
Asian Integrated 11.4 9.2 6.6 5.1 1.2 1.1
Europen Integrated 13.6 9.8 5.8 4.5 1.6 1.5
US Integrated 16.9 8.9 5.7 4.0 1.5 1.4
Global Integrated Cos. 14.0 9.3 6.0 4.5 1.4 1.3
Premium over Pure Refiners 43% 19% 14% 11% 28% 49%
PER (x) EV/EBIDTA (x) PBV (x)
Source: Bloomberg / Analyst Research; Based on 27-Feb-09 Prices
15
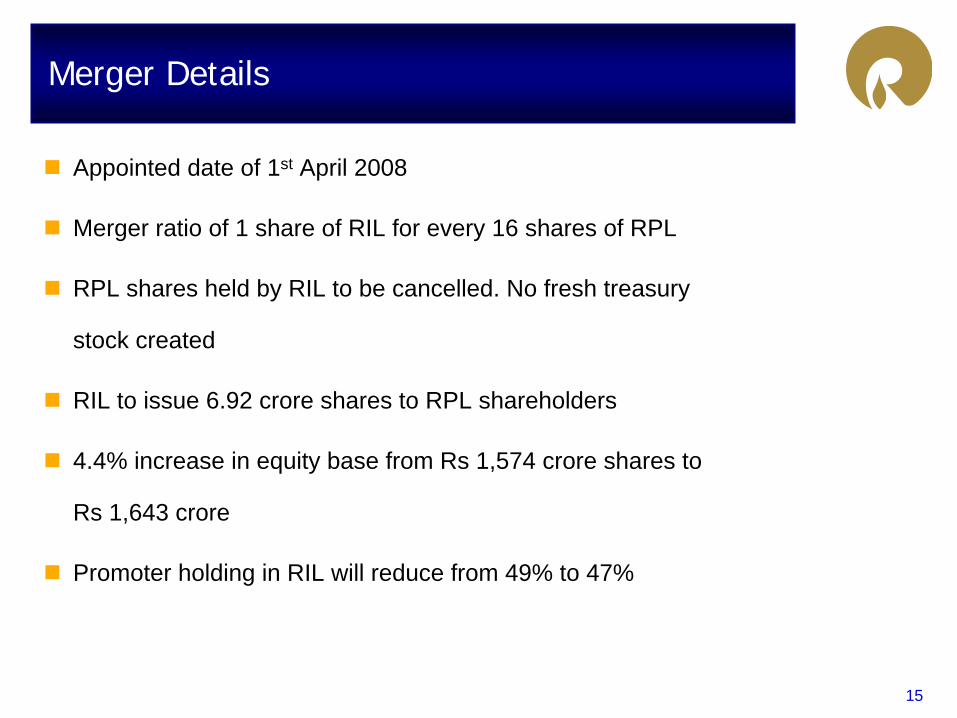
Appointed date of 1st April 2008
Merger ratio of 1 share of RIL for every 16 shares of RPL
RPL shares held by RIL to be cancelled. No fresh treasury
stock created
RIL to issue 6.92 crore shares to RPL shareholders
4.4% increase in equity base from Rs 1,574 crore shares to
Rs 1,643 crore
Promoter holding in RIL will reduce from 49% to 47%
Merger Details

16
Advisors
Valuation Advisors
– Ernst & Young Pvt. Ltd. And
– Morgan Stanley India Co. Pvt. Ltd.
Transaction Advisors
– J.M. Financial Services Pvt. Ltd. and
– Kotak Mahindra Capital Co Ltd.
Fairness Opinion
– DSP Merrill Lynch Ltd. (for RIL) and
– Citigroup Global Markets India Pvt. Ltd (for RPL)
Legal Advisor
– Amarchand & Mangaldas & Suresh A. Shroff & Co.
Tax Advisor
– PriceWaterhouse and Coopers Pvt. Ltd.
17
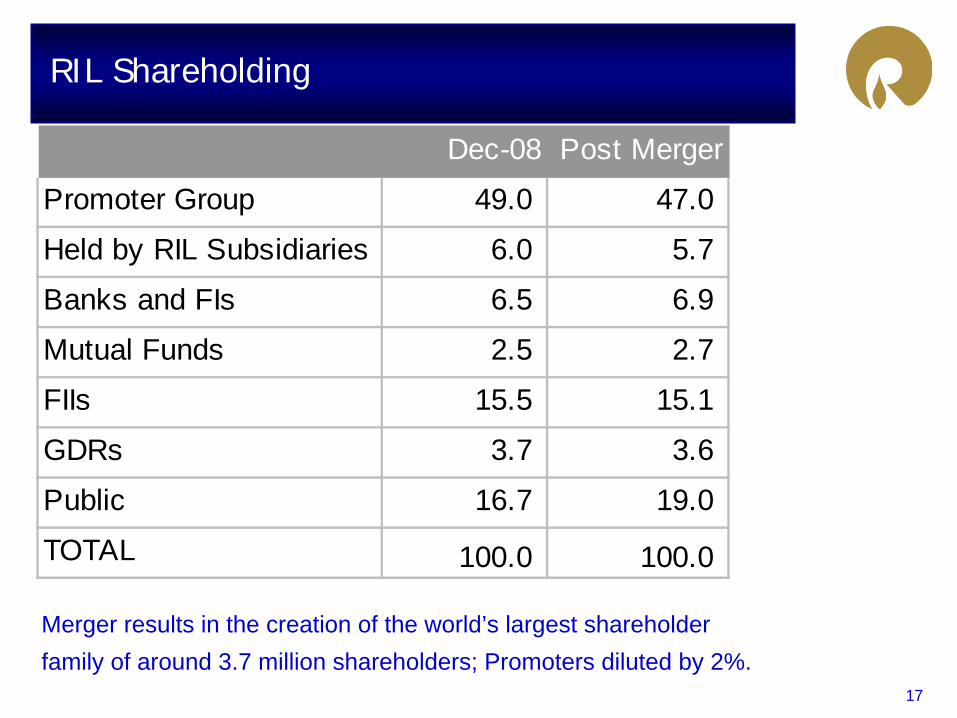
Dec-08 Post Merger
Promoter Group 49.0 47.0
Held by RIL Subsidiaries 6.0 5.7
Banks and FIs 6.5 6.9
Mutual Funds 2.5 2.7
FIIs 15.5 15.1
GDRs 3.7 3.6
Public 16.7 19.0
TOTAL 100.0 100.0
RIL Shareholding
Merger results in the creation of the world’s largest shareholder family of around 3.7 million shareholders; Promoters diluted by 2%.

18
Impact of Merger Proposal
RIL among top 10 private sector refining companies globally
Will own 2 of the world’s 3 largest, most complex modern refineries
Will be the world’s largest producer of ultra-clean fuels at a single
location
Among 50 most profitable companies globally
Among five largest producers of Polypropylene
Providing the growth platform for creating value-accretive downstream opportunities

19
Post Merger Highlights
20
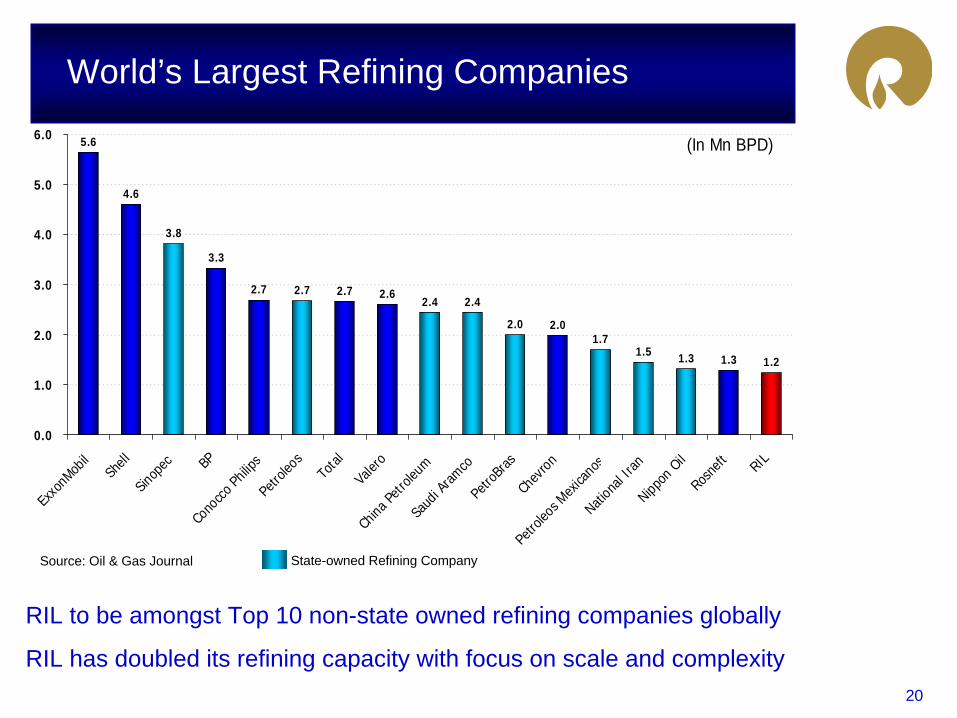
World’s Largest Refining Companies
RIL to be amongst Top 10 non-state owned refining companies globally
RIL has doubled its refining capacity with focus on scale and complexity
5.6
4.6
3.8
3.3
2.7 2.7 2.7 2.62.4 2.4
2.0 2.01.7
1.5 1.3 1.3 1.2
0.0
1.0
2.0
3.0
4.0
5.0
6.0
Exxo
nMob
il
Shell
Sinop
ec BP
Cono
cco Ph
ilips
Petro
leos
Total
Valer
oCh
ina Pe
troleu
mSa
udi A
ramco
Petro
Bras
Chev
ron
Petro
leos M
exica
nos
Nation
al Ira
nNipp
on O
ilRos
neft RIL
(In Mn BPD)
Source: Oil & Gas Journal State-owned Refining Company

21
World’s Most Complex Refineries
Company Location CDU
Capacity (KBPSD)
Nelson Complexity Index
CONOCO IMMINGHAM 170 16.8 ULTRAMAR DIAMOND MARTINEZ 108 16.6 SHELL / TEXACO MARTINEZ 151 15.1 EXXONMOBIL TORRANCE 130 14.9 BP-AMOCO TEX.CITY 433 14.2 RIL - SEZ JAMNAGAR 580 14.0 CITGO (PDVSA) CORP.CRISTEX 133 13.8 CHEVRON USA RICHMOND 229 13.7 BP-AMOCO CORP TOLEDO 137 13.4 OBERRHEINISCHE KARLSRUHE 116 13.4 VALERO ENERGY CORP. BENICIA 128 13.3 SHELL/TEX / S.ARAMCO DEL.CITY 140 13.1 MARAVEN CARDON 286 12.8 PHILLIPS CO. BORGER 125 12.7 LYONDELL CITGO REF HOUSTON 265 12.7 CHEVRON USA INC. PASCAGULAMSS 295 11.9 SHELL OIL CO. USA DEER PK 268 11.4 RIL - EOU JAMNAGAR 660 11.3 CITGO PETR.CORP LAKE CHARLOU 320 11.2 KOCH REFINING CO. ROSEMOUNT 262 11.1 Total 4,936
Reliance owns 25% of World’s most complex refining capacitySource: IEA

22
Top 5 Complex Refineries Globally
CDU Capcitykbpsd
BP Texas City 433 14.2RIL SEZ Jamnagar 580 14.0RIL EOU Jamnagar 660 11.3Citgo Lake Charles 320 11.2Exxon Mobil Baytown 428 10.9Exxon Mobil Beaumont 320 10.8
Nelson Complexity IndexCompany Location
Reliance owns 2 of the 3 largest complex refineries
Source: IEA

23
Creating the Refining Hub of the World
Source: Oil & Gas Journal, Dec’ 08
RIL will have the largest and the most complex refining capacity at single location in the world
0.50
0.52
0.52
0.55
0.57
0.61
0.68
0.94
1.24
0.82
- 0.20 0.40 0.60 0.80 1.00 1.20 1.40
XOM, Baton Rouge
S-Oil Corp, S. Korea
Formosa, Taiwan
Saudi Aramco
XOM, Baytown, USA
XOM, Singapore
LG -Caltex, S. Korea
SK Corp, S. Korea
Paraguana, Venezuela
RIL, India
Capacity in Mn BPD
12.6 7.1 4.6 4.9 8.8
12.6 3.0 6.2 6.9
12.3
Nelson Complexity

24
Global Polypropylene Rankings
Capacity Capacity Rank (In MMTPA) Capacity Rank
5.8 1 Basell 6.1 13.7 2 SINOPEC 4.6 21.9 8 CNPC 3.2 32.0 7 SABIC 2.9 41.9 9 RIL 2.8 52.6 3 Total 2.7 62.1 6 Formosa 2.3 72.3 4 Ineos 1.7 92.2 5 Exxon Mobil 2.3 81.3 10 Abu Dhabi Gov't 1.6 10
2008 2010
Source: CMAI 2009
Merger takes RIL in to a Top 5 PP producer globally

25
Jamnagar – A Refinery Super-site
Rail loading
Road loading
Gas / LPG Pipeline
Dedicated deepwater port capable of turning around VLCC & ULCC in 24/36 hours
Dedicated De-sal / DM Plant
Captive Products Jetties
Captive 1000 MW Power
Dedicated Storage Infrastructure -226 Tanks and 4.6 Mn MT capacity
RIL EOU Refinery660 KBPSD
RIL SEZ Refinery580 KBPSD

26
India’s largest ever merger
RPL shareholders to get 1 share of RIL for every 16 shares of RPL
RIL’s holding in RPL to be cancelled. No fresh treasury stock created
RIL to be among top 10 private sector refining company globally
RIL to be among the world’s largest producer of Ultra Clean Fuels
Merger to unlock greater efficiency from scale and synergies
Merger to be EPS accretive; AAA rating reaffirmed by CRISIL
RIL to have 3.7 million shareholders
Summary

Thank You