rights / license: research collection in copyright - non ...4663/eth... · automated microinjection...
TRANSCRIPT
Research Collection
Doctoral Thesis
Automated microinjection with integrated cell sorting,immobilization and collection
Author(s): Graf, Siegfried F.
Publication Date: 2011
Permanent Link: https://doi.org/10.3929/ethz-a-006682141
Rights / License: In Copyright - Non-Commercial Use Permitted
This page was generated automatically upon download from the ETH Zurich Research Collection. For moreinformation please consult the Terms of use.
ETH Library
DISS. ETH No. 19893
Automated Microinjection with Integrated Cell Sorting, Immobilization and Collection
DISSERTATION
Submitted to
ETH ZURICH
for the degree of DOCTOR OF SCIENCES
by SIEGFRIED FEDERICO GRAF
Dipl. Ing. ETH Zurich, MAVT
born September 30, 1978
citizen of Schötz (LU), Switzerland
accepted on the recommendation of
Prof. Dr. Andreas Stemmer, examiner Prof. Dr. Bradley Nelson, co-examiner
Dr. Helmut F. Knapp, co-examiner
Alpnach, 2011

Abstract
One of the first steps in cell assay experiments is the cell preparation. One step of cell preparation often is the introduction of genetic material into cells. This process is called transfection, and causes cells to express proteins of other species. For example in drug discovery, to receive valuable results for human drugs, these cells are equipped with human membrane proteins by transfecting the cell with the coding messenger RNA. About two thirds of currently available drugs depend on such membrane proteins. Various transfection methods evolved over the past decades, spanning from biological methods like viral transfection to chemical methods like transfection by synthetic compounds over electrical methods known as electroporation to a mechanical method called microinjection, where a glass needle is used to transfer the genes into the cell. Advantages of microinjection over the competitive methods are its high yield and its highest flexibility of introducing even a combination of compounds into various different cell types. However, microinjection has a low throughput and the yield is highly user dependent. These two drawbacks call for automation. In the past, various systems were presented which focused solely on the microinjection process. Injection needles can automatically be detected, injection volumes can be calibrated, and forces applied to the cell during microinjection can be measured. Even do methods exist which are able to detect blocked or broken needles. These systems help to increase the throughput and minimize human error during microinjection. However, analyzing the complete cycle of cell preparation identifies another bottleneck. This is the identification of viable cells for later microinjection. In many laboratories this step is done manually because none or only highly expensive systems can perform such tasks. To rule out human errors on the final microinjected cell, not only the microinjection but also the upfront cell sorting has to be automated and put into one system. Therefore, the scope of this thesis was widened from only automating microinjection to automated sorting and microinjecting. Finally, a system could be presented where the user only has to add a cell suspension and a prefilled injection needle. The sorting, microinjection and collection were then performed automatically by the system. Along this novel approach of combining sorting, injection and collection into one system, the sorting system uses a continuous sorting principle which moves cells in a circle continuously, so delivery of cells on demand is now for the first time possible. Furthermore, the microinjection system was equipped with a carousel stage, which now enables one to perform repetitive steps as cell immobilization, cell injection and cell
ii ABSTRACT
collection simultaneously for subsequent cells. The effectiveness and performance were tested. Results show that membrane proteins were expressed similar to the manual microinjection. The performance of the automated system is slightly faster and allows one to prepare for example batches of 400 oocytes in one day instead of the two days previously needed. The sorter was also used as a standalone version in connection with a well plate feeder. This allowed one to dispense zebrafish eggs out of a suspension into 96-well plates in a similar speed to the manual technique, but the same quality could be sustained over 24 hours while lab personal can only perform this task for about 3 hours before exhaustion. The methods and systems developed in this thesis allow one to increase the quality but also the throughput compared to currently manually performed processes. Focus was on high qualitative sorting and transfecting results but also on operator friendliness of the systems. The techniques for the novel sorting principle and the carousel principle for microinjection were protected with patent applications. Furthermore, the system for sorting and microinjecting Xenopus laevis oocytes as well as the system for dispensing individual zebrafish eggs into single wells of a multi-well plate were published in the journal of the association for laboratory automation (JALA). The publication on the zebrafish egg sorting system additionally was selected as the cover story for the April 2011 issue of JALA, to highlight the novelty of replacing the exhausting manual large cell handling processes with a low cost automated system.
Kurzfassung
Einer der ersten Schritte von zellbasierten Untersuchungen ist die Präperation der Zellen. Meist beinhaltet dieser Schritt die Zellen mit Genen zu modifizieren, so dass Proteine von anderen Zellarten exprimiert werden. In der Medikamentenforschung zum Beispiel, werden relativ einfach zu handhabende nicht-humane Zellen mit menschlichen Membranproteinen ausgestattet. Dies geschiet über die Transfektion der Zelle mit Boten-RNA. Zwei drittel der kommerziell erhältichen Medikamente wirken nur dank dieser Membranproteine. In den vergangenen Jahrzenten wurden etliche Transfektionsmethoden entwickelt, vom biologischen Ansatz mittels Virus, dem chemischen Ansatz mit synthetischen Substanzen, dem elektrischen Ansatz genannt Elektroporation bis zum mechanischen Ansatz genannt Mikroinjektion, wo eine Glasnadel den zu injezierenden Stoff in die Zelle transportiert. Vorteil der Mikroinjektion ist die hohe Überlebensrate wie auch die grosse Flexibilität, Kombinationen von unterschiedlichsten Stoffen in unterschiedlichste Zelltypen zu injezieren. Wesentliche Nachteile der Mikroinjection sind aber der geringe Durchsatz wie auch der grosse Einfluss des Benutzers. Diese zwei Punkte rufen förmlich nach Automation. Unterschiedlichste automatisierte Lösungen für die Mikroinjektion wurden schon präsentiert. Unter anderem können Injektionsnadeln automatisch detektiert, Injektionsvolumen automatisch kalibriert und wirkende Kräfte auf Zellen gemessen werden. Sogar die Fähigkeit gebrochene oder verstopfte Kapillaren zu detektieren wurde gezeigt. Diese Systeme ermöglichen die Injektionsqualität erheblich zu verbessern und auch den Durchsatz zu erhöhen. Doch beim Analysieren des gesamten Präperationprozesses zeigt sich, dass ein weiterer Flaschenhals beim Sortieren exisitiert. Dieser Schritt ist in vielen Labors noch immer manuell da kein oder nur sehr kostspielige Systeme erhältlich sind. Um also menschliche Fehler zu minimieren und den Durchsatz zu erhöhen, sollte nicht nur die Mikroinjektion sondern auch der vorhergende Schritt, die Zellsortierung, automatisiert und und mit der Mikroinektion kombiniert werden. Das Ziel dieser Dissertation war deshalb, nebst der Mikroinjektion auch das automatische Sortieren in einem Gerät zu ermöglichen. Das Resultat dieser Arbeit ist ein System, welches voll automatisch Zellen sortiert, mikroinjeziert und schlussendlich in einem Behälter sammelt. Nebst diesem neuartigen Ansatz der Kombination von Sortieren, Mikroinjezieren und Sammeln arbeitetet das System mit einem kontinuierlichen Sortierprinzip, welches zum ersten Mal erlaubt, Zellen kontinuierlich

iv KURZFASSUNG
kreisen zu lassen und auf Abruf geeignete Zellen zu liefern. Zudem ist das Injektionssystem mit einem Karusselapparat ausgerüstet. So kann man die seriellen Prozesse von der Zellimmobilisation, Zellinjektion und Sammeln parallel für aufeinanderfolgende Zellen durchführen. Die Effektivität und Durchsatz wurden im Labor getestet. Die Resultate zeigen, dass die Membranproteine ähnlich zum manuellen Vergleichsversuch exprimiert werden konnten. Dank des Systems konnte eine typische Liefermenge von 400 Xenopus laevis Oozyten in einem statt in zwei Tagen realisiert werden. Der Sortierer wurde auch als eigentständiges Gerät verwendet, um Eier des Zebrafisches in Suspension in 96er Mikrotiterplatten zu dispensieren. Die Durchsatzzeit war vergleichbar mit dem manuellen Prozess doch kann das System eine konstante Qualtiät über 24 Stunden liefern, wo ein Laborant nach 3 Stunden erschöpft ist. Die in dieser Dissertation erarbeiteten Methoden und Systeme, erlauben die Qualität wie auch den Durchsatz im Vergleich zum manuellen Prozess zu erhöhen. Der Fokus dieser Dissertation wurde aber nicht nur auf die hohe Qualität des Sortierens und Mikroinjezierens gelegt, sonder auch auf die Benutzerfreundlichkeit. Die Methoden für das neuartige Sortierprinzip wie auch das durchsatzerhöhende Karusselsystem sind mit Patentanmeldungen geschützt. Zusätzlich wurde das System zum automatischen Sortieren und Mikroinjezieren für Xenopus laevis Oozyten wie auch das System zum Vereinzeln von Zebrafischeiern in Mikrotiterplatten im Journal für Laborautomation (JALA) veröffentlicht. Letztere Publikation wurde ausserdem in der April 2011 Ausgabe von JALA als Titelgeschichte ausgewählt, welche die neuartige Möglichkeit aufzeigt, den ermüdenden manuellen Prozess der Zelldispension durch ein kostengünstiges automatisches System zu ersetzten.
Contents
Abstract i
Kurzfassung iii
Contents v
1 Introduction 1 1.1 State-of-the-art Cell Sorting .................................................................................. 2 1.2 State-of-the-art Cell Transfection ......................................................................... 6
1.2.1 Chemical approach ..................................................................................... 8 1.2.2 Biological approach .................................................................................... 8 1.2.3 Physical (electrical and mechanical) approach .......................................... 8 1.2.4 Summary ................................................................................................... 11
1.3 Typical biological samples ................................................................................. 12 1.3.1 Hard to transfect cells (HTC) ................................................................... 12 1.3.2 High value cells (HVC) ............................................................................ 12 1.3.3 Highly unique cells (HUC) ....................................................................... 12 1.3.4 Highly contractile cells (HCC) ................................................................. 13 1.3.5 Xenopus laevis oocytes ............................................................................. 13 1.3.6 Zebrafish embryos and larvae ................................................................... 16
1.4 Application areas of this thesis ........................................................................... 18
2 Cell Sorter for medium to large biological samples 21 2.1 First ideas and concepts ...................................................................................... 22
2.1.1 CellBot ...................................................................................................... 24 2.1.2 Rough sorter .............................................................................................. 30 2.1.3 Fine sorter ................................................................................................. 33
2.2 Final system ........................................................................................................ 43
3 Cell Injector for small to large biological samples in suspension 55 3.1 First ideas and concepts ...................................................................................... 56 3.2 Final System ........................................................................................................ 63
vi CONTENTS
4 Applications 71 4.1 ZebraFactor ......................................................................................................... 71
4.1.1 State-of-the-art zebrafish embryo “sorting” ............................................. 72 4.1.2 Automated System .................................................................................... 74 4.1.3 Experiment ................................................................................................ 79 4.1.4 Result ........................................................................................................ 79 4.1.5 Discussion ................................................................................................. 82
4.2 XenoFactor .......................................................................................................... 83 4.2.1 State-of-the-art Xenopus laevis microinjection ........................................ 84 4.2.2 Automated System .................................................................................... 86 4.2.3 Experiment ................................................................................................ 90 4.2.4 Result ........................................................................................................ 91 4.2.5 Discussion ................................................................................................. 95
Summary 97
Acknowledgments 99
Bibliography 101
Curriculum Vitae 107
vii
This thesis includes material published in the Journal of the Association for Laboratory Instruments, Volume 16: Issue 2, Pages 105-111, April 2011 Issue 3, Pages 186-196, June 2011 Furthermore, this thesis includes material published in the patent applications: US2010062480 (A1), EP2161562 (A2) US2011003326 (A1), WO2009092759 (A1), EP2238235 (A1)

Chapter 1
Introduction
After decades of research in cell transfection, microinjection remains one of the most efficient transfection techniques. However, the manual or semi-automated approach mainly lacks the throughput and user friendliness. Still, it is an often used method to transfect biological material e.g. in the field of drug development, toxicity testing, knock-down studies etc. For example, the REACH-initiative launched in 2007 demands testing of all compounds from which more than 1 ton/year is used in Europe. These thousands of compounds have to undergo toxicity testing which should be performed less and less on animals. That is why, cell based assays are the preferred method to go. To use these cells for such experiments, they typically have to be genetically modified. Another example is in drug development research where huge libraries were built to find the gene sequence responsible for the disease but also for suitable drug components. To find the gene and the suitable components microinjection is applied to genetically modify the cell and make it suitable for drug screening. Because the available amount of components and sequences is ever increasing in each mentioned field, the demand for a reliable high throughput transfection technique is rising. That is why, one part of an integrated European project called Hydromel (NMP2-CT-2006-026622) was dedicated for high throughput automated cellular microinjection in conjunction with self-assembly and robotics. This thesis as a part of Hydromel concentrates on getting the microinjection technique in terms of its throughput, and user friendliness more competitive compared to other high throughput transfection techniques (which however show higher cell death in percentage). During the improvement of the microinjection process (initial goal of this thesis) it turned out, that another critical bottleneck in the screening process is the cell sorting. As an example, sorting of thousands of large samples like Xenopus laevis oocytes or zebrafish eggs is still done manually in most laboratories. Therefore, the topic of this thesis was expanded to widen also this bottleneck. In this chapter an overview about the current state-of-the-art cell sorting and cell injection is given. Additionally, the different cell types used in this thesis are discussed.
2 CHAPTER 1. INTRODUCTION
1.1 Stateoftheart Cell Sorting
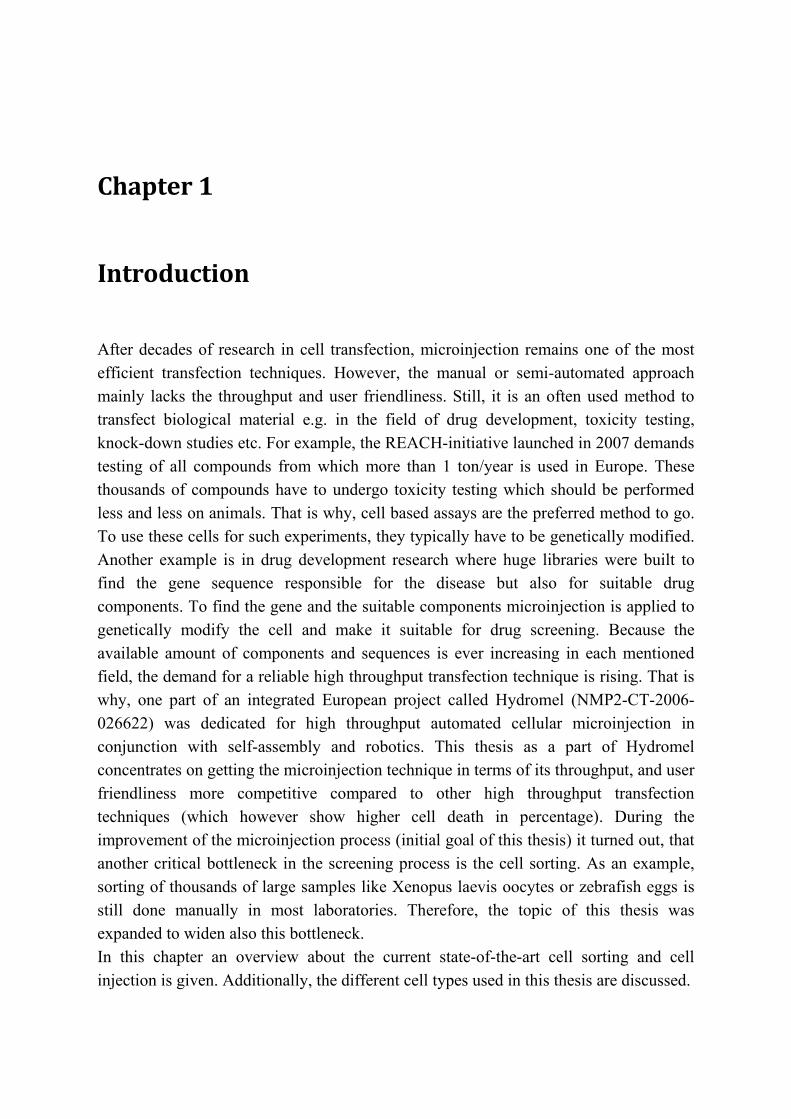
Sorting cells is a widely used technique to (i) select certain single cells or (ii) purify cell populations of interest in the field of medicine, molecular biology, pathology, immunology, drug discovery etc. One way to sort cells is passive sorting by using the cells physical properties/behavior in a fluidic field such as e.g. weight, size, type, label, or viability (dielectrophoresis).These techniques usually have a very high throughput because often they can be run massively parallel. An example is magnetic cell sorting where a magnet is used to remove either the wanted or unwanted cells after the chosen ones were labeled with an antibody bound to a magnetic particle [1]. Other examples are sorting/separating by dielectrophoresis [2, 3], centrifugation, filtering [4, 5], combination of laminar flow and motility [6] etc. Another way is active sorting by combining a flow cytometry principle with a sorting technique. Here, typically each sample is handled individually, so in a serial process. In flow cytometry samples like cells, particles or other biological entities can be counted and can be analyzed for their physical and/or chemical properties. Physical properties are e.g. the scattered light, appearance (size, shape, contrast) or the electrical conductivity. Chemical properties are e.g. DNA / RNA content or protein content. Depending on the technique a throughput of up to several thousand samples per second is achieved. Independent of the technique the samples have to be brought to the detector, usually such that they are aligned behind each other. This can be achieved by hydrodynamic focusing as shown in figure 1.1, where a sheath fluid is used to focus the sample stream. The detection methods then are (i) multi color laser systems [7] in combination with photomultipliers to detect light transmission, scattering and fluorescence or (ii) multi electrode setups [8] to create electric fields and to measure the response and (iii), newly developed in this thesis, a camera system to image the sample for analysis. The sorting is then achieved by deflecting the sample to the appropriate channel or compartment depending on the analysis’ result. The deflection can be realized by switching valves (electromechanically, thermally [9]), using pressure pulses (liquid [10], air [7]), or optical forces produced by laser light impulses [11]. The majority of the systems are based on the fluorescence signal from the previously labeled cells. Currently, only a few active cell sorting systems are available which can sort also cells which are not labeled. In the following, a selection of sorting and selection methods are shown, only the first selected system shown in figure 1.2 developed by Hitachi Ltd is able to work with non-labeled cells. The subsequent 3 selected devices all use a fluorescence based analysis system but have different selection methods to finally sort the cells.
1.1 STATE-OF-THE-ART CELL SORTING 3
Figure 1.1. A FACS (Fluorescence-Activated Cells Sorting) system consists of (A) a fluidic part where the sample is hydrodynamically focused to align the cells behind each other (B) a light source and detection unit for the cell analysis and (C) a sorting unit where in this case droplets containing single cells are charged and then deflected depending on the analysis result. Image adapted from www.appliedcytometry.com1.
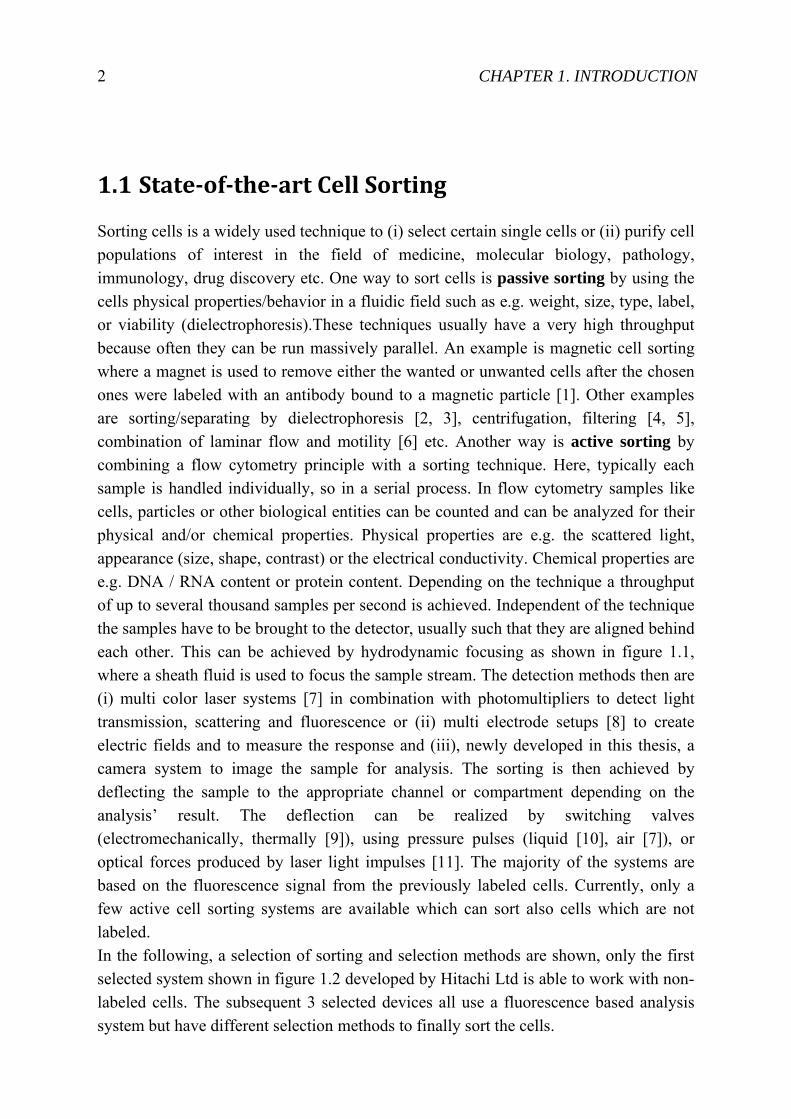
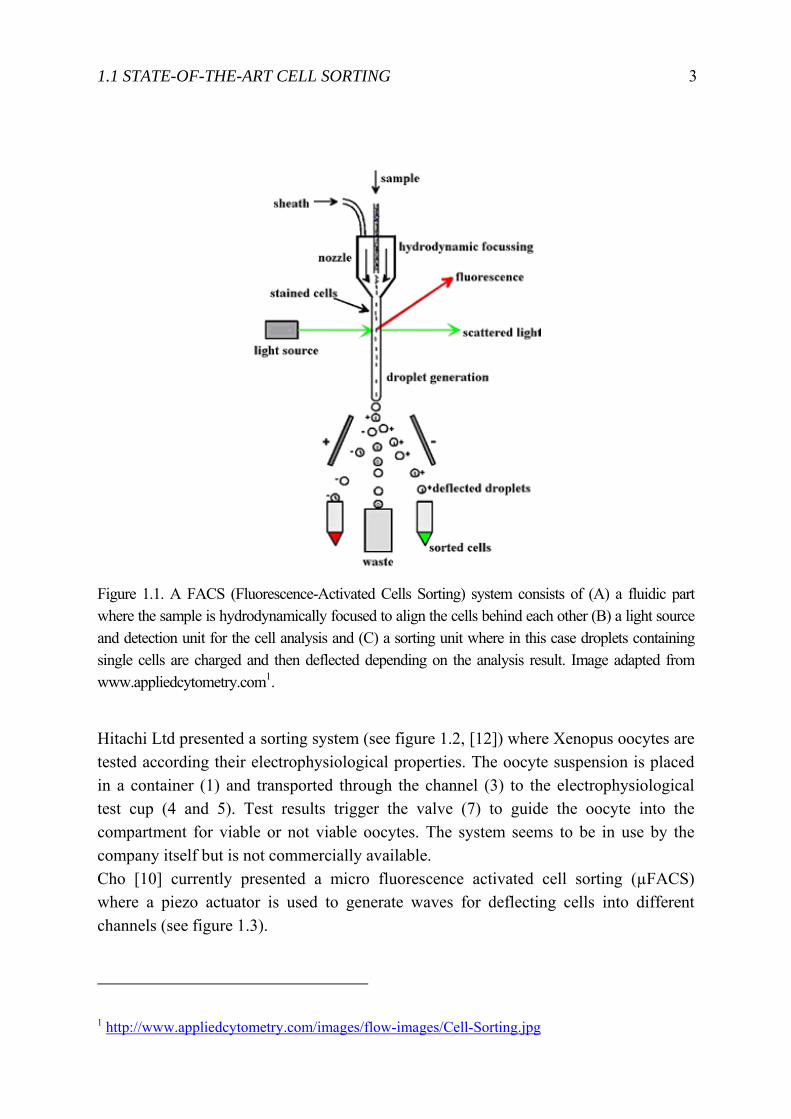
Hitachi Ltd presented a sorting system (see figure 1.2, [12]) where Xenopus oocytes are tested according their electrophysiological properties. The oocyte suspension is placed in a container (1) and transported through the channel (3) to the electrophysiological test cup (4 and 5). Test results trigger the valve (7) to guide the oocyte into the compartment for viable or not viable oocytes. The system seems to be in use by the company itself but is not commercially available. Cho [10] currently presented a micro fluorescence activated cell sorting (µFACS) where a piezo actuator is used to generate waves for deflecting cells into different channels (see figure 1.3).
1 http://www.appliedcytometry.com/images/flow-images/Cell-Sorting.jpg
4 CHAPTER 1. INTRODUCTION
Figure 1.2. System patented by Hitachi Ltd to sort Xenopus oocytes depending on their electrophysiological properties. Image adapted from Patent [12].
Figure 1.3. Design of a µFACS using a piezo activator to generate pressure waves for cell deflection. Image adapted from Cho [10].
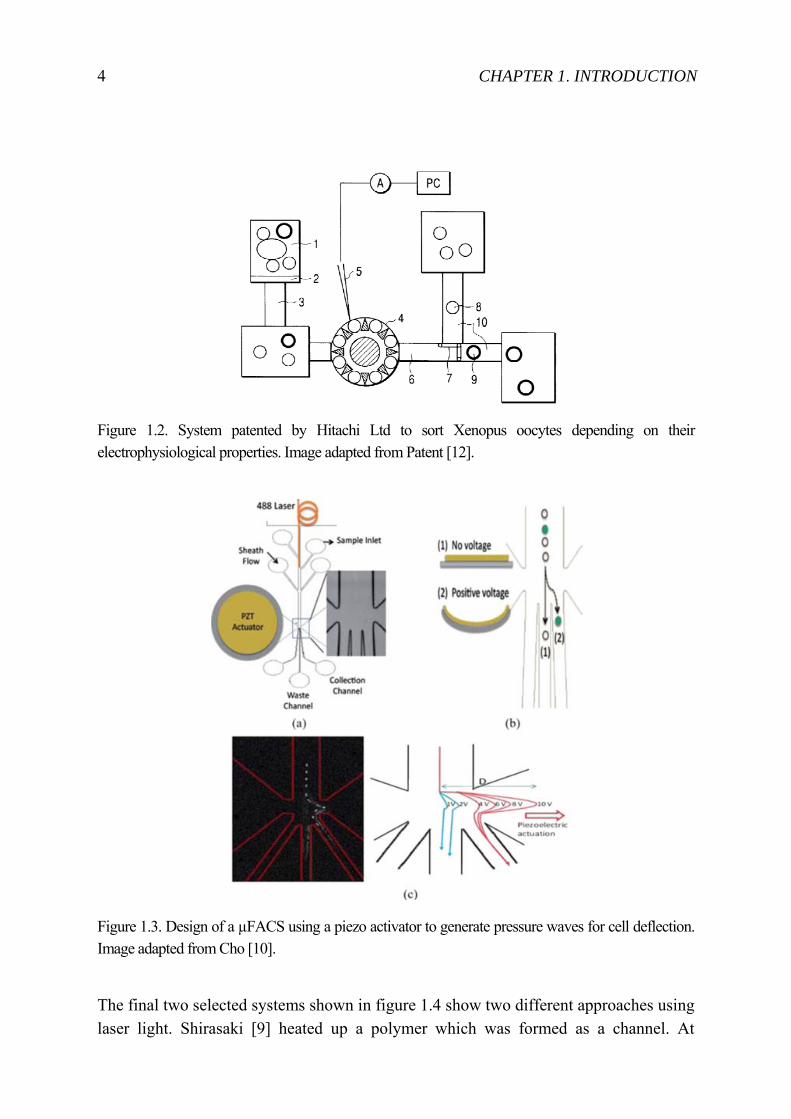
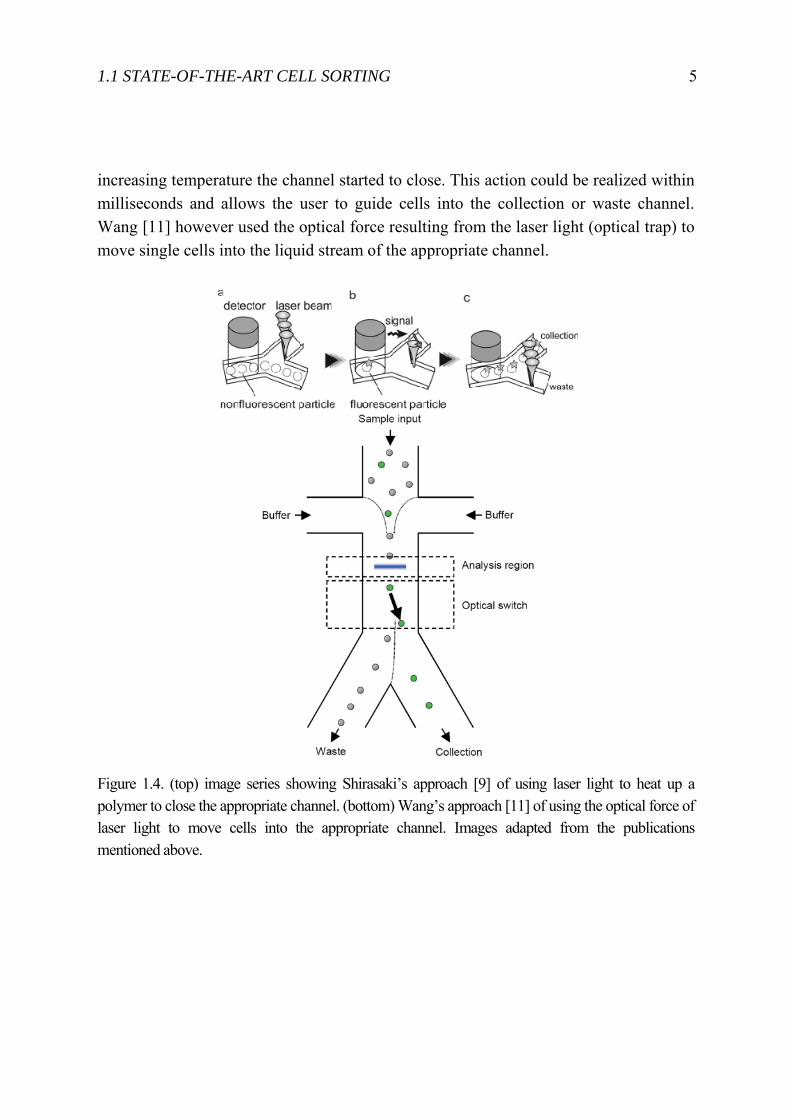
The final two selected systems shown in figure 1.4 show two different approaches using laser light. Shirasaki [9] heated up a polymer which was formed as a channel. At
1.1 STATE-OF-THE-ART CELL SORTING 5
increasing temperature the channel started to close. This action could be realized within milliseconds and allows the user to guide cells into the collection or waste channel. Wang [11] however used the optical force resulting from the laser light (optical trap) to move single cells into the liquid stream of the appropriate channel.
Figure 1.4. (top) image series showing Shirasaki’s approach [9] of using laser light to heat up a polymer to close the appropriate channel. (bottom) Wang’s approach [11] of using the optical force of laser light to move cells into the appropriate channel. Images adapted from the publications mentioned above.
6 CHAPTER 1. INTRODUCTION
1.2 Stateoftheart Cell Transfection
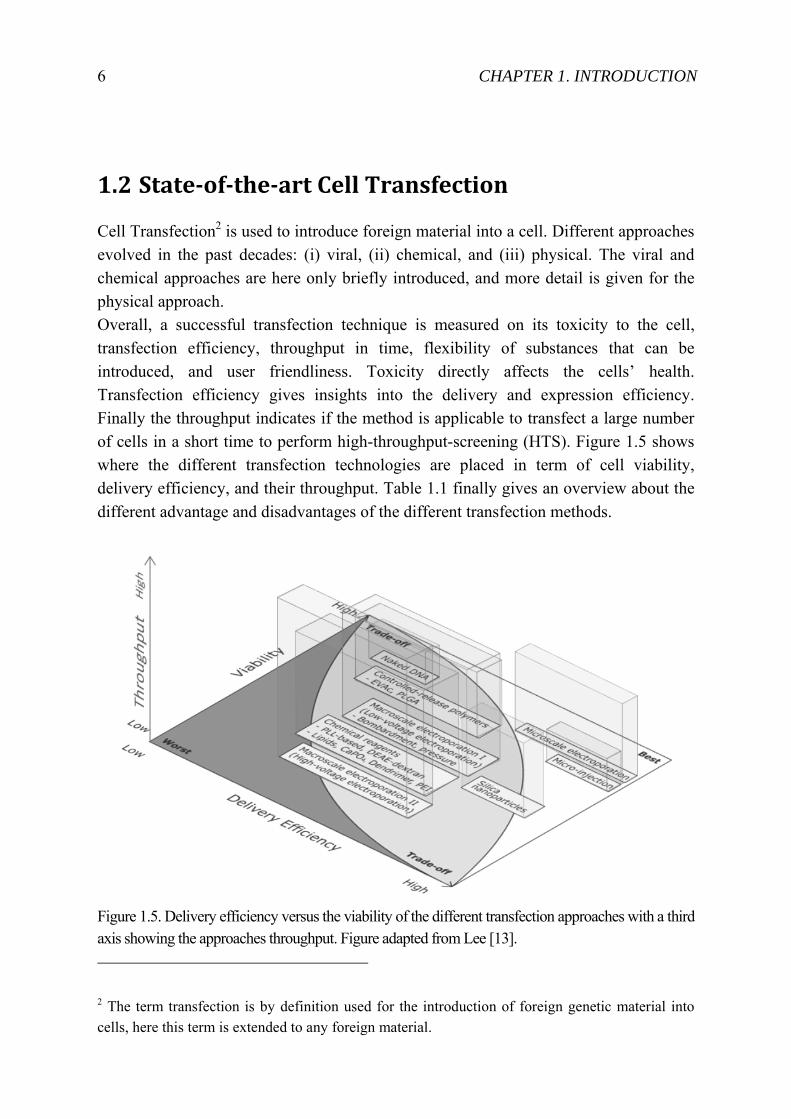
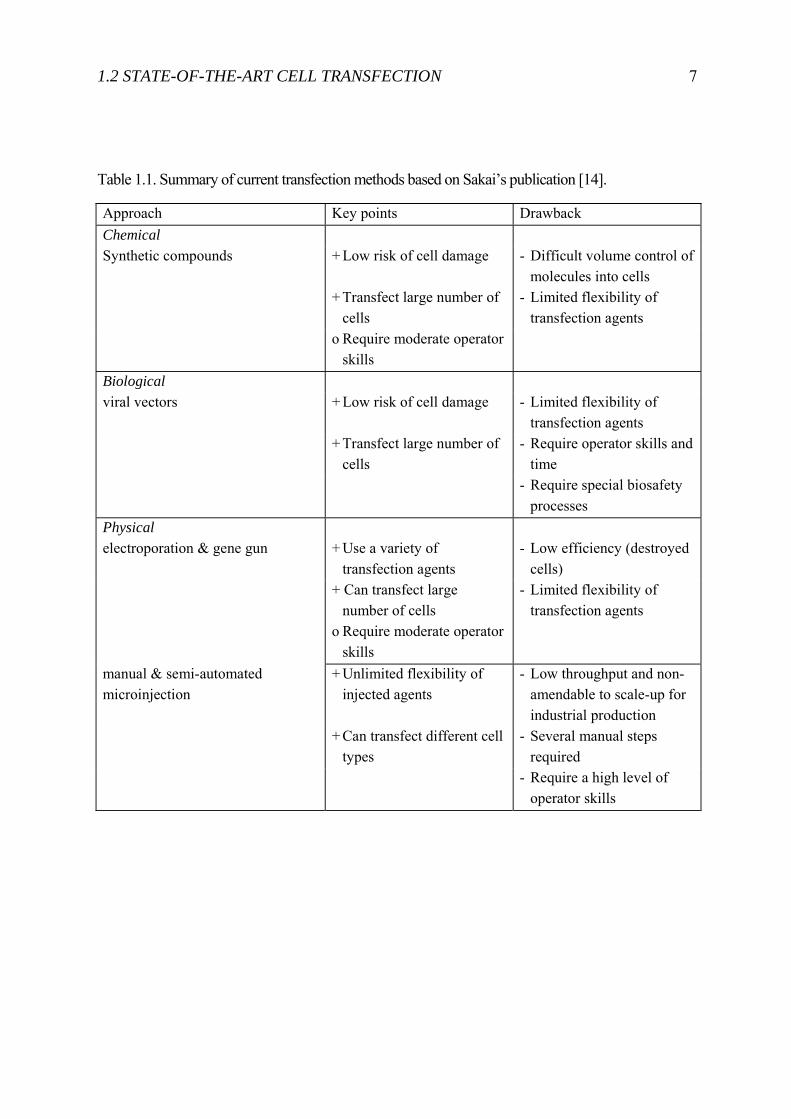
Cell Transfection2 is used to introduce foreign material into a cell. Different approaches evolved in the past decades: (i) viral, (ii) chemical, and (iii) physical. The viral and chemical approaches are here only briefly introduced, and more detail is given for the physical approach. Overall, a successful transfection technique is measured on its toxicity to the cell, transfection efficiency, throughput in time, flexibility of substances that can be introduced, and user friendliness. Toxicity directly affects the cells’ health. Transfection efficiency gives insights into the delivery and expression efficiency. Finally the throughput indicates if the method is applicable to transfect a large number of cells in a short time to perform high-throughput-screening (HTS). Figure 1.5 shows where the different transfection technologies are placed in term of cell viability, delivery efficiency, and their throughput. Table 1.1 finally gives an overview about the different advantage and disadvantages of the different transfection methods.
Figure 1.5. Delivery efficiency versus the viability of the different transfection approaches with a third axis showing the approaches throughput. Figure adapted from Lee [13].
2 The term transfection is by definition used for the introduction of foreign genetic material into cells, here this term is extended to any foreign material.
1.2 STATE-OF-THE-ART CELL TRANSFECTION 7
Table 1.1. Summary of current transfection methods based on Sakai’s publication [14].
Approach Key points Drawback Chemical Synthetic compounds + Low risk of cell damage - Difficult volume control of
molecules into cells + Transfect large number of
cells - Limited flexibility of
transfection agents o Require moderate operator
skills
Biological viral vectors + Low risk of cell damage - Limited flexibility of
transfection agents + Transfect large number of
cells - Require operator skills and
time - Require special biosafety
processes Physical electroporation & gene gun + Use a variety of
transfection agents - Low efficiency (destroyed
cells) + Can transfect large
number of cells - Limited flexibility of
transfection agents o Require moderate operator
skills
manual & semi-automated microinjection
+ Unlimited flexibility of injected agents
- Low throughput and non-amendable to scale-up for industrial production
+ Can transfect different cell types
- Several manual steps required
- Require a high level of operator skills
8 CHAPTER 1. INTRODUCTION
1.2.1 Chemical approach
Various different chemical approaches for transfection exist and were summarized by Torchilin [15]. They mainly consist of synthetic compounds and show good transfection efficiency. Most importantly, the synthetic vectors are easy to produce and have relatively low toxicity. However, the transferred volume is difficult to control and there is a limited flexibility of transfection agents.
1.2.2 Biological approach
The biological approach to transfect a cell is based on viral vectors and also called transduction. Verma [16] gives a nice overview about the different viral vectors evolved over time. The success of viral vectors over other approaches is due to their higher transfection efficiency and longer duration of gene expression. But the viral vectors must be tailored for their specific applications, which make this method a much more laborious process than other transfection methods. Additionally, recurring safety issues reduce the popularity of the viral vectors.
1.2.3 Physical (electrical and mechanical) approach
Several physical methods were developed to transfect various kinds of cells. Electroporation has one of the highest throughputs but also causes most cell deaths. Correctly applied electrical field pulses in the millisecond-range cause transient hydrophilic pores where genes can enter [17]. Too low electrical fields will not produce these pores while too high fields will lead to cell death. To minimize cell death, microfluidics is a preferred way to go. The formation of more uniform electric fields in this regime helps to increase the cell viability ([13], [17]). Going to microfluidics also allows the user to electroporate single cells in tissue slices or cell cultures [18]. Another method to transfect single cells is microbubble membrane poration [19], where laser light is used to produce two bubbles with a short delay in between. If they are close to each other and a cell is correctly oriented, the collapse of the bubble will produce a micro stream impulse which leads to a transient pore in the cell to uptake the genes. Bombarding cells with gene-coated gold particles is realized with a gene gun. Recent activities in this field strive to replace the non degradable gold with biodegradable polymers [20]. Finally one of the most efficient delivery methods is microinjection. In most cases microinjection is performed manually or semi-automated. In any case, (i) a cell must be immobilized, (ii) the prefilled injection needle must be brought close to the cell, (iii) the needle tip is then moved to penetrate the cell membrane, (iv) a part of the

1.2 STATE-OF-THE-ART CELL TRANSFECTION 9
prefilled genes are released, (v) finally the needle is rejected and (vi) the cell released. This method is the same from small up to large cells. Even organisms like zebrafish embryos are microinjected [21]. Furthermore, microinjection also allows exchanging a complete nucleus between cells [22], which other transfection methods do not allow. Figure 1.6 shows a snap shot of an immobilized cell where the injection needle (right side) has penetrated the cell and the needle tip is within the nucleus.
Figure 1.6. Injection into the cell’s nucleus. The cell is immobilized by suction through the tubing (left) and injected by the glass needle (right). Figure adapted from members.cox.net3
Because experience plays a crucial role in the success of the manual microinjection semi-automated microinjection systems were developed. This allowed the user to achieve more repetitive results. One can buy micromanipulators which perform step (iii) “the injection move” automatically. Further automation steps were, to integrate a vision system with a micromanipulator, such that adherent cells could be localized either by the user or by a vision algorithm, the micromanipulator then performed the injection fully automatically. Simultaneously, concepts to immobilize the cells were investigated. Suction, shape, surface modifications, optical and electrical trapping methods were developed.
3 http://members.cox.net/microinjectionworkshop/availablemedia/pni2.jpg
10 CHAPTER 1. INTRODUCTION
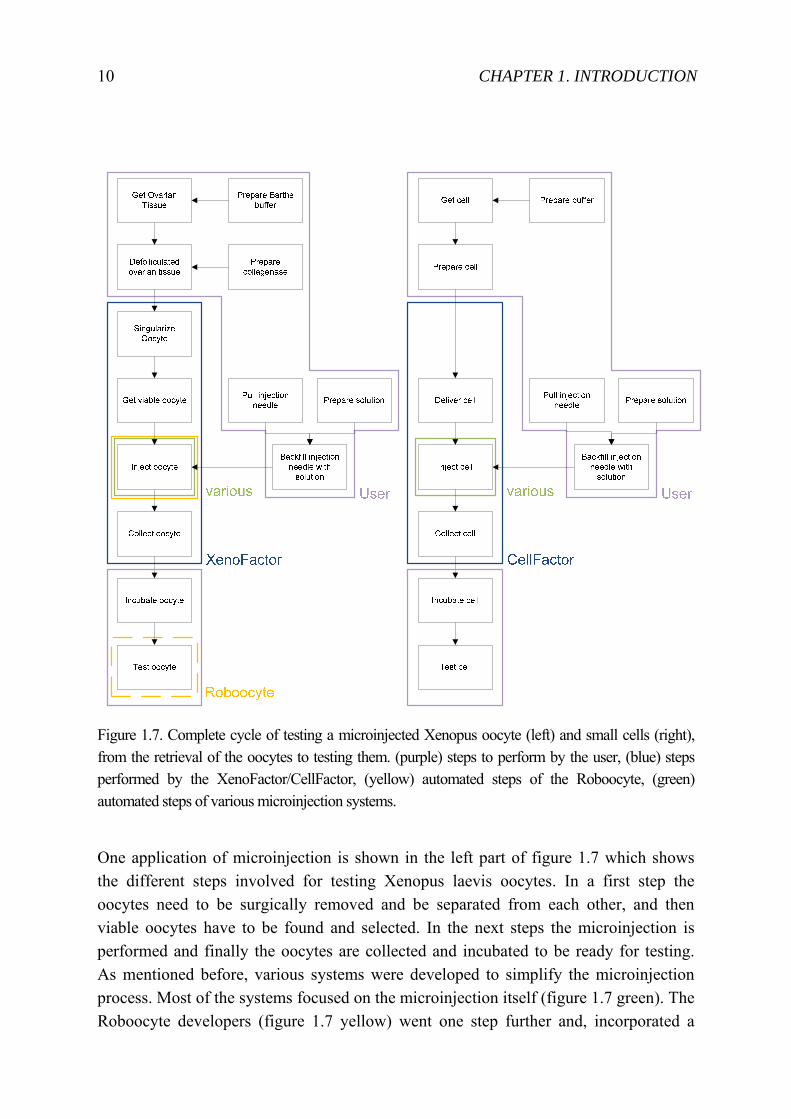
Figure 1.7. Complete cycle of testing a microinjected Xenopus oocyte (left) and small cells (right), from the retrieval of the oocytes to testing them. (purple) steps to perform by the user, (blue) steps performed by the XenoFactor/CellFactor, (yellow) automated steps of the Roboocyte, (green) automated steps of various microinjection systems.
One application of microinjection is shown in the left part of figure 1.7 which shows the different steps involved for testing Xenopus laevis oocytes. In a first step the oocytes need to be surgically removed and be separated from each other, and then viable oocytes have to be found and selected. In the next steps the microinjection is performed and finally the oocytes are collected and incubated to be ready for testing. As mentioned before, various systems were developed to simplify the microinjection process. Most of the systems focused on the microinjection itself (figure 1.7 green). The Roboocyte developers (figure 1.7 yellow) went one step further and, incorporated a
1.2 STATE-OF-THE-ART CELL TRANSFECTION 11
two-in-one system to microinject and to test the cell by using electrophysiology. Here is a selection of systems with the focus on automating the microinjection step: Sun and Nelson [23] described a system which could track the cells’ nuclei and the injection needle to perform an automated injection. Hitachi Ltd [24] describes their automated injection system, where similar to the Roboocyte [25], the oocyte have to be presented in a multi-well plate. For each oocyte a blind injection then takes place. A system for small cells in suspension was presented by the company Fujitsu [14] where multiple cells are immobilized on a silicon membrane by suction. The needle could then be tracked through the silicon membrane by using red light. To further improve the injection and so to minimize cell damage, the needle was brought into a rotation ([26] and ROs-drill [27]) or vibration ([26] and Piezo-drill [28]) mode. To detect if the needle touches or penetrates the cell, force sensors (PVDF based [29, 30], capacitive based [31]) or impedance based sensors [32] were developed. In recent years, there were also developments in minimizing the microinjection to mini- or even micro-fluidics [33, 34].
1.2.4 Summary
In summary, various transfection methods were and are developed. Still, microinjection remains the most efficient method [13]. Furthermore, microinjection allows one to “pack” modular components together into one injection. The delivery of these components is achieved with no toxic material in contrast to certain viral vectors. Direct injection into the cytoplasm or nucleus is possible and finally the injected volume can be controlled. However, microinjection can only be achieved one cell at a time. That is why the process is rather slow and laborious. To make microinjection more competitive with other transfection methods, automation seems the perfect way to go. Several teams have presented various ways of automating microinjection. But a time analysis (see figure 4.18 p.94) shows that sorting, immobilizing and collecting take as much time as the injection process. Therefore, in this thesis the automation of the sorting up to collecting is included. In chapter 3 the components for such a system are described while subchapter 4.2 presents a complete system for Xenopus laevis oocytes microinjection.
12 CHAPTER 1. INTRODUCTION
1.3 Typical biological samples
Cells can be categorized among others into adherent and non-adherent cell types. Adherent cells usually derive from solid tissues. Non-adherent cells naturally live in a suspension. Examples are cells in the bloodstream or eggs. For laboratory purposes, adherent cells can also be brought into suspension by trypsinization. In this case the enzyme Trypsin dissolves the protein responsible for the bond between cell and surface. Another way of categorizing cells is by size or types of interest for microinjection. In the following subchapters first different cell types of interest for microinjection are outlined which are rather small cells, while the last two subchapters outline large cells or small organisms.
1.3.1 Hard to transfect cells (HTC)
These are cells like hepatocytes (liver cell) where normally only about 10% of cells will become transfected with a gene even under good circumstances. However, these cells are usually transfected using a transfection agent and not by microinjection. If microinjection is to be used it is important that the total number of cells needed remain low (i.e. not hundreds of thousands).
1.3.2 High value cells (HVC)
These are cells like embryonic stem cells, or some blood/bone derived stem cells where just one cell might be needed for therapy and so are very valuable. Human eggs also belong to this class. Here in-vitro fertilization using microinjection is common.
1.3.3 Highly unique cells (HUC)
These are cells like dendritic cells (cells of the immune system) or lymphocytes (white blood cells) where each cell is unique. In general, in the immune system, each cell (or almost each individual cell) will have a different reaction to any foreign body, so each cell can or should be studied separately. A subject of interest here might be checking the immune reaction to different drug candidates. Rare (or rarish) immune reactions are a major reason for drug withdrawal after launch and are difficult to test for. If it gets possible to test dendritic cells, in-vitro microinjection could be of high interest, since most transfection agents only work with nucleic acid and not with drug candidates. Also cosmetic companies are greatly interested into testing their products for allergic reactions before launch.
1.3 TYPICAL BIOLOGICAL SAMPLES 13
1.3.4 Highly contractile cells (HCC)
These are cells like cardiomyocytes (heart muscle cell), muscle cells, bile duct cells (cells involved in carrying bile) for which movement is an important part of their function and modification or regulation of the movement may be an important function of a drug. Here the interest would be to carry out local dispensing and observe the response of the cell, e.g. to observe the response of cells (e.g. cardiomyocytes) to non-local drug application.
1.3.5 Xenopus laevis oocytes
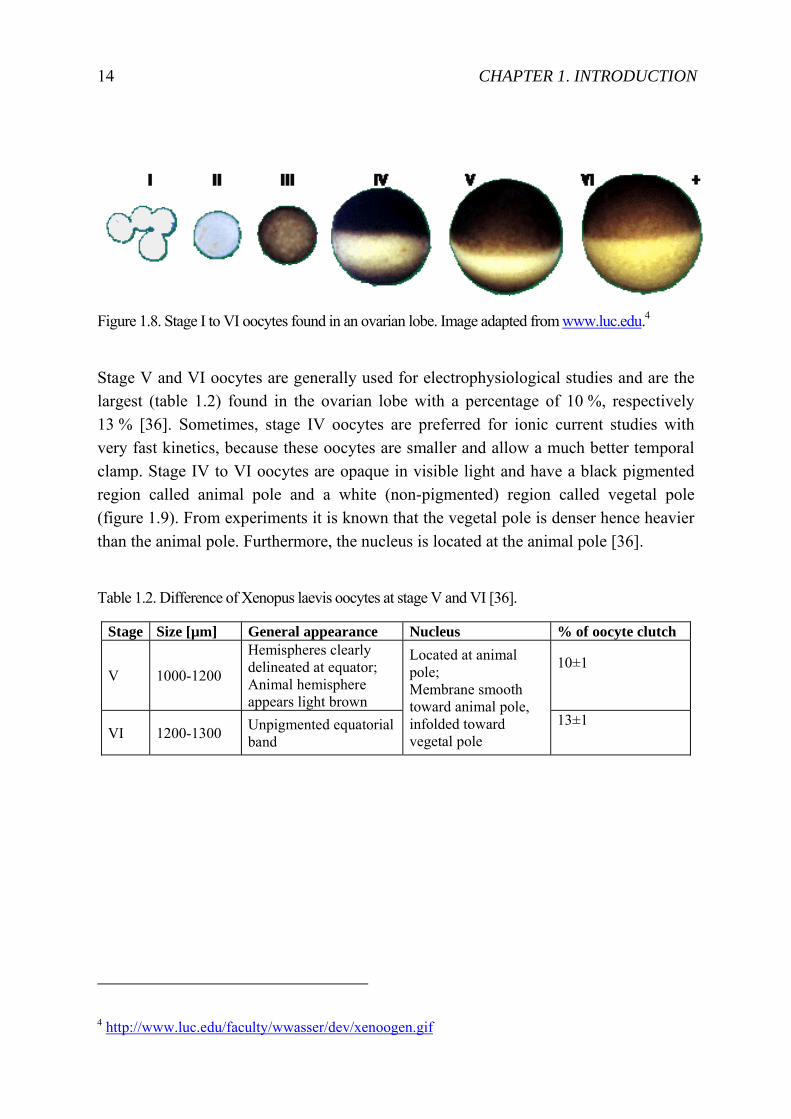
In 1971 Gurdon [35] showed for the first time that a Xenopus laevis oocyte can be used to express foreign messenger RNA (mRNA). Gurdon also noticed that only very little species specificity are shown by the Xenopus oocytes to translate foreign mRNA. Furthermore, the size and easiness of culturing these oocytes make them ideal candidates for electrophysiology experiments. Here some facts about the oocytes: The Xenopus laevis oocyte is an immature egg stored in the abdominal cavity of adult females in clumps called ovarian lobes. These lobes include oocytes, connective tissues, blood vessels and follicular cells. By surgical procedures parts of the ovarian lobes are removed. This procedure can be repeated several times. In an ovarian lobe six maturation stages (I-VI) of the oocytes can be found. As shown in figure 1.8 stage I oocytes are clear and transparent (0.05-0.30 mm) [36], stage II oocytes are white and opaque (0.30-0.45 mm) [36], stage III oocytes are lightly pigmented all over (0.45-0.60 mm) [36], stage IV oocytes are starting to have yolk protein deposited into their cytoplasm and the pigment is primarily concentrated to the upper animal hemisphere (0.60-1.00 mm) [36], stage V oocytes are still accumulating yolk and have a darker pigmented color (1.00-1.20 mm) [36], and stage VI oocytes are fully-grown and have progesterone receptors on their plasma membrane (1.20-1.30 mm) [36].
14 CHAPTER 1. INTRODUCTION
Figure 1.8. Stage I to VI oocytes found in an ovarian lobe. Image adapted from www.luc.edu.4
Stage V and VI oocytes are generally used for electrophysiological studies and are the largest (table 1.2) found in the ovarian lobe with a percentage of 10 %, respectively 13 % [36]. Sometimes, stage IV oocytes are preferred for ionic current studies with very fast kinetics, because these oocytes are smaller and allow a much better temporal clamp. Stage IV to VI oocytes are opaque in visible light and have a black pigmented region called animal pole and a white (non-pigmented) region called vegetal pole (figure 1.9). From experiments it is known that the vegetal pole is denser hence heavier than the animal pole. Furthermore, the nucleus is located at the animal pole [36].
Table 1.2. Difference of Xenopus laevis oocytes at stage V and VI [36].
Stage Size [µm] General appearance Nucleus % of oocyte clutch
V 1000-1200
Hemispheres clearly delineated at equator; Animal hemisphere appears light brown
Located at animal pole; Membrane smooth toward animal pole, infolded toward vegetal pole
10±1
VI 1200-1300 Unpigmented equatorial band
13±1
4 http://www.luc.edu/faculty/wwasser/dev/xenoogen.gif
1.3 TYPICAL BIOLOGICAL SAMPLES 15
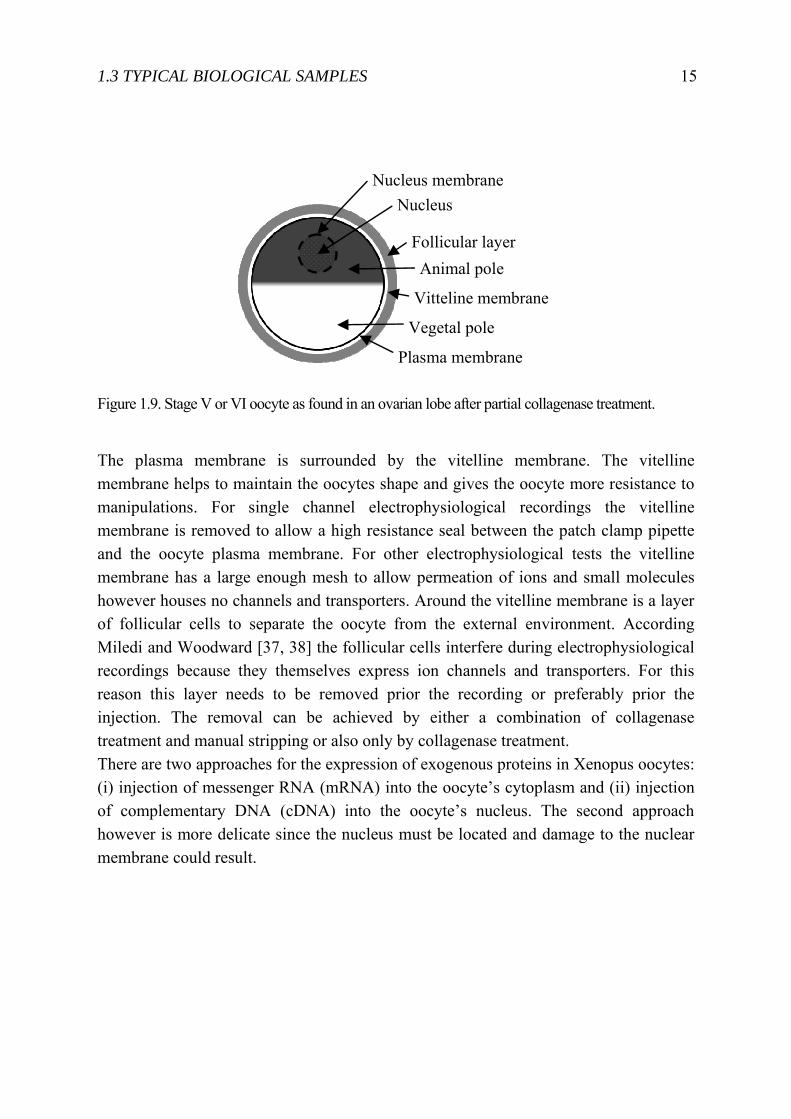
Figure 1.9. Stage V or VI oocyte as found in an ovarian lobe after partial collagenase treatment.
The plasma membrane is surrounded by the vitelline membrane. The vitelline membrane helps to maintain the oocytes shape and gives the oocyte more resistance to manipulations. For single channel electrophysiological recordings the vitelline membrane is removed to allow a high resistance seal between the patch clamp pipette and the oocyte plasma membrane. For other electrophysiological tests the vitelline membrane has a large enough mesh to allow permeation of ions and small molecules however houses no channels and transporters. Around the vitelline membrane is a layer of follicular cells to separate the oocyte from the external environment. According Miledi and Woodward [37, 38] the follicular cells interfere during electrophysiological recordings because they themselves express ion channels and transporters. For this reason this layer needs to be removed prior the recording or preferably prior the injection. The removal can be achieved by either a combination of collagenase treatment and manual stripping or also only by collagenase treatment. There are two approaches for the expression of exogenous proteins in Xenopus oocytes: (i) injection of messenger RNA (mRNA) into the oocyte’s cytoplasm and (ii) injection of complementary DNA (cDNA) into the oocyte’s nucleus. The second approach however is more delicate since the nucleus must be located and damage to the nuclear membrane could result.
Follicular layerAnimal pole
Vegetal pole
Vitteline membrane
Plasma membrane
NucleusNucleus membrane
16 CHAPTER 1. INTRODUCTION
1.3.6 Zebrafish embryos and larvae
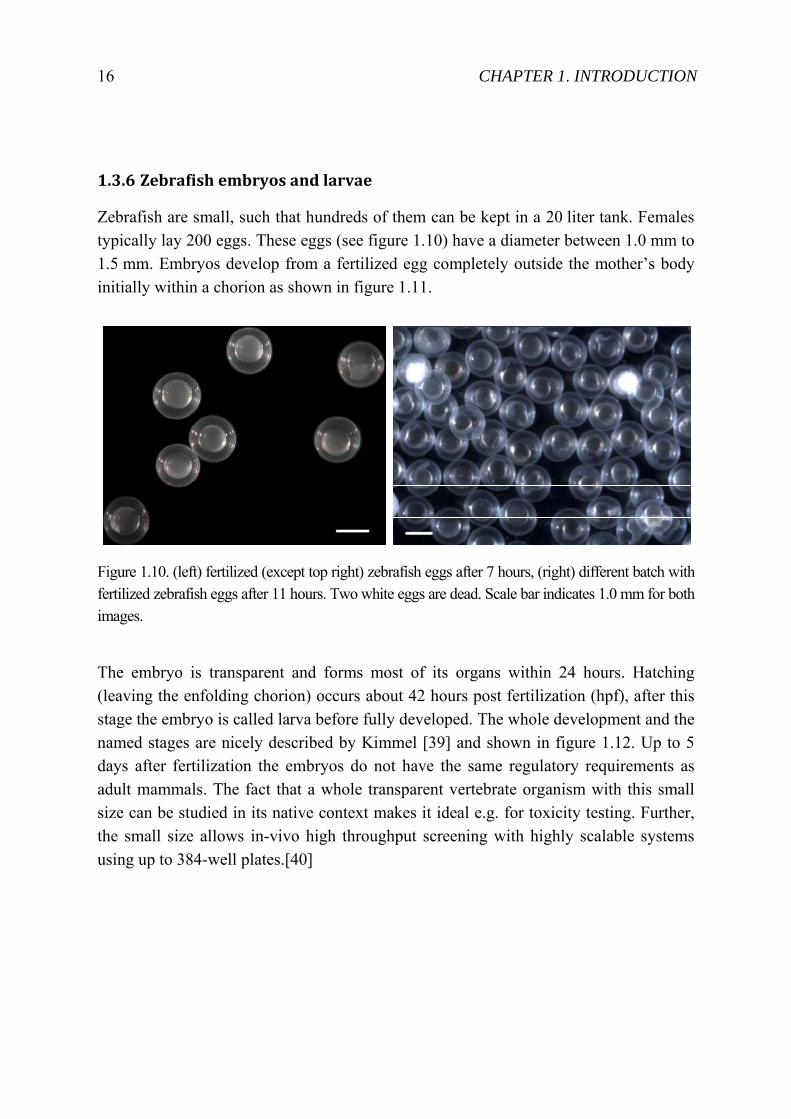
Zebrafish are small, such that hundreds of them can be kept in a 20 liter tank. Females typically lay 200 eggs. These eggs (see figure 1.10) have a diameter between 1.0 mm to 1.5 mm. Embryos develop from a fertilized egg completely outside the mother’s body initially within a chorion as shown in figure 1.11.
Figure 1.10. (left) fertilized (except top right) zebrafish eggs after 7 hours, (right) different batch with fertilized zebrafish eggs after 11 hours. Two white eggs are dead. Scale bar indicates 1.0 mm for both images.
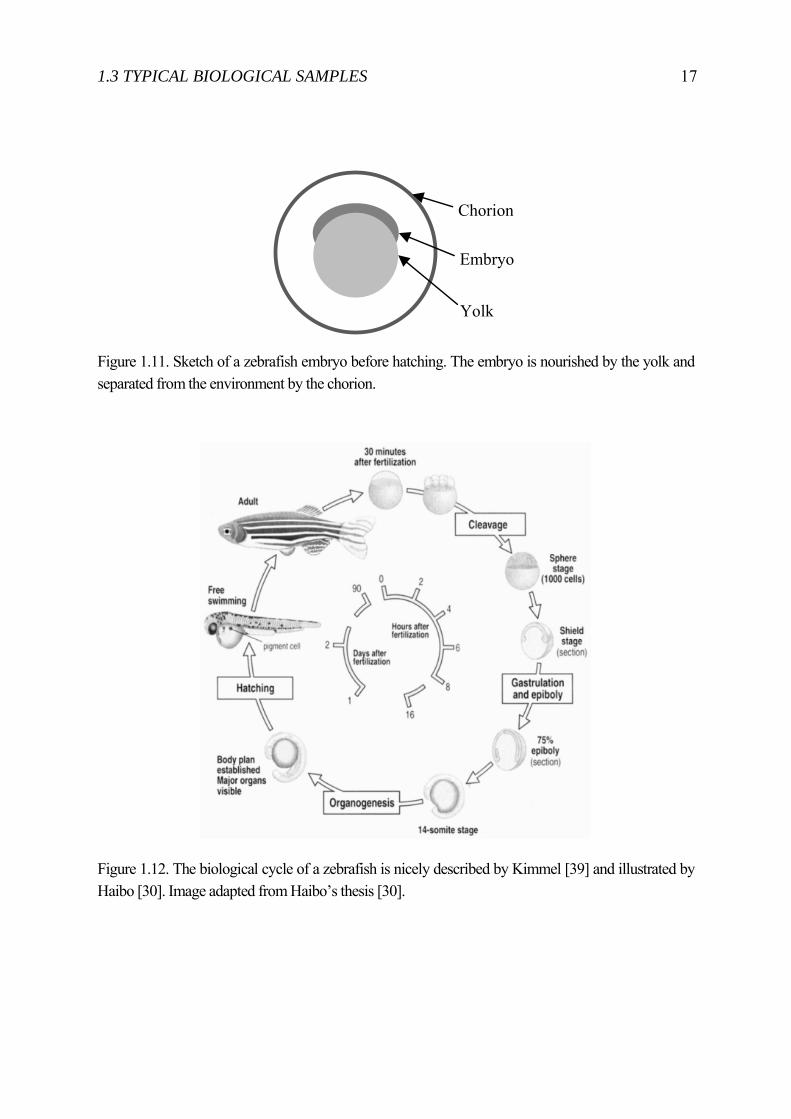
The embryo is transparent and forms most of its organs within 24 hours. Hatching (leaving the enfolding chorion) occurs about 42 hours post fertilization (hpf), after this stage the embryo is called larva before fully developed. The whole development and the named stages are nicely described by Kimmel [39] and shown in figure 1.12. Up to 5 days after fertilization the embryos do not have the same regulatory requirements as adult mammals. The fact that a whole transparent vertebrate organism with this small size can be studied in its native context makes it ideal e.g. for toxicity testing. Further, the small size allows in-vivo high throughput screening with highly scalable systems using up to 384-well plates.[40]
1.3 TYPICAL BIOLOGICAL SAMPLES 17
Figure 1.11. Sketch of a zebrafish embryo before hatching. The embryo is nourished by the yolk and separated from the environment by the chorion.
Figure 1.12. The biological cycle of a zebrafish is nicely described by Kimmel [39] and illustrated by Haibo [30]. Image adapted from Haibo’s thesis [30].
Chorion
Embryo
Yolk
18 CHAPTER 1. INTRODUCTION
1.4 Application areas of this thesis
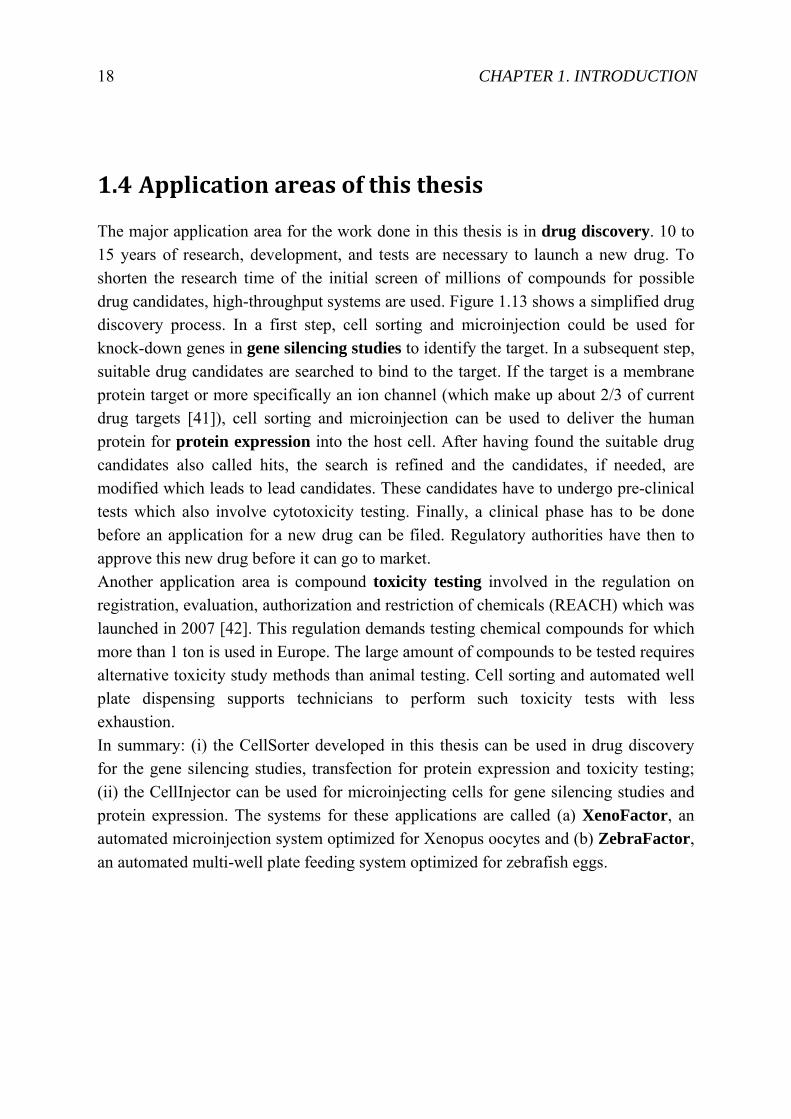
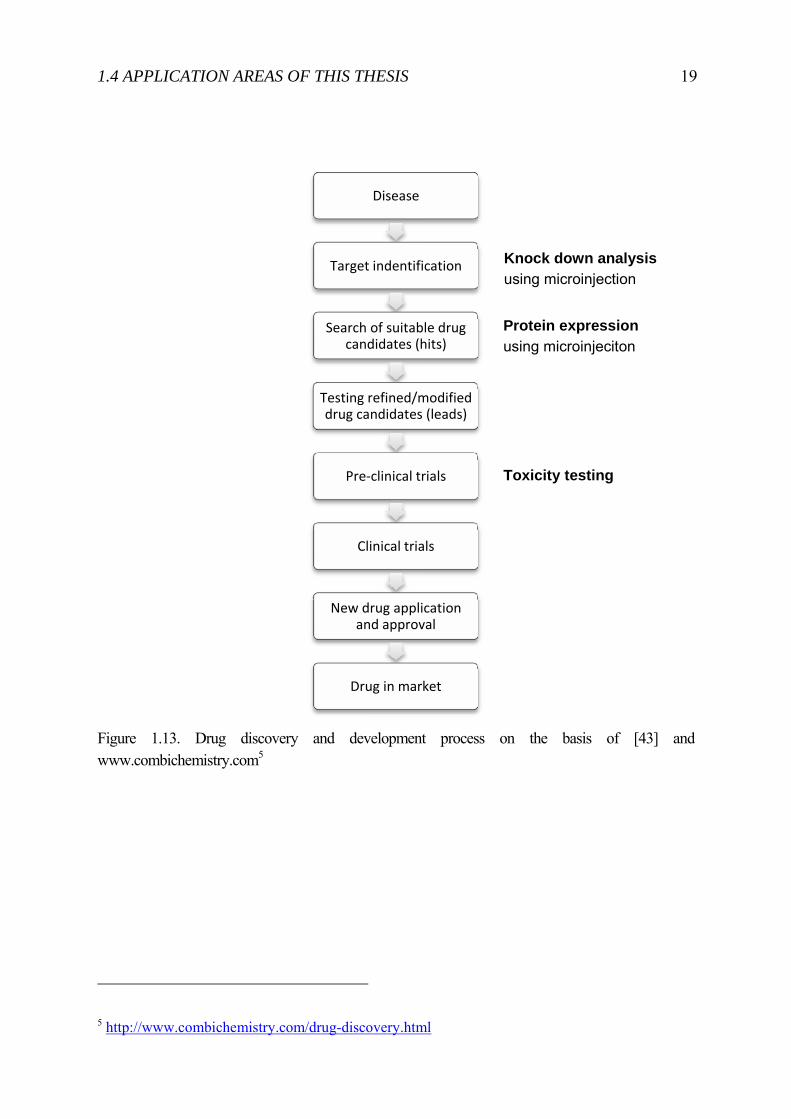
The major application area for the work done in this thesis is in drug discovery. 10 to 15 years of research, development, and tests are necessary to launch a new drug. To shorten the research time of the initial screen of millions of compounds for possible drug candidates, high-throughput systems are used. Figure 1.13 shows a simplified drug discovery process. In a first step, cell sorting and microinjection could be used for knock-down genes in gene silencing studies to identify the target. In a subsequent step, suitable drug candidates are searched to bind to the target. If the target is a membrane protein target or more specifically an ion channel (which make up about 2/3 of current drug targets [41]), cell sorting and microinjection can be used to deliver the human protein for protein expression into the host cell. After having found the suitable drug candidates also called hits, the search is refined and the candidates, if needed, are modified which leads to lead candidates. These candidates have to undergo pre-clinical tests which also involve cytotoxicity testing. Finally, a clinical phase has to be done before an application for a new drug can be filed. Regulatory authorities have then to approve this new drug before it can go to market. Another application area is compound toxicity testing involved in the regulation on registration, evaluation, authorization and restriction of chemicals (REACH) which was launched in 2007 [42]. This regulation demands testing chemical compounds for which more than 1 ton is used in Europe. The large amount of compounds to be tested requires alternative toxicity study methods than animal testing. Cell sorting and automated well plate dispensing supports technicians to perform such toxicity tests with less exhaustion. In summary: (i) the CellSorter developed in this thesis can be used in drug discovery for the gene silencing studies, transfection for protein expression and toxicity testing; (ii) the CellInjector can be used for microinjecting cells for gene silencing studies and protein expression. The systems for these applications are called (a) XenoFactor, an automated microinjection system optimized for Xenopus oocytes and (b) ZebraFactor, an automated multi-well plate feeding system optimized for zebrafish eggs.
1.4 APPLICATION AREAS OF THIS THESIS 19
Figure 1.13. Drug discovery and development process on the basis of [43] and www.combichemistry.com5
5 http://www.combichemistry.com/drug-discovery.html
Disease
Target indentification
Search of suitable drug candidates (hits)
Testing refined/modified drug candidates (leads)
Pre‐clinical trials
Clinical trials
New drug application and approval
Drug in market
Knock down analysis using microinjection
Protein expression using microinjeciton
Toxicity testing

Chapter 2
Cell Sorter for medium to large biological samples
Samples like Xenopus laevis oocytes or zebrafish eggs are available in large numbers. However, in a suspension of such samples their quality can vary.
− For Xenopus oocytes, one batch of oocytes from a female frog can contain thousands of cells. Typically, thereof only 10% are stage V oocytes and 13% are stage VI oocytes as described by Dumont [36]. Furthermore, the quality of the defolliculated oocytes can differ, e.g. the vitelline membrane with blood vessels was only removed partially, white spots can be seen in the animal pole, or the cell is misshapen. As mentioned in chapter 1.3.5, mostly only stage V and VI oocytes are used for microinjection. Thus a sorting system would have to sort out only viable stage V and or stage VI oocytes for later processing.
− For zebrafish eggs, one batch of eggs from a paired zebrafish couple counts about 200 eggs. Not fertilized (<10%) or dying eggs ulcerate and get opaque, while healthy fertilized eggs stay transparent. A sorting system would have to sort out the viable eggs before their further processing.
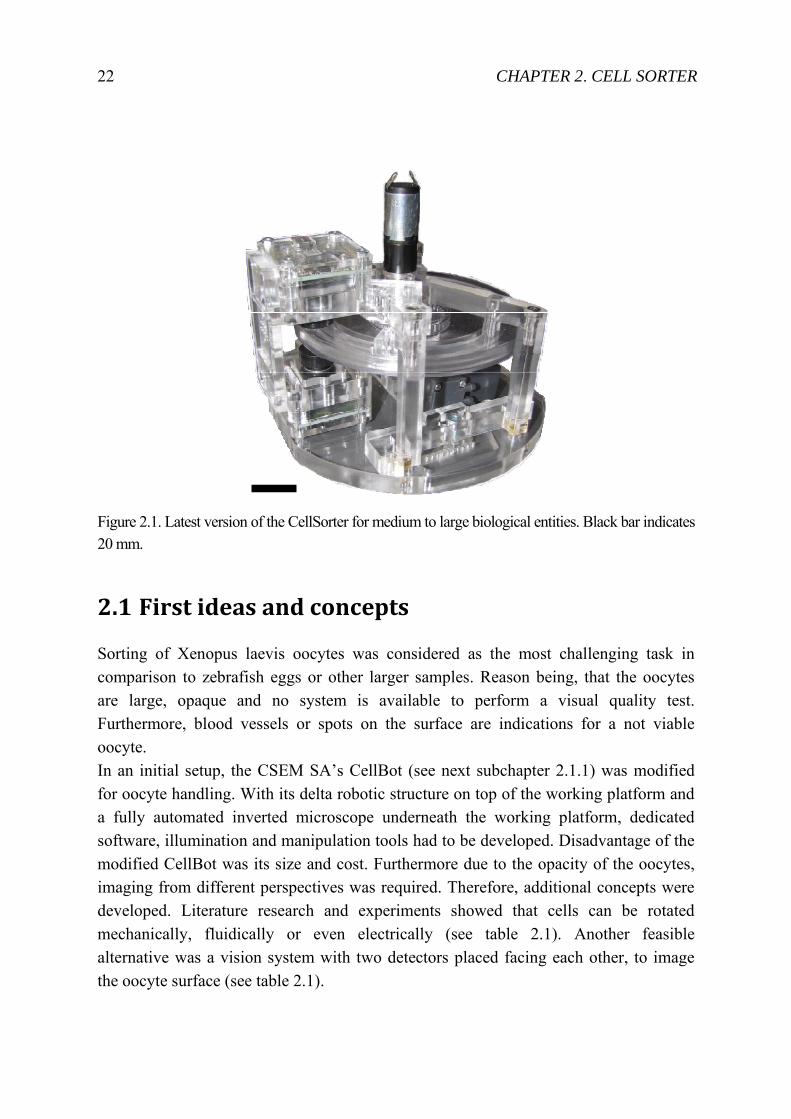
Not viable samples should be directed into waste while viable samples are transported to subsequent systems like a microinjection system or a plate feeder. Ideally the samples in the cell sorter can be delivered on demand as soon as the subsequent system is ready to process another sample. In the following chapters the different development steps towards the final CellSorter as shown in figure 2.1 are described.
22 CHAPTER 2. CELL SORTER
Figure 2.1. Latest version of the CellSorter for medium to large biological entities. Black bar indicates 20 mm.
2.1 First ideas and concepts
Sorting of Xenopus laevis oocytes was considered as the most challenging task in comparison to zebrafish eggs or other larger samples. Reason being, that the oocytes are large, opaque and no system is available to perform a visual quality test. Furthermore, blood vessels or spots on the surface are indications for a not viable oocyte. In an initial setup, the CSEM SA’s CellBot (see next subchapter 2.1.1) was modified for oocyte handling. With its delta robotic structure on top of the working platform and a fully automated inverted microscope underneath the working platform, dedicated software, illumination and manipulation tools had to be developed. Disadvantage of the modified CellBot was its size and cost. Furthermore due to the opacity of the oocytes, imaging from different perspectives was required. Therefore, additional concepts were developed. Literature research and experiments showed that cells can be rotated mechanically, fluidically or even electrically (see table 2.1). Another feasible alternative was a vision system with two detectors placed facing each other, to image the oocyte surface (see table 2.1).
2.1 FIRST IDEAS AND CONCEPTS 23
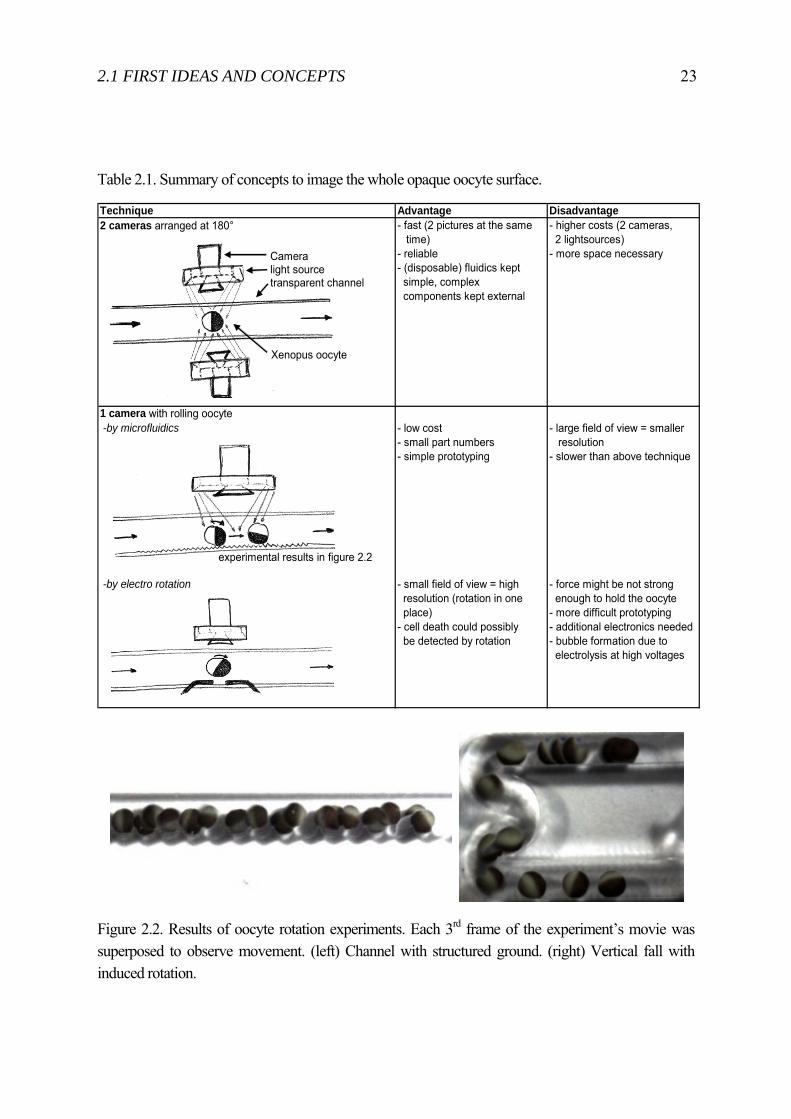
Table 2.1. Summary of concepts to image the whole opaque oocyte surface.
Technique Advantage Disadvantage2 cameras arranged at 180° - fast (2 pictures at the same
time)- reliable- (disposable) fluidics kept simple, complex components kept external
- higher costs (2 cameras, 2 lightsources)- more space necessary
1 camera with rolling oocyte -by microfluidics - low cost
- small part numbers- simple prototyping
- large field of view = smaller resolution- slower than above technique
-by electro rotation - small field of view = high resolution (rotation in one place)- cell death could possibly be detected by rotation
- force might be not strong enough to hold the oocyte- more difficult prototyping- additional electronics needed- bubble formation due to electrolysis at high voltages
Cameralight sourcetransparent channel
Xenopus oocyte
experimental results in figure 2.2
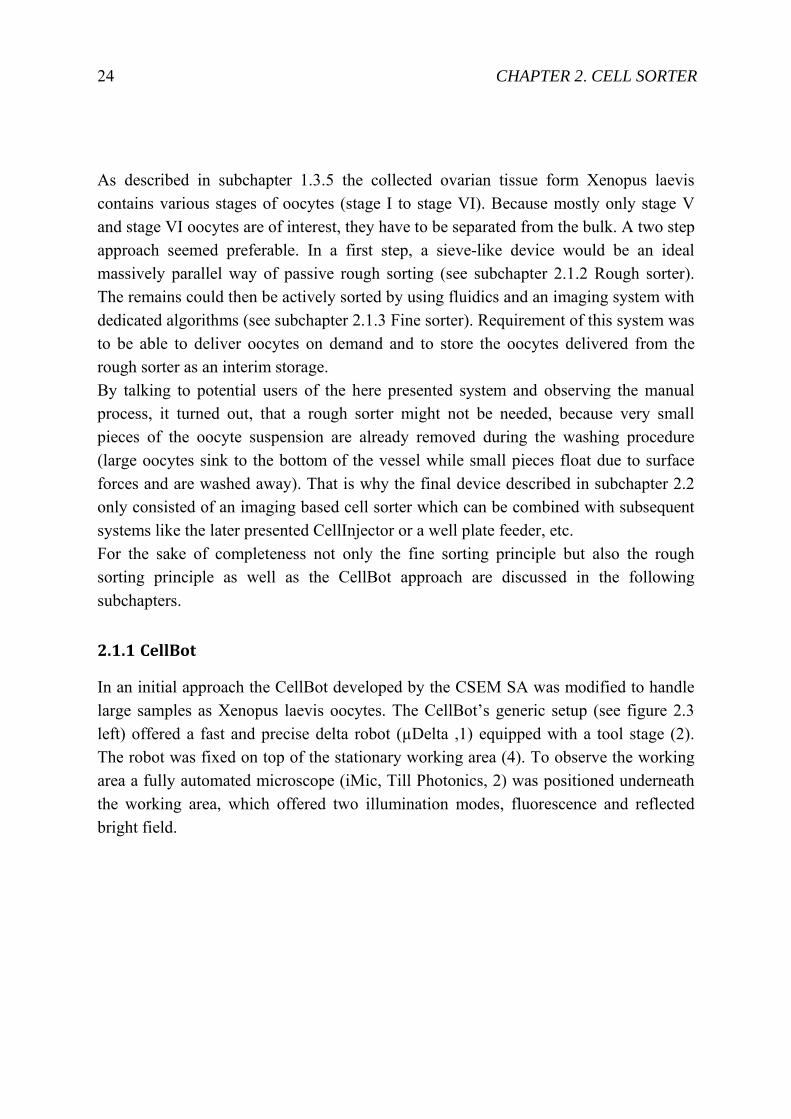
Figure 2.2. Results of oocyte rotation experiments. Each 3rd frame of the experiment’s movie was superposed to observe movement. (left) Channel with structured ground. (right) Vertical fall with induced rotation.
24 CHAPTER 2. CELL SORTER
As described in subchapter 1.3.5 the collected ovarian tissue form Xenopus laevis contains various stages of oocytes (stage I to stage VI). Because mostly only stage V and stage VI oocytes are of interest, they have to be separated from the bulk. A two step approach seemed preferable. In a first step, a sieve-like device would be an ideal massively parallel way of passive rough sorting (see subchapter 2.1.2 Rough sorter). The remains could then be actively sorted by using fluidics and an imaging system with dedicated algorithms (see subchapter 2.1.3 Fine sorter). Requirement of this system was to be able to deliver oocytes on demand and to store the oocytes delivered from the rough sorter as an interim storage. By talking to potential users of the here presented system and observing the manual process, it turned out, that a rough sorter might not be needed, because very small pieces of the oocyte suspension are already removed during the washing procedure (large oocytes sink to the bottom of the vessel while small pieces float due to surface forces and are washed away). That is why the final device described in subchapter 2.2 only consisted of an imaging based cell sorter which can be combined with subsequent systems like the later presented CellInjector or a well plate feeder, etc. For the sake of completeness not only the fine sorting principle but also the rough sorting principle as well as the CellBot approach are discussed in the following subchapters.
2.1.1 CellBot
In an initial approach the CellBot developed by the CSEM SA was modified to handle large samples as Xenopus laevis oocytes. The CellBot’s generic setup (see figure 2.3 left) offered a fast and precise delta robot (µDelta ,1) equipped with a tool stage (2). The robot was fixed on top of the stationary working area (4). To observe the working area a fully automated microscope (iMic, Till Photonics, 2) was positioned underneath the working area, which offered two illumination modes, fluorescence and reflected bright field.
2.1 FIRST IDEAS AND CONCEPTS 25
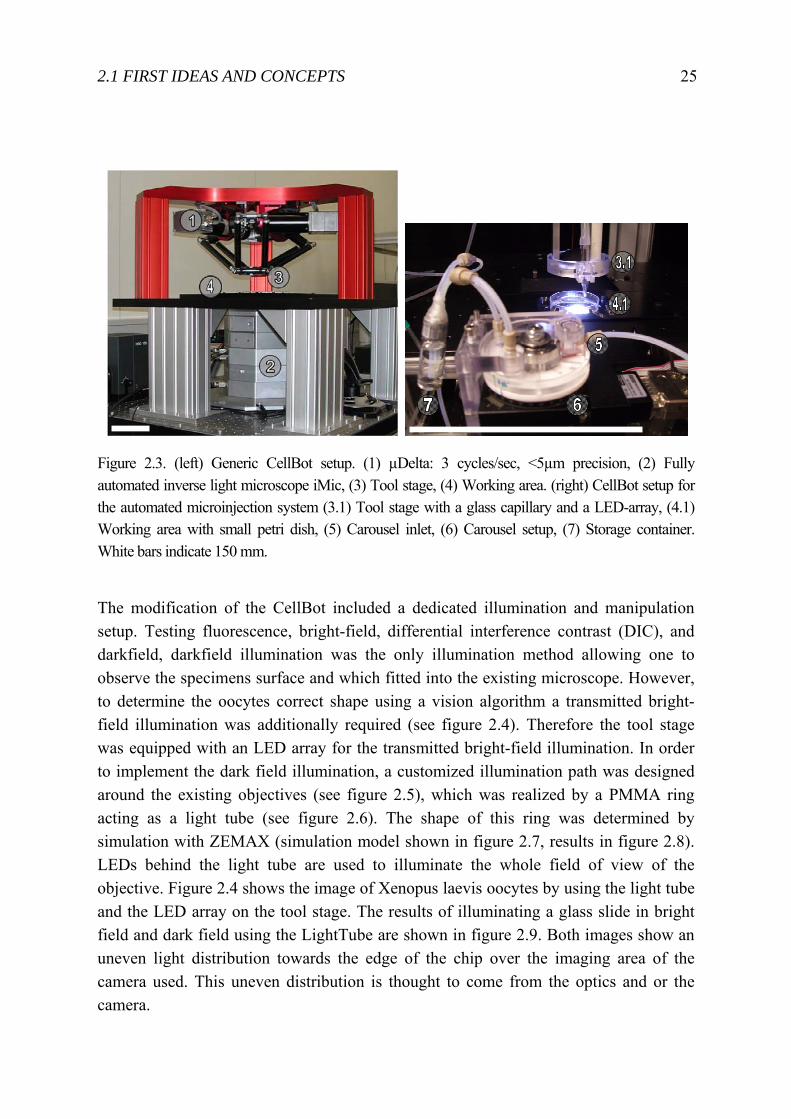
Figure 2.3. (left) Generic CellBot setup. (1) µDelta: 3 cycles/sec, <5µm precision, (2) Fully automated inverse light microscope iMic, (3) Tool stage, (4) Working area. (right) CellBot setup for the automated microinjection system (3.1) Tool stage with a glass capillary and a LED-array, (4.1) Working area with small petri dish, (5) Carousel inlet, (6) Carousel setup, (7) Storage container. White bars indicate 150 mm.
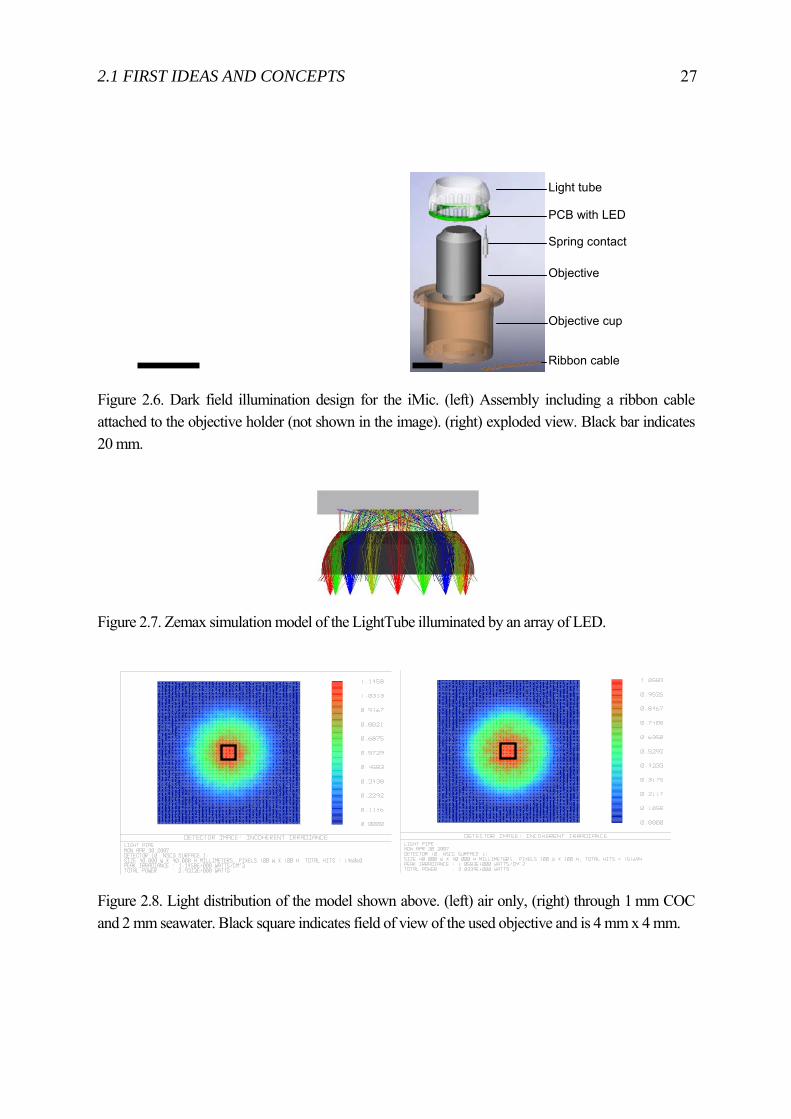
The modification of the CellBot included a dedicated illumination and manipulation setup. Testing fluorescence, bright-field, differential interference contrast (DIC), and darkfield, darkfield illumination was the only illumination method allowing one to observe the specimens surface and which fitted into the existing microscope. However, to determine the oocytes correct shape using a vision algorithm a transmitted bright-field illumination was additionally required (see figure 2.4). Therefore the tool stage was equipped with an LED array for the transmitted bright-field illumination. In order to implement the dark field illumination, a customized illumination path was designed around the existing objectives (see figure 2.5), which was realized by a PMMA ring acting as a light tube (see figure 2.6). The shape of this ring was determined by simulation with ZEMAX (simulation model shown in figure 2.7, results in figure 2.8). LEDs behind the light tube are used to illuminate the whole field of view of the objective. Figure 2.4 shows the image of Xenopus laevis oocytes by using the light tube and the LED array on the tool stage. The results of illuminating a glass slide in bright field and dark field using the LightTube are shown in figure 2.9. Both images show an uneven light distribution towards the edge of the chip over the imaging area of the camera used. This uneven distribution is thought to come from the optics and or the camera.
26 CHAPTER 2. CELL SORTER
The dark-field illumination was powered via a ribbon cable mounted onto the objective carrier. To easily change the objective for different magnifications, the electrical contact between the ribbon cable and the dark-field illumination within the objective cup was achieved by contact springs. Meaning, each objective cup had to be equipped with its separate dark-field illumination. This setup allowed to remotely control the intensity of the dark-field illumination without disrupting the fully automated objective exchange of the iMic, where the objective carrier is moved downwards to release the currently used objective. Then the chosen objective is rotated on top of the carrier, which is lifted to make contact with the objective cup and spring contacts.
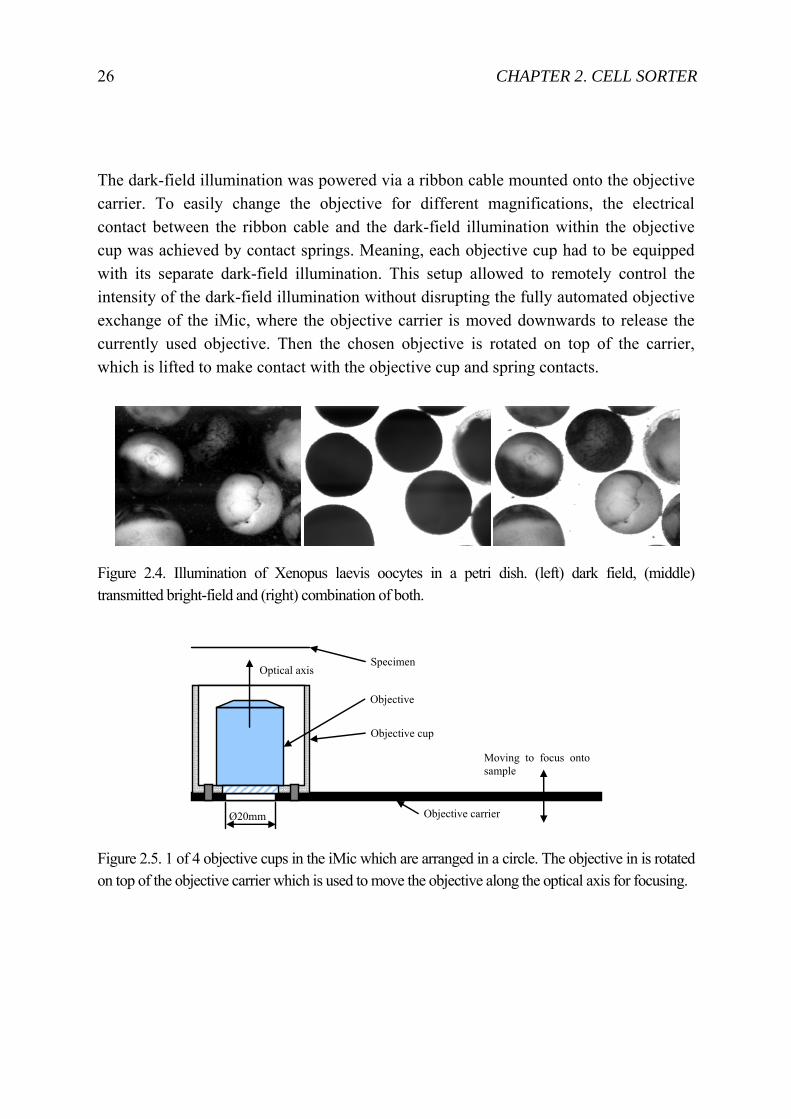
Figure 2.4. Illumination of Xenopus laevis oocytes in a petri dish. (left) dark field, (middle) transmitted bright-field and (right) combination of both.
Figure 2.5. 1 of 4 objective cups in the iMic which are arranged in a circle. The objective in is rotated on top of the objective carrier which is used to move the objective along the optical axis for focusing.
Ø20mm Objective carrier
Objective cup
Objective
Moving to focus ontosample
SpecimenOptical axis
2.1 FIRST IDEAS AND CONCEPTS 27
Figure 2.6. Dark field illumination design for the iMic. (left) Assembly including a ribbon cable attached to the objective holder (not shown in the image). (right) exploded view. Black bar indicates 20 mm.
Figure 2.7. Zemax simulation model of the LightTube illuminated by an array of LED.
Figure 2.8. Light distribution of the model shown above. (left) air only, (right) through 1 mm COC and 2 mm seawater. Black square indicates field of view of the used objective and is 4 mm x 4 mm.
Objective
Light tube
PCB with LED
Objective cup
Ribbon cable
Spring contact
28 CHAPTER 2. CELL SORTER
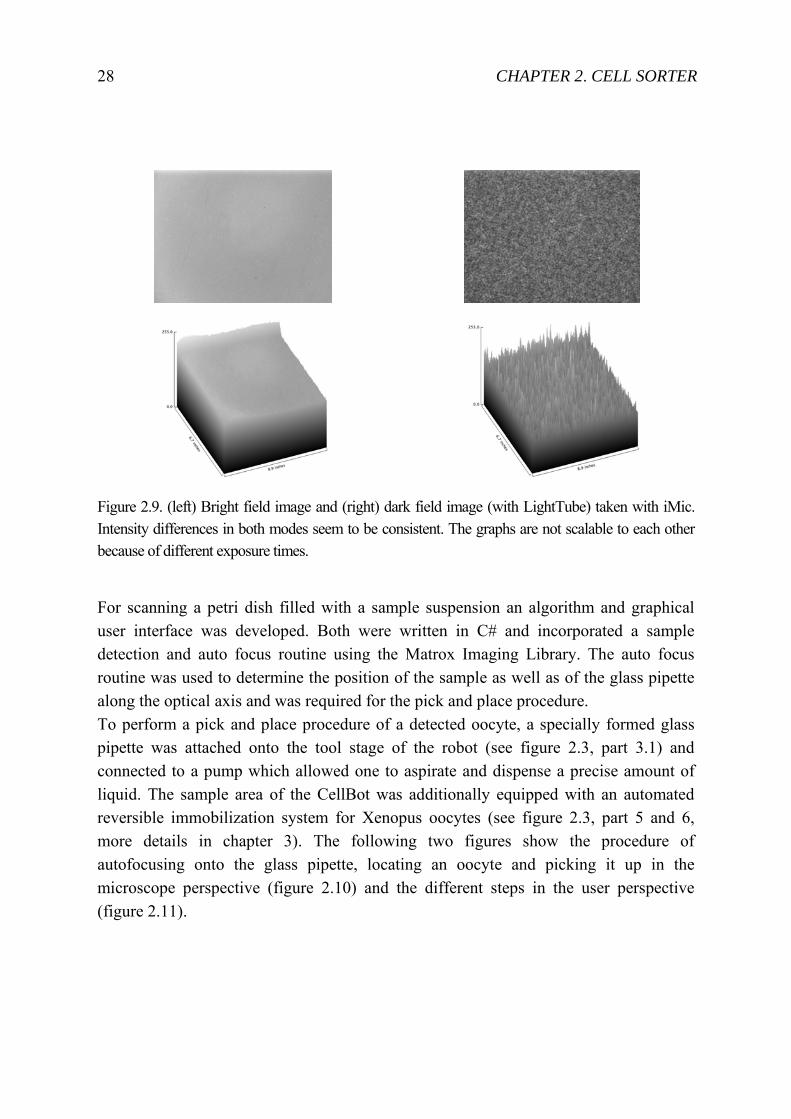
Figure 2.9. (left) Bright field image and (right) dark field image (with LightTube) taken with iMic. Intensity differences in both modes seem to be consistent. The graphs are not scalable to each other because of different exposure times.
For scanning a petri dish filled with a sample suspension an algorithm and graphical user interface was developed. Both were written in C# and incorporated a sample detection and auto focus routine using the Matrox Imaging Library. The auto focus routine was used to determine the position of the sample as well as of the glass pipette along the optical axis and was required for the pick and place procedure. To perform a pick and place procedure of a detected oocyte, a specially formed glass pipette was attached onto the tool stage of the robot (see figure 2.3, part 3.1) and connected to a pump which allowed one to aspirate and dispense a precise amount of liquid. The sample area of the CellBot was additionally equipped with an automated reversible immobilization system for Xenopus oocytes (see figure 2.3, part 5 and 6, more details in chapter 3). The following two figures show the procedure of autofocusing onto the glass pipette, locating an oocyte and picking it up in the microscope perspective (figure 2.10) and the different steps in the user perspective (figure 2.11).
2.1 FIRST IDEAS AND CONCEPTS 29
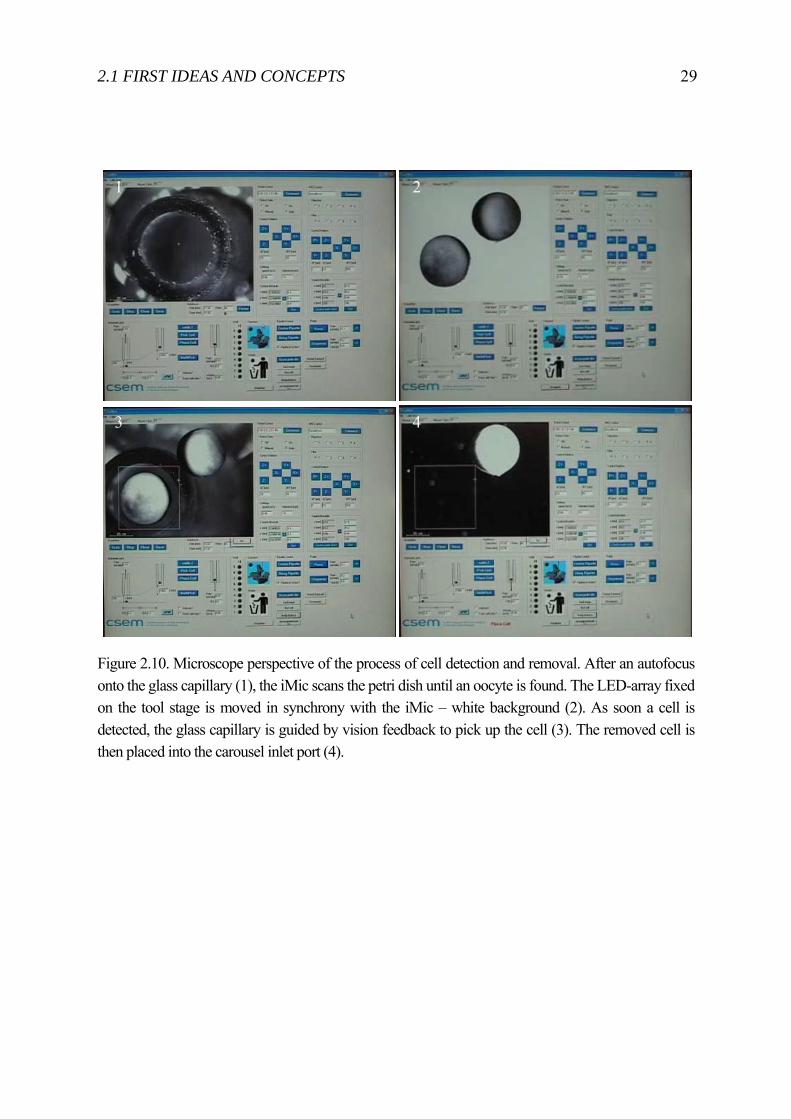
Figure 2.10. Microscope perspective of the process of cell detection and removal. After an autofocus onto the glass capillary (1), the iMic scans the petri dish until an oocyte is found. The LED-array fixed on the tool stage is moved in synchrony with the iMic – white background (2). As soon a cell is detected, the glass capillary is guided by vision feedback to pick up the cell (3). The removed cell is then placed into the carousel inlet port (4).
3 4
1 2
30 CHAPTER 2. CELL SORTER
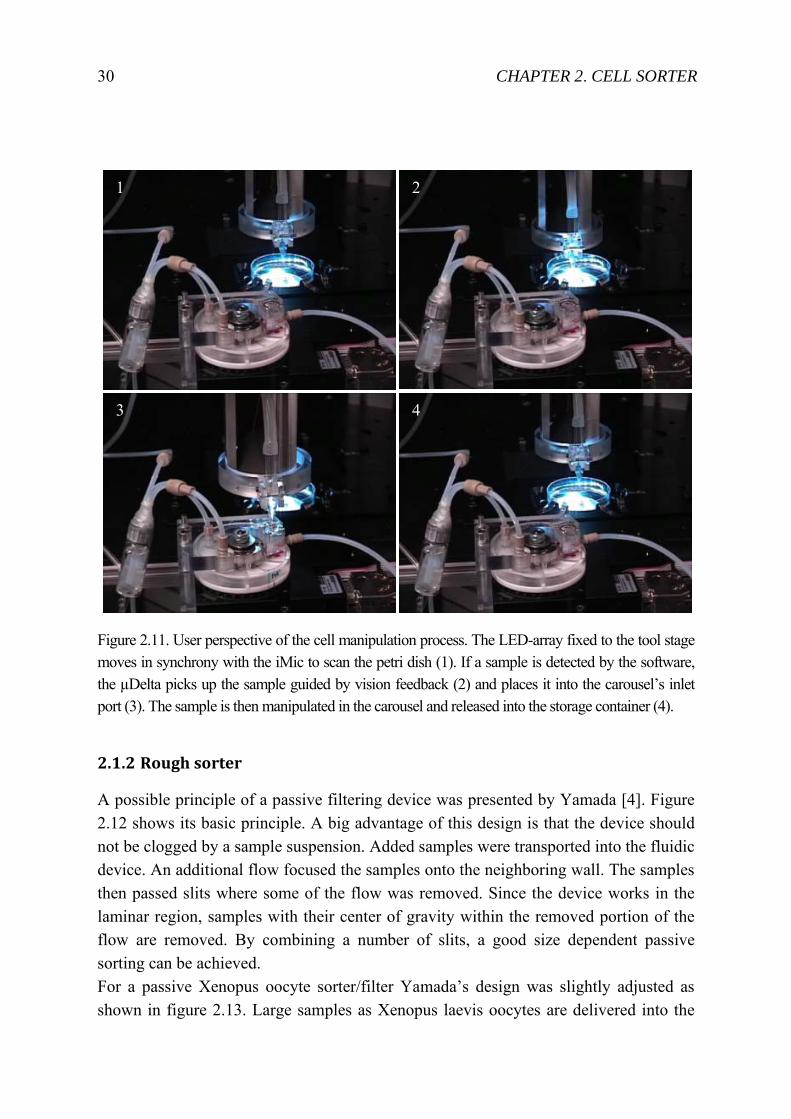
Figure 2.11. User perspective of the cell manipulation process. The LED-array fixed to the tool stage moves in synchrony with the iMic to scan the petri dish (1). If a sample is detected by the software, the µDelta picks up the sample guided by vision feedback (2) and places it into the carousel’s inlet port (3). The sample is then manipulated in the carousel and released into the storage container (4).
2.1.2 Rough sorter
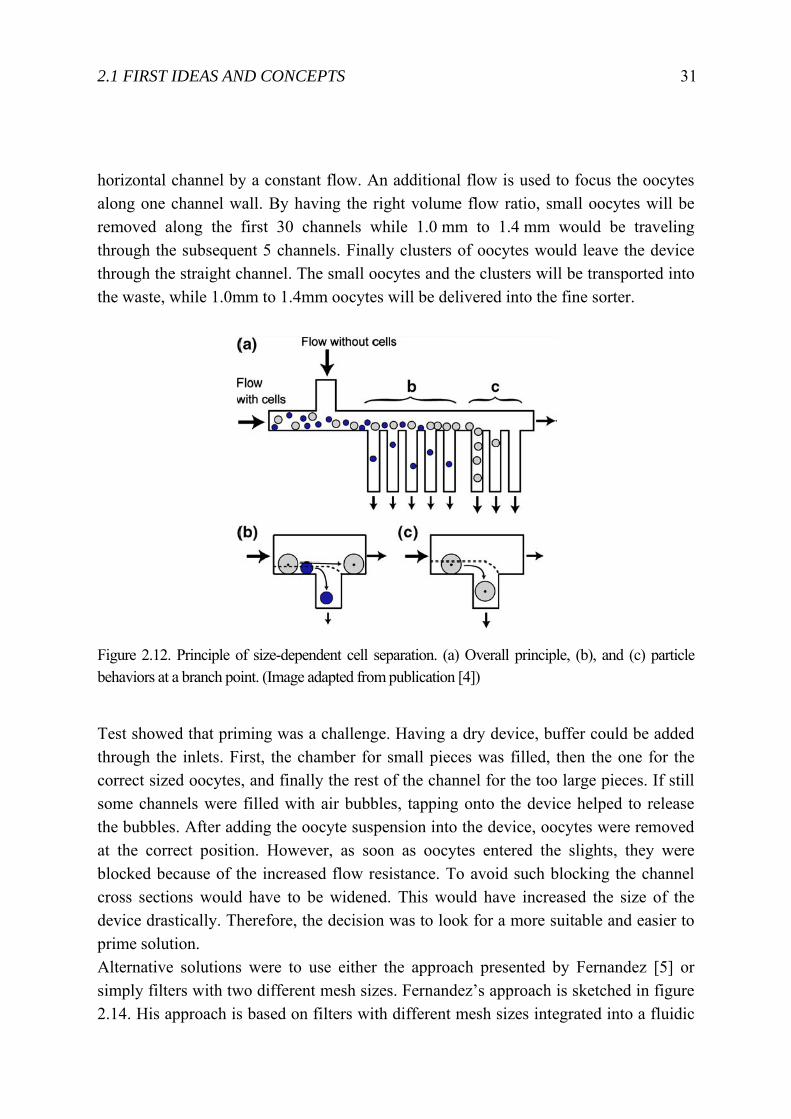
A possible principle of a passive filtering device was presented by Yamada [4]. Figure 2.12 shows its basic principle. A big advantage of this design is that the device should not be clogged by a sample suspension. Added samples were transported into the fluidic device. An additional flow focused the samples onto the neighboring wall. The samples then passed slits where some of the flow was removed. Since the device works in the laminar region, samples with their center of gravity within the removed portion of the flow are removed. By combining a number of slits, a good size dependent passive sorting can be achieved. For a passive Xenopus oocyte sorter/filter Yamada’s design was slightly adjusted as shown in figure 2.13. Large samples as Xenopus laevis oocytes are delivered into the
1 2
3 4
2.1 FIRST IDEAS AND CONCEPTS 31
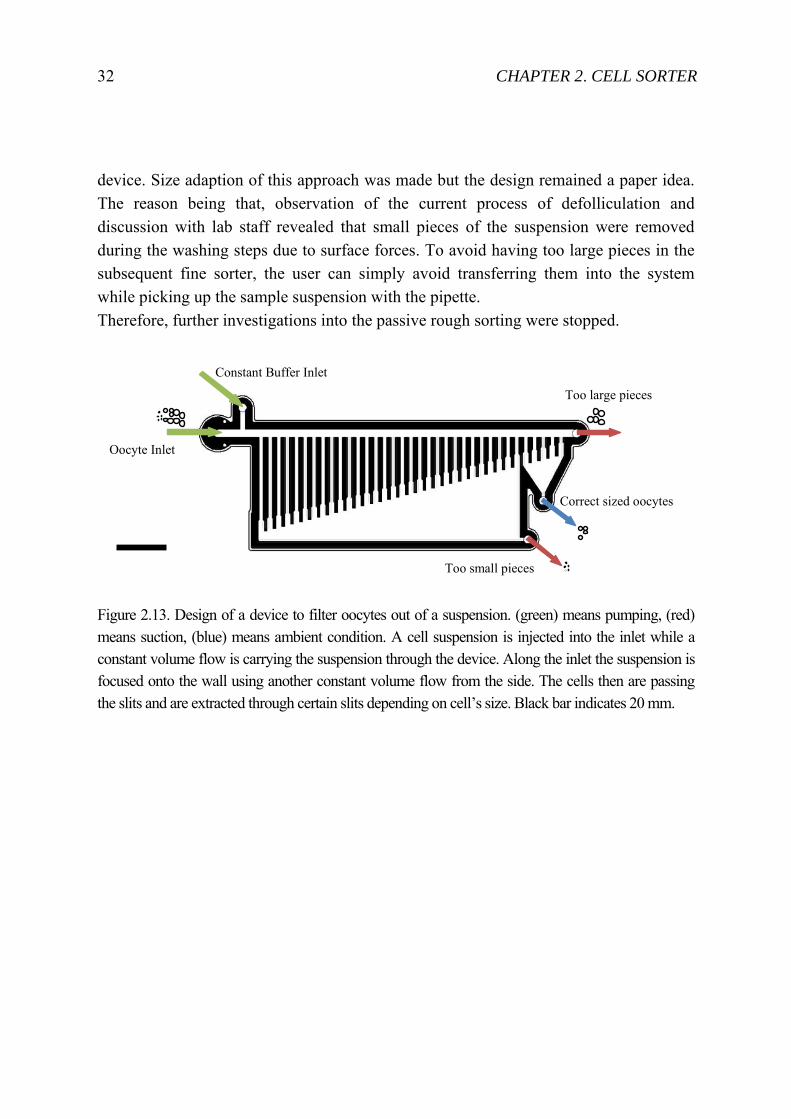
horizontal channel by a constant flow. An additional flow is used to focus the oocytes along one channel wall. By having the right volume flow ratio, small oocytes will be removed along the first 30 channels while 1.0 mm to 1.4 mm would be traveling through the subsequent 5 channels. Finally clusters of oocytes would leave the device through the straight channel. The small oocytes and the clusters will be transported into the waste, while 1.0mm to 1.4mm oocytes will be delivered into the fine sorter.
Figure 2.12. Principle of size-dependent cell separation. (a) Overall principle, (b), and (c) particle behaviors at a branch point. (Image adapted from publication [4])
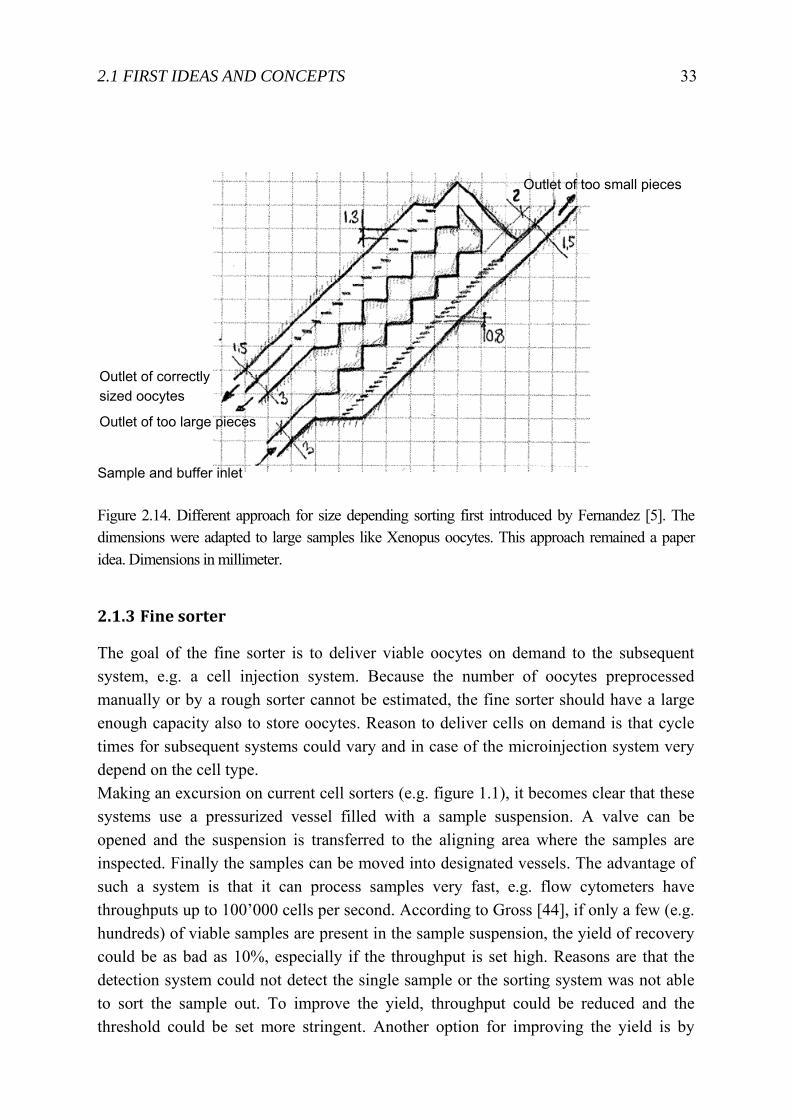
Test showed that priming was a challenge. Having a dry device, buffer could be added through the inlets. First, the chamber for small pieces was filled, then the one for the correct sized oocytes, and finally the rest of the channel for the too large pieces. If still some channels were filled with air bubbles, tapping onto the device helped to release the bubbles. After adding the oocyte suspension into the device, oocytes were removed at the correct position. However, as soon as oocytes entered the slights, they were blocked because of the increased flow resistance. To avoid such blocking the channel cross sections would have to be widened. This would have increased the size of the device drastically. Therefore, the decision was to look for a more suitable and easier to prime solution. Alternative solutions were to use either the approach presented by Fernandez [5] or simply filters with two different mesh sizes. Fernandez’s approach is sketched in figure 2.14. His approach is based on filters with different mesh sizes integrated into a fluidic
32 CHAPTER 2. CELL SORTER
device. Size adaption of this approach was made but the design remained a paper idea. The reason being that, observation of the current process of defolliculation and discussion with lab staff revealed that small pieces of the suspension were removed during the washing steps due to surface forces. To avoid having too large pieces in the subsequent fine sorter, the user can simply avoid transferring them into the system while picking up the sample suspension with the pipette. Therefore, further investigations into the passive rough sorting were stopped.
Figure 2.13. Design of a device to filter oocytes out of a suspension. (green) means pumping, (red) means suction, (blue) means ambient condition. A cell suspension is injected into the inlet while a constant volume flow is carrying the suspension through the device. Along the inlet the suspension is focused onto the wall using another constant volume flow from the side. The cells then are passing the slits and are extracted through certain slits depending on cell’s size. Black bar indicates 20 mm.
Oocyte Inlet
Constant Buffer Inlet
Too large pieces
Too small pieces
Correct sized oocytes
2.1 FIRST IDEAS AND CONCEPTS 33
Figure 2.14. Different approach for size depending sorting first introduced by Fernandez [5]. The dimensions were adapted to large samples like Xenopus oocytes. This approach remained a paper idea. Dimensions in millimeter.
2.1.3 Fine sorter
The goal of the fine sorter is to deliver viable oocytes on demand to the subsequent system, e.g. a cell injection system. Because the number of oocytes preprocessed manually or by a rough sorter cannot be estimated, the fine sorter should have a large enough capacity also to store oocytes. Reason to deliver cells on demand is that cycle times for subsequent systems could vary and in case of the microinjection system very depend on the cell type. Making an excursion on current cell sorters (e.g. figure 1.1), it becomes clear that these systems use a pressurized vessel filled with a sample suspension. A valve can be opened and the suspension is transferred to the aligning area where the samples are inspected. Finally the samples can be moved into designated vessels. The advantage of such a system is that it can process samples very fast, e.g. flow cytometers have throughputs up to 100’000 cells per second. According to Gross [44], if only a few (e.g. hundreds) of viable samples are present in the sample suspension, the yield of recovery could be as bad as 10%, especially if the throughput is set high. Reasons are that the detection system could not detect the single sample or the sorting system was not able to sort the sample out. To improve the yield, throughput could be reduced and the threshold could be set more stringent. Another option for improving the yield is by
Outlet of correctly sized oocytes
Outlet of too large pieces
Sample and buffer inlet
Outlet of too small pieces
34 CHAPTER 2. CELL SORTER
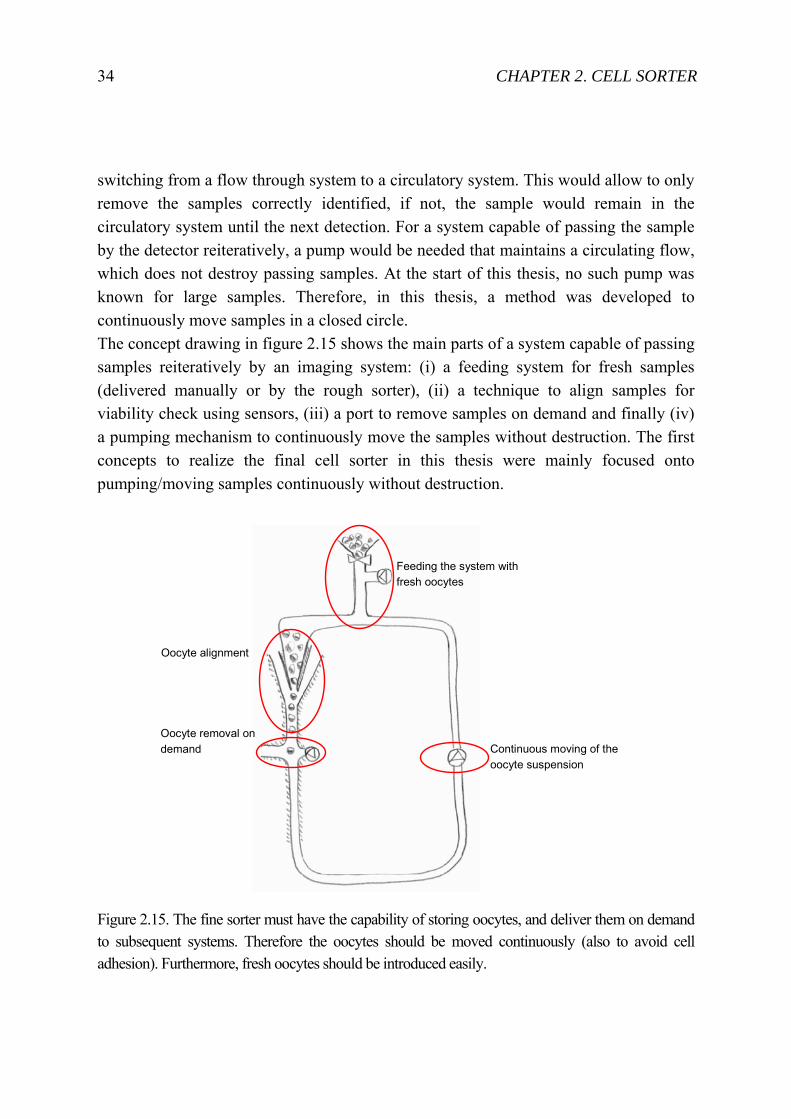
switching from a flow through system to a circulatory system. This would allow to only remove the samples correctly identified, if not, the sample would remain in the circulatory system until the next detection. For a system capable of passing the sample by the detector reiteratively, a pump would be needed that maintains a circulating flow, which does not destroy passing samples. At the start of this thesis, no such pump was known for large samples. Therefore, in this thesis, a method was developed to continuously move samples in a closed circle. The concept drawing in figure 2.15 shows the main parts of a system capable of passing samples reiteratively by an imaging system: (i) a feeding system for fresh samples (delivered manually or by the rough sorter), (ii) a technique to align samples for viability check using sensors, (iii) a port to remove samples on demand and finally (iv) a pumping mechanism to continuously move the samples without destruction. The first concepts to realize the final cell sorter in this thesis were mainly focused onto pumping/moving samples continuously without destruction.
Figure 2.15. The fine sorter must have the capability of storing oocytes, and deliver them on demand to subsequent systems. Therefore the oocytes should be moved continuously (also to avoid cell adhesion). Furthermore, fresh oocytes should be introduced easily.
Feeding the system with fresh oocytes
Continuous moving of the oocyte suspension
Oocyte alignment
Oocyte removal on demand
2.1 FIRST IDEAS AND CONCEPTS 35
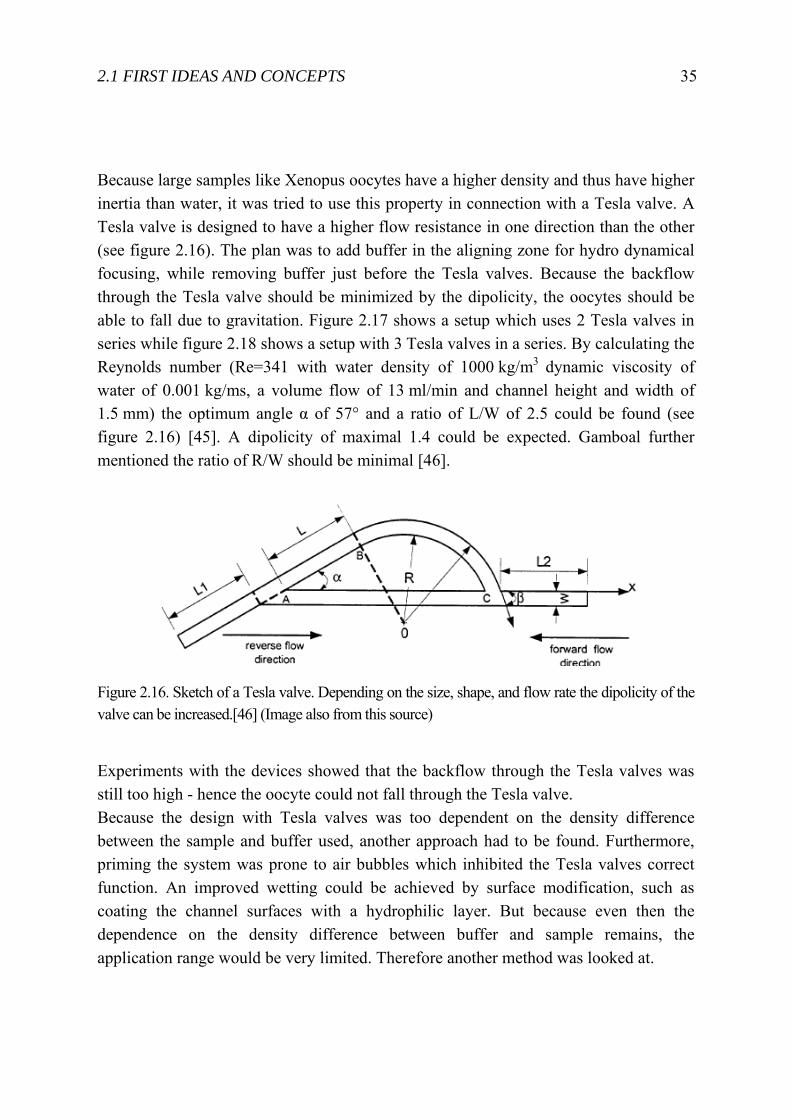
Because large samples like Xenopus oocytes have a higher density and thus have higher inertia than water, it was tried to use this property in connection with a Tesla valve. A Tesla valve is designed to have a higher flow resistance in one direction than the other (see figure 2.16). The plan was to add buffer in the aligning zone for hydro dynamical focusing, while removing buffer just before the Tesla valves. Because the backflow through the Tesla valve should be minimized by the dipolicity, the oocytes should be able to fall due to gravitation. Figure 2.17 shows a setup which uses 2 Tesla valves in series while figure 2.18 shows a setup with 3 Tesla valves in a series. By calculating the Reynolds number (Re=341 with water density of 1000 kg/m3 dynamic viscosity of water of 0.001 kg/ms, a volume flow of 13 ml/min and channel height and width of 1.5 mm) the optimum angle α of 57° and a ratio of L/W of 2.5 could be found (see figure 2.16) [45]. A dipolicity of maximal 1.4 could be expected. Gamboal further mentioned the ratio of R/W should be minimal [46].
Figure 2.16. Sketch of a Tesla valve. Depending on the size, shape, and flow rate the dipolicity of the valve can be increased.[46] (Image also from this source)
Experiments with the devices showed that the backflow through the Tesla valves was still too high - hence the oocyte could not fall through the Tesla valve. Because the design with Tesla valves was too dependent on the density difference between the sample and buffer used, another approach had to be found. Furthermore, priming the system was prone to air bubbles which inhibited the Tesla valves correct function. An improved wetting could be achieved by surface modification, such as coating the channel surfaces with a hydrophilic layer. But because even then the dependence on the density difference between buffer and sample remains, the application range would be very limited. Therefore another method was looked at.
36 CHAPTER 2. CELL SORTER
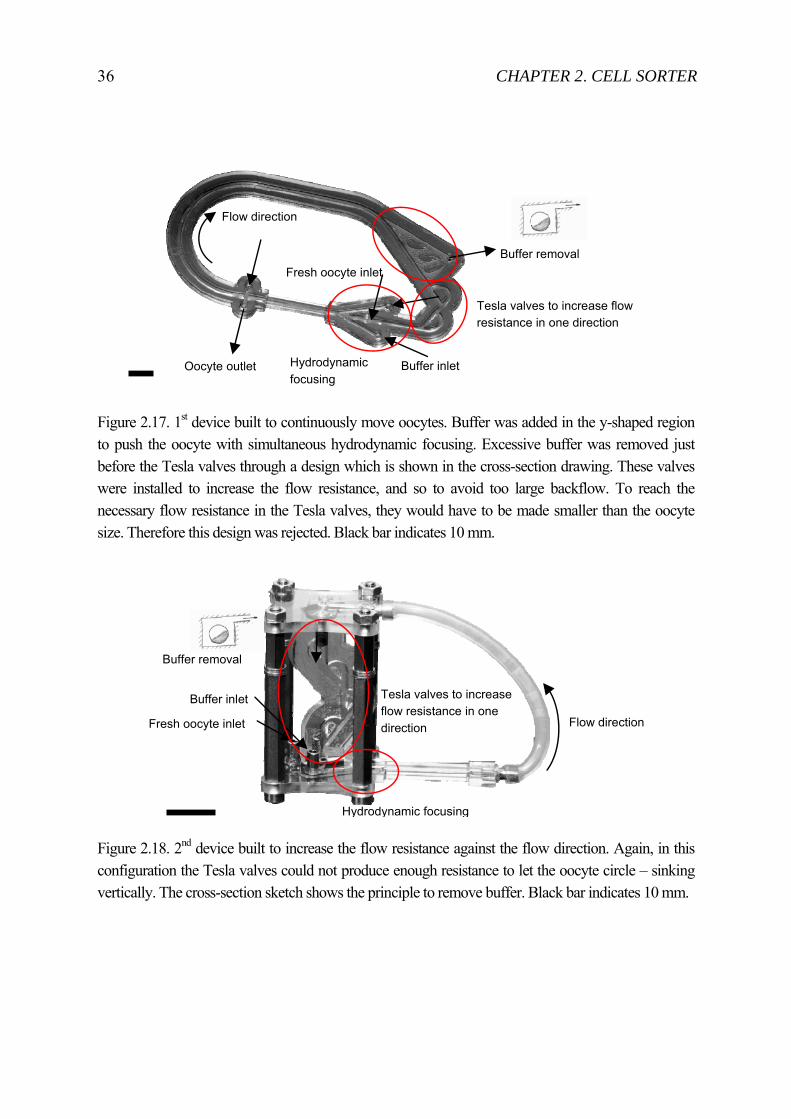
Figure 2.17. 1st device built to continuously move oocytes. Buffer was added in the y-shaped region to push the oocyte with simultaneous hydrodynamic focusing. Excessive buffer was removed just before the Tesla valves through a design which is shown in the cross-section drawing. These valves were installed to increase the flow resistance, and so to avoid too large backflow. To reach the necessary flow resistance in the Tesla valves, they would have to be made smaller than the oocyte size. Therefore this design was rejected. Black bar indicates 10 mm.
Figure 2.18. 2nd device built to increase the flow resistance against the flow direction. Again, in this configuration the Tesla valves could not produce enough resistance to let the oocyte circle – sinking vertically. The cross-section sketch shows the principle to remove buffer. Black bar indicates 10 mm.
Buffer removal
Flow direction Fresh oocyte inlet
Buffer inlet
Hydrodynamic focusing
Tesla valves to increase flow resistance in one direction
Buffer removal
Flow direction
Tesla valves to increase flow resistance in one direction
Oocyte outlet
Fresh oocyte inlet
Buffer inlet Hydrodynamic focusing
2.1 FIRST IDEAS AND CONCEPTS 37
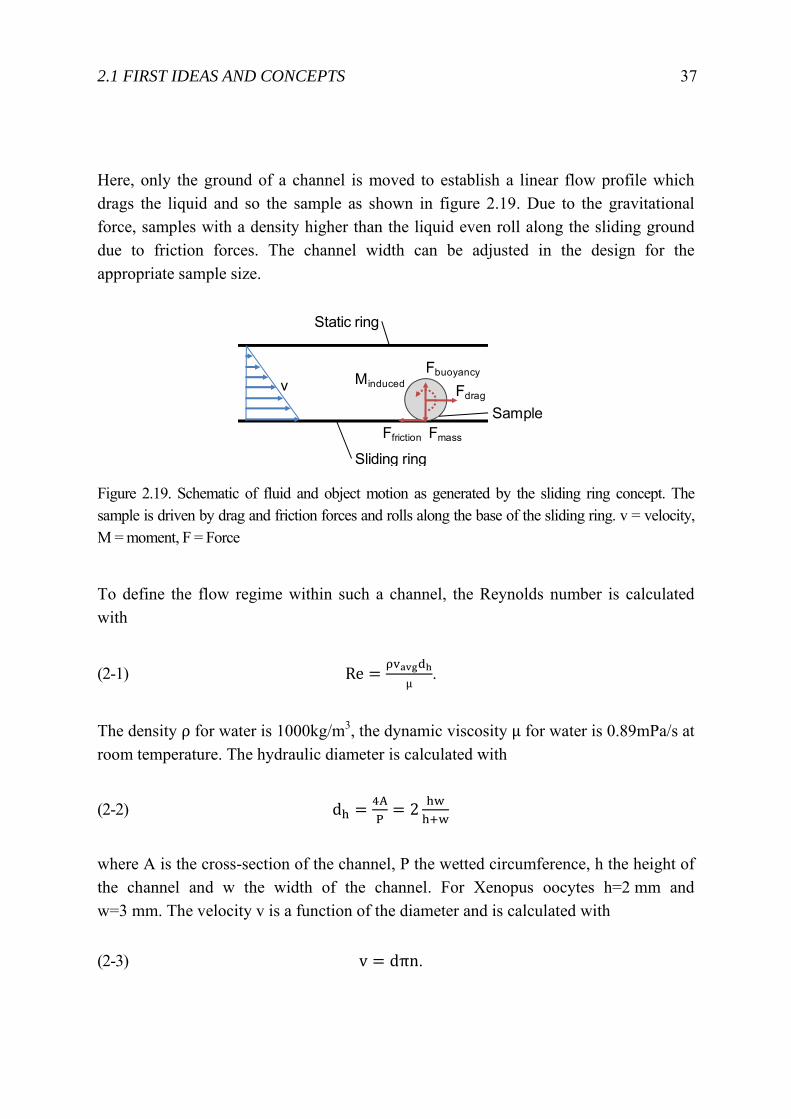
Here, only the ground of a channel is moved to establish a linear flow profile which drags the liquid and so the sample as shown in figure 2.19. Due to the gravitational force, samples with a density higher than the liquid even roll along the sliding ground due to friction forces. The channel width can be adjusted in the design for the appropriate sample size.
Figure 2.19. Schematic of fluid and object motion as generated by the sliding ring concept. The sample is driven by drag and friction forces and rolls along the base of the sliding ring. v = velocity, M = moment, F = Force
To define the flow regime within such a channel, the Reynolds number is calculated with
(2-1) Reµ
.
The density ρ for water is 1000kg/m3, the dynamic viscosity µ for water is 0.89mPa/s at room temperature. The hydraulic diameter is calculated with
(2-2) d AP
2
where A is the cross-section of the channel, P the wetted circumference, h the height of the channel and w the width of the channel. For Xenopus oocytes h=2 mm and w=3 mm. The velocity v is a function of the diameter and is calculated with
(2-3) v dπn.
Ffriction
Fdrag
Fbuoyancy
Fmass
Minduced
Static ring
Sliding ring
Sample
v
38 CHAPTER 2. CELL SORTER
The inner diameter of the circular channel for Xenopus oocytes is d is 90 mm, the outer diameter d 96 mm. The average diameter d=93 mm. Revolution speed is given by the electro motor used to drive the ground (n ) which is 15500 min-1 for the Maxon Amax D16 mm used. This speed has to be divided by the gear ratio used, which leads to the actual revolution speed
(2-4) n n·
.
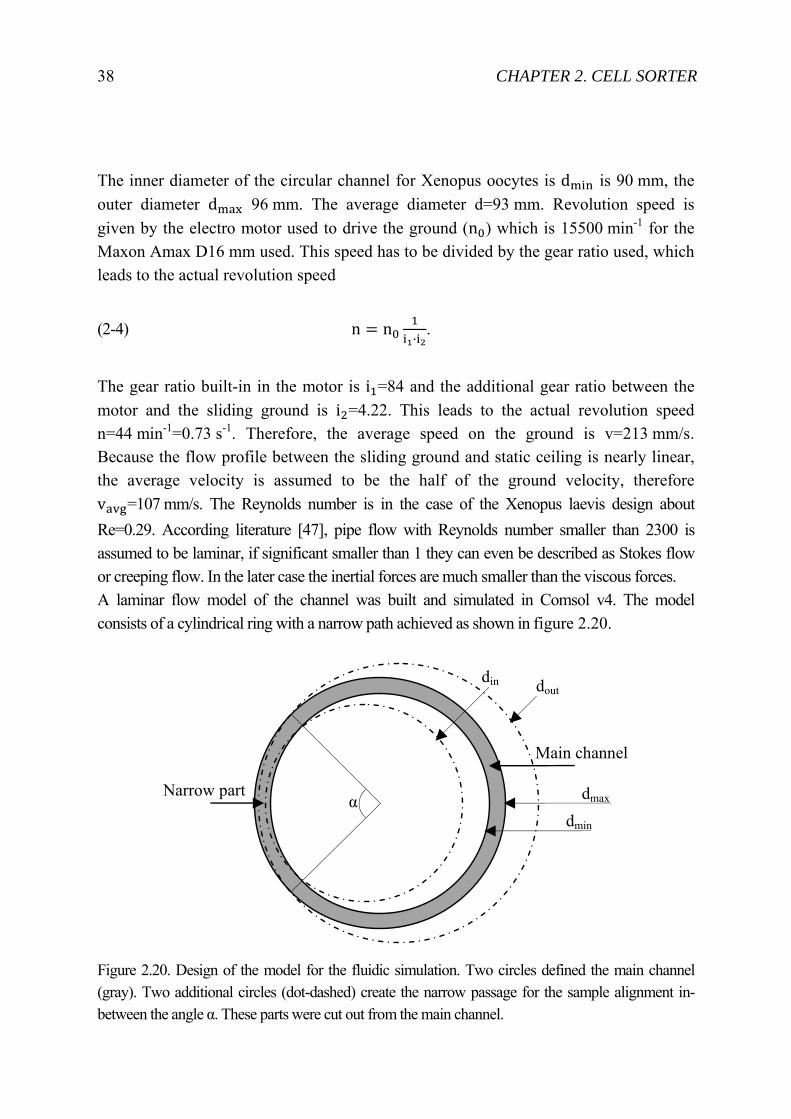
The gear ratio built-in in the motor is i =84 and the additional gear ratio between the motor and the sliding ground is i =4.22. This leads to the actual revolution speed n=44 min-1=0.73 s-1. Therefore, the average speed on the ground is v=213 mm/s. Because the flow profile between the sliding ground and static ceiling is nearly linear, the average velocity is assumed to be the half of the ground velocity, therefore v =107 mm/s. The Reynolds number is in the case of the Xenopus laevis design about Re=0.29. According literature [47], pipe flow with Reynolds number smaller than 2300 is assumed to be laminar, if significant smaller than 1 they can even be described as Stokes flow or creeping flow. In the later case the inertial forces are much smaller than the viscous forces. A laminar flow model of the channel was built and simulated in Comsol v4. The model consists of a cylindrical ring with a narrow path achieved as shown in figure 2.20.
Figure 2.20. Design of the model for the fluidic simulation. Two circles defined the main channel (gray). Two additional circles (dot-dashed) create the narrow passage for the sample alignment in-between the angle α. These parts were cut out from the main channel.
α dmax dmin
din dout
Narrow part
Main channel
2.1 FIRST IDEAS AND CONCEPTS 39
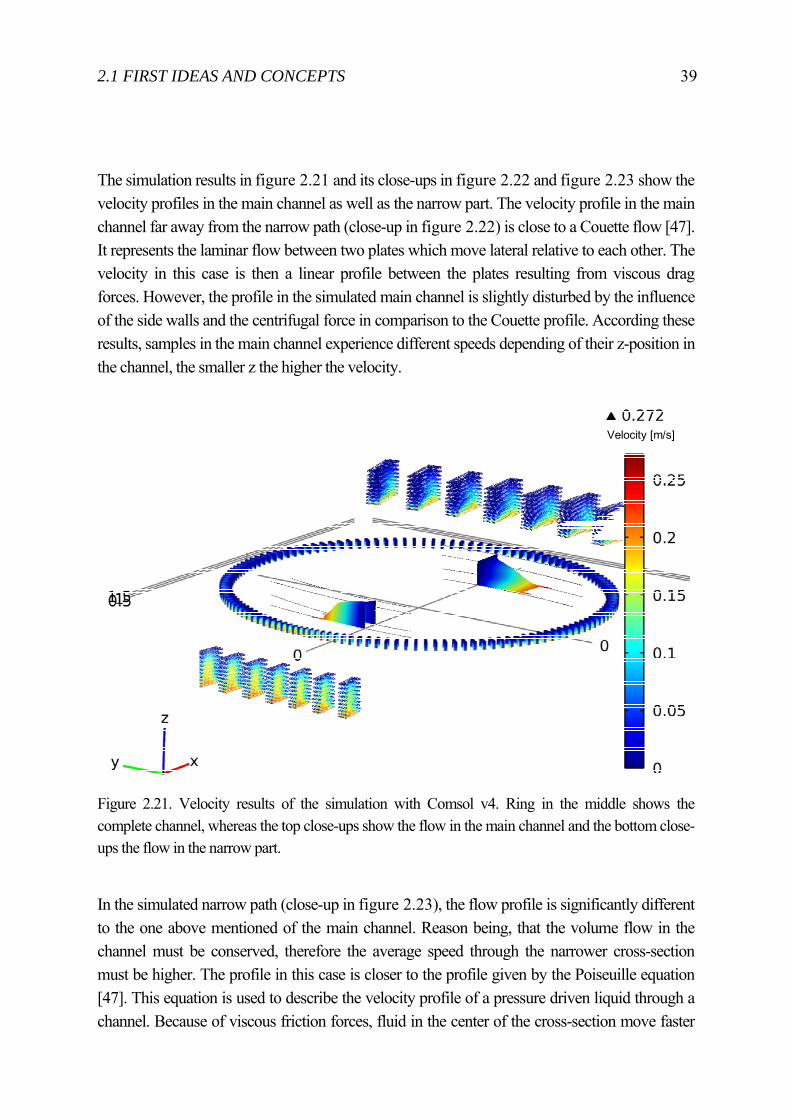
The simulation results in figure 2.21 and its close-ups in figure 2.22 and figure 2.23 show the velocity profiles in the main channel as well as the narrow part. The velocity profile in the main channel far away from the narrow path (close-up in figure 2.22) is close to a Couette flow [47]. It represents the laminar flow between two plates which move lateral relative to each other. The velocity in this case is then a linear profile between the plates resulting from viscous drag forces. However, the profile in the simulated main channel is slightly disturbed by the influence of the side walls and the centrifugal force in comparison to the Couette profile. According these results, samples in the main channel experience different speeds depending of their z-position in the channel, the smaller z the higher the velocity.
Figure 2.21. Velocity results of the simulation with Comsol v4. Ring in the middle shows the complete channel, whereas the top close-ups show the flow in the main channel and the bottom close-ups the flow in the narrow part.
In the simulated narrow path (close-up in figure 2.23), the flow profile is significantly different to the one above mentioned of the main channel. Reason being, that the volume flow in the channel must be conserved, therefore the average speed through the narrower cross-section must be higher. The profile in this case is closer to the profile given by the Poiseuille equation [47]. This equation is used to describe the velocity profile of a pressure driven liquid through a channel. Because of viscous friction forces, fluid in the center of the cross-section move faster
Velocity [m/s]
40 CHAPTER 2. CELL SORTER
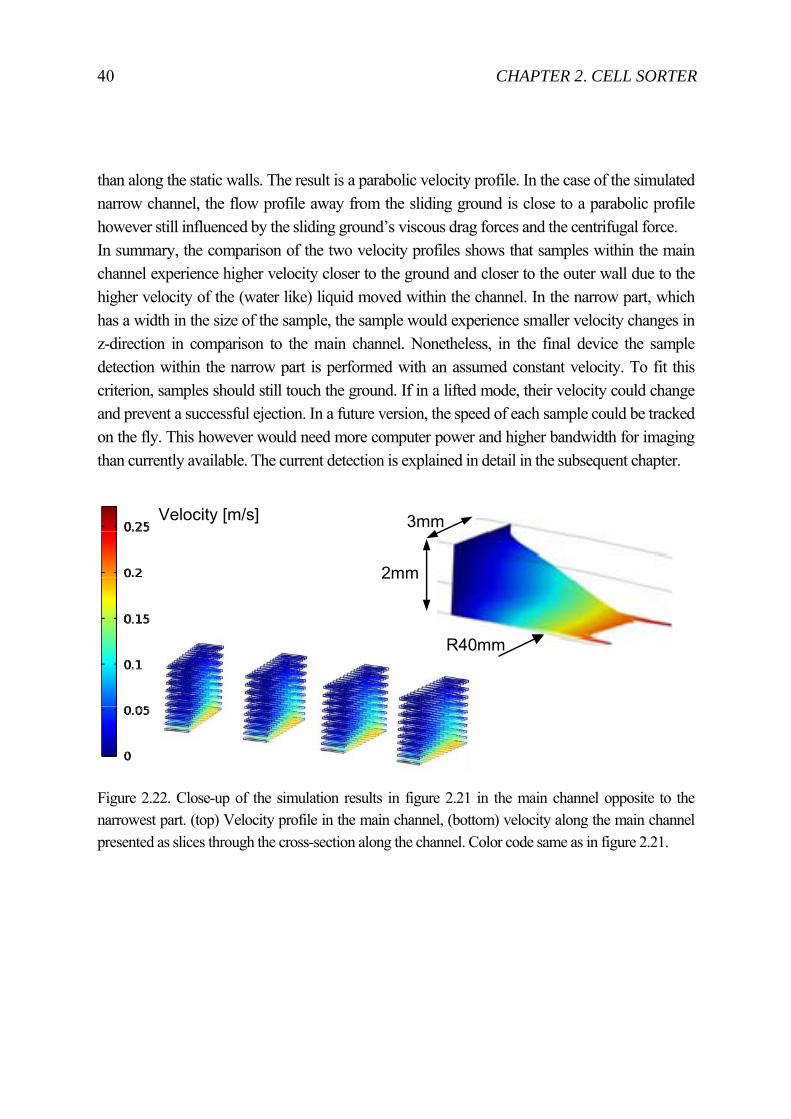
than along the static walls. The result is a parabolic velocity profile. In the case of the simulated narrow channel, the flow profile away from the sliding ground is close to a parabolic profile however still influenced by the sliding ground’s viscous drag forces and the centrifugal force. In summary, the comparison of the two velocity profiles shows that samples within the main channel experience higher velocity closer to the ground and closer to the outer wall due to the higher velocity of the (water like) liquid moved within the channel. In the narrow part, which has a width in the size of the sample, the sample would experience smaller velocity changes in z-direction in comparison to the main channel. Nonetheless, in the final device the sample detection within the narrow part is performed with an assumed constant velocity. To fit this criterion, samples should still touch the ground. If in a lifted mode, their velocity could change and prevent a successful ejection. In a future version, the speed of each sample could be tracked on the fly. This however would need more computer power and higher bandwidth for imaging than currently available. The current detection is explained in detail in the subsequent chapter.
Figure 2.22. Close-up of the simulation results in figure 2.21 in the main channel opposite to the narrowest part. (top) Velocity profile in the main channel, (bottom) velocity along the main channel presented as slices through the cross-section along the channel. Color code same as in figure 2.21.
2mm
Velocity [m/s]
R40mm
3mm

2.1 FIRST IDEAS AND CONCEPTS 41
Figure 2.23. Close-up of the results in figure 2.21 for the narrow part. (top) Velocity profile at the narrowest part, (bottom) velocity along the narrow path presented as slices through the cross-section along the channel. Color code same as in figure 2.21.
2mm1.5mm
Velocity [m/s]
R40mm
42 CHAPTER 2. CELL SORTER
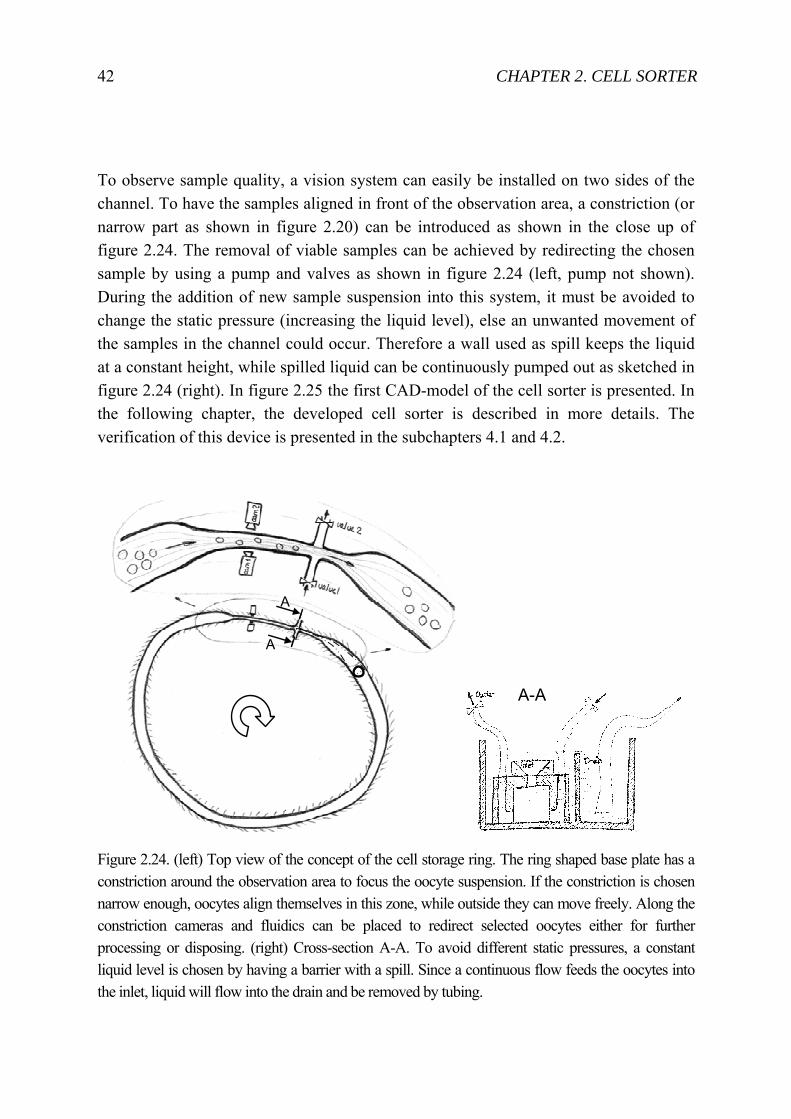
To observe sample quality, a vision system can easily be installed on two sides of the channel. To have the samples aligned in front of the observation area, a constriction (or narrow part as shown in figure 2.20) can be introduced as shown in the close up of figure 2.24. The removal of viable samples can be achieved by redirecting the chosen sample by using a pump and valves as shown in figure 2.24 (left, pump not shown). During the addition of new sample suspension into this system, it must be avoided to change the static pressure (increasing the liquid level), else an unwanted movement of the samples in the channel could occur. Therefore a wall used as spill keeps the liquid at a constant height, while spilled liquid can be continuously pumped out as sketched in figure 2.24 (right). In figure 2.25 the first CAD-model of the cell sorter is presented. In the following chapter, the developed cell sorter is described in more details. The verification of this device is presented in the subchapters 4.1 and 4.2.
Figure 2.24. (left) Top view of the concept of the cell storage ring. The ring shaped base plate has a constriction around the observation area to focus the oocyte suspension. If the constriction is chosen narrow enough, oocytes align themselves in this zone, while outside they can move freely. Along the constriction cameras and fluidics can be placed to redirect selected oocytes either for further processing or disposing. (right) Cross-section A-A. To avoid different static pressures, a constant liquid level is chosen by having a barrier with a spill. Since a continuous flow feeds the oocytes into the inlet, liquid will flow into the drain and be removed by tubing.
A
A
A-A
2.2 FINAL SYSTEM 43
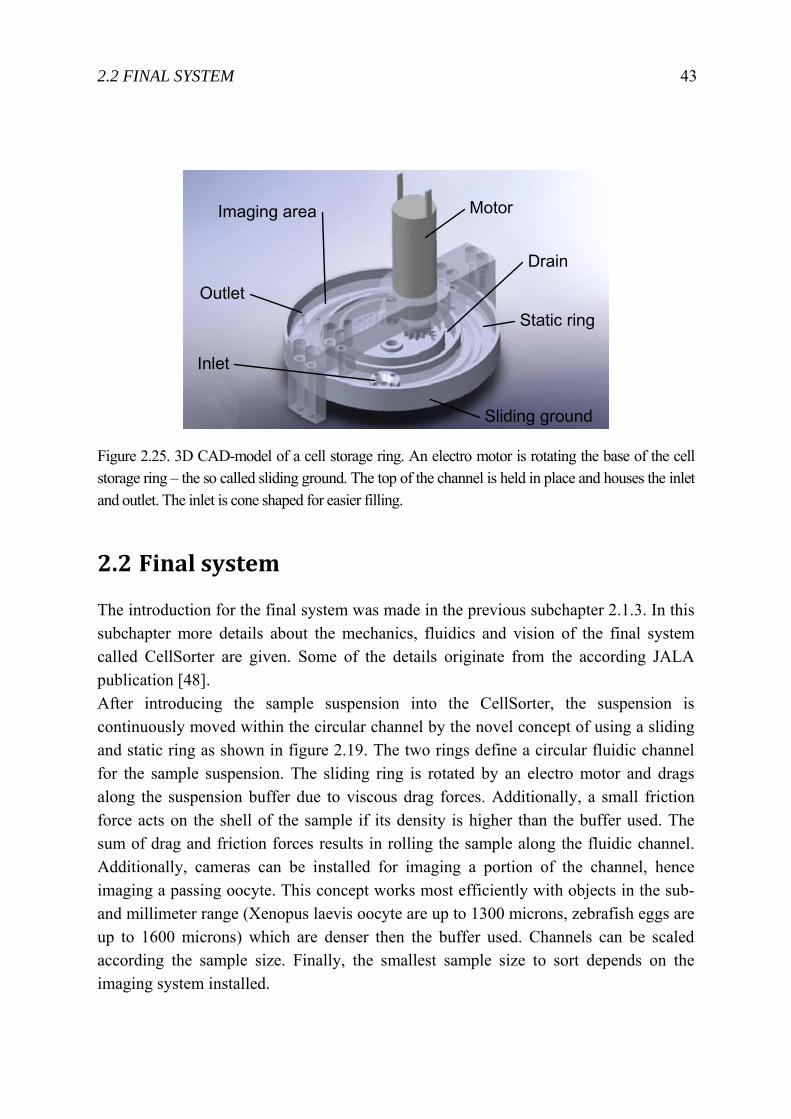
Figure 2.25. 3D CAD-model of a cell storage ring. An electro motor is rotating the base of the cell storage ring – the so called sliding ground. The top of the channel is held in place and houses the inlet and outlet. The inlet is cone shaped for easier filling.
2.2 Final system
The introduction for the final system was made in the previous subchapter 2.1.3. In this subchapter more details about the mechanics, fluidics and vision of the final system called CellSorter are given. Some of the details originate from the according JALA publication [48]. After introducing the sample suspension into the CellSorter, the suspension is continuously moved within the circular channel by the novel concept of using a sliding and static ring as shown in figure 2.19. The two rings define a circular fluidic channel for the sample suspension. The sliding ring is rotated by an electro motor and drags along the suspension buffer due to viscous drag forces. Additionally, a small friction force acts on the shell of the sample if its density is higher than the buffer used. The sum of drag and friction forces results in rolling the sample along the fluidic channel. Additionally, cameras can be installed for imaging a portion of the channel, hence imaging a passing oocyte. This concept works most efficiently with objects in the sub- and millimeter range (Xenopus laevis oocyte are up to 1300 microns, zebrafish eggs are up to 1600 microns) which are denser then the buffer used. Channels can be scaled according the sample size. Finally, the smallest sample size to sort depends on the imaging system installed.
Sliding ground
Static ring
Inlet
MotorImaging area
Outlet
Drain
44 CHAPTER 2. CELL SORTER
With this concept samples in the millimeter range can for the first time be moved continuously in a circulating manner without destroying them (biological relevant results are presented in chapters 4.1.4 and 4.2.4). Additionally this concept offers:
1. To store samples until their use – continuous motion avoids adhesion 2. To observe samples over and over again – in connection with the vision
system 3. To deliver samples on demand to a subsequent system 4. To load the CellSorter with additional samples on the fly6
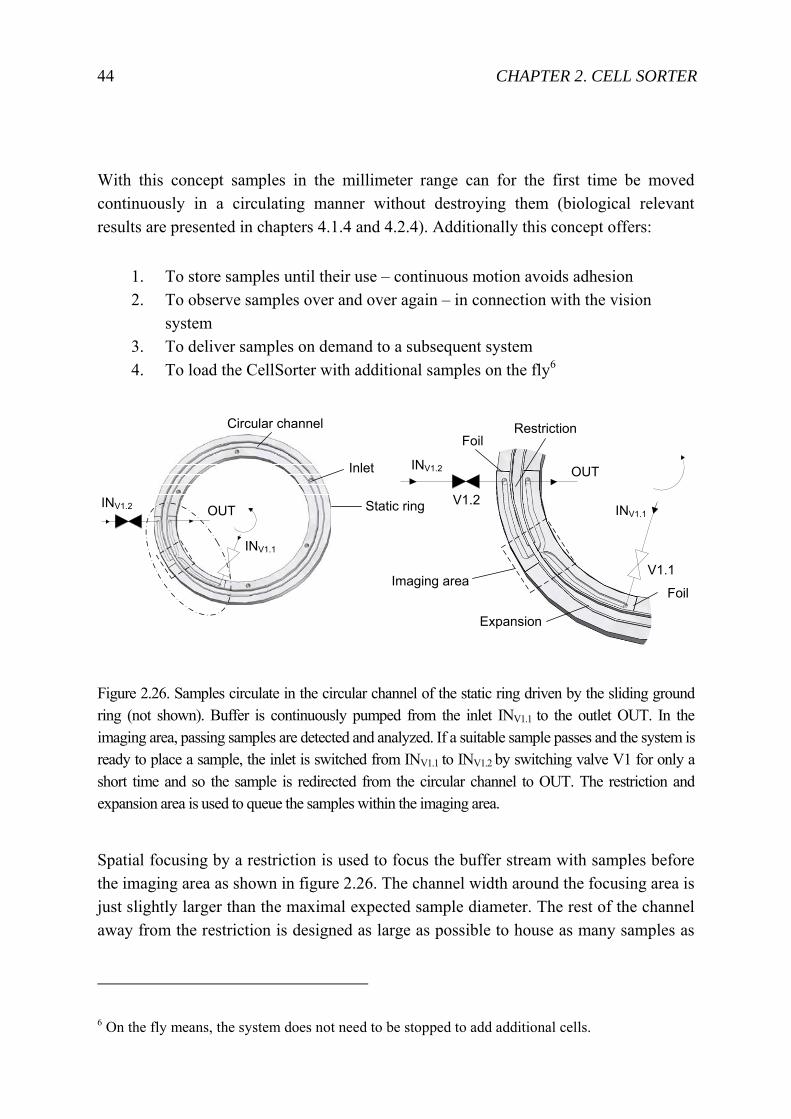
Figure 2.26. Samples circulate in the circular channel of the static ring driven by the sliding ground ring (not shown). Buffer is continuously pumped from the inlet INV1.1 to the outlet OUT. In the imaging area, passing samples are detected and analyzed. If a suitable sample passes and the system is ready to place a sample, the inlet is switched from INV1.1 to INV1.2 by switching valve V1 for only a short time and so the sample is redirected from the circular channel to OUT. The restriction and expansion area is used to queue the samples within the imaging area.
Spatial focusing by a restriction is used to focus the buffer stream with samples before the imaging area as shown in figure 2.26. The channel width around the focusing area is just slightly larger than the maximal expected sample diameter. The rest of the channel away from the restriction is designed as large as possible to house as many samples as
6 On the fly means, the system does not need to be stopped to add additional cells.
Static ring
Circular channel
Inlet
INV1.2
INV1.1
OUT
Foil
Foil
V1.2
V1.1
Expansion
Imaging area
Restriction
INV1.2
INV1.1
OUT
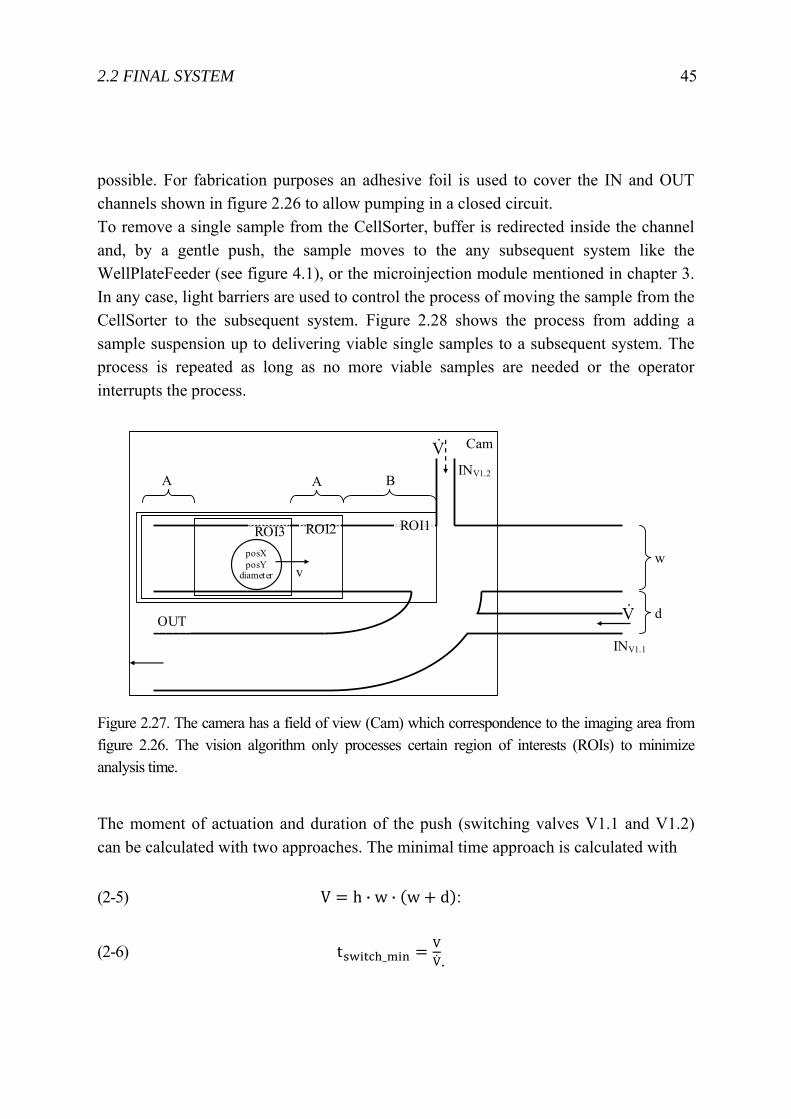
2.2 FINAL SYSTEM 45
possible. For fabrication purposes an adhesive foil is used to cover the IN and OUT channels shown in figure 2.26 to allow pumping in a closed circuit. To remove a single sample from the CellSorter, buffer is redirected inside the channel and, by a gentle push, the sample moves to the any subsequent system like the WellPlateFeeder (see figure 4.1), or the microinjection module mentioned in chapter 3. In any case, light barriers are used to control the process of moving the sample from the CellSorter to the subsequent system. Figure 2.28 shows the process from adding a sample suspension up to delivering viable single samples to a subsequent system. The process is repeated as long as no more viable samples are needed or the operator interrupts the process.
Figure 2.27. The camera has a field of view (Cam) which correspondence to the imaging area from figure 2.26. The vision algorithm only processes certain region of interests (ROIs) to minimize analysis time.
The moment of actuation and duration of the push (switching valves V1.1 and V1.2) can be calculated with two approaches. The minimal time approach is calculated with
(2-5) V h · w · w d :
(2-6) t _VV.
ROI1ROI2ROI3 posX posY
diameter
A A B
Cam
w
d
V&
V&
v
INV1.2
INV1.1
OUT
46 CHAPTER 2. CELL SORTER
V is the volume in front of the outlet (see figure 2.27), that must be removed with the volume flow V. The channel height h, width w and distance d are used to calculate the volume. Values used for Xenopus and zebrafish samples are h=2.0 mm, w=1.5 mm, d=1.0 mm and V=60 ml/min=1 mm3/ms which result to V=7.5 mm3 and tswitch_min=7.5 ms. The second approach gives the maximal switch time where the time of the sample in front of the outlet is calculated with
(2-7) t _ ,
v is the speed of the sample which passes the vision system. The speed can be measured by using two subsequent images taken by the vision system with known time difference. A typical value for Xenopus and zebrafish samples is v=100 um/ms=0.1 mm/ms which gives tswitch_max=15 ms. These two switch times show the lower and upper limit of the valve switch time. A feasible value is 10 ms which is also at the lower edge of the valve performance. To avoid removing two samples at once because of a too short distance in-between, a minimal distance must be introduced as
(2-8) minDistance v · t .
For Xenopus and zebrafish samples the minimal distance to avoid removing two successive samples is therefore between 0.75 mm and 1.5 mm. For safety reasons 1.5 mm was chosen for running the system. The restriction as the entry to the narrow part was initially designed as a sudden restriction from a 3.0 mm to 1.5 mm wide channel with fillets of 1.5 mm. This, however, often led, especially at low rotation numbers, to clogging. Reason was, that samples close to the inner and outer wall had to be extremely deflected. That is why, these samples’ tangential velocity was drastically reduced. If in this situation two samples were positioned at the inner and outer wall, they could block the channel. An improved design had a tapered channel, as shown in figure 2.26. This improved restriction shape imposed less critical tangential velocity changes and so less clogging could be observed. Additionally, by using the vision algorithm the time between sample detection events was monitored. If this time was suddenly increased, a clogging could be assumed. In this case, the sliding ground direction of rotation was reversed for a defined time for unclogging.
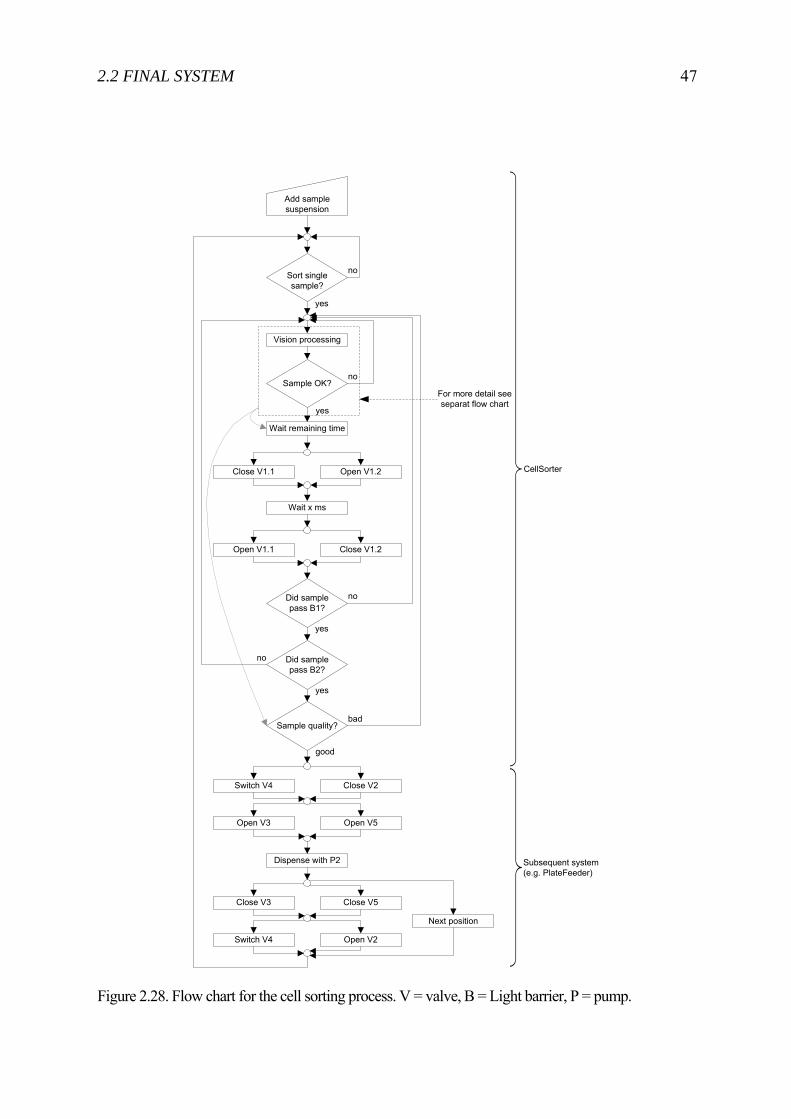
2.2 FINAL SYSTEM 47
Figure 2.28. Flow chart for the cell sorting process. V = valve, B = Light barrier, P = pump.
Sort single sample?
Did sample pass B1?
Switch V4 Close V2
Close V1.1 Open V1.2
Vision processing
Sample OK?
Wait x ms
Open V1.1 Close V1.2
Did sample pass B2?
Open V3 Open V5
Dispense with P2
Close V3 Close V5
Switch V4 Open V2
Next position
no
yes
no
no
yes
yes
yes
no
Sample quality?
good
bad
For more detail see separat flow chart
Wait remaining time
Add sample suspension
Subsequent system (e.g. PlateFeeder)
CellSorter
48 CHAPTER 2. CELL SORTER
The vision system installed along the fluidic path consists of one or two inexpensive CMOS-cameras and one or two LED-arrays for illumination. The illumination arrays are positioned 90° to the optical axis of the camera system to avoid direct light in the optics system. This illumination allows one to achieve a good darkfield illumination which allows one to image not only opaque samples, such as the Xenopus oocytes, but also transparent samples as zebrafish eggs. Additionally, excitation and emission filters can be introduced for using fluorescence signals for the identification of fluorescently labeled samples. In case of transparent samples like zebrafish eggs or larvae a one camera setup is sufficient (as shown in figure 4.1) while for opaque samples like Xenopus laevis oocytes or in cases where the user is interested in the sample surface, a two camera setup would be the preferred choice (as shown in figure 2.30). The two cameras would be placed opposite to each other, which enable the system observing the whole surface of a sample. A schematic of the setup is shown in figure 2.29. This configuration allows the system:
1. To inspect the whole surface of any kind of sample (opaque and transparent) 2. To inspect a compartment of a transparent sample 3. To inspect fluorescence signals
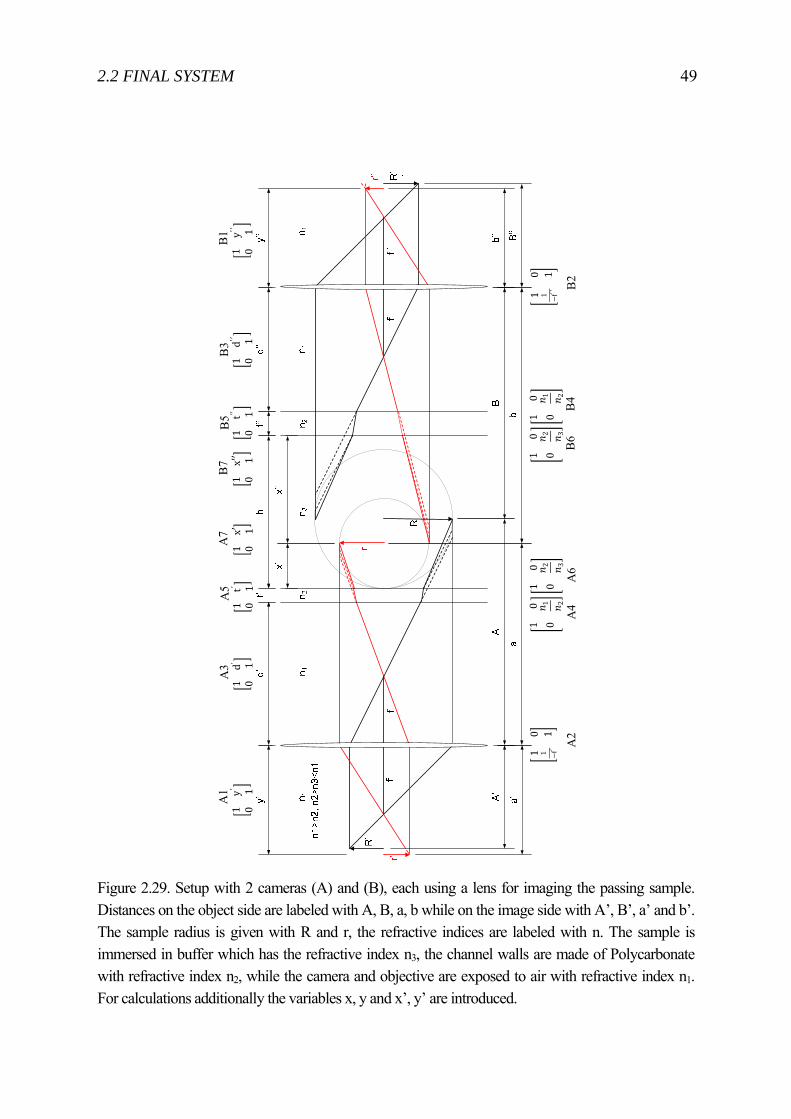
2.2 FINAL SYSTEM 49
Figure 2.29. Setup with 2 cameras (A) and (B), each using a lens for imaging the passing sample. Distances on the object side are labeled with A, B, a, b while on the image side with A’, B’, a’ and b’. The sample radius is given with R and r, the refractive indices are labeled with n. The sample is immersed in buffer which has the refractive index n3, the channel walls are made of Polycarbonate with refractive index n2, while the camera and objective are exposed to air with refractive index n1. For calculations additionally the variables x, y and x’, y’ are introduced.
A1
1y
01
10
1 f1
1d
01
10
01 2
10
02 3
1x
01
1t
01
A3
A5
A7
A4
A6
1y
01
10
1 f1
1d
01
1t
01
10
02 3
1x
01
B1
B3
B5
B7
A2
B2
B4
B6
10
01 2

50 CHAPTER 2. CELL SORTER
The optics setup can be described by the ray transfer matrix analysis [49] shown in figure 2.29. With the assumption of thin lenses the complete optics setup can be written in one 4x4 matrix for each camera:
(2-9) A A1 A2 A3 A4 A5 A6 A7
(2-10) B B1 B2 B3 B4 B5 B6 B7
The following formula is used to define the image with the use of the object and the optic matrix.
(2-11) R tanφ A R
tanφ , R tan γ B R
tan γ
To determine the position of an object point in the image area the tangential rays for each image path are put into equation (2-11):
(2-12) R 0
A R tanφ , R
0B R
tan γ
(2-13) R tanφ A R
0 , R tan γ B R
0
For calibration R, t , x R, f are known and R’ is given by the image taken by the camera. By using equation (2-13),
(2-14) y A f 1 RR
can be calculated. By using equation (2-13), d’ can be calculated with
(2-15) d f RR
R 1
Repeating the same for the second camera results to
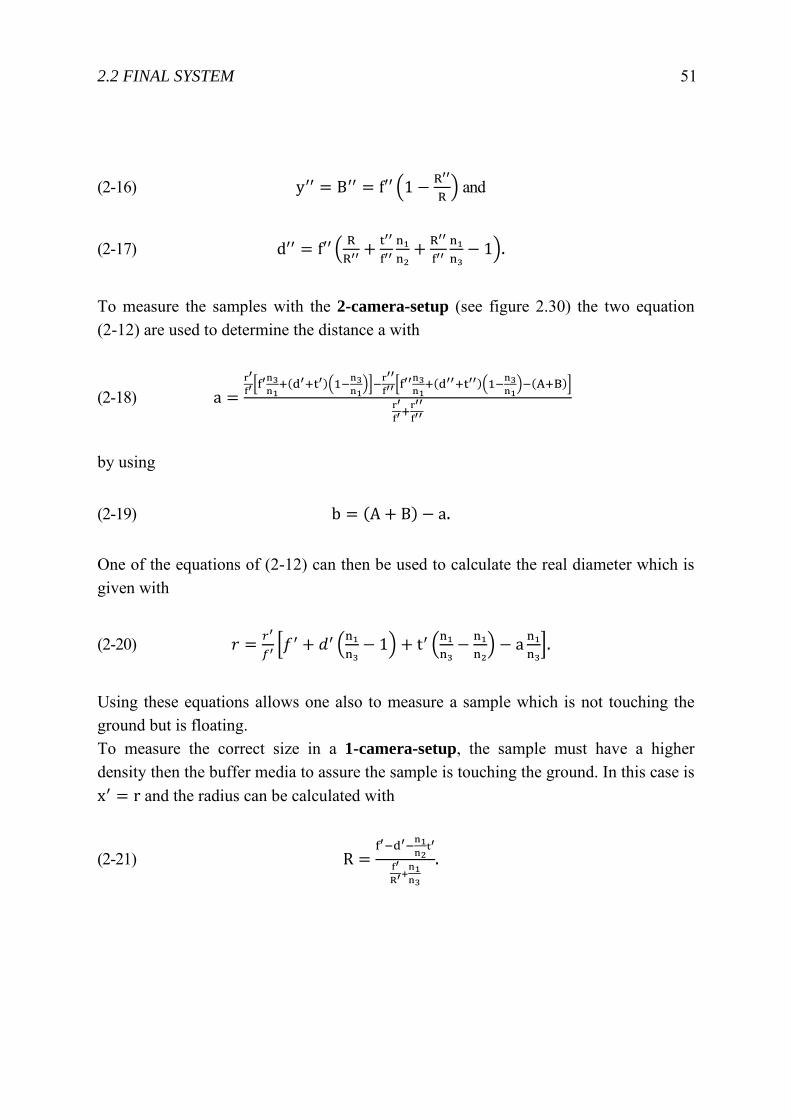
2.2 FINAL SYSTEM 51
(2-16) y B f 1 RR
and
(2-17) d f RR
R 1 .
To measure the samples with the 2-camera-setup (see figure 2.30) the two equation (2-12) are used to determine the distance a with
(2-18) aA B
by using
(2-19) b A B a.
One of the equations of (2-12) can then be used to calculate the real diameter which is given with
(2-20) 1 t a .
Using these equations allows one also to measure a sample which is not touching the ground but is floating. To measure the correct size in a 1-camera-setup, the sample must have a higher density then the buffer media to assure the sample is touching the ground. In this case is x r and the radius can be calculated with
(2-21) RR
.
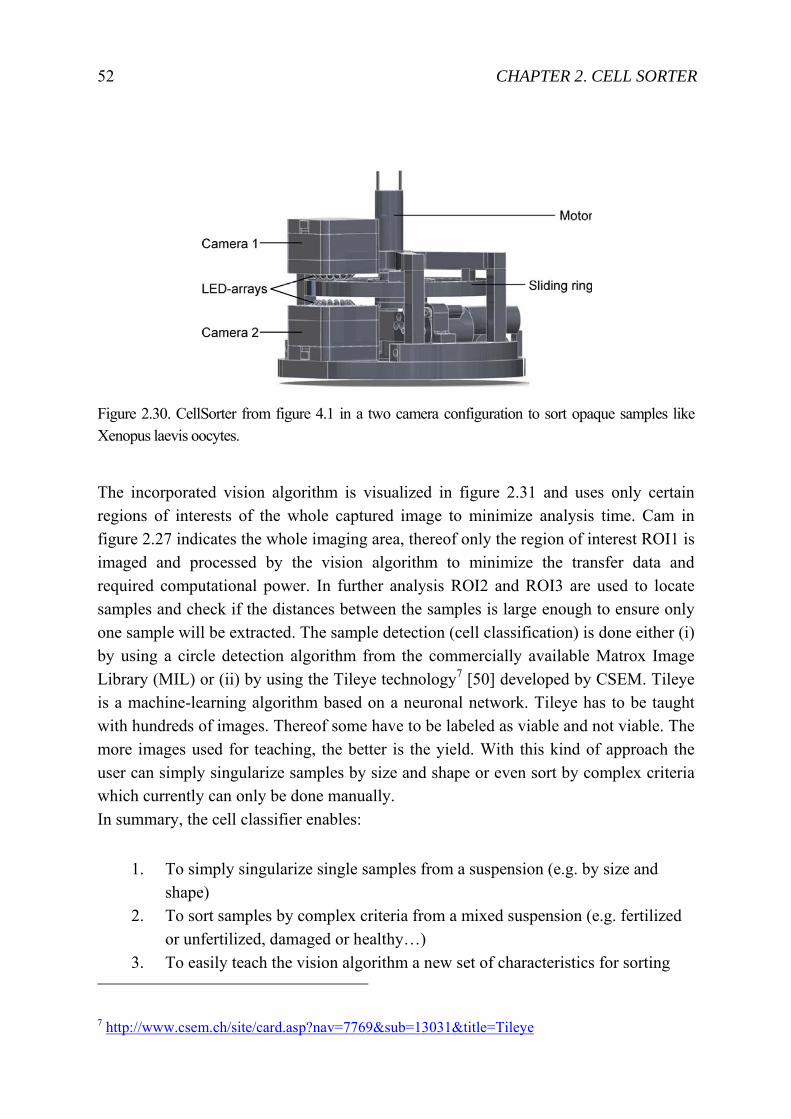
52 CHAPTER 2. CELL SORTER
Figure 2.30. CellSorter from figure 4.1 in a two camera configuration to sort opaque samples like Xenopus laevis oocytes.
The incorporated vision algorithm is visualized in figure 2.31 and uses only certain regions of interests of the whole captured image to minimize analysis time. Cam in figure 2.27 indicates the whole imaging area, thereof only the region of interest ROI1 is imaged and processed by the vision algorithm to minimize the transfer data and required computational power. In further analysis ROI2 and ROI3 are used to locate samples and check if the distances between the samples is large enough to ensure only one sample will be extracted. The sample detection (cell classification) is done either (i) by using a circle detection algorithm from the commercially available Matrox Image Library (MIL) or (ii) by using the Tileye technology7 [50] developed by CSEM. Tileye is a machine-learning algorithm based on a neuronal network. Tileye has to be taught with hundreds of images. Thereof some have to be labeled as viable and not viable. The more images used for teaching, the better is the yield. With this kind of approach the user can simply singularize samples by size and shape or even sort by complex criteria which currently can only be done manually. In summary, the cell classifier enables:
1. To simply singularize single samples from a suspension (e.g. by size and shape)
2. To sort samples by complex criteria from a mixed suspension (e.g. fertilized or unfertilized, damaged or healthy…)
3. To easily teach the vision algorithm a new set of characteristics for sorting
7 http://www.csem.ch/site/card.asp?nav=7769&sub=13031&title=Tileye
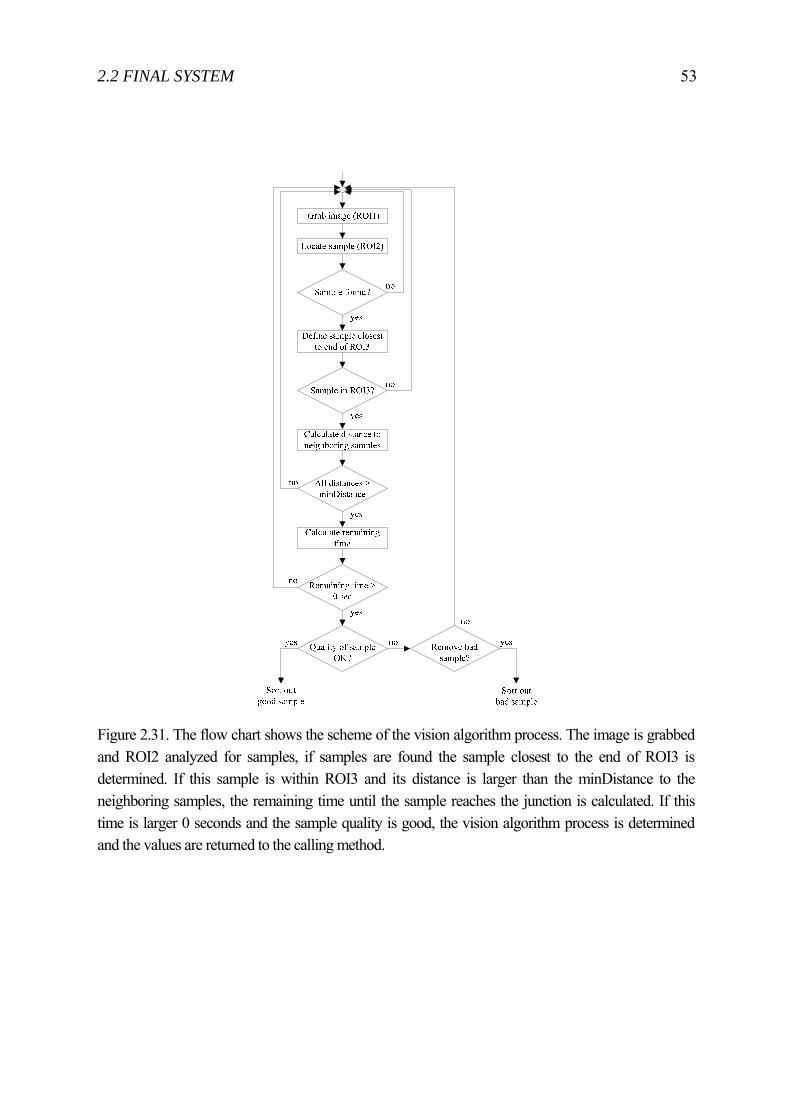
2.2 FINAL SYSTEM 53
Figure 2.31. The flow chart shows the scheme of the vision algorithm process. The image is grabbed and ROI2 analyzed for samples, if samples are found the sample closest to the end of ROI3 is determined. If this sample is within ROI3 and its distance is larger than the minDistance to the neighboring samples, the remaining time until the sample reaches the junction is calculated. If this time is larger 0 seconds and the sample quality is good, the vision algorithm process is determined and the values are returned to the calling method.

Chapter 3
Cell Injector for small to large biological samples in suspension
As described in the subchapter 1.2.3 several ways of automating the microinjection process were published in the past years. The systems differ if designed for adherent [32, 51] or non-adherent cells. In the following the focus will be on non-adherent cells, meaning cells in a suspension. Typically adherent cells can be brought into suspended form by trypsinization. So far, most publications for cells in suspension focused solely on the injection process, either by assisting the user for a more successful injection [52] or by fully automating the injection process with a camera / microscope system to localize cells and needle [53] or simply a blind injection [54]. Some systems additionally use force sensors [55, 56] or impedance sensors [32] to verify the injection or use vibrating piezo elements for a more gentle injection [52]. The impedance sensor can further be used to detect broken needles while running the system. Some teams further investigated single cell manipulation by transferring the injected cell into specific wells for subsequent single cell analysis [57]. But for all the presented systems a large amount of cells have to be presented either in a petri dish or have to be pre-positioned on a special matrix. These systems then have to locate a cell to perform the injection. Meaning, the design of these systems was mainly focused on the efficiency and success rates of the process. The user-friendliness of these systems regarding the loading and collection mechanism was so far not considered. Therefore, in the following subchapters the development towards an automated microinjection system (the final system is shown in figure 3.1) is described which offers automated loading and collection. First, the initial idea is presented and its application for small cells. At the end of the chapter the final CellInjector is described.
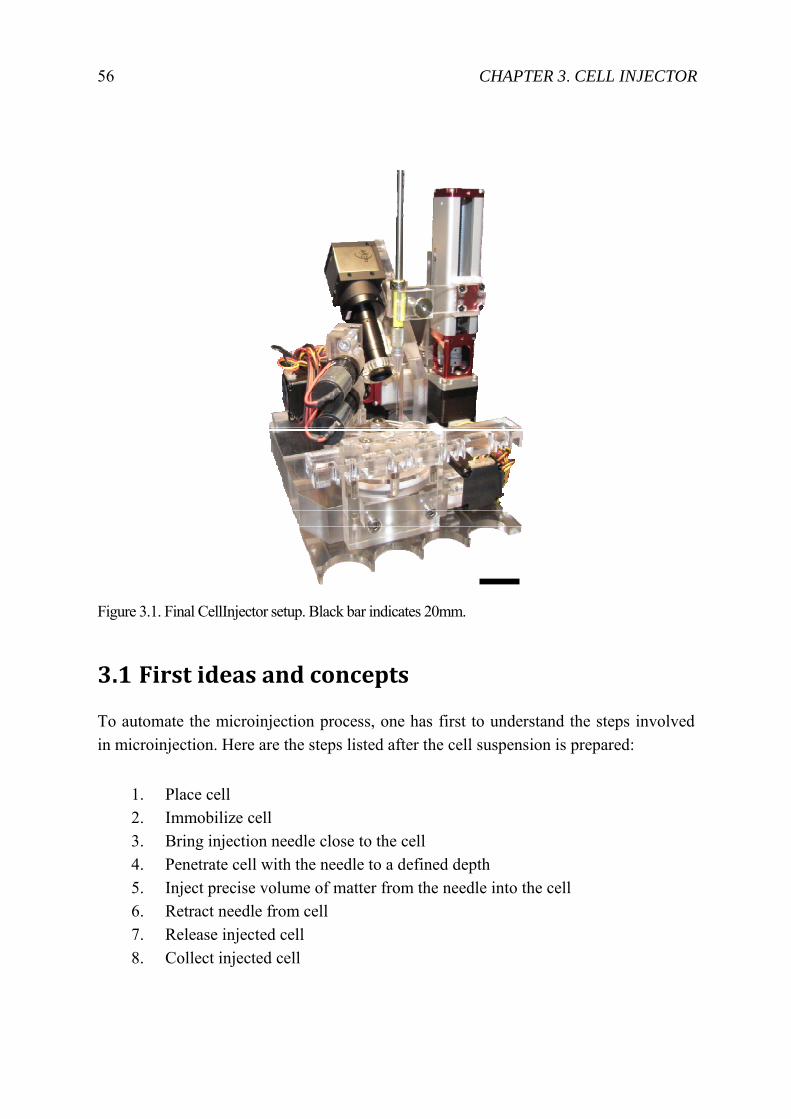
56 CHAPTER 3. CELL INJECTOR
Figure 3.1. Final CellInjector setup. Black bar indicates 20mm.
3.1 First ideas and concepts
To automate the microinjection process, one has first to understand the steps involved in microinjection. Here are the steps listed after the cell suspension is prepared:
1. Place cell 2. Immobilize cell 3. Bring injection needle close to the cell 4. Penetrate cell with the needle to a defined depth 5. Inject precise volume of matter from the needle into the cell 6. Retract needle from cell 7. Release injected cell 8. Collect injected cell
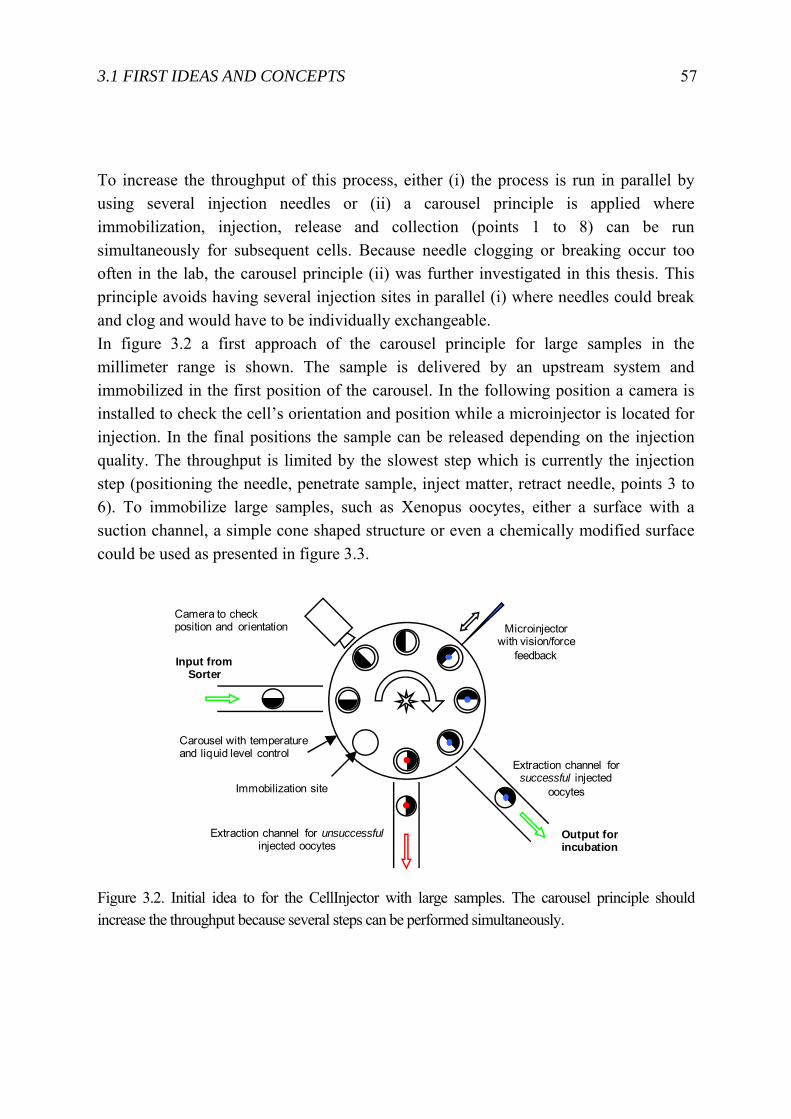
3.1 FIRST IDEAS AND CONCEPTS 57
To increase the throughput of this process, either (i) the process is run in parallel by using several injection needles or (ii) a carousel principle is applied where immobilization, injection, release and collection (points 1 to 8) can be run simultaneously for subsequent cells. Because needle clogging or breaking occur too often in the lab, the carousel principle (ii) was further investigated in this thesis. This principle avoids having several injection sites in parallel (i) where needles could break and clog and would have to be individually exchangeable. In figure 3.2 a first approach of the carousel principle for large samples in the millimeter range is shown. The sample is delivered by an upstream system and immobilized in the first position of the carousel. In the following position a camera is installed to check the cell’s orientation and position while a microinjector is located for injection. In the final positions the sample can be released depending on the injection quality. The throughput is limited by the slowest step which is currently the injection step (positioning the needle, penetrate sample, inject matter, retract needle, points 3 to 6). To immobilize large samples, such as Xenopus oocytes, either a surface with a suction channel, a simple cone shaped structure or even a chemically modified surface could be used as presented in figure 3.3.
Figure 3.2. Initial idea to for the CellInjector with large samples. The carousel principle should increase the throughput because several steps can be performed simultaneously.
Input from Sorter
Microinjectorwith vision/force
feedback
Extraction channel for successful injected
oocytes
Extraction channel for unsuccessfulinjected oocytes
Immobilization site
Output for incubation
Camera to checkposition and orientation
Carousel with temperature and liquid level control
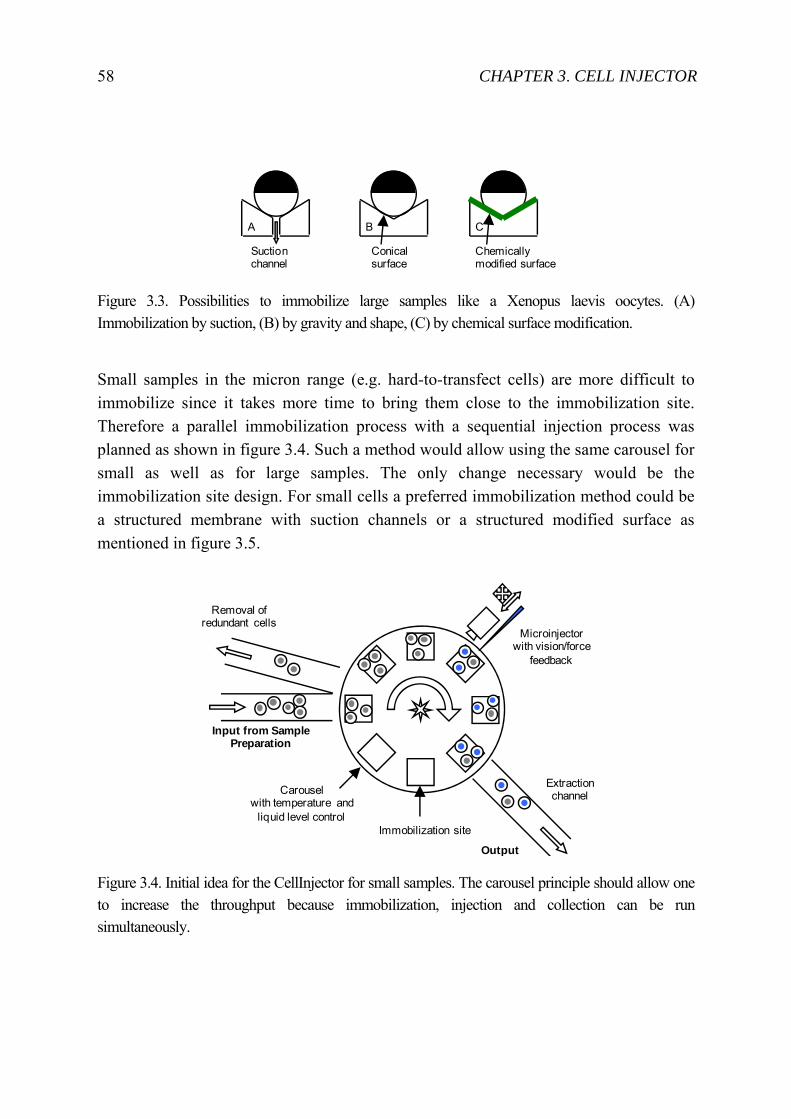
58 CHAPTER 3. CELL INJECTOR
Figure 3.3. Possibilities to immobilize large samples like a Xenopus laevis oocytes. (A) Immobilization by suction, (B) by gravity and shape, (C) by chemical surface modification.
Small samples in the micron range (e.g. hard-to-transfect cells) are more difficult to immobilize since it takes more time to bring them close to the immobilization site. Therefore a parallel immobilization process with a sequential injection process was planned as shown in figure 3.4. Such a method would allow using the same carousel for small as well as for large samples. The only change necessary would be the immobilization site design. For small cells a preferred immobilization method could be a structured membrane with suction channels or a structured modified surface as mentioned in figure 3.5.
Figure 3.4. Initial idea for the CellInjector for small samples. The carousel principle should allow one to increase the throughput because immobilization, injection and collection can be run simultaneously.
Suctionchannel
A
Conicalsurface
Chemicallymodified surface
CB
Input from Sample Preparation
Microinjectorwith vision/force
feedback
Extraction channel
Immobilization site
Carouselwith temperature and
liquid level control
Output
Removal of redundant cells
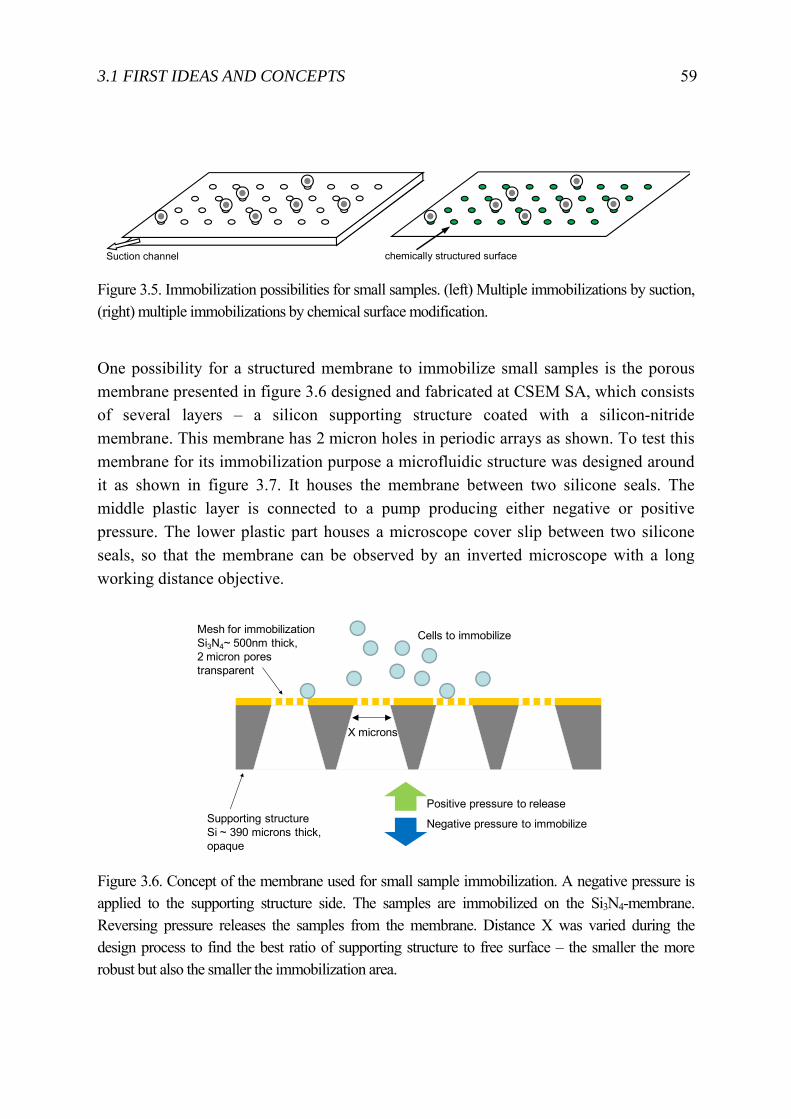
3.1 FIRST IDEAS AND CONCEPTS 59
Figure 3.5. Immobilization possibilities for small samples. (left) Multiple immobilizations by suction, (right) multiple immobilizations by chemical surface modification.
One possibility for a structured membrane to immobilize small samples is the porous membrane presented in figure 3.6 designed and fabricated at CSEM SA, which consists of several layers – a silicon supporting structure coated with a silicon-nitride membrane. This membrane has 2 micron holes in periodic arrays as shown. To test this membrane for its immobilization purpose a microfluidic structure was designed around it as shown in figure 3.7. It houses the membrane between two silicone seals. The middle plastic layer is connected to a pump producing either negative or positive pressure. The lower plastic part houses a microscope cover slip between two silicone seals, so that the membrane can be observed by an inverted microscope with a long working distance objective.
Figure 3.6. Concept of the membrane used for small sample immobilization. A negative pressure is applied to the supporting structure side. The samples are immobilized on the Si3N4-membrane. Reversing pressure releases the samples from the membrane. Distance X was varied during the design process to find the best ratio of supporting structure to free surface – the smaller the more robust but also the smaller the immobilization area.
Suction channel chemically structured surface
Mesh for immobilizationSi3N4~ 500nm thick, 2 micron pores transparent
Supporting structureSi ~ 390 microns thick, opaque
X microns
Cells to immobilize
Negative pressure to immobilize
Positive pressure to release
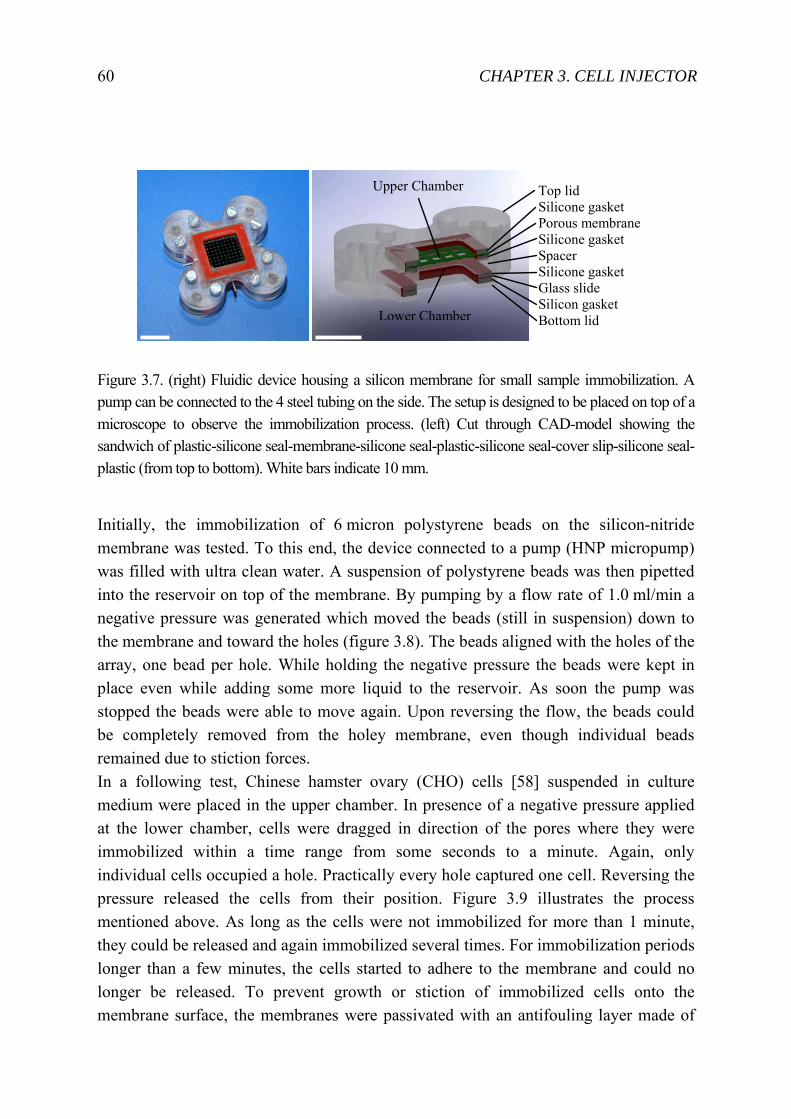
60 CHAPTER 3. CELL INJECTOR
Figure 3.7. (right) Fluidic device housing a silicon membrane for small sample immobilization. A pump can be connected to the 4 steel tubing on the side. The setup is designed to be placed on top of a microscope to observe the immobilization process. (left) Cut through CAD-model showing the sandwich of plastic-silicone seal-membrane-silicone seal-plastic-silicone seal-cover slip-silicone seal-plastic (from top to bottom). White bars indicate 10 mm.
Initially, the immobilization of 6 micron polystyrene beads on the silicon-nitride membrane was tested. To this end, the device connected to a pump (HNP micropump) was filled with ultra clean water. A suspension of polystyrene beads was then pipetted into the reservoir on top of the membrane. By pumping by a flow rate of 1.0 ml/min a negative pressure was generated which moved the beads (still in suspension) down to the membrane and toward the holes (figure 3.8). The beads aligned with the holes of the array, one bead per hole. While holding the negative pressure the beads were kept in place even while adding some more liquid to the reservoir. As soon the pump was stopped the beads were able to move again. Upon reversing the flow, the beads could be completely removed from the holey membrane, even though individual beads remained due to stiction forces. In a following test, Chinese hamster ovary (CHO) cells [58] suspended in culture medium were placed in the upper chamber. In presence of a negative pressure applied at the lower chamber, cells were dragged in direction of the pores where they were immobilized within a time range from some seconds to a minute. Again, only individual cells occupied a hole. Practically every hole captured one cell. Reversing the pressure released the cells from their position. Figure 3.9 illustrates the process mentioned above. As long as the cells were not immobilized for more than 1 minute, they could be released and again immobilized several times. For immobilization periods longer than a few minutes, the cells started to adhere to the membrane and could no longer be released. To prevent growth or stiction of immobilized cells onto the membrane surface, the membranes were passivated with an antifouling layer made of
Top lid Silicone gasket Porous membrane Silicone gasket Spacer Silicone gasket Glass slide Silicon gasket Bottom lid
Upper Chamber
Lower Chamber
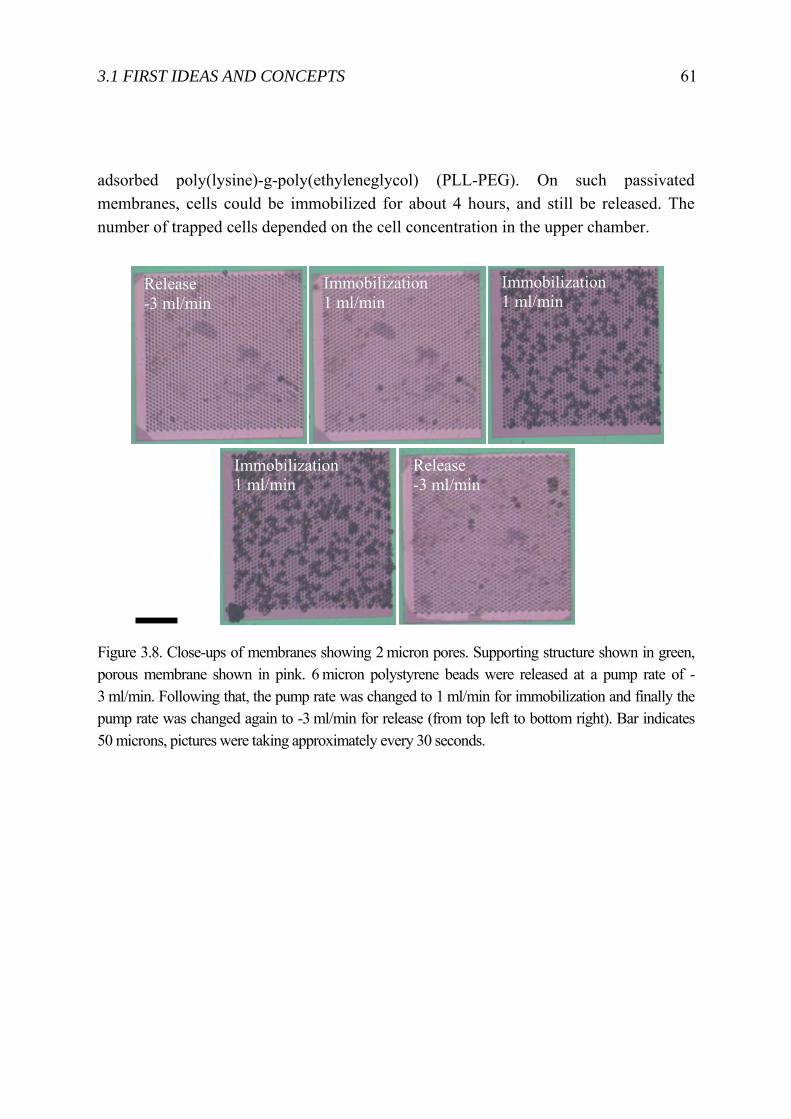
3.1 FIRST IDEAS AND CONCEPTS 61
adsorbed poly(lysine)-g-poly(ethyleneglycol) (PLL-PEG). On such passivated membranes, cells could be immobilized for about 4 hours, and still be released. The number of trapped cells depended on the cell concentration in the upper chamber.
Figure 3.8. Close-ups of membranes showing 2 micron pores. Supporting structure shown in green, porous membrane shown in pink. 6 micron polystyrene beads were released at a pump rate of -3 ml/min. Following that, the pump rate was changed to 1 ml/min for immobilization and finally the pump rate was changed again to -3 ml/min for release (from top left to bottom right). Bar indicates 50 microns, pictures were taking approximately every 30 seconds.
Release -3 ml/min
Immobilization 1 ml/min
Immobilization 1 ml/min
Immobilization 1 ml/min
Release -3 ml/min
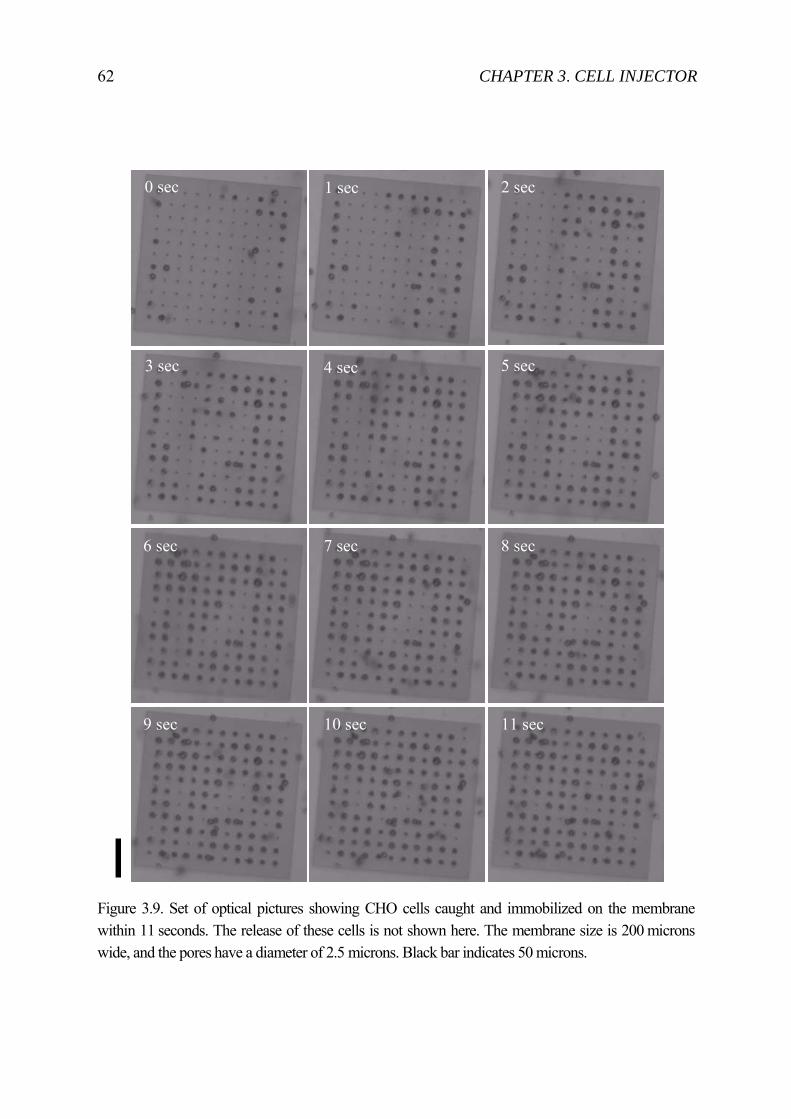
62 CHAPTER 3. CELL INJECTOR
Figure 3.9. Set of optical pictures showing CHO cells caught and immobilized on the membrane within 11 seconds. The release of these cells is not shown here. The membrane size is 200 microns wide, and the pores have a diameter of 2.5 microns. Black bar indicates 50 microns.
0 sec 1 sec 2 sec
3 sec 4 sec 5 sec
6 sec 7 sec 8 sec
9 sec 10 sec 11 sec
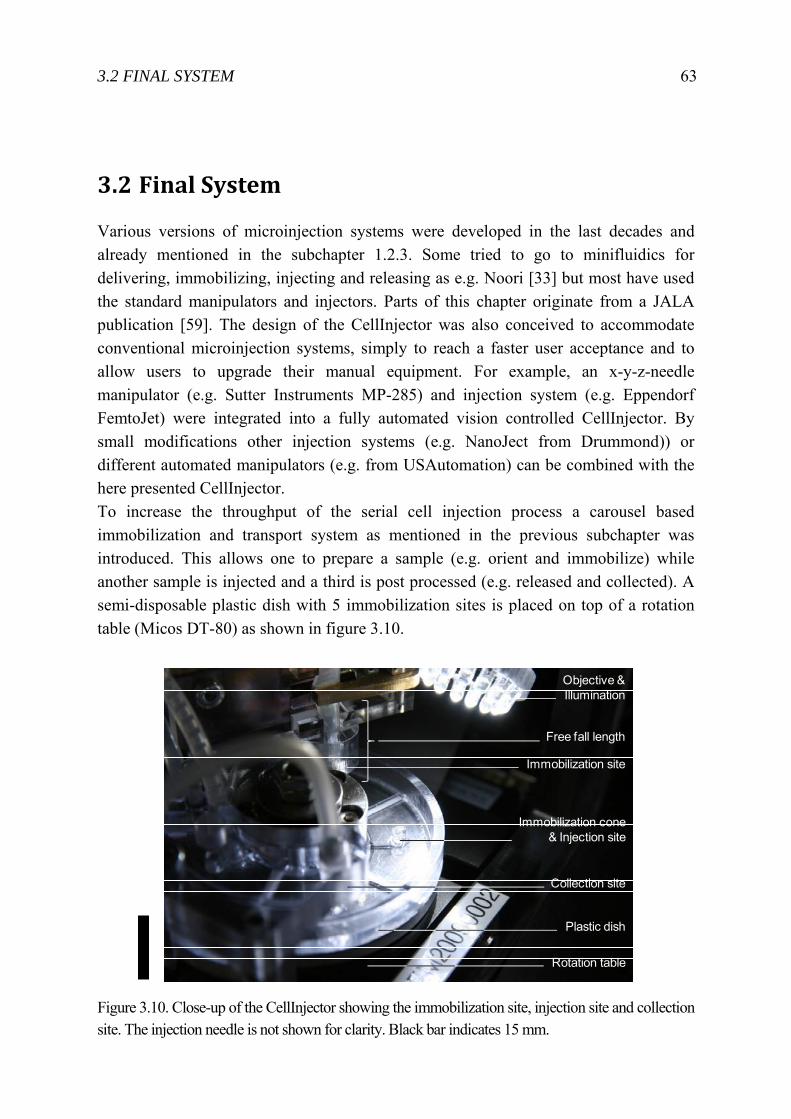
3.2 FINAL SYSTEM 63
3.2 Final System
Various versions of microinjection systems were developed in the last decades and already mentioned in the subchapter 1.2.3. Some tried to go to minifluidics for delivering, immobilizing, injecting and releasing as e.g. Noori [33] but most have used the standard manipulators and injectors. Parts of this chapter originate from a JALA publication [59]. The design of the CellInjector was also conceived to accommodate conventional microinjection systems, simply to reach a faster user acceptance and to allow users to upgrade their manual equipment. For example, an x-y-z-needle manipulator (e.g. Sutter Instruments MP-285) and injection system (e.g. Eppendorf FemtoJet) were integrated into a fully automated vision controlled CellInjector. By small modifications other injection systems (e.g. NanoJect from Drummond)) or different automated manipulators (e.g. from USAutomation) can be combined with the here presented CellInjector. To increase the throughput of the serial cell injection process a carousel based immobilization and transport system as mentioned in the previous subchapter was introduced. This allows one to prepare a sample (e.g. orient and immobilize) while another sample is injected and a third is post processed (e.g. released and collected). A semi-disposable plastic dish with 5 immobilization sites is placed on top of a rotation table (Micos DT-80) as shown in figure 3.10.
Figure 3.10. Close-up of the CellInjector showing the immobilization site, injection site and collection site. The injection needle is not shown for clarity. Black bar indicates 15 mm.
Objective &Illumination
Free fall length
Immobilization site
Plastic dish
Collection site
Immobilization cone& Injection site
Rotation table
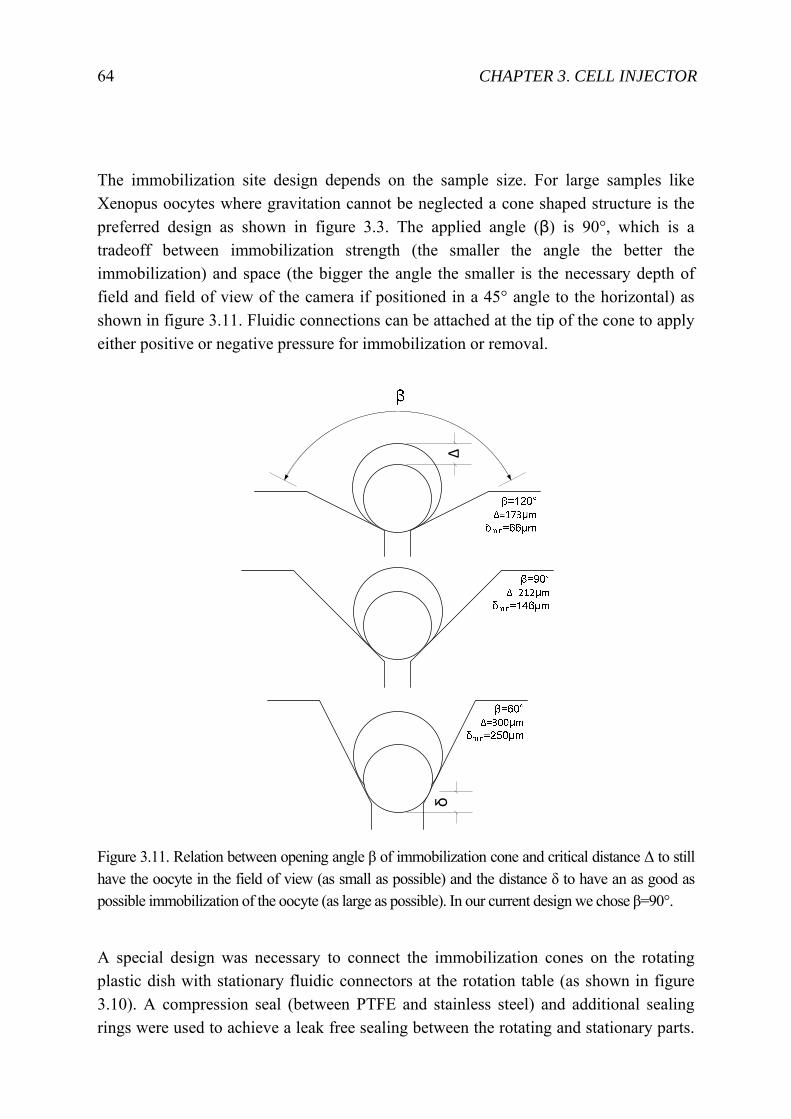
64 CHAPTER 3. CELL INJECTOR
The immobilization site design depends on the sample size. For large samples like Xenopus oocytes where gravitation cannot be neglected a cone shaped structure is the preferred design as shown in figure 3.3. The applied angle (β) is 90°, which is a tradeoff between immobilization strength (the smaller the angle the better the immobilization) and space (the bigger the angle the smaller is the necessary depth of field and field of view of the camera if positioned in a 45° angle to the horizontal) as shown in figure 3.11. Fluidic connections can be attached at the tip of the cone to apply either positive or negative pressure for immobilization or removal.
Figure 3.11. Relation between opening angle β of immobilization cone and critical distance Δ to still have the oocyte in the field of view (as small as possible) and the distance δ to have an as good as possible immobilization of the oocyte (as large as possible). In our current design we chose β=90°.
A special design was necessary to connect the immobilization cones on the rotating plastic dish with stationary fluidic connectors at the rotation table (as shown in figure 3.10). A compression seal (between PTFE and stainless steel) and additional sealing rings were used to achieve a leak free sealing between the rotating and stationary parts.
Δδ
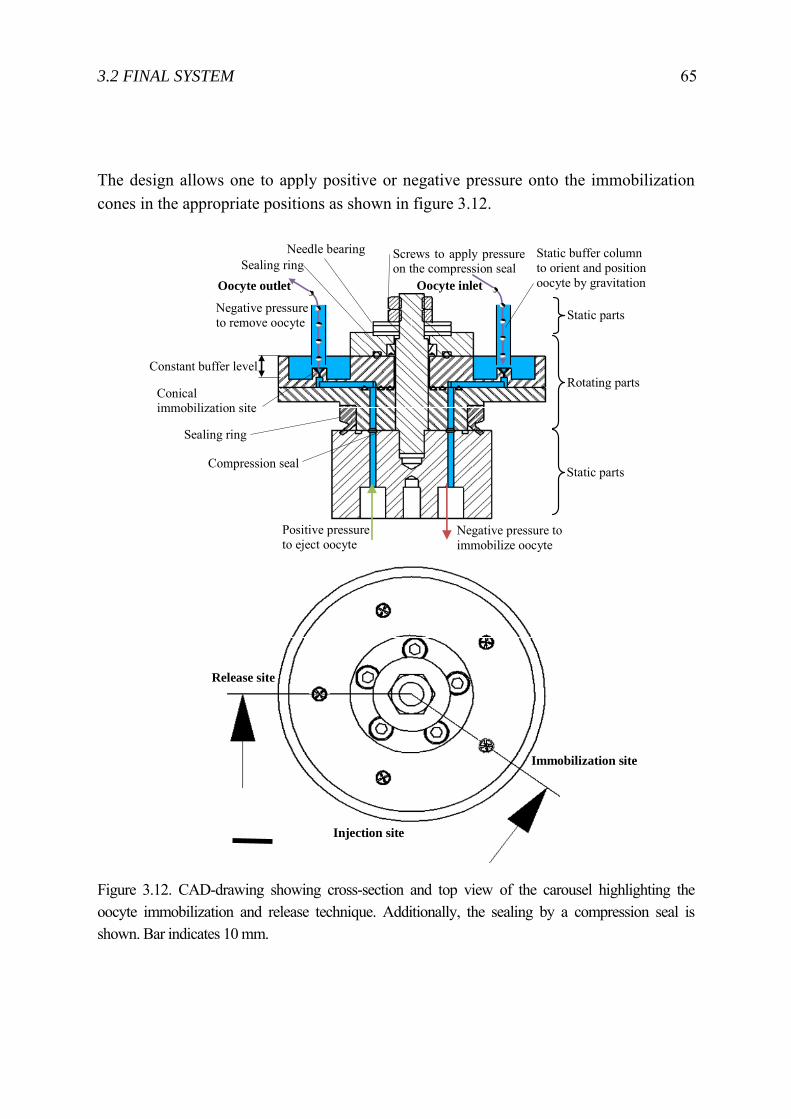
3.2 FINAL SYSTEM 65
The design allows one to apply positive or negative pressure onto the immobilization cones in the appropriate positions as shown in figure 3.12.
Figure 3.12. CAD-drawing showing cross-section and top view of the carousel highlighting the oocyte immobilization and release technique. Additionally, the sealing by a compression seal is shown. Bar indicates 10 mm.
Oocyte inletOocyte outlet
Negative pressure to remove oocyte
Needle bearing Screws to apply pressure on the compression seal
Positive pressure to eject oocyte
Negative pressure to immobilize oocyte
Compression seal
Constant buffer level
Conical immobilization site
Sealing ring
Sealing ring
Immobilization site
Injection site
Release site
Static buffer column to orient and position oocyte by gravitation
Static parts
Static parts
Rotating parts
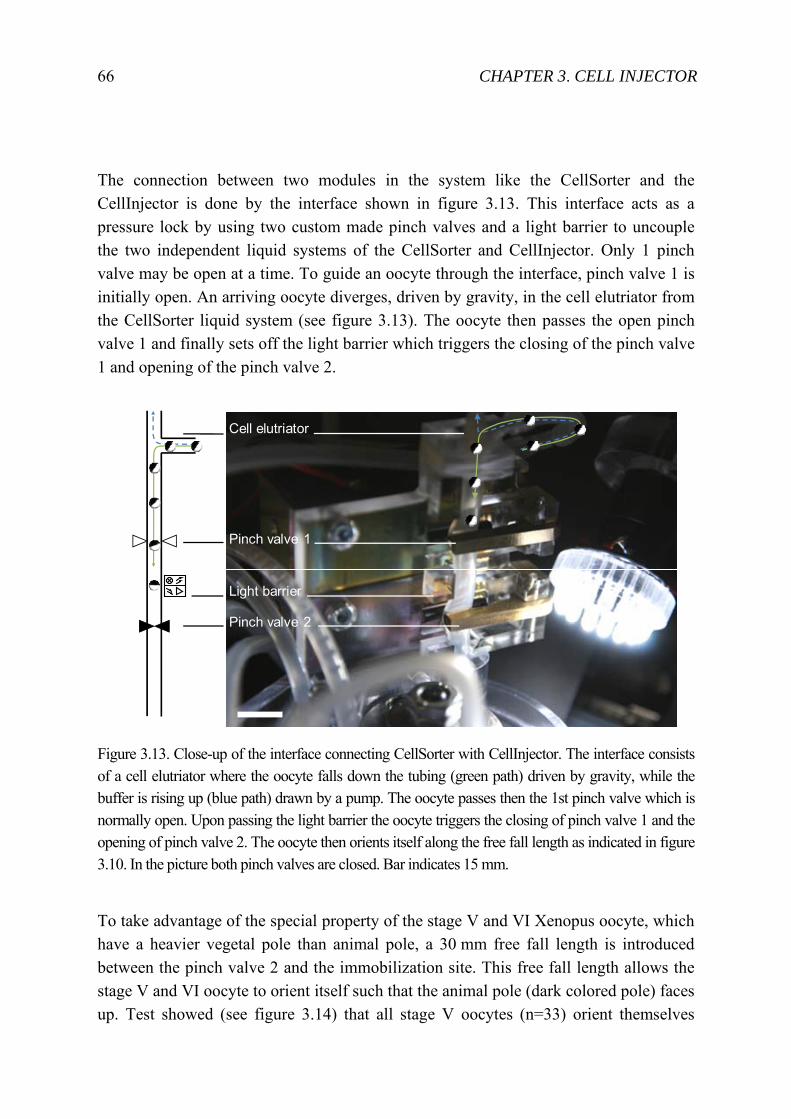
66 CHAPTER 3. CELL INJECTOR
The connection between two modules in the system like the CellSorter and the CellInjector is done by the interface shown in figure 3.13. This interface acts as a pressure lock by using two custom made pinch valves and a light barrier to uncouple the two independent liquid systems of the CellSorter and CellInjector. Only 1 pinch valve may be open at a time. To guide an oocyte through the interface, pinch valve 1 is initially open. An arriving oocyte diverges, driven by gravity, in the cell elutriator from the CellSorter liquid system (see figure 3.13). The oocyte then passes the open pinch valve 1 and finally sets off the light barrier which triggers the closing of the pinch valve 1 and opening of the pinch valve 2.
Figure 3.13. Close-up of the interface connecting CellSorter with CellInjector. The interface consists of a cell elutriator where the oocyte falls down the tubing (green path) driven by gravity, while the buffer is rising up (blue path) drawn by a pump. The oocyte passes then the 1st pinch valve which is normally open. Upon passing the light barrier the oocyte triggers the closing of pinch valve 1 and the opening of pinch valve 2. The oocyte then orients itself along the free fall length as indicated in figure 3.10. In the picture both pinch valves are closed. Bar indicates 15 mm.
To take advantage of the special property of the stage V and VI Xenopus oocyte, which have a heavier vegetal pole than animal pole, a 30 mm free fall length is introduced between the pinch valve 2 and the immobilization site. This free fall length allows the stage V and VI oocyte to orient itself such that the animal pole (dark colored pole) faces up. Test showed (see figure 3.14) that all stage V oocytes (n=33) orient themselves
Cell elutriator
Pinch valve 1
Pinch valve 2
Light barrier
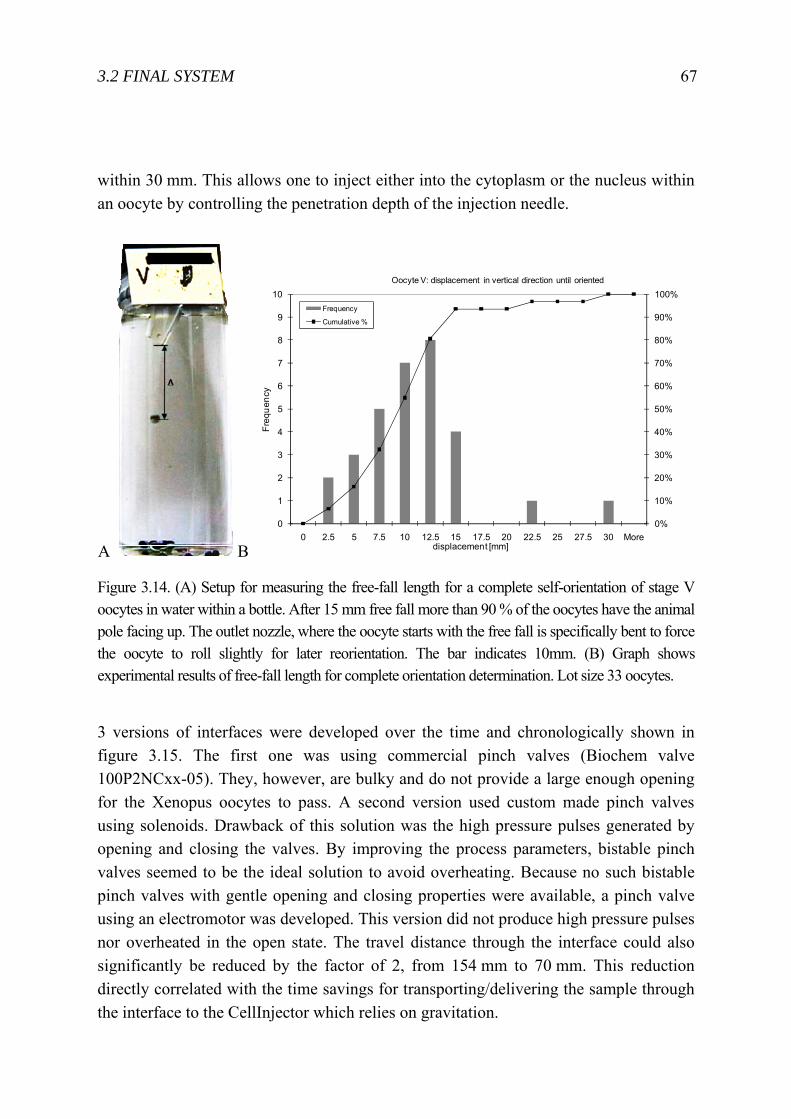
3.2 FINAL SYSTEM 67
within 30 mm. This allows one to inject either into the cytoplasm or the nucleus within an oocyte by controlling the penetration depth of the injection needle.
A B
Figure 3.14. (A) Setup for measuring the free-fall length for a complete self-orientation of stage V oocytes in water within a bottle. After 15 mm free fall more than 90 % of the oocytes have the animal pole facing up. The outlet nozzle, where the oocyte starts with the free fall is specifically bent to force the oocyte to roll slightly for later reorientation. The bar indicates 10mm. (B) Graph shows experimental results of free-fall length for complete orientation determination. Lot size 33 oocytes.
3 versions of interfaces were developed over the time and chronologically shown in figure 3.15. The first one was using commercial pinch valves (Biochem valve 100P2NCxx-05). They, however, are bulky and do not provide a large enough opening for the Xenopus oocytes to pass. A second version used custom made pinch valves using solenoids. Drawback of this solution was the high pressure pulses generated by opening and closing the valves. By improving the process parameters, bistable pinch valves seemed to be the ideal solution to avoid overheating. Because no such bistable pinch valves with gentle opening and closing properties were available, a pinch valve using an electromotor was developed. This version did not produce high pressure pulses nor overheated in the open state. The travel distance through the interface could also significantly be reduced by the factor of 2, from 154 mm to 70 mm. This reduction directly correlated with the time savings for transporting/delivering the sample through the interface to the CellInjector which relies on gravitation.
0%
10%
20%
30%
40%
50%
60%
70%
80%
90%
100%
0
1
2
3
4
5
6
7
8
9
10
0 2.5 5 7.5 10 12.5 15 17.5 20 22.5 25 27.5 30 More
Freq
uenc
y
displacement [mm]
Oocyte V: displacement in vertical direction until oriented
Frequency
Cumulative %
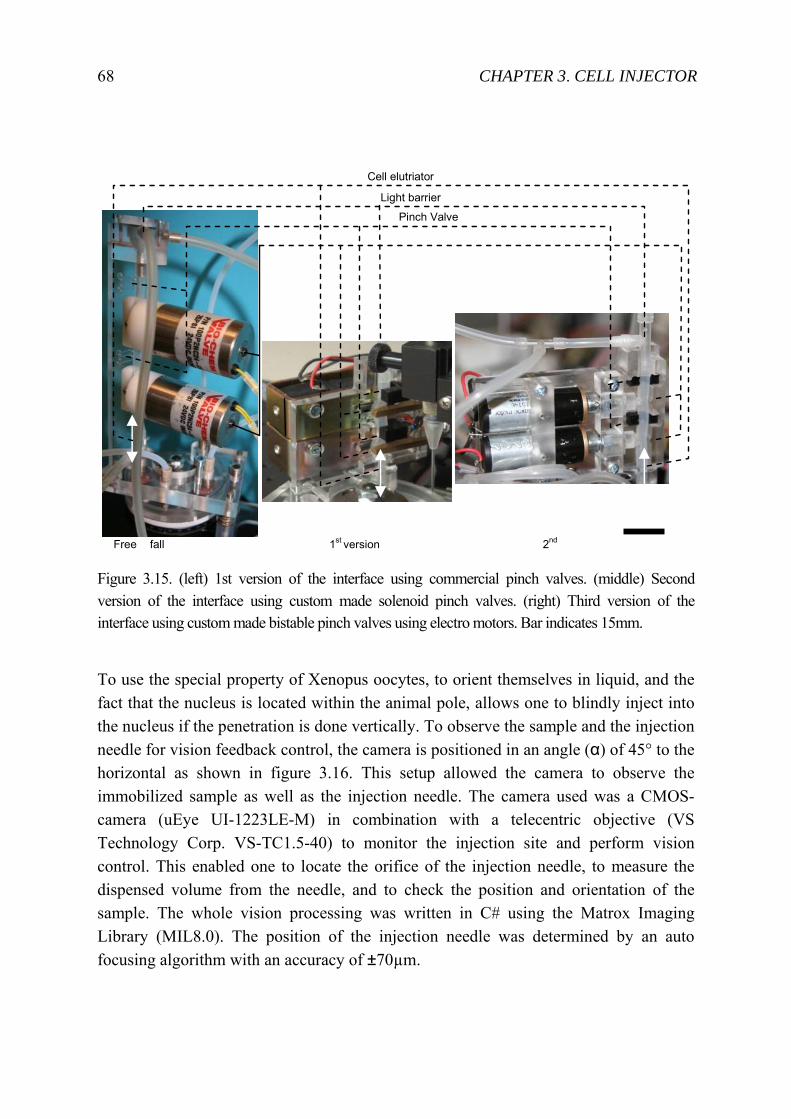
68 CHAPTER 3. CELL INJECTOR
Figure 3.15. (left) 1st version of the interface using commercial pinch valves. (middle) Second version of the interface using custom made solenoid pinch valves. (right) Third version of the interface using custom made bistable pinch valves using electro motors. Bar indicates 15mm.
To use the special property of Xenopus oocytes, to orient themselves in liquid, and the fact that the nucleus is located within the animal pole, allows one to blindly inject into the nucleus if the penetration is done vertically. To observe the sample and the injection needle for vision feedback control, the camera is positioned in an angle (α) of 45° to the horizontal as shown in figure 3.16. This setup allowed the camera to observe the immobilized sample as well as the injection needle. The camera used was a CMOS-camera (uEye UI-1223LE-M) in combination with a telecentric objective (VS Technology Corp. VS-TC1.5-40) to monitor the injection site and perform vision control. This enabled one to locate the orifice of the injection needle, to measure the dispensed volume from the needle, and to check the position and orientation of the sample. The whole vision processing was written in C# using the Matrox Imaging Library (MIL8.0). The position of the injection needle was determined by an auto focusing algorithm with an accuracy of ±70µm.
9 secPinch Valve
Light barrier
Cell elutriator
Free fall 1st version 2nd
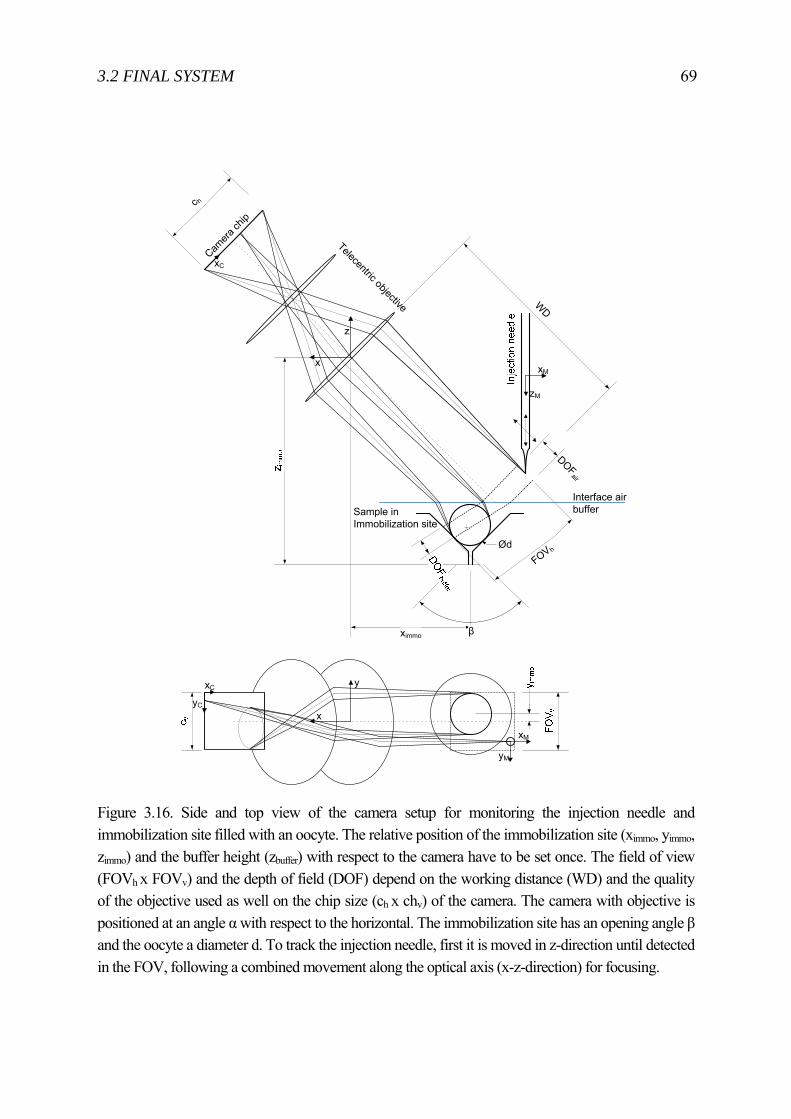
3.2 FINAL SYSTEM 69
Figure 3.16. Side and top view of the camera setup for monitoring the injection needle and immobilization site filled with an oocyte. The relative position of the immobilization site (ximmo, yimmo, zimmo) and the buffer height (zbuffer) with respect to the camera have to be set once. The field of view (FOVh x FOVv) and the depth of field (DOF) depend on the working distance (WD) and the quality of the objective used as well on the chip size (ch x chv) of the camera. The camera with objective is positioned at an angle α with respect to the horizontal. The immobilization site has an opening angle β and the oocyte a diameter d. To track the injection needle, first it is moved in z-direction until detected in the FOV, following a combined movement along the optical axis (x-z-direction) for focusing.
ximmo
Ød
β
DOFair
WD
FOVh
c h
Telecentric objective
Camera
chip
Interface airbuffer
x
z
x
y
xM
zM
xM
yM
yC
xC
xC
Sample inImmobilization site

Chapter 4
Applications
In this chapter the modular flexibility of the earlier described modules CellSorter and CellInjector is shown by two specific applications. Both applications originate from the demand of lab personal to automated and improve the currently manual processes. The Liebel lab at Karlsruhe Institute of Technology asked for an automated placing of zebrafish embryos into multi-well plates for later toxicity testing. Another demand came from the company Biopredic International (Rennes, France) for automated microinjection of Xenopus laevis oocytes for drug development tests. Both applications were tested in the particular labs and the results were individually published [48, 59] in the Journal of the Association for Laboratory Automation (JALA). The following two sub-chapters outline these two tested systems including the results.
4.1 ZebraFactor
This chapter originates partially from the related publication [48] in JALA. Manipulation of single cells or single organisms is a fast growing market not least because the REACH initiative was started in 2007. The goal of the REACH initiative is to test each compound (from which more than 1 ton is manufactured or imported in Europe) for its toxicity [60]. At the same time, the number of vertebrate mammals used for toxicity testing should be reduced. These two facts call for high throughput and ethically justifiable toxicity screening methods. In recent years, fertilized zebrafish eggs have been established as a model system and are accepted as an alternative to mammalian testing [61-63]. Another large advantage is that fertilized zebrafish eggs up to 5 days after fertilization are not subject to the same regulatory requirements as adult fish and mammals. Further advantages are the egg’s transparency and the fact that development occurs entirely outside the mother’s body. Finally, zebrafish facilities are relatively easy to maintain and due to the size of an egg (diameter ~ 1.6 mm[39], see figure 1.10), dispensing them in up to 384-well plates is possible [64]. In current toxicity tests, fertilized zebrafish eggs are dispensed into multi-well plates. Test compounds with different dilutions are pipetted to the individual fertilized
72 CHAPTER 4. APPLICATIONS
zebrafish egg in the single wells. The multi-well plate is then periodically imaged and analyzed [65]. The large amount of data is locally or remotely stored and analyzed. Finally, fast search engines allow one to retrieve the collected data. In summary, a complete line-up of systems and techniques from different disciplines is required to perform a low cost high throughput toxicity test as shown below:
1. Inexpensive and efficient zebrafish facility – to get a large amount of eggs 2. Inexpensive sorting system – to place individual eggs into a multi-well plate 3. Inexpensive lab robotic system – to handle the plates and deliver test
compounds into wells 4. Powerful automated imaging system – to periodically observe the eggs
quality 5. Efficient data storage / handling 6. Efficient image analysis system 7. Efficient search algorithms – to retrieve results
Of the list above, many of the items listed are available. More specifically, inexpensive, efficient zebrafish facilities can be established and maintained by following certain guidelines [66]. Lab robots and powerful automated imaging system are commercially available even though they are still expensive. Efficient data storage and data distribution is possible but also an expensive task. Systems for image and visualization analysis [67] are available, their performance, however, corresponds to the available computer power. There are also several search engines available like Harvester [68], which combine results from several other search engines and databases. The main remaining bottleneck is the inexpensive sorting system. In the following chapter the state-of-the-art zebrafish embryo sorting is presented. Afterwards the ZebraFactor to automatically perform this task is outlined.
4.1.1 Stateoftheart zebrafish embryo “sorting”
Currently, most of the zebrafish eggs are placed into well plates manually. Two skilled technicians can fill 30 96-well plates in about 3 hours which corresponds to 12 minutes per plate on the average. Unfortunately, this highly monotonous task is prone to errors and can typically not be performed by a single person for more than 3 hours. Another example comes from Stern et al who screened about 16000 compounds in 16 weeks, while 5000 larvae were collected weekly. They were quality controlled and then 20 larvae were manually transferred by a chemical spatula in each well of a 48-well plate
4.1 ZEBRAFACTOR 73
[69]. Several attempts have been made to automate the singularization of zebrafish eggs or larvae into multi-well plates. A possibility is to use a robotic pick and place approach for sorting eggs from a petri dish into the well plate. One such system is the CellBot (Fully Automated Single Cell Handling Platform8, see also subchapter 2.1.1) from CSEM, where a delta robot, capable of several cycles per second, is combined with a fully motorized inverted light microscope (iMic from Till Photonics, Germany). The robot and the microscope move above and beneath the sample platform, which is stationary. Because the petri dish and the well plate are never moved during the sorting process, this arrangement prevents sloshing of the sample liquid. The inverted light microscope scans the petri dish and checks for eggs, if one is found, this egg is removed by a pipette tool attached to the delta robot and placed into the well plate. Unfortunately, such a pick and place system is costly, rather slow and uses a large portion of lab space. Further options are the COPAS and BioSorter (both from Union Biometrica, US), which are specially designed for sorting of large biological entities (up to 1500 microns). These systems are capable of singularizing zebrafish eggs into 96-well plates in about 2 minutes [70]. However, these systems were designed for high throughput flow cytometry and are therefore equipped with costly optics, not necessary for simply singularizing large entities into multi-well plates. Additionally, both systems are not capable of checking the quality of the entities sorted, such as shape, specific features, or damage.
8 http://www.csem.ch/docs/Show.aspx?id=7824
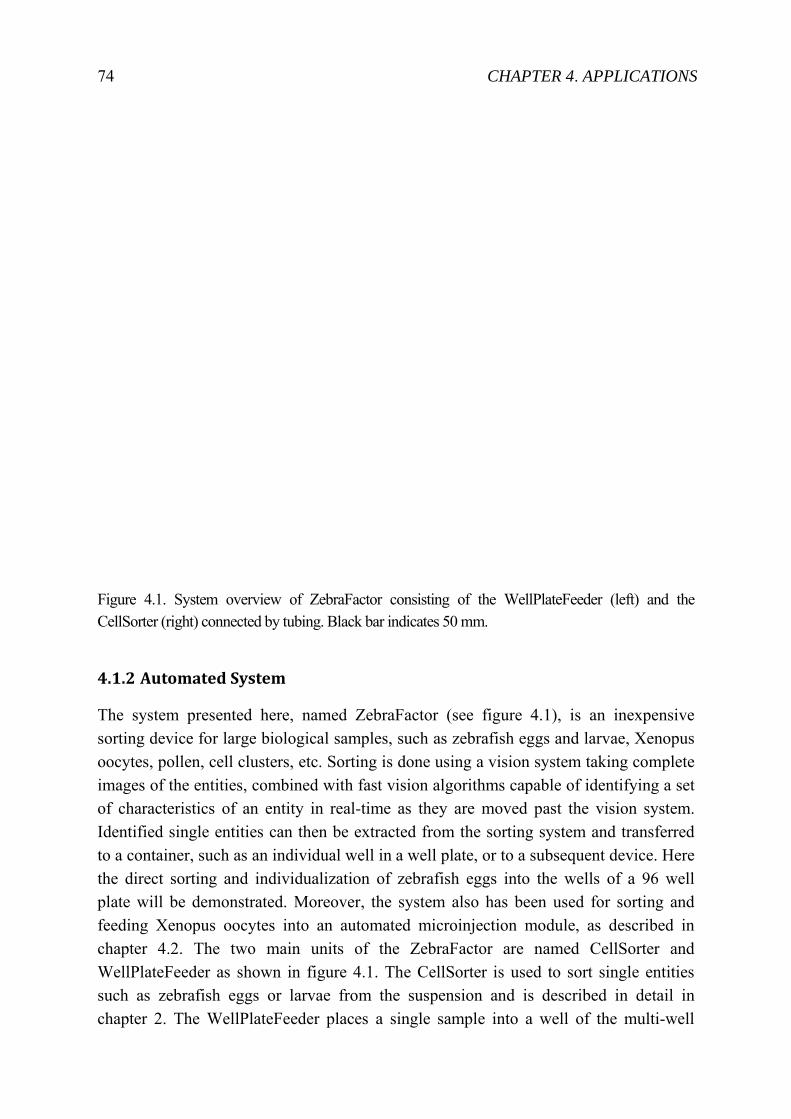
74 CHAPTER 4. APPLICATIONS
Figure 4.1. System overview of ZebraFactor consisting of the WellPlateFeeder (left) and the CellSorter (right) connected by tubing. Black bar indicates 50 mm.
4.1.2 Automated System
The system presented here, named ZebraFactor (see figure 4.1), is an inexpensive sorting device for large biological samples, such as zebrafish eggs and larvae, Xenopus oocytes, pollen, cell clusters, etc. Sorting is done using a vision system taking complete images of the entities, combined with fast vision algorithms capable of identifying a set of characteristics of an entity in real-time as they are moved past the vision system. Identified single entities can then be extracted from the sorting system and transferred to a container, such as an individual well in a well plate, or to a subsequent device. Here the direct sorting and individualization of zebrafish eggs into the wells of a 96 well plate will be demonstrated. Moreover, the system also has been used for sorting and feeding Xenopus oocytes into an automated microinjection module, as described in chapter 4.2. The two main units of the ZebraFactor are named CellSorter and WellPlateFeeder as shown in figure 4.1. The CellSorter is used to sort single entities such as zebrafish eggs or larvae from the suspension and is described in detail in chapter 2. The WellPlateFeeder places a single sample into a well of the multi-well
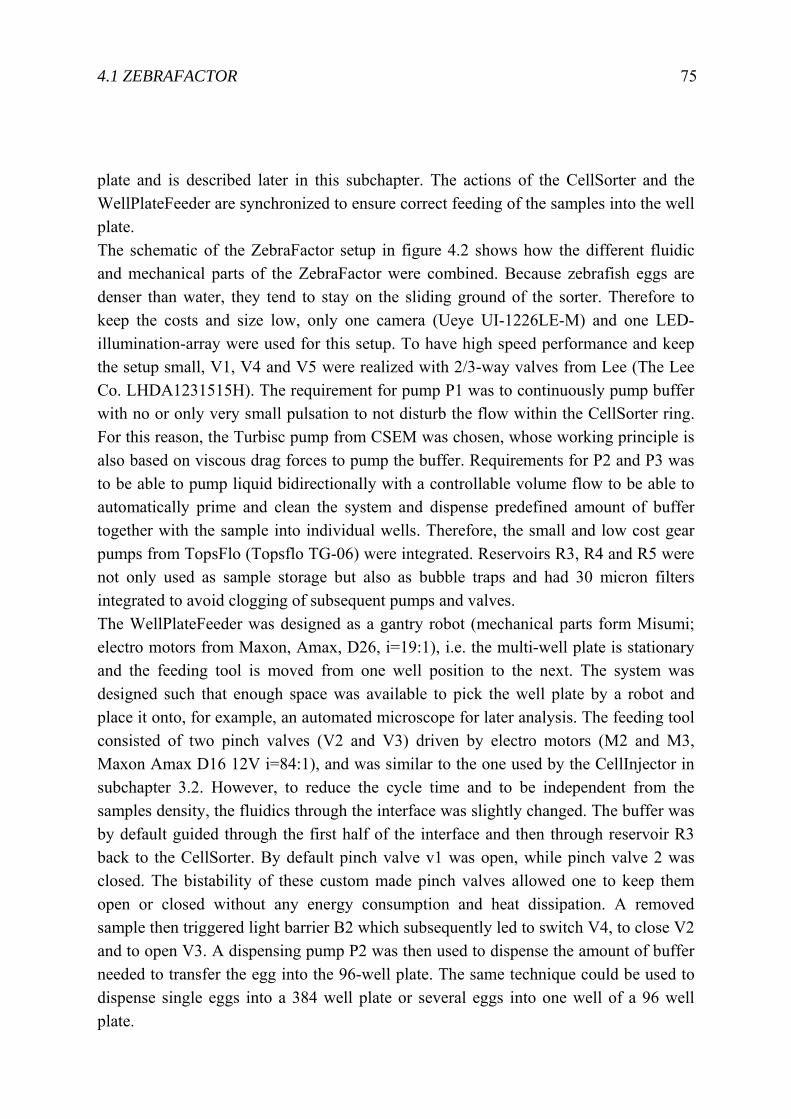
4.1 ZEBRAFACTOR 75
plate and is described later in this subchapter. The actions of the CellSorter and the WellPlateFeeder are synchronized to ensure correct feeding of the samples into the well plate. The schematic of the ZebraFactor setup in figure 4.2 shows how the different fluidic and mechanical parts of the ZebraFactor were combined. Because zebrafish eggs are denser than water, they tend to stay on the sliding ground of the sorter. Therefore to keep the costs and size low, only one camera (Ueye UI-1226LE-M) and one LED-illumination-array were used for this setup. To have high speed performance and keep the setup small, V1, V4 and V5 were realized with 2/3-way valves from Lee (The Lee Co. LHDA1231515H). The requirement for pump P1 was to continuously pump buffer with no or only very small pulsation to not disturb the flow within the CellSorter ring. For this reason, the Turbisc pump from CSEM was chosen, whose working principle is also based on viscous drag forces to pump the buffer. Requirements for P2 and P3 was to be able to pump liquid bidirectionally with a controllable volume flow to be able to automatically prime and clean the system and dispense predefined amount of buffer together with the sample into individual wells. Therefore, the small and low cost gear pumps from TopsFlo (Topsflo TG-06) were integrated. Reservoirs R3, R4 and R5 were not only used as sample storage but also as bubble traps and had 30 micron filters integrated to avoid clogging of subsequent pumps and valves. The WellPlateFeeder was designed as a gantry robot (mechanical parts form Misumi; electro motors from Maxon, Amax, D26, i=19:1), i.e. the multi-well plate is stationary and the feeding tool is moved from one well position to the next. The system was designed such that enough space was available to pick the well plate by a robot and place it onto, for example, an automated microscope for later analysis. The feeding tool consisted of two pinch valves (V2 and V3) driven by electro motors (M2 and M3, Maxon Amax D16 12V i=84:1), and was similar to the one used by the CellInjector in subchapter 3.2. However, to reduce the cycle time and to be independent from the samples density, the fluidics through the interface was slightly changed. The buffer was by default guided through the first half of the interface and then through reservoir R3 back to the CellSorter. By default pinch valve v1 was open, while pinch valve 2 was closed. The bistability of these custom made pinch valves allowed one to keep them open or closed without any energy consumption and heat dissipation. A removed sample then triggered light barrier B2 which subsequently led to switch V4, to close V2 and to open V3. A dispensing pump P2 was then used to dispense the amount of buffer needed to transfer the egg into the 96-well plate. The same technique could be used to dispense single eggs into a 384 well plate or several eggs into one well of a 96 well plate.
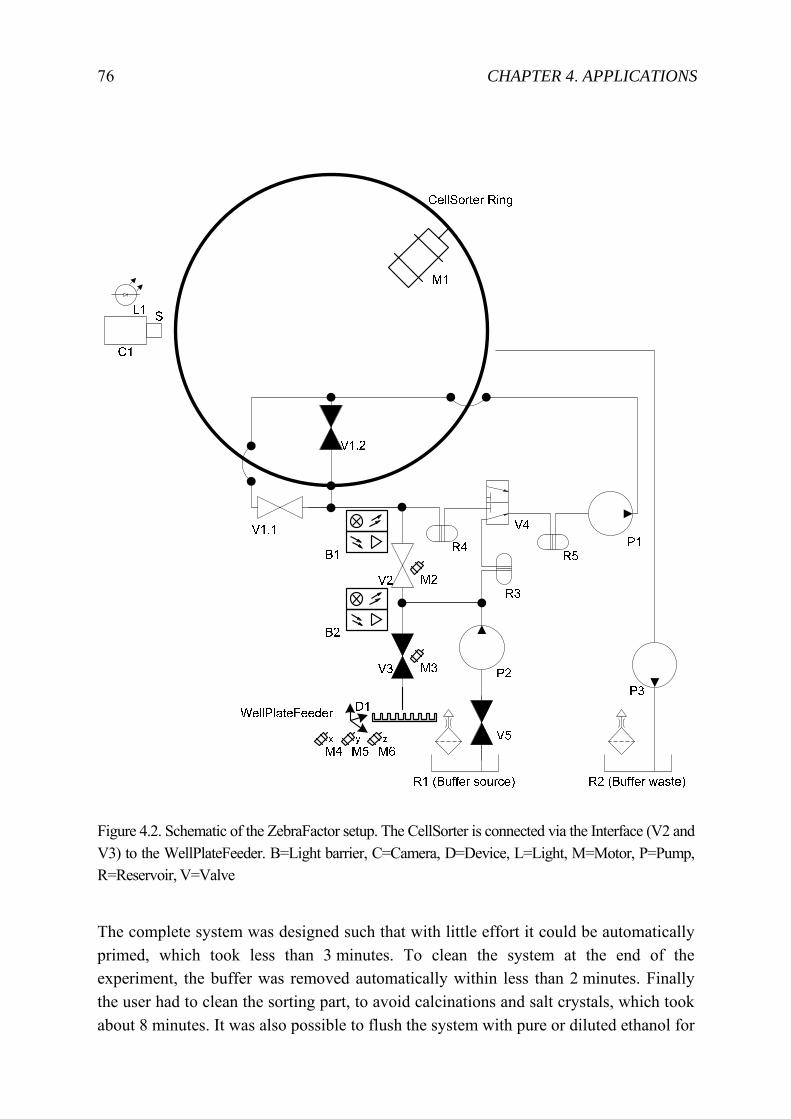
76 CHAPTER 4. APPLICATIONS
Figure 4.2. Schematic of the ZebraFactor setup. The CellSorter is connected via the Interface (V2 and V3) to the WellPlateFeeder. B=Light barrier, C=Camera, D=Device, L=Light, M=Motor, P=Pump, R=Reservoir, V=Valve
The complete system was designed such that with little effort it could be automatically primed, which took less than 3 minutes. To clean the system at the end of the experiment, the buffer was removed automatically within less than 2 minutes. Finally the user had to clean the sorting part, to avoid calcinations and salt crystals, which took about 8 minutes. It was also possible to flush the system with pure or diluted ethanol for
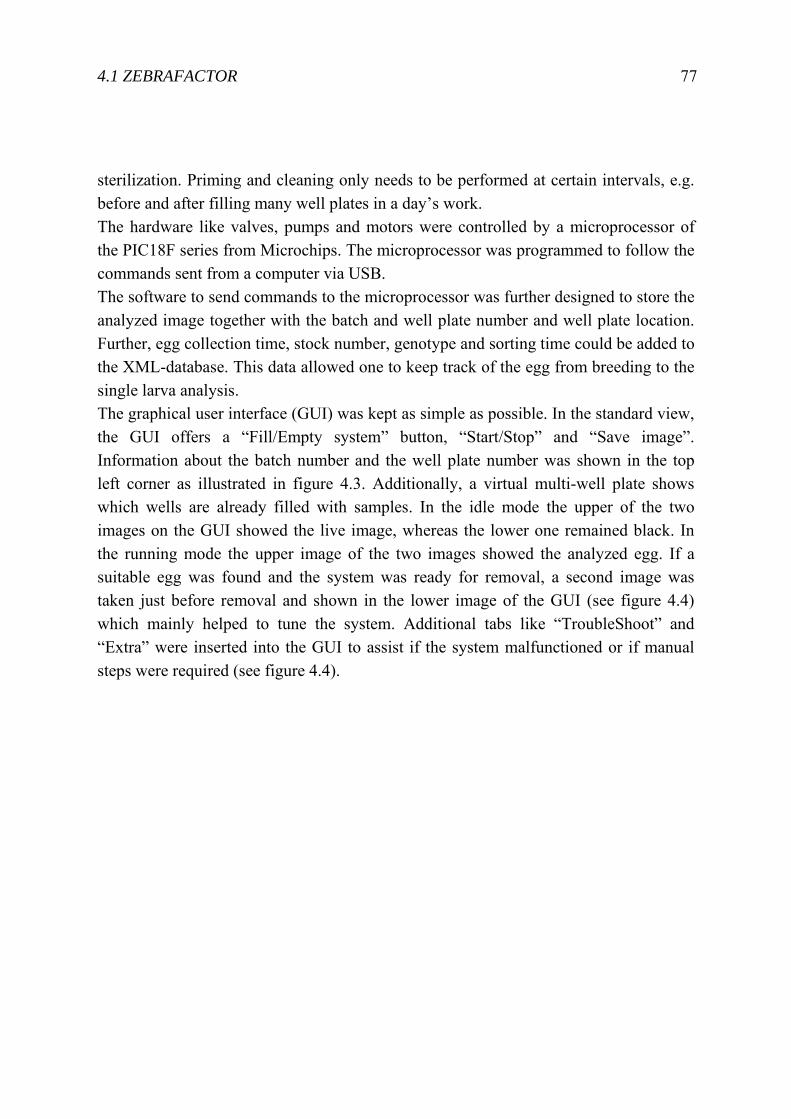
4.1 ZEBRAFACTOR 77
sterilization. Priming and cleaning only needs to be performed at certain intervals, e.g. before and after filling many well plates in a day’s work. The hardware like valves, pumps and motors were controlled by a microprocessor of the PIC18F series from Microchips. The microprocessor was programmed to follow the commands sent from a computer via USB. The software to send commands to the microprocessor was further designed to store the analyzed image together with the batch and well plate number and well plate location. Further, egg collection time, stock number, genotype and sorting time could be added to the XML-database. This data allowed one to keep track of the egg from breeding to the single larva analysis. The graphical user interface (GUI) was kept as simple as possible. In the standard view, the GUI offers a “Fill/Empty system” button, “Start/Stop” and “Save image”. Information about the batch number and the well plate number was shown in the top left corner as illustrated in figure 4.3. Additionally, a virtual multi-well plate shows which wells are already filled with samples. In the idle mode the upper of the two images on the GUI showed the live image, whereas the lower one remained black. In the running mode the upper image of the two images showed the analyzed egg. If a suitable egg was found and the system was ready for removal, a second image was taken just before removal and shown in the lower image of the GUI (see figure 4.4) which mainly helped to tune the system. Additional tabs like “TroubleShoot” and “Extra” were inserted into the GUI to assist if the system malfunctioned or if manual steps were required (see figure 4.4).
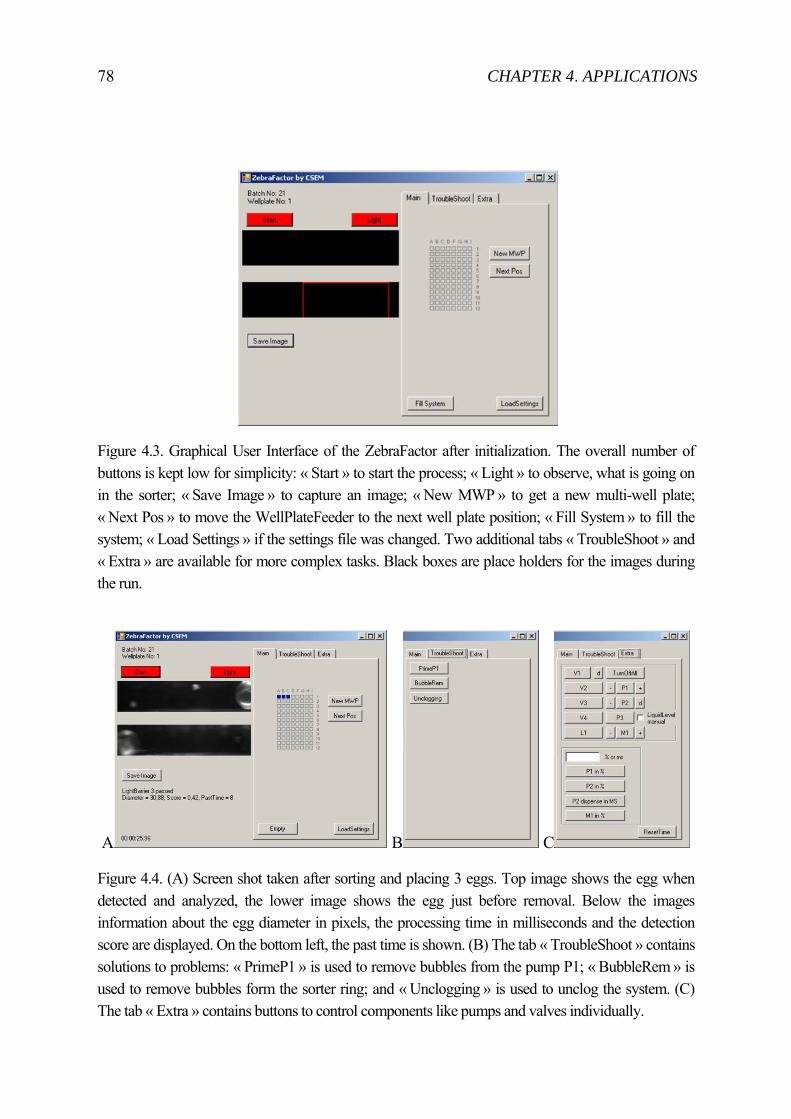
78 CHAPTER 4. APPLICATIONS
Figure 4.3. Graphical User Interface of the ZebraFactor after initialization. The overall number of buttons is kept low for simplicity: « Start » to start the process; « Light » to observe, what is going on in the sorter; « Save Image » to capture an image; « New MWP » to get a new multi-well plate; « Next Pos » to move the WellPlateFeeder to the next well plate position; « Fill System » to fill the system; « Load Settings » if the settings file was changed. Two additional tabs « TroubleShoot » and « Extra » are available for more complex tasks. Black boxes are place holders for the images during the run.
A B C
Figure 4.4. (A) Screen shot taken after sorting and placing 3 eggs. Top image shows the egg when detected and analyzed, the lower image shows the egg just before removal. Below the images information about the egg diameter in pixels, the processing time in milliseconds and the detection score are displayed. On the bottom left, the past time is shown. (B) The tab « TroubleShoot » contains solutions to problems: « PrimeP1 » is used to remove bubbles from the pump P1; « BubbleRem » is used to remove bubbles form the sorter ring; and « Unclogging » is used to unclog the system. (C) The tab « Extra » contains buttons to control components like pumps and valves individually.
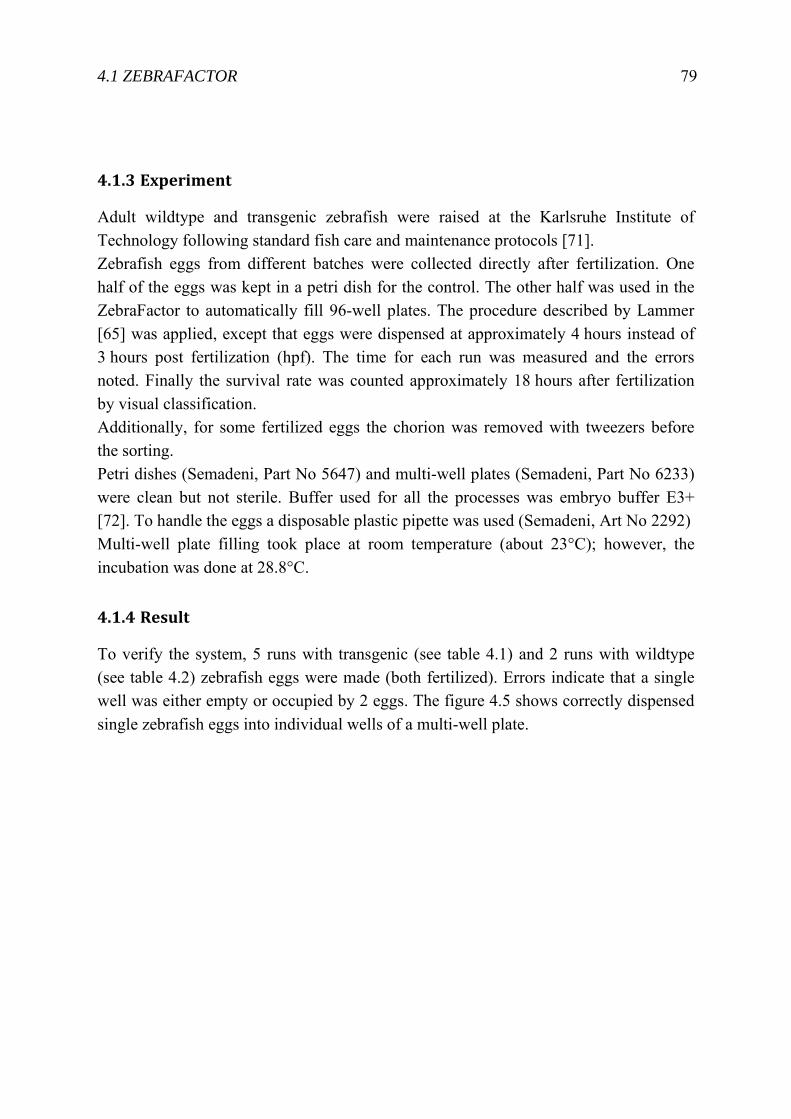
4.1 ZEBRAFACTOR 79
4.1.3 Experiment
Adult wildtype and transgenic zebrafish were raised at the Karlsruhe Institute of Technology following standard fish care and maintenance protocols [71]. Zebrafish eggs from different batches were collected directly after fertilization. One half of the eggs was kept in a petri dish for the control. The other half was used in the ZebraFactor to automatically fill 96-well plates. The procedure described by Lammer [65] was applied, except that eggs were dispensed at approximately 4 hours instead of 3 hours post fertilization (hpf). The time for each run was measured and the errors noted. Finally the survival rate was counted approximately 18 hours after fertilization by visual classification. Additionally, for some fertilized eggs the chorion was removed with tweezers before the sorting. Petri dishes (Semadeni, Part No 5647) and multi-well plates (Semadeni, Part No 6233) were clean but not sterile. Buffer used for all the processes was embryo buffer E3+ [72]. To handle the eggs a disposable plastic pipette was used (Semadeni, Art No 2292) Multi-well plate filling took place at room temperature (about 23°C); however, the incubation was done at 28.8°C.
4.1.4 Result
To verify the system, 5 runs with transgenic (see table 4.1) and 2 runs with wildtype (see table 4.2) zebrafish eggs were made (both fertilized). Errors indicate that a single well was either empty or occupied by 2 eggs. The figure 4.5 shows correctly dispensed single zebrafish eggs into individual wells of a multi-well plate.
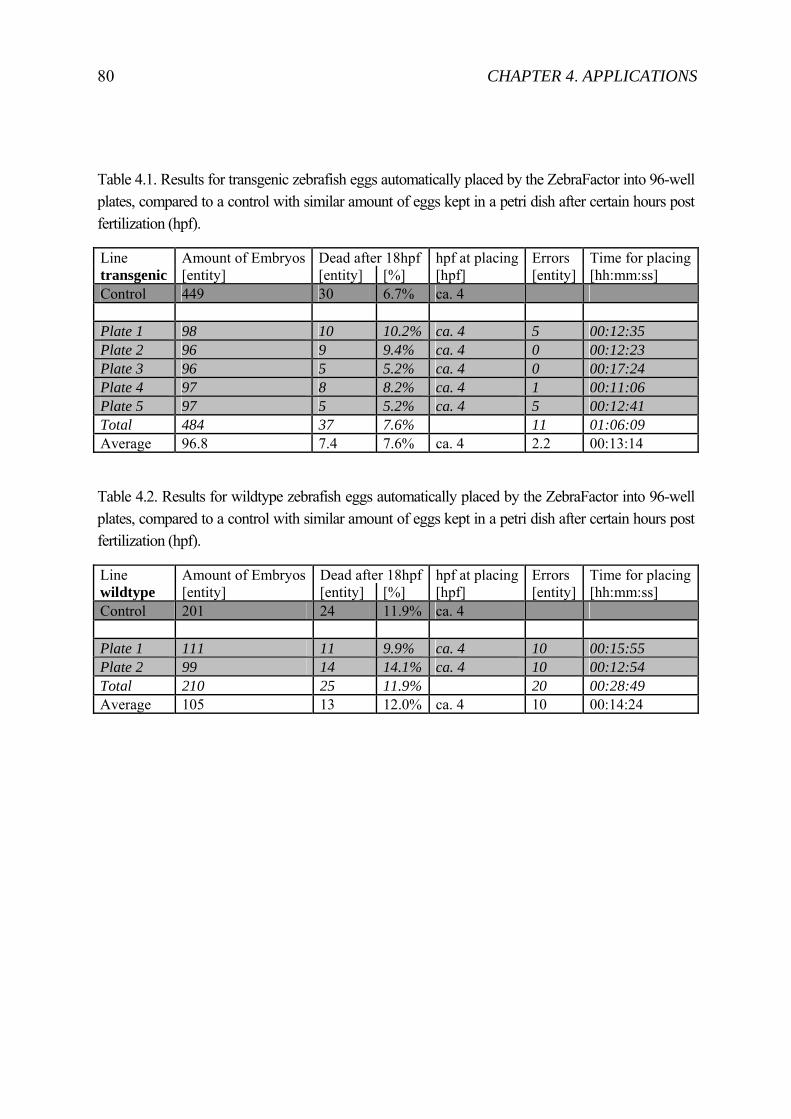
80 CHAPTER 4. APPLICATIONS
Table 4.1. Results for transgenic zebrafish eggs automatically placed by the ZebraFactor into 96-well plates, compared to a control with similar amount of eggs kept in a petri dish after certain hours post fertilization (hpf).
Line Amount of Embryos Dead after 18hpf hpf at placing Errors Time for placingtransgenic [entity] [entity] [%] [hpf] [entity] [hh:mm:ss]Control 449 30 6.7% ca. 4 Plate 1 98 10 10.2% ca. 4 5 00:12:35 Plate 2 96 9 9.4% ca. 4 0 00:12:23 Plate 3 96 5 5.2% ca. 4 0 00:17:24 Plate 4 97 8 8.2% ca. 4 1 00:11:06 Plate 5 97 5 5.2% ca. 4 5 00:12:41 Total 484 37 7.6% 11 01:06:09 Average 96.8 7.4 7.6% ca. 4 2.2 00:13:14
Table 4.2. Results for wildtype zebrafish eggs automatically placed by the ZebraFactor into 96-well plates, compared to a control with similar amount of eggs kept in a petri dish after certain hours post fertilization (hpf).
Line Amount of Embryos Dead after 18hpf hpf at placing Errors Time for placingwildtype [entity] [entity] [%] [hpf] [entity] [hh:mm:ss] Control 201 24 11.9% ca. 4 Plate 1 111 11 9.9% ca. 4 10 00:15:55 Plate 2 99 14 14.1% ca. 4 10 00:12:54 Total 210 25 11.9% 20 00:28:49 Average 105 13 12.0% ca. 4 10 00:14:24
4.1 ZEBRAFACTOR 81
Figure 4.5. Single zebrafish eggs dispensed into individual wells of a multi-well plate with the ZebraFactor.
In an additional experiment, after modifying the search parameters, sorting of dechorionated embryos was possible. 24 embryos with total 3 errors (none or two embryos in one well) were dispensed into wells. The placing into the well plate was gentle enough to avoid crushing the yolk bag as shown in figure 4.6. All embryos survived (survival count after 100 hpf).
Figure 4.6. Dechorionated embryo after placement into a multi-well plate using the ZebraFactor.
Yolk bag
82 CHAPTER 4. APPLICATIONS
4.1.5 Discussion
The need for toxicity testing of compounds is increasing since the REACH initiative in Europe was launched in 2007. Numerous publications show that fertilized zebrafish eggs and larvae are good model organisms for toxicity testing and can substantially reduce the amount of vertebrate mammals used for such tests. However, for efficient large scale toxicity testing, automated solutions are required. Firstly, lab automation systems to handle liquids and well plates are necessary. Secondly, software and hardware solutions to efficiently store, distribute and analyze the large amount of data collected from the screens are needed. One remaining bottleneck in the whole screening process remains by getting the eggs or larvae from the breeding tank into a processable format like the standardized 96- or 384-well plate. The sorting device presented here for singularizing eggs from a suspension into a 96-well plate, named ZebraFactor, consisting of the CellSorter and WellPlateFeeder, fills a 96-well plate at an average of 13 minutes, which corresponds to about 8 seconds per egg. The surviving rate is approximately the same as in the control group (wildtype: ZebraFactor: 7.6 % vs. Control: 6.7 %; transgenic: ZebraFactor: 12.0 % vs. Control: 11.9 %). Furthermore, only by changing some parameters in the software, dechorionated embryos could be dispensed with a 100% survival rate. Until today, lab personal were only able to manually fill 96-well plates 3 hours a day before exhaustion lowered their throughput and quality. Now it is possible to use the ZebraFactor to perform this monotonous work with the same constant quality 24 hours a day, seven days a week. Moreover, the personnel can prepare and run the experiments while the ZebraFactor is filling further well plates. Thus the automated sorting system presented here is expected to enable toxicity screening with several factors higher throughput than today. Several factors limit the minimal time of a cycle: (i) transfer distance and transfer speed between the CellSorter and the WellPlateFeeder – the shorter the distance or the faster the transfer speed, the shorter the cycle time; (ii) pressure wave resulting from pinch valves in the interface – the faster the valve switches the higher the pressure wave traveling through the system gets , which can lead to malfunctioning of the CellSorter; (iii) speed of the WellPlateFeeder to move from one well to the next – the faster the WellPlateFeeder the shorter the cycle time. As mentioned above, an average automated filling of a 96-well plate with the ZebraFactor takes 13 minutes, which results to a cycle time per egg or well of 8 seconds. We strongly believe that this time can be reduced to 4 seconds, by making adaption to the design of the fluidics and the control software. This would enable filling
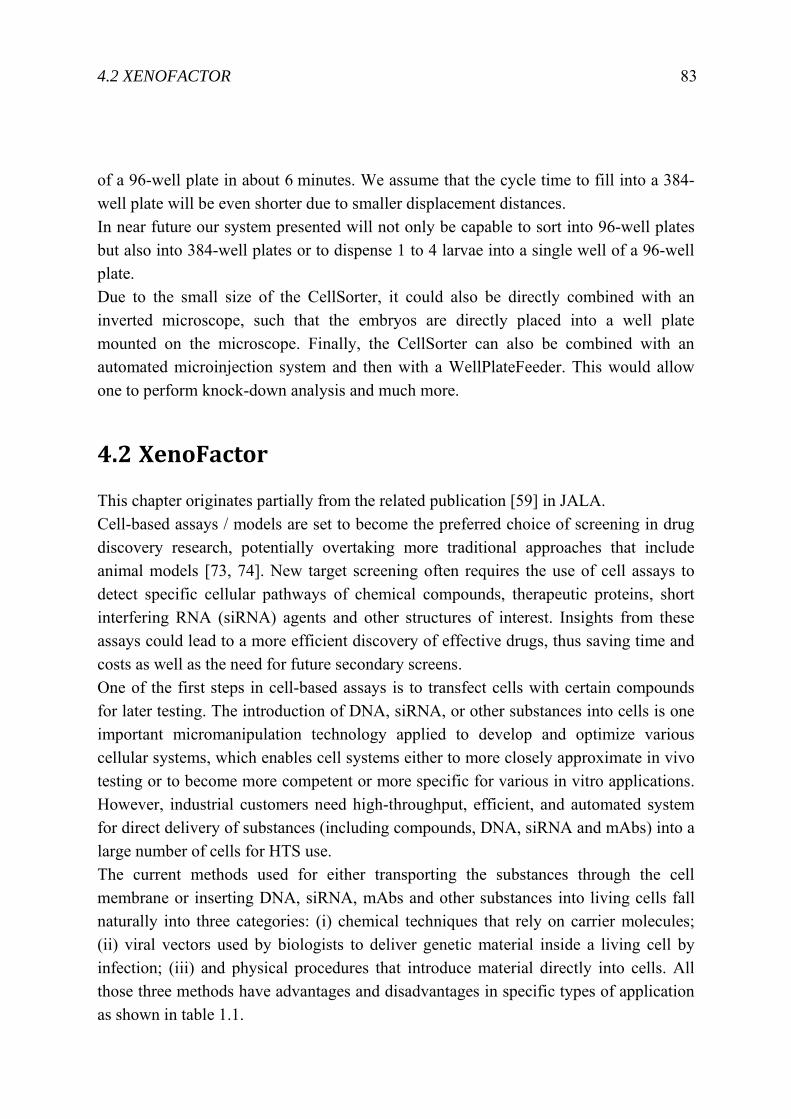
4.2 XENOFACTOR 83
of a 96-well plate in about 6 minutes. We assume that the cycle time to fill into a 384-well plate will be even shorter due to smaller displacement distances. In near future our system presented will not only be capable to sort into 96-well plates but also into 384-well plates or to dispense 1 to 4 larvae into a single well of a 96-well plate. Due to the small size of the CellSorter, it could also be directly combined with an inverted microscope, such that the embryos are directly placed into a well plate mounted on the microscope. Finally, the CellSorter can also be combined with an automated microinjection system and then with a WellPlateFeeder. This would allow one to perform knock-down analysis and much more.
4.2 XenoFactor
This chapter originates partially from the related publication [59] in JALA. Cell-based assays / models are set to become the preferred choice of screening in drug discovery research, potentially overtaking more traditional approaches that include animal models [73, 74]. New target screening often requires the use of cell assays to detect specific cellular pathways of chemical compounds, therapeutic proteins, short interfering RNA (siRNA) agents and other structures of interest. Insights from these assays could lead to a more efficient discovery of effective drugs, thus saving time and costs as well as the need for future secondary screens. One of the first steps in cell-based assays is to transfect cells with certain compounds for later testing. The introduction of DNA, siRNA, or other substances into cells is one important micromanipulation technology applied to develop and optimize various cellular systems, which enables cell systems either to more closely approximate in vivo testing or to become more competent or more specific for various in vitro applications. However, industrial customers need high-throughput, efficient, and automated system for direct delivery of substances (including compounds, DNA, siRNA and mAbs) into a large number of cells for HTS use. The current methods used for either transporting the substances through the cell membrane or inserting DNA, siRNA, mAbs and other substances into living cells fall naturally into three categories: (i) chemical techniques that rely on carrier molecules; (ii) viral vectors used by biologists to deliver genetic material inside a living cell by infection; (iii) and physical procedures that introduce material directly into cells. All those three methods have advantages and disadvantages in specific types of application as shown in table 1.1.
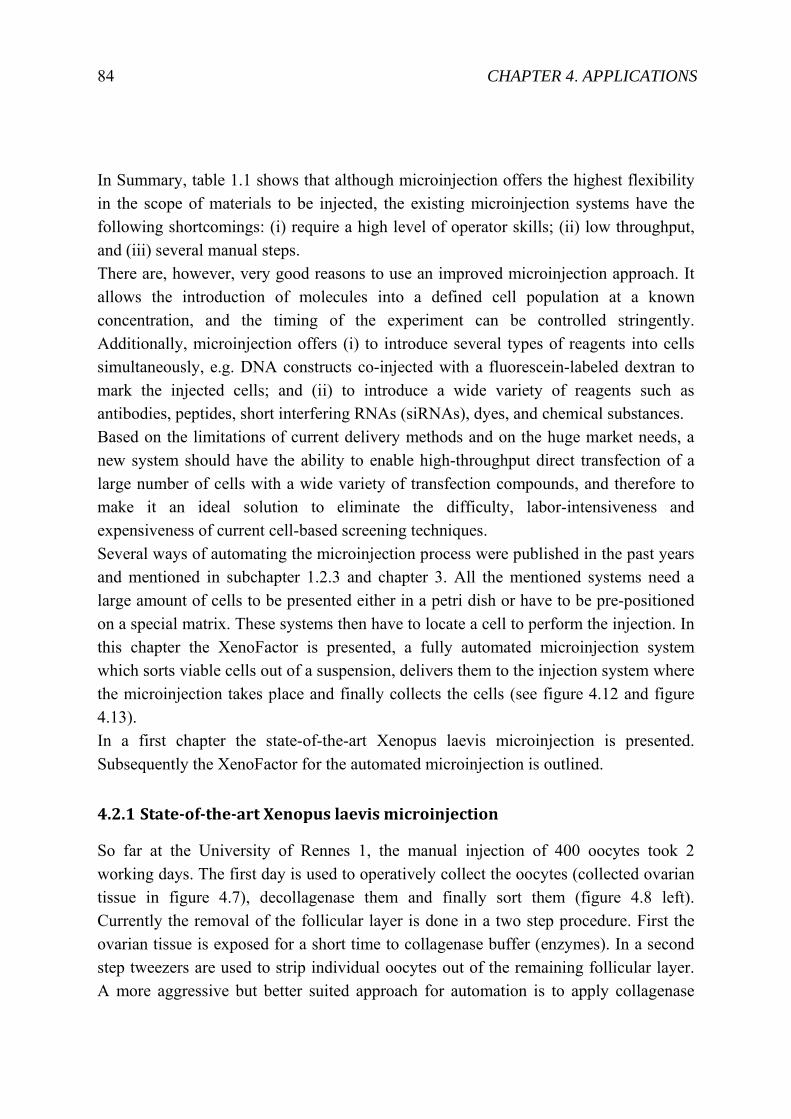
84 CHAPTER 4. APPLICATIONS
In Summary, table 1.1 shows that although microinjection offers the highest flexibility in the scope of materials to be injected, the existing microinjection systems have the following shortcomings: (i) require a high level of operator skills; (ii) low throughput, and (iii) several manual steps. There are, however, very good reasons to use an improved microinjection approach. It allows the introduction of molecules into a defined cell population at a known concentration, and the timing of the experiment can be controlled stringently. Additionally, microinjection offers (i) to introduce several types of reagents into cells simultaneously, e.g. DNA constructs co-injected with a fluorescein-labeled dextran to mark the injected cells; and (ii) to introduce a wide variety of reagents such as antibodies, peptides, short interfering RNAs (siRNAs), dyes, and chemical substances. Based on the limitations of current delivery methods and on the huge market needs, a new system should have the ability to enable high-throughput direct transfection of a large number of cells with a wide variety of transfection compounds, and therefore to make it an ideal solution to eliminate the difficulty, labor-intensiveness and expensiveness of current cell-based screening techniques. Several ways of automating the microinjection process were published in the past years and mentioned in subchapter 1.2.3 and chapter 3. All the mentioned systems need a large amount of cells to be presented either in a petri dish or have to be pre-positioned on a special matrix. These systems then have to locate a cell to perform the injection. In this chapter the XenoFactor is presented, a fully automated microinjection system which sorts viable cells out of a suspension, delivers them to the injection system where the microinjection takes place and finally collects the cells (see figure 4.12 and figure 4.13). In a first chapter the state-of-the-art Xenopus laevis microinjection is presented. Subsequently the XenoFactor for the automated microinjection is outlined.
4.2.1 Stateoftheart Xenopus laevis microinjection
So far at the University of Rennes 1, the manual injection of 400 oocytes took 2 working days. The first day is used to operatively collect the oocytes (collected ovarian tissue in figure 4.7), decollagenase them and finally sort them (figure 4.8 left). Currently the removal of the follicular layer is done in a two step procedure. First the ovarian tissue is exposed for a short time to collagenase buffer (enzymes). In a second step tweezers are used to strip individual oocytes out of the remaining follicular layer. A more aggressive but better suited approach for automation is to apply collagenase
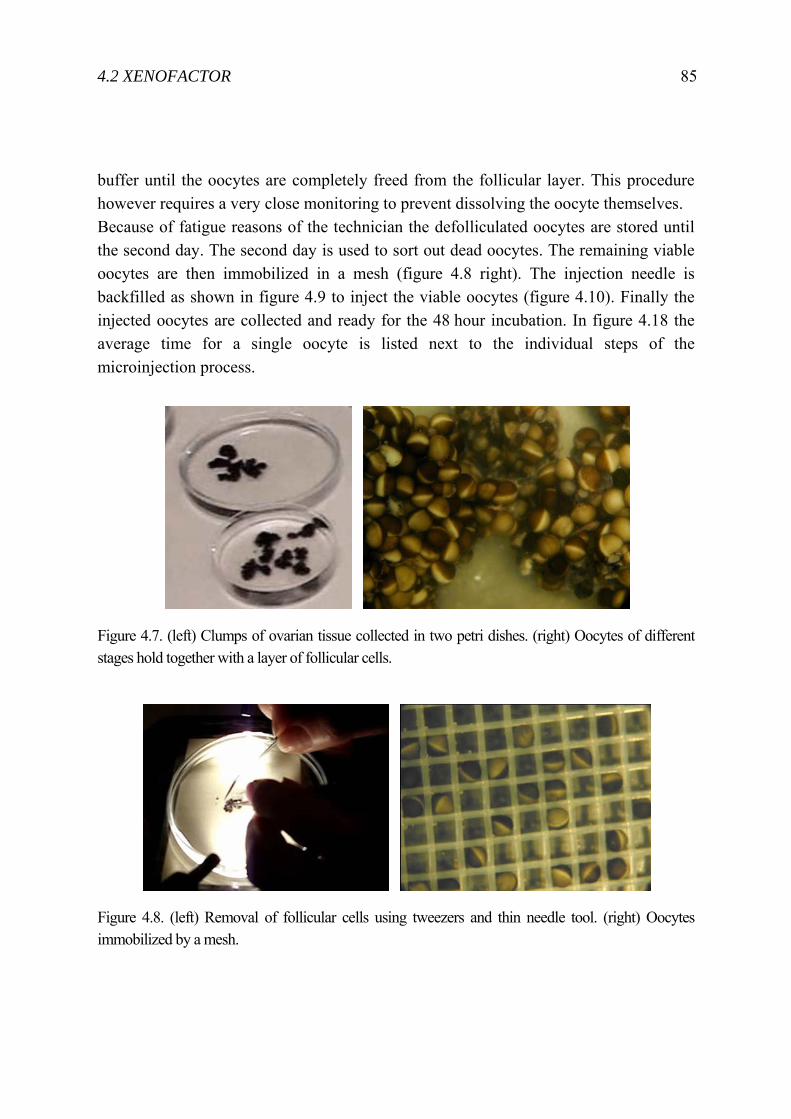
4.2 XENOFACTOR 85
buffer until the oocytes are completely freed from the follicular layer. This procedure however requires a very close monitoring to prevent dissolving the oocyte themselves. Because of fatigue reasons of the technician the defolliculated oocytes are stored until the second day. The second day is used to sort out dead oocytes. The remaining viable oocytes are then immobilized in a mesh (figure 4.8 right). The injection needle is backfilled as shown in figure 4.9 to inject the viable oocytes (figure 4.10). Finally the injected oocytes are collected and ready for the 48 hour incubation. In figure 4.18 the average time for a single oocyte is listed next to the individual steps of the microinjection process.
Figure 4.7. (left) Clumps of ovarian tissue collected in two petri dishes. (right) Oocytes of different stages hold together with a layer of follicular cells.
Figure 4.8. (left) Removal of follicular cells using tweezers and thin needle tool. (right) Oocytes immobilized by a mesh.
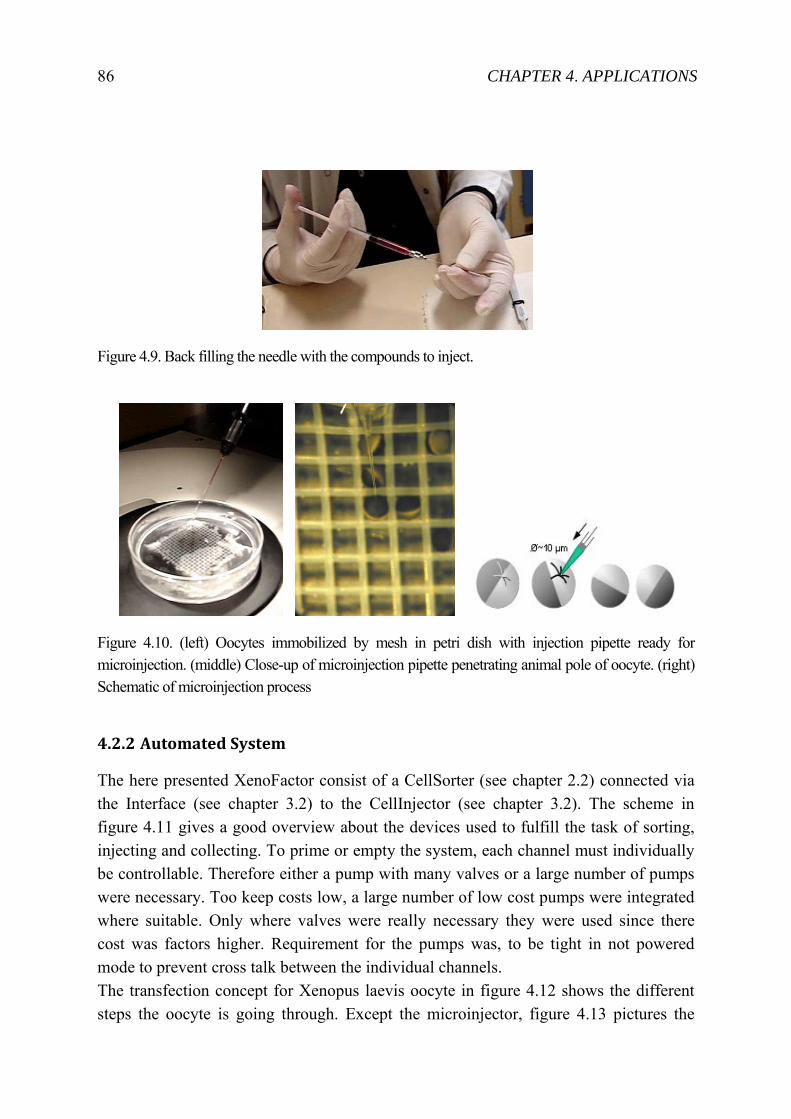
86 CHAPTER 4. APPLICATIONS
Figure 4.9. Back filling the needle with the compounds to inject.
Figure 4.10. (left) Oocytes immobilized by mesh in petri dish with injection pipette ready for microinjection. (middle) Close-up of microinjection pipette penetrating animal pole of oocyte. (right) Schematic of microinjection process
4.2.2 Automated System
The here presented XenoFactor consist of a CellSorter (see chapter 2.2) connected via the Interface (see chapter 3.2) to the CellInjector (see chapter 3.2). The scheme in figure 4.11 gives a good overview about the devices used to fulfill the task of sorting, injecting and collecting. To prime or empty the system, each channel must individually be controllable. Therefore either a pump with many valves or a large number of pumps were necessary. Too keep costs low, a large number of low cost pumps were integrated where suitable. Only where valves were really necessary they were used since there cost was factors higher. Requirement for the pumps was, to be tight in not powered mode to prevent cross talk between the individual channels. The transfection concept for Xenopus laevis oocyte in figure 4.12 shows the different steps the oocyte is going through. Except the microinjector, figure 4.13 pictures the
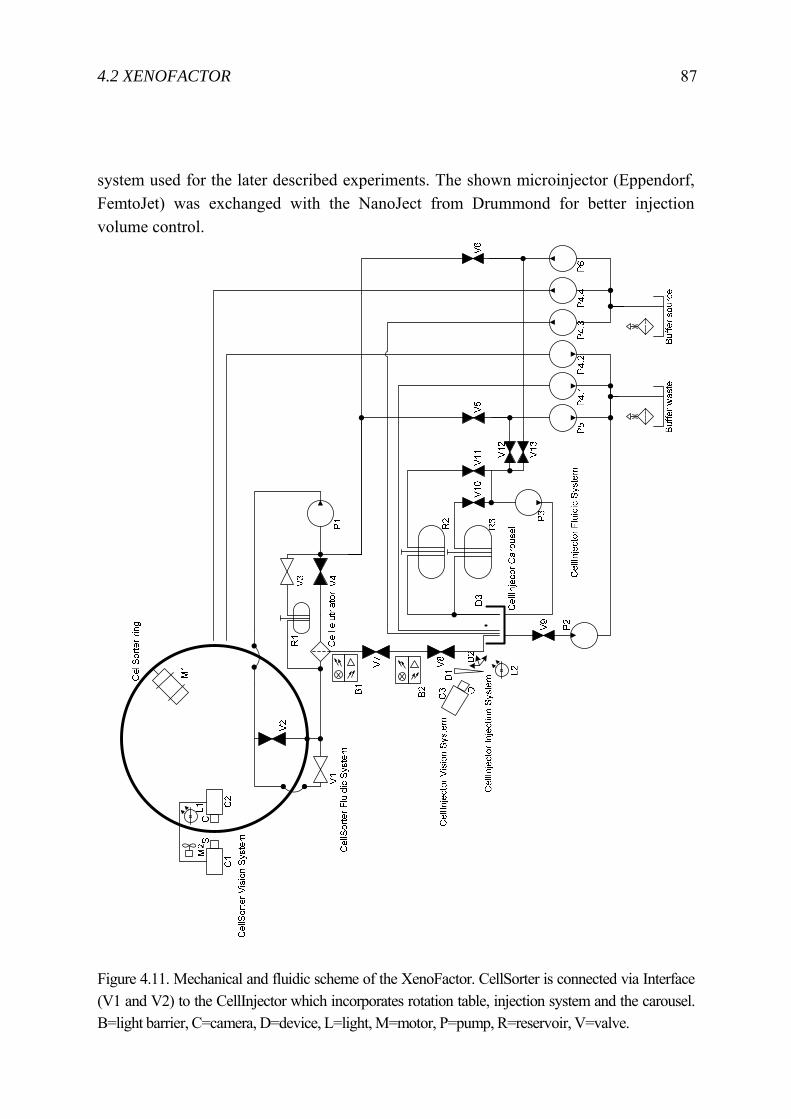
4.2 XENOFACTOR 87
system used for the later described experiments. The shown microinjector (Eppendorf, FemtoJet) was exchanged with the NanoJect from Drummond for better injection volume control.
Figure 4.11. Mechanical and fluidic scheme of the XenoFactor. CellSorter is connected via Interface (V1 and V2) to the CellInjector which incorporates rotation table, injection system and the carousel. B=light barrier, C=camera, D=device, L=light, M=motor, P=pump, R=reservoir, V=valve.
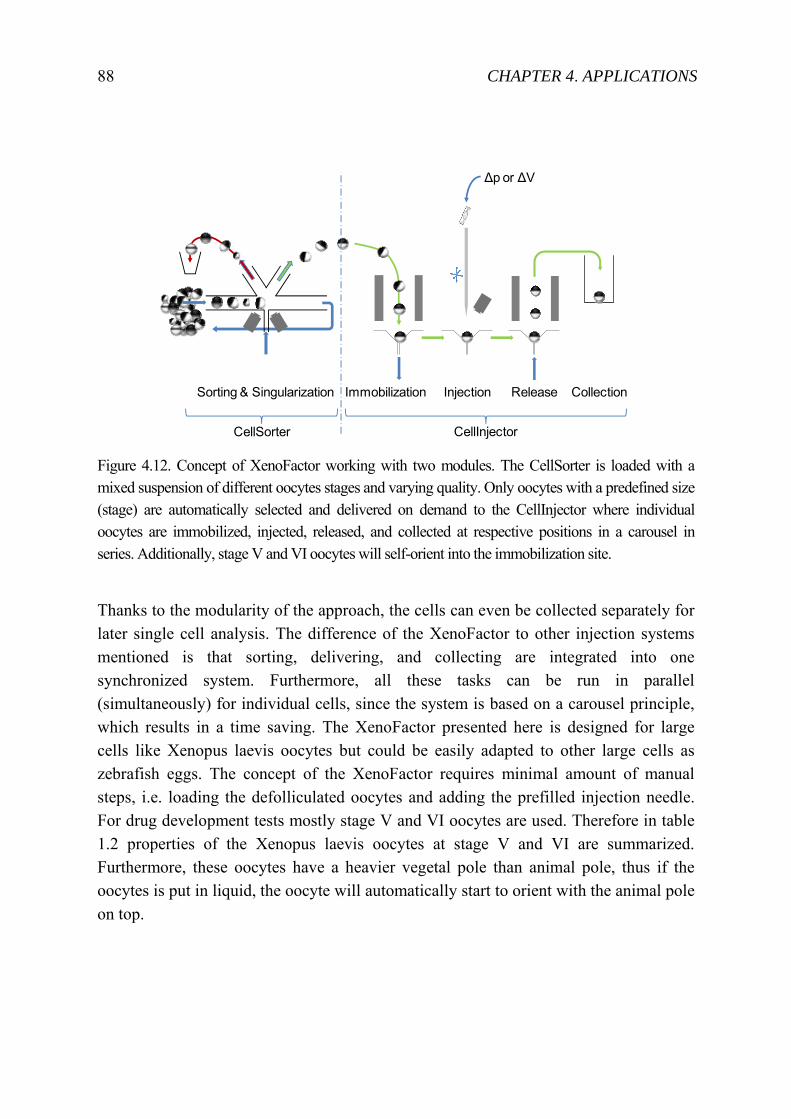
88 CHAPTER 4. APPLICATIONS
Figure 4.12. Concept of XenoFactor working with two modules. The CellSorter is loaded with a mixed suspension of different oocytes stages and varying quality. Only oocytes with a predefined size (stage) are automatically selected and delivered on demand to the CellInjector where individual oocytes are immobilized, injected, released, and collected at respective positions in a carousel in series. Additionally, stage V and VI oocytes will self-orient into the immobilization site.
Thanks to the modularity of the approach, the cells can even be collected separately for later single cell analysis. The difference of the XenoFactor to other injection systems mentioned is that sorting, delivering, and collecting are integrated into one synchronized system. Furthermore, all these tasks can be run in parallel (simultaneously) for individual cells, since the system is based on a carousel principle, which results in a time saving. The XenoFactor presented here is designed for large cells like Xenopus laevis oocytes but could be easily adapted to other large cells as zebrafish eggs. The concept of the XenoFactor requires minimal amount of manual steps, i.e. loading the defolliculated oocytes and adding the prefilled injection needle. For drug development tests mostly stage V and VI oocytes are used. Therefore in table 1.2 properties of the Xenopus laevis oocytes at stage V and VI are summarized. Furthermore, these oocytes have a heavier vegetal pole than animal pole, thus if the oocytes is put in liquid, the oocyte will automatically start to orient with the animal pole on top.
Immobilization Injection Release CollectionSorting & Singularization
∆p or ∆V
CellSorter CellInjector
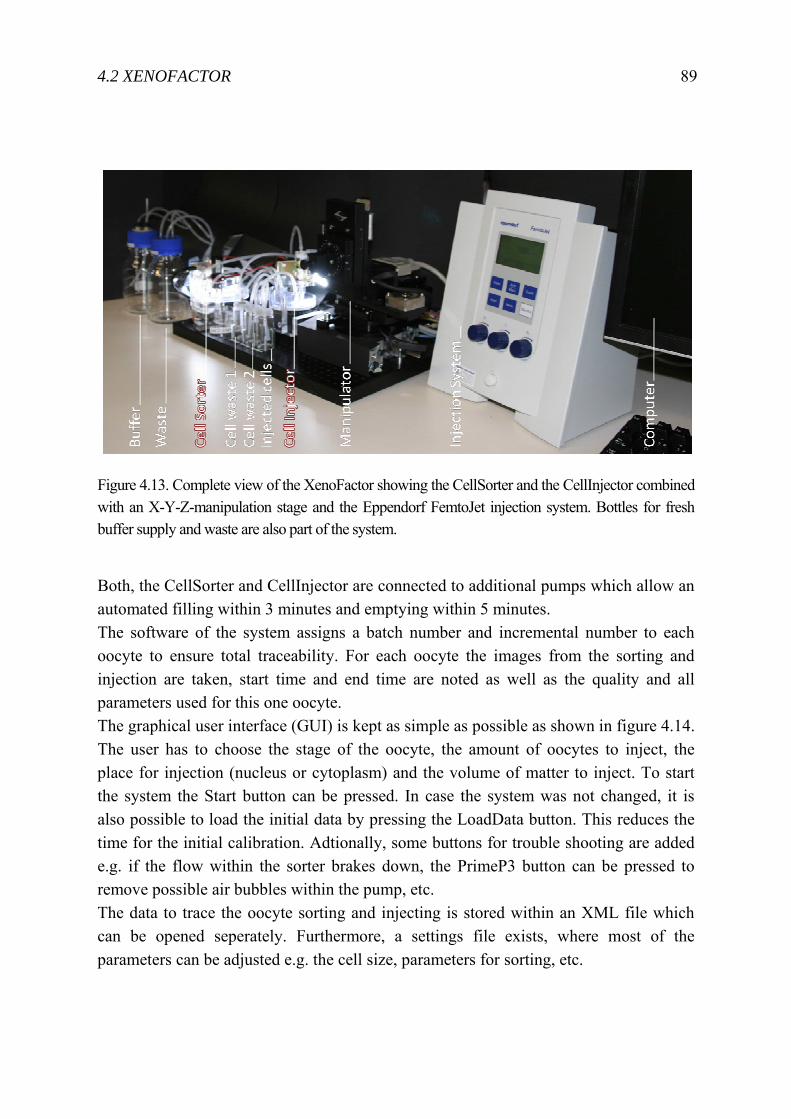
4.2 XENOFACTOR 89
Figure 4.13. Complete view of the XenoFactor showing the CellSorter and the CellInjector combined with an X-Y-Z-manipulation stage and the Eppendorf FemtoJet injection system. Bottles for fresh buffer supply and waste are also part of the system.
Both, the CellSorter and CellInjector are connected to additional pumps which allow an automated filling within 3 minutes and emptying within 5 minutes. The software of the system assigns a batch number and incremental number to each oocyte to ensure total traceability. For each oocyte the images from the sorting and injection are taken, start time and end time are noted as well as the quality and all parameters used for this one oocyte. The graphical user interface (GUI) is kept as simple as possible as shown in figure 4.14. The user has to choose the stage of the oocyte, the amount of oocytes to inject, the place for injection (nucleus or cytoplasm) and the volume of matter to inject. To start the system the Start button can be pressed. In case the system was not changed, it is also possible to load the initial data by pressing the LoadData button. This reduces the time for the initial calibration. Adtionally, some buttons for trouble shooting are added e.g. if the flow within the sorter brakes down, the PrimeP3 button can be pressed to remove possible air bubbles within the pump, etc. The data to trace the oocyte sorting and injecting is stored within an XML file which can be opened seperately. Furthermore, a settings file exists, where most of the parameters can be adjusted e.g. the cell size, parameters for sorting, etc.
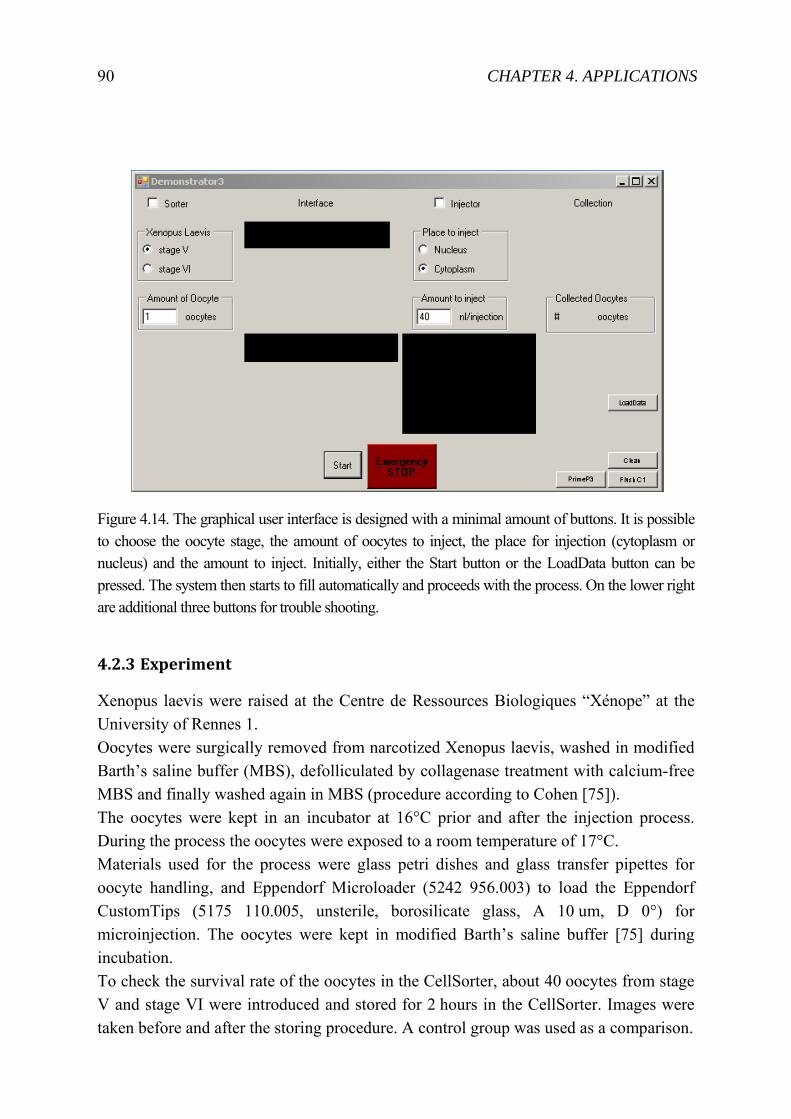
90 CHAPTER 4. APPLICATIONS
Figure 4.14. The graphical user interface is designed with a minimal amount of buttons. It is possible to choose the oocyte stage, the amount of oocytes to inject, the place for injection (cytoplasm or nucleus) and the amount to inject. Initially, either the Start button or the LoadData button can be pressed. The system then starts to fill automatically and proceeds with the process. On the lower right are additional three buttons for trouble shooting.
4.2.3 Experiment
Xenopus laevis were raised at the Centre de Ressources Biologiques “Xénope” at the University of Rennes 1. Oocytes were surgically removed from narcotized Xenopus laevis, washed in modified Barth’s saline buffer (MBS), defolliculated by collagenase treatment with calcium-free MBS and finally washed again in MBS (procedure according to Cohen [75]). The oocytes were kept in an incubator at 16°C prior and after the injection process. During the process the oocytes were exposed to a room temperature of 17°C. Materials used for the process were glass petri dishes and glass transfer pipettes for oocyte handling, and Eppendorf Microloader (5242 956.003) to load the Eppendorf CustomTips (5175 110.005, unsterile, borosilicate glass, A 10 um, D 0°) for microinjection. The oocytes were kept in modified Barth’s saline buffer [75] during incubation. To check the survival rate of the oocytes in the CellSorter, about 40 oocytes from stage V and stage VI were introduced and stored for 2 hours in the CellSorter. Images were taken before and after the storing procedure. A control group was used as a comparison.
4.2 XENOFACTOR 91
To test successful microinjection, human OATP2 cRNA [76] was transcribed from a plasmid containing the human OATP2 cDNA (provided by Prof. D. Keppler, DFKZ, Heidelberg, Germany) and injected into the cytoplasm of the oocytes by using the NanoJect II (Drummond Scientific Company, Broomall, PA, USA). The injection volume was 50 nl which correspond to 10 ng/oocyte. After the incubation (36 to 48 hours) the functional expression of the transporter protein channels was detected by the measurement of OATP2-mediated [3H] estrone sulfate uptake on both cRNA-injected oocytes and uninjected oocytes. After the injection the oocytes were incubated between 36 to 48 hours at 16°C to allow the protein expression. The oocytes were then transferred in a multi-well plate, washed twice with OR2 buffer and incubated for 1 hour with various concentrations of radiolabeled substrate (Estrone-3-sulfate). The uptake was stopped by the addition of ice-cold OR2 buffer. The oocytes were then washed four times with ice-cold OR2 buffer, transferred in liquid scintillation counting vial, lysed with 10% SDS and the associated radio-activity was measured. In the uptake study with different concentration, batches (2 or 3 oocytes) were lysed together for analysis. In the uptake study for repeatability, single oocytes were lysed and analyzed. The control of uninjected oocytes was left at 16°C, and later treated in the same way as the injected oocytes for radioactivity measurement. Manual injection was done similar to the uptake study for repeatability described above but with a different batch of oocytes at a later date. For a time comparison between the automated injection (XenoFactor) and the manual injection the times required for the different steps were measured and reported.
4.2.4 Result
Oocytes (stage V or stage VI) placed for 2 hours in the CellSorter running at normal speed were compared to a control group stored in an incubator. Viability was checked visually 24 and 48 hours after the manipulation in the CellSorter by looking at the oocytes’ roundness and coloring. Oocytes with perfectly spherical shape and a clear contrast between the darker animal and lighter vegetal pole, without contrast patchiness, are considered viable. No significant difference was found between the two batches of oocytes (figure 4.15). After 48 hours, 97% of the control oocytes were viable versus 97% or 94% for stage V and stage VI oocytes placed in the CellSorter respectively.
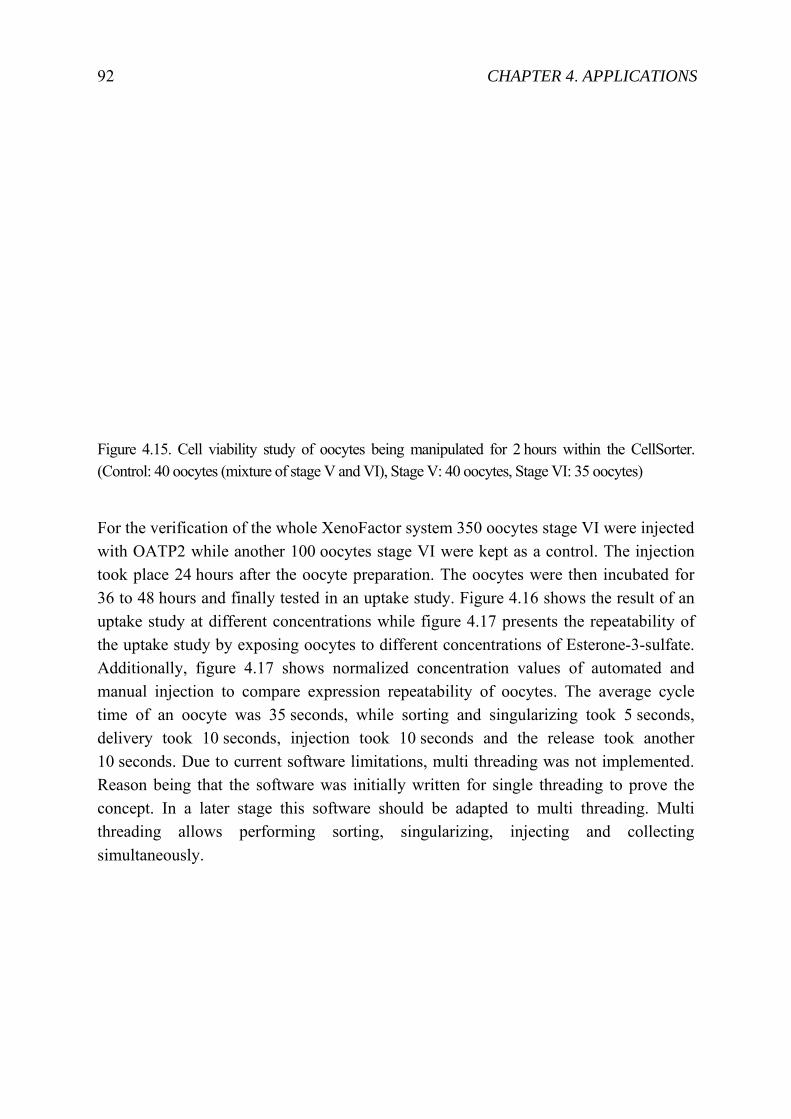
92 CHAPTER 4. APPLICATIONS
Figure 4.15. Cell viability study of oocytes being manipulated for 2 hours within the CellSorter. (Control: 40 oocytes (mixture of stage V and VI), Stage V: 40 oocytes, Stage VI: 35 oocytes)
For the verification of the whole XenoFactor system 350 oocytes stage VI were injected with OATP2 while another 100 oocytes stage VI were kept as a control. The injection took place 24 hours after the oocyte preparation. The oocytes were then incubated for 36 to 48 hours and finally tested in an uptake study. Figure 4.16 shows the result of an uptake study at different concentrations while figure 4.17 presents the repeatability of the uptake study by exposing oocytes to different concentrations of Esterone-3-sulfate. Additionally, figure 4.17 shows normalized concentration values of automated and manual injection to compare expression repeatability of oocytes. The average cycle time of an oocyte was 35 seconds, while sorting and singularizing took 5 seconds, delivery took 10 seconds, injection took 10 seconds and the release took another 10 seconds. Due to current software limitations, multi threading was not implemented. Reason being that the software was initially written for single threading to prove the concept. In a later stage this software should be adapted to multi threading. Multi threading allows performing sorting, singularizing, injecting and collecting simultaneously.
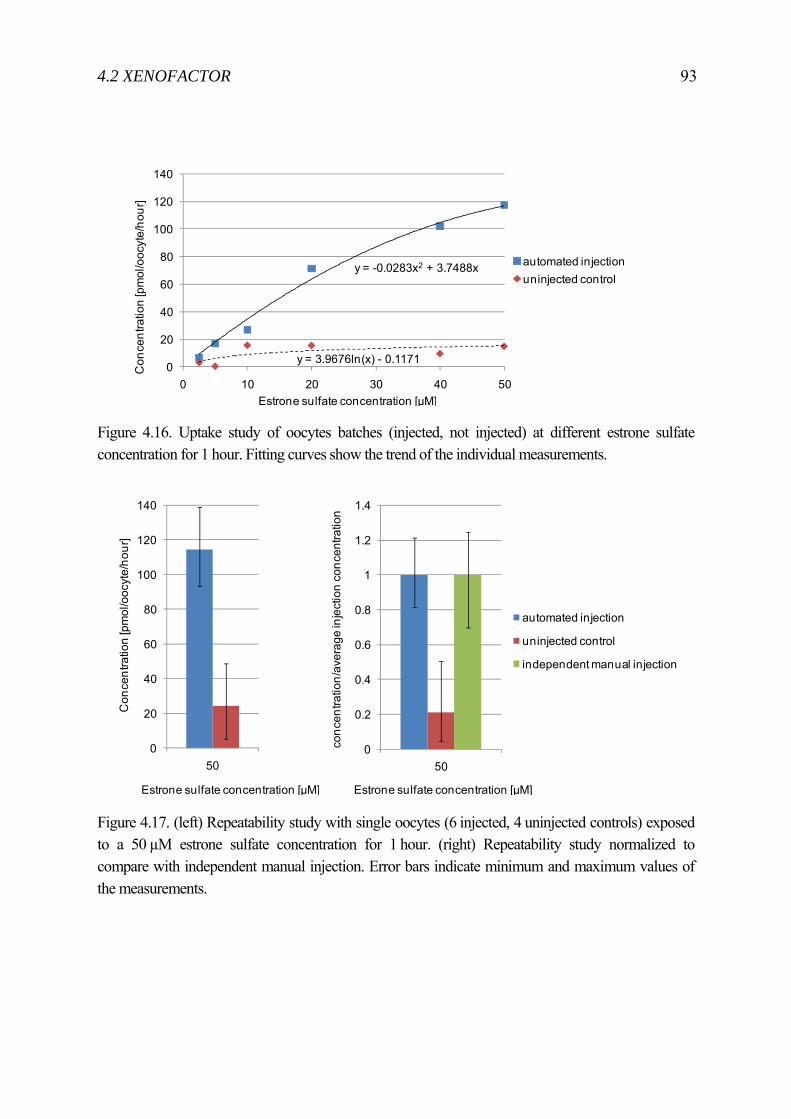
4.2 XENOFACTOR 93
Figure 4.16. Uptake study of oocytes batches (injected, not injected) at different estrone sulfate concentration for 1 hour. Fitting curves show the trend of the individual measurements.
Figure 4.17. (left) Repeatability study with single oocytes (6 injected, 4 uninjected controls) exposed to a 50 µM estrone sulfate concentration for 1 hour. (right) Repeatability study normalized to compare with independent manual injection. Error bars indicate minimum and maximum values of the measurements.
y = -0.0283x2 + 3.7488x
y = 3.9676ln(x) - 0.11710
20
40
60
80
100
120
140
0 10 20 30 40 50
Con
cent
ratio
n [p
mol
/ooc
yte/
hour
]
Estrone sulfate concentration [µM]
automated injectionuninjected control
0
20
40
60
80
100
120
140
50
Con
cent
ratio
n [p
mol
/ooc
yte/
hour
]
Estrone sulfate concentration [µM]
0
0.2
0.4
0.6
0.8
1
1.2
1.4
50
conc
entra
tion/
aver
age
inje
ctio
n co
ncen
tratio
n
Estrone sulfate concentration [µM]
automated injection
uninjected control
independent manual injection
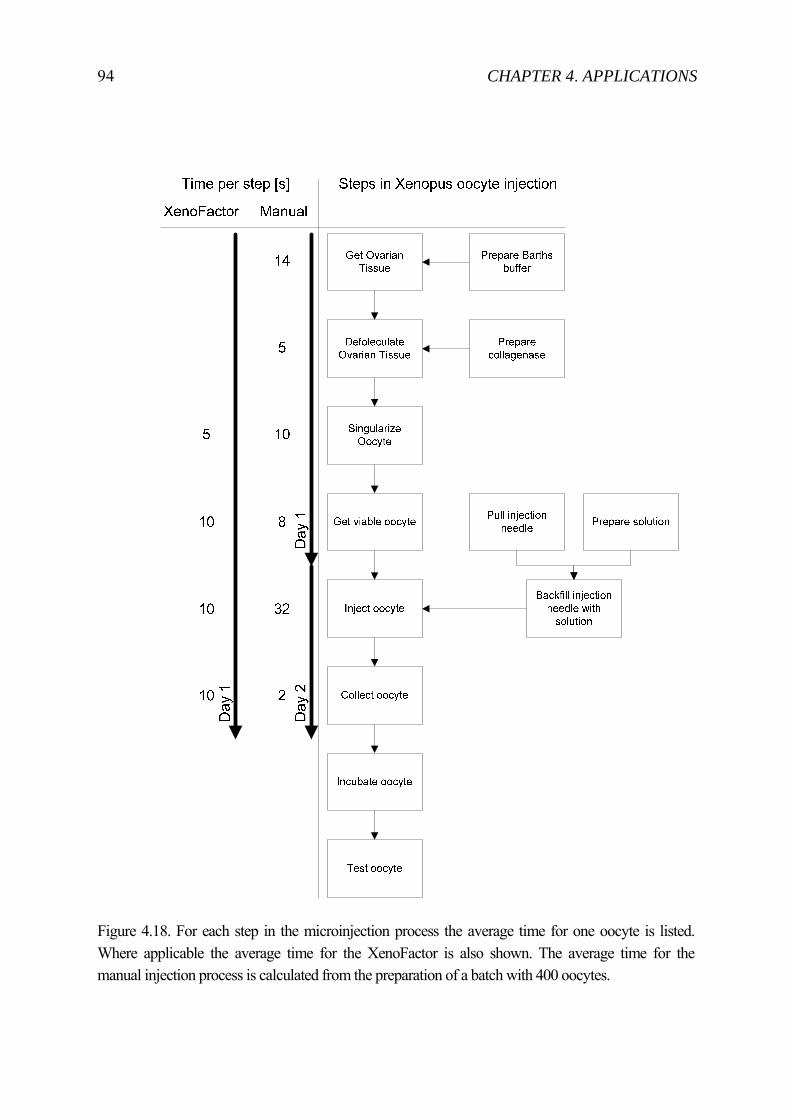
94 CHAPTER 4. APPLICATIONS
Figure 4.18. For each step in the microinjection process the average time for one oocyte is listed. Where applicable the average time for the XenoFactor is also shown. The average time for the manual injection process is calculated from the preparation of a batch with 400 oocytes.
4.2 XENOFACTOR 95
4.2.5 Discussion
Cell transfection is a daily business in drug discovery, toxicity screening etc. Among the various transfection methods microinjection remains one of the most effective transfection methods. However, it lacks in efficiency and repeatability because the process is still done manually. Moreover, the semi-automated microinjection systems available today only focus onto the microinjection itself. The analysis of the manual microinjection process shows (see figure 4.18), that additionally to the microinjection also surgical removal, defolliculation, sorting, and singularization are bottlenecks which should be improved. The XenoFactor, the fully automated microinjection system presented here, includes sorting and singularization of viable cells, their transfer between modules, injection, and finally the collection of them. The XenoFactor was optimised for Xenopus laevis oocytes but can easily be adapted to other biological samples of similar size like zebrafish larvae or others. The system consists of the CellSorter and the CellInjector but can also be coupled with the WellPlateFeeder or any other subsequent system to add additional functionality. The effectiveness of the XenoFactor as a fully automated microinjection system was verified by experiments. Results showed, that oocytes manipulated for 2 hours within the CellSorter (sorting device of the XenoFactor) aged similar to a control. To verify the CellInjector OATP2 cRNA was injected and after a 36 to 48 hour incubation time, the expected expressed Human Organic Anion Tranport Proteins were tested by an uptake study, which proved that the expression and so the automated injection were performed succesfully. In summary, by using the XenoFactor we were able to reduce the microinjection of a batch of 400 oocytes from previously 2 days (manually by 1 technician) to less than 1 day (automated by the XenoFactor). Furthermore, technicians were less exhausted and could perform other work at the same time. The current cycle time for a single oocyte is 35 seconds. In a future step, the software will be adapted for multi threading processing to enable the software to perform the sorting, injection and collection simultaneous, which will lead to a cycle time of less than 10 seconds per oocyte.

Summary
In this thesis the process of automated microinjection is elaborated including two new features, firstly automated delivery and immobilization of cells and secondly automated release and collection of cells. Using a carousel principle to perform delivery/immobilization, microinjection and release/collection simultaneously on subsequent cells reduces the cycle time. Furthermore, a novel CellSorter is presented in this thesis. In contrast to existing cell sorters the camera-based imaging system does not need (auto)fluorescence signals but uses darkfield illumination. If analysis of fluorescence signals is required, filters could be attached. The novel method to move cells via a spinning ground by viscous drag forces and friction allows the CellSorter to sort cells continuously. Current cell sorters are based on a pressurized fluidic system, which only allows a one-time detection. Such systems perform sorting in a high throughput manner, however their yield of recovery for a few wanted cells in thousands can be as bad as 10%. One reason is that these cells pass the detection and deflection area only once. If not perfectly aligned, these cells cannot be properly imaged or deflected and are therefore lost. With the spinning ground method, cells can be stored in the CellSorter and imaged until they are properly positioned for sorting. Furthermore, this method also allows the CellSorter to deliver cells on demand. Meaning, cells are stored until they are required in subsequent systems. So far the highly repetitive steps of sorting, immobilizing, microinjecting and collecting are done manually by lab personal. Exhaustion after few hours reduces the productivity and so the yield significantly. Currently, these steps are also the main bottlenecks in the complete cell preparation process. The modular setup demonstrated in this thesis, consisting of the CellSorter, CellInjector and WellPlateFeeder, widens these bottlenecks and offers for the first time a system which performs the complete process fully automated without any user intervention after adding the cells and mounting the injection needle. With two applications of the setup it could be shown in this thesis that (i) the ZebraFactor as a combination of CellSorter and WellPlateFeeder could fully automatically place zebrafish eggs as efficiently and gentle as lab personal and (ii) the XenoFactor as a combination of CellSorter and CellInjector could fully automatically sort and inject Xenopus laevis oocytes faster than lab personal.
98 SUMMARY
Lab results produced by the ZebraFactor showed that a 96-well plate is filled in an average time of 13 minutes, which corresponds to about 8 seconds per egg. The survival rate is approximately the same as in the control group (for wildtype Zebrafish embryos: ZebraFactor 7.6% vs Control 6.7%; for transgenic Zebrafish embryos: ZebraFactor 12.0% vs Control 11.9%). Additionally, dechorionated embryos could be dispensed with a 100% survival rate. Due to the availability of the ZebraFactor, the dispensing of eggs, can now be performed all day long and not only the current 3 hours a day because of fatigue reasons. Lab results produced by the XenoFactor revealed, that stage V and VI oocytes manipulated for 2 hours within the CellSorter did not alter their morphology, in comparison to the control in a petri dish. Furthermore, the successful automated microinjection could be proven by an uptake study on the expressed human transport protein after the OATP2 cRNA injection. With the XenoFactor a batch of 400 microinjected oocytes can now be processed within one day instead of two days. Having such systems available, scientists have gained additional time to focus on the science of their experiment and are not limited by the manual exhausting steps. In near future, the ZebraFactor and XenoFactor will be further evaluated in larger screening tests. Furthermore, the cycle time of the system will further be reduced by enhancing the software algorithm and improving the design. The technology developed in this thesis is protected by two patent applications and technology transfer to industry is in progress.

Acknowledgments
I would like to thank Professor Andreas Stemmer, head of the Nanotechnology Group at ETH Zurich, for giving me the great opportunity to conduct my PhD work in his group. A special thank goes to Dr. Helmut Knapp, head of the section microfluidics and liquid handling at CSEM, for sending me in this highly interesting adventure of automating not only microinjection but cell manipulation. His great support allowed me not only to research new cell sorting approaches and simplifications in microinjection; I even could develop two automated systems which will be commercially available soon. I always appreciated the freedom Helmut gave me to come up with new ideas but also to help me focus on the essential. My appreciation also goes to Professor Bradley Nelson of the Institute of Robotics and Intelligent systems at ETH Zurich for being co-referee of my thesis and the insightful discussions. I also like to thank Dr. Thierry Madigou, person in charge for CRB Xenopé at Université du Rennes 1, he was always available for all my questions relating Xenopus laevis oocytes. He also spent precious time in testing the first version of the XenoFactor, which was not always an easy task. Furthermore I like to thank Dr. Christophe Chesné, CEO and founder of Biopredic International and Dr. Ruoya Lee, head of research at Biopredic International, to initially come up with the idea of this thesis. They also spent valuable time with me and Helmut discussing the requirements and the future of the systems. Additionally, I like to thank Dr. Urban Liebel, PI at Karlsruhe Institute of Technology, as well as his technician Sebastian Hötzel for their support in getting biologically relevant data with the ZebraFactor. Without Dr. Ian Foster and Eva Hänsenberger in Professor François Verrey’s group and Kara Dannenhauer in Professor Neuhauss’ group all at the University of Zurich, I could not conduct my thesis in this time. They always supported me with fresh Xenopus oocytes and zebrafish eggs and gave me important insights in the topics. I also like to thank the team I was working at CSEM, this is Dr. Janko Auerswald who always was available for discussions in material science and laser cutting fabrication, Noa Schmid with his revolutionary ideas not only in lab automation and micro fluidics, Stefan Berchtold with great knowledge in lab work, Dr. Tormod Volden as micro pump specialist, Julian Kaufmann as multi physic simulation specialist, Daniel Schöllhorn as

100 ACKNOWLEDGMENTS
my first intern and finally Jonas Wienen without whom I would not have gotten to such perfectly developed systems. Also many thanks to the whole CSEM Alpnach team who was always very supportive in teaching me in C# programming, using Matrox Imaging Library, remotely controlling devices, using microprocessors etc. The same thank to all CSEM-members who I have not mentioned but have helped me getting my thesis to this point. Moreover I like to thank all the Nanotechnology group members at the ETH Zurich for their good discussion during lunch. These were Dr. Miho Sakai, Dr. Reto Fiolka, Dr. Dominik Ziegler, Dr. Livia Seeman, Dr. Claudia Küttel, Antje Rey and Ralph Friedlos. A thank also to Dr. Felix Beyeler and Simon Muntwyler from the IRIS group at ETH Zurich for giving me an introduction into manipulators and the valuable discussions. Many thanks as well to the European commission for partially supporting my PhD within the integrated project Hydromel (NMP2-CT-2006-026622) as well as all the project partners involved. Finally, I like to thanks my friends, family and Nina for having me supported all this time. They offered me the diversion needed to fulfill my doctoral thesis.
Bibliography
1. Zborowski, M., and Chalmers, J.J. (2005). Magnetic cell sorting. Methods Mol Biol 295, 291-300.
2. Li, Y., Dalton, C., Crabtree, H.J., Nilsson, G., and Kaler, K.V.I.S. (2007). Continuous dielectrophoretic cell separation microfluidic device. Lab on a Chip 7, 239-248.
3. Kang, Y., Li, D., Kalams, S., and Eid, J. (2008). DC-Dielectrophoretic separation of biological cells by size. Biomedical Microdevices 10, 243-249.
4. Yamada, M., Kano, K., Tsuda, Y., Kobayashi, J., Yamato, M., Seki, M., and Okano, T. (2007). Microfluidic devices for size-dependent separation of liver cells. Biomedical Microdevices 9, 637-645.
5. Fernandez, J.G., Mills, C.A., Rodríguez, R., Gomila, G., and Samitier, J. (2006). All-polymer microfluidic particle size sorter for biomedical applications. physica status solidi (a) 203, 1476-1480.
6. Cho, B.S., Schuster, T.G., Zhu, X., Chang, D., Smith, G.D., and Takayama, S. (2003). Passively Driven Integrated Microfluidic System for Separation of Motile Sperm. Analytical Chemistry 75, 1671-1675.
7. Pulak, R. (2006). Techniques for Analysis, Sorting, and Dispensing of C. elegans on the COPAS™ Flow-Sorting System. In C. elegans, Volume 351, K. Strange, ed. (Humana Press), pp. 275-286.
8. Kato, H., Otomo, J., Nomura, S., Takeshita, T., Saito, S., Matsunami, S., and Moriya, N. (2002). Automatic electrophysiological measuring apparatus / method. Volume US6470201 B2, U.S. Patent, ed. (Hitachi Ltd), p. 15.
9. Shirasaki, Y., Tanaka, J., Makazu, H., Tashiro, K., Shoji, S., Tsukita, S., and Funatsu, T. (2006). On-chip cell sorting system using laser-induced heating of a thermoreversible gelation polymer to control flow. Anal Chem 78, 695-701.
10. Cho, S.H., Chen, C.H., Tsai, F.S., Godin, J.M., and Lo, Y.H. (2010). Human mammalian cell sorting using a highly integrated micro-fabricated fluorescence-activated cell sorter (microFACS). Lab Chip 10, 1567-1573.
11. Wang, M.M., Tu, E., Raymond, D.E., Yang, J.M., Zhang, H., Hagen, N., Dees, B., Mercer, E.M., Forster, A.H., Kariv, I., et al. (2005). Microfluidic sorting of mammalian cells by optical force switching. Nat Biotech 23, 83-87.
12. Takeshita, T., Otomo, J., and Matsunami, S. (2002). Apparatus and method for oocytes or eggs selection. Volume US 6465784 B1, U.S. Patent, ed. (Hitachi Ltd), p. 11.
13. Lee, W.G., Demirci, U., and Khademhosseini, A. (2009). Microscale electroporation: challenges and perspectives for clinical applications. Integrative Biology 1, 242-251.
14. Sakai, S., Youoku, S., Suto, Y., Ando, M., and Ito, A. (2005). Automated high-throughput micro-injection system for floating cells. In Imaging,
102 BIBLIOGRAPHY
Manipulation, and Analysis of Biomolecules and Cells: Fundamentals and Applications III, Volume 5699, 1 Edition. (San Jose, CA, USA: SPIE), pp. 59-66.
15. Torchilin, V.P. (2006). Recent Approaches to Intracellular Delivery of Drugs and DNA and Organelle Targeting. Annual Review of Biomedical Engineering 8, 343-375.
16. Verma, I.M., and Weitzman, M.D. (2005). Gene Therapy: Twenty-First Century Medicine. Annual Review of Biochemistry 74, 711-738.
17. Fox, M., Esveld, D., Valero, A., Luttge, R., Mastwijk, H., Bartels, P., van den Berg, A., and Boom, R. (2006). Electroporation of cells in microfluidic devices: a review. Analytical and Bioanalytical Chemistry 385, 474-485.
18. Olofsson, J., Nolkrantz, K., Ryttsén, F., Lambie, B.A., Weber, S.G., and Orwar, O. (2003). Single-cell electroporation. Current Opinion in Biotechnology 14, 29-34.
19. Sankin, G.N., Yuan, F., and Zhong, P. (2010). Pulsating Tandem Microbubble for Localized and Directional Single-Cell Membrane Poration. Physical Review Letters 105, 078101.
20. Lee, P.-W., Peng, S.-F., Su, C.-J., Mi, F.-L., Chen, H.-L., Wei, M.-C., Lin, H.-J., and Sung, H.-W. (2008). The use of biodegradable polymeric nanoparticles in combination with a low-pressure gene gun for transdermal DNA delivery. Biomaterials 29, 742-751.
21. Wang, W., Liu, X., Gelinas, D., Ciruna, B., and Sun, Y. (2007). A fully automated robotic system for microinjection of zebrafish embryos. PLoS ONE 2, e862.
22. Gurdon, J.B. (1976). Injected nuclei in frog oocytes: fate, enlargement, and chromatin dispersal. J Embryol Exp Morphol 36, 523-540.
23. Sun, Y., and Nelson, B.J. (2002). Biological Cell Injection Using an Autonomous MicroRobotic System. The International Journal of Robotics Research 21, 861-868.
24. Takeshita, T., Otomo, J., Nomura, S., Matsunami, S., Moriya, N., and Saito, S. (2003). Apparatus for microinjection of sample into amphibian oocytes. Volume US6593129 B1, U.S. Patent, ed. (Hitachi Ltd), p. 15.
25. Leisgen, C., Kuester, M., and Methfessel, C. (2007). The Roboocyte: Automated Electrophysiology Based on Xenopus Oocytes. Methods Mol Biol 403, 87-109.
26. Putra, A.S., Huang, S., Tan, K.K., Ng, S.C., Panda, S.K., Lee, T.H., and Tay, A. (2007). Piezo-assisted intra-cytoplasmic sperm injection: A comparative study of two penetration techniques, (New York: Ieee).
27. Ergenc, A.F., Li, M.-W., Toner, M., Biggers, J.D., Lloyd, K.C.K., and Olgac, N. (2008). Rotationally oscillating drill (Ros-Drill©) for mouse ICSI without using mercury. Molecular Reproduction and Development 75, 1744-1751.
28. Kimura, Y., and Yanagimachi, R. (1995). Intracytoplasmic sperm injection in the mouse. Biology of Reproduction 52, 709-720.
103
29. Pillarisetti, A., Pekarev, M., Brooks, A.D., and Desai, J.P. (2007). Evaluating the Effect of Force Feedback in Cell Injection. Automation Science and Engineering, IEEE Transactions on [see also Robotics and Automation, IEEE Transactions on] 4, 322-331.
30. Huang, H.B. (2008). Towards automatic batch biomanipulation : study on robotic suspended cell injection system. In Dapartment of Manufacturing Engineering and Enigneering Management, Volume Doctor of Philosophy. (Hong Kong: University of Hong Kong).
31. Sun, Y., Wan, K.T., Roberts, K.P., Bischof, J.C., and Nelson, B.J. (2003). Mechanical property characterization of mouse zona pellucida. IEEE Trans Nanobioscience 2, 279-286.
32. Kallio, P., Ritala, T., Lukkari, M., and Kuikka, S. (2007). Injection guidance system for cellular microinjections. International Journal of Robotics Research 26, 1303-1313.
33. Noori, A., Selvaganapathy, P.R., and Wilson, J. (2009). Microinjection in a microfluidic format using flexible and compliant channels and electroosmotic dosage control. Lab on a Chip 9, 3202-3211.
34. Adamo, A., and Jensen, K.F. (2008). Microfluidic based single cell microinjection. Lab on a Chip 8, 1258-1261.
35. Gurdon, J.B., Lane, C.D., Woodland, H.R., and Marbaix, G. (1971). Use of Frog Eggs and Oocytes for the Study of Messenger RNA and its Translation in Living Cells. Nature 233, 177-182.
36. Dumont, J.N. (1972). Oogenesis in Xenopus laevis (Daudin). I. Stages of oocyte development in laboratory maintained animals. J. Morphol. 136, 153-179.
37. Miledi, R., and Woodward, R.M. (1989). Membrane currents elicited by prostaglandins, atrial natriuretic factor and oxytocin in follicle-enclosed Xenopus oocytes. The Journal of Physiology 416, 623-643.
38. Miledi, R., and Woodward, R.M. (1989). Effects of defolliculation on membrane current responses of Xenopus oocytes. The Journal of Physiology 416, 601-621.
39. Kimmel, C.B., Ballard, W.W., Kimmel, S.R., Ullmann, B., and Schilling, T.F. (1995). Stages of embryonic development of the zebrafish. American Journal of Anatomy 203, 253-310.
40. Kaufman, C.K., White, R.M., and Zon, L. (2009). Chemical genetic screening in the zebrafish embryo. Nat Protoc 4, 1422-1432.
41. Yildirim, M.A., Goh, K.-I., Cusick, M.E., Barabasi, A.-L., and Vidal, M. (2007). Drug-target network. Nat Biotech 25, 1119-1126.
42. European Union (2006). Registration, Evaluation, Authorisation and Restriction of Chemicals (REACH). In 02006R1907-20090627, Volume 1907/2006, European Union, ed.
43. Baldi, A. (2010). Computational approaches for drug design and discovery: An overview. Systematic Reviews in Pharmacy 1, 99-105.
104 BIBLIOGRAPHY
44. Gross, H.J., Verwer, B., Houck, D., Hoffman, R.A., and Recktenwald, D. (1995). Model study detecting breast cancer cells in peripheral blood mononuclear cells at frequencies as low as 10(-7). Proceedings of the National Academy of Sciences of the United States of America 92, 537-541.
45. Gamboa, A.R., Morris, C.J., and Forster, F.K. (2005). Improvements in Fixed-Valve Micropump Performance Through Shape Optimization of Valves. Journal of Fluids Engineering 127, 339-346.
46. Truong, T., and Nguyen, N. (2003). Simulation and optimization of tesla valves. pp. 178-181.
47. Kundu, P.K., and Cohen, I.M. (2004). Fluid Mechanics, 3 Edition, (London: Elsevier Academic Press).
48. Graf, S.F., Hotzel, S., Liebel, U., Stemmer, A., and Knapp, H.F. (2011). Image-Based Fluidic Sorting System for Automated Zebrafish Egg Sorting into Multiwell Plates. Jala-J Lab Autom 16, 105-111.
49. Saleh, B.E.A., and Teich, M.C. (2001). Ray Optics. In Fundamentals of Photonics. (John Wiley & Sons, Inc.), pp. 1-40.
50. Wyss, R., and Glocker, P. (2010). Tileye - Inspection of Implant Surfaces. In Material and Surface Technology for Implants, Volume 19, E.C.a. Materials, ed. (Interlaken).
51. Wang, W., Sun, Y., Zhang, M., Anderson, R., Langille, L., and Chan, W. (2008). A system for high-speed microinjection of adherent cells. Rev Sci Instrum 79, 104302.
52. Mattos, L., Grant, E., Thresher, R., and Kluckman, K. (2007). New developments towards automated blastocyst Microinjections. Proceedings of the 2007 Ieee International Conference on Robotics and Automation, Vols 1-10, 1924-1929.
53. Sakai, S., Youoku, S., Suto, Y., Ando, M., and Ito, A. (2005). Automated high-throughput microinjection system for floating cells. Proc. SPIE 5699Proc. SPIE 5699Proc 5699, 59-66.
54. Schnizler, K., Kuster, M., Methfessel, C., and Fejtl, M. (2003). The roboocyte: automated cDNA/mRNA injection and subsequent TEVC recording on Xenopus oocytes in 96-well microtiter plates. Receptors Channels 9, 41-48.
55. Huang, H., Dong, S., Mills, J.K., and Cheng, S.H. (2008). Integrated vision and force control in suspended cell injection system: Towards automatic batch biomanipulation. In Robotics and Automation, 2008. ICRA 2008. IEEE International Conference on. pp. 3413-3418.
56. Lu, Z., Chen, P.C.Y., Nam, J., Ge, R.W., and Lin, W. (2007). A micromanipulation system with dynamic force-feedback for automatic batch microinjection. Journal of Micromechanics and Microengineering 17, 314-321.
57. Matsuoka, H., Komazaki, T., Mukai, Y., Shibusawa, M., Akane, H., Chaki, A., Uetake, N., and Saito, M. (2005). High throughput easy microinjection
105
with a single-cell manipulation supporting robot. Journal of Biotechnology 116, 185-194.
58. Tjio, J.H., and Puck, T.T. (1958). Genetics of somatic mammalian cells. II. Chromosomal constitution of cells in tissue culture. J Exp Med 108, 259-268.
59. Graf, S.F., Madigou, T., Li, R.Y., Chesne, C., Stemmer, A., and Knapp, H.F. (2011). Fully Automated Microinjection System for Xenopus laevis Oocytes With Integrated Sorting and Collection. JALA 16, 186-196.
60. Lilienblum, W., Dekant, W., Foth, H., Gebel, T., Hengstler, J., Kahl, R., Kramer, P.J., Schweinfurth, H., and Wollin, K.M. (2008). Alternative methods to safety studies in experimental animals: role in the risk assessment of chemicals under the new European Chemicals Legislation (REACH). Archives of Toxicology 82, 211-236.
61. Brittijn, S.A., Duivesteijn, S.J., Belmamoune, M., Bertens, L.F., Bitter, W., de Bruijn, J.D., Champagne, D.L., Cuppen, E., Flik, G., Vandenbroucke-Grauls, C.M., et al. (2009). Zebrafish development and regeneration: new tools for biomedical research. Int J Dev Biol 53, 835-850.
62. DeMicco, A., Cooper, K.R., Richardson, J.R., and White, L.A. (2010). Developmental Neurotoxicity of Pyrethroid Insecticides in Zebrafish Embryos. Toxicological Sciences 113, 177-186.
63. Langheinrich, U. (2003). Zebrafish: A new model on the pharmaceutical catwalk. BioEssays 25, 904-912.
64. Eimon, P.M., and Rubinstein, A.L. (2009). The use of in vivo zebrafish assays in drug toxicity screening. Expert Opinion on Drug Metabolism & Toxicology 5, 393-401.
65. Lammer, E., Carr, G.J., Wendler, K., Rawlings, J.M., Belanger, S.E., and Braunbeck, T. (2009). Is the fish embryo toxicity test (FET) with the zebrafish (Danio rerio) a potential alternative for the fish acute toxicity test? Comparative Biochemistry and Physiology Part C: Toxicology & Pharmacology 149, 196-209.
66. Bilotta, J., Saszik, S., DeLorenzo, A.S., and Hardesty, H.R. (1999). Establishing and maintaining a low-cost zebrafish breeding and behavioral research facility. Behav Res Methods Instrum Comput 31, 178-184.
67. Walter, T., Shattuck, D., Baldock, R., Bastin, M., Carpenter, A., Duce, S., Ellenberg, J., Fraser, A., Hamilton, N., Pieper, S., et al. (2010). Visualization of image data from cells to organisms. Nature Publishing Group 7, S26-S41.
68. Liebel, U., Kindler, B., Pepperkok, R., Balch, W.E., Der, C.J., and Hall, A. (2005). Bioinformatic "Harvester": A Search Engine for Genome[hyphen (true graphic)]Wide Human, Mouse, and Rat Protein Resources. In Methods in Enzymology, Volume Volume 404. (Academic Press), pp. 19-26.
69. Stern, H.M., Murphey, R.D., Shepard, J.L., Amatruda, J.F., Straub, C.T., Pfaff, K.L., Weber, G., Tallarico, J.A., King, R.W., and Zon, L.I. (2005). Small molecules that delay S phase suppress a zebrafish bmyb mutant. Nat Chem Biol 1, 366-370.
106 BIBLIOGRAPHY
70. Union Biometrica (2008). Copas XL Automated Analysis and Sorting of Zebrafish Eggs, Embryos, & Hatchlings. p. 4.
71. Westerfield, M. (2000). The zebrafish book. A guide for the laboratory use of zebrafish (Danio rerio), 4th Edition, (Eugene: University of Oregon Press).
72. Trompouki, E., and Zon, L.I. (2010). Small Molecule Screen in Zebrafish and HSC Expansion. In Cellular Programming and Reprogramming, Volume 636. pp. 301-316.
73. Michelini, E., Cevenini, L., Mezzanotte, L., Coppa, A., and Roda, A. (2010). Cell-based assays: fuelling drug discovery. Analytical and Bioanalytical Chemistry 398, 227-238.
74. Silverman, L., Campbell, R., and Broach, J.R. (1998). New assay technologies for high-throughput screening. Current Opinion in Chemical Biology 2, 397-403.
75. Cohen, S., and Pante, N. (2005). Pushing the envelope: microinjection of Minute virus of mice into Xenopus oocytes causes damage to the nuclear envelope. Journal of General Virology 86, 3243-3252.
76. Konig, J., Cui, Y., Nies, A.T., and Keppler, D. (2000). A novel human organic anion transporting polypeptide localized to the basolateral hepatocyte membrane. Am J Physiol Gastrointest Liver Physiol 278, G156-164.
Curriculum Vitae
Personal Data
Name: Siegfried Federico Graf Date of Birth: 30th September, 1978 Citizen of: Schötz (LU), Switzerland
Education
2007 – 2011 PhD studies at Chair of Nanotechnology, Swiss Federal Institute of Technology Zurich, ZH, Switzerland and Centre Suisse d’Electronique et de Microtechnique SA, OW, Switzerland
2002 – 2005 Graduate studies in Mechanical Engineering, Swiss Federal Institute of Technology Zurich, ZH, Switzerland
1998 – 2001 Undergraduate studies in Mechanical Engineering, Lucerne University of Applied Sciences and Arts, LU, Switzerland
1994 – 1998 Professional Bacchelerate and vocational school, Gewerbliche Industrielle Berufsschule Zug, ZG, Switzerland
Professional Experience
2011 – R&D Engineer, Centre Suisse d’Electronique et de Microtechnique SA, OW, Switzerland
2006 Research Assistant, Department of Hematology, University of Cambridge, United Kingdom (Development of a PoC HIV system)
2004 Test Engineer, VZUG AG, ZG, Switzerland 2001 Assistant, UBS AG, LU, Switzerland 1994 – 1998 Apprentice as Mechanical Draftsman, VZUG AG, ZG, Switzerland