right horizons minerva funds feb 2016
TRANSCRIPT
Analytical rigor meets a disciplined investing process
February 2016
Please see page 28 for disclosures

1. Section 1 [pg. 3-5] - Why India? Why we feel it’s as good a time to get exposure as ever.
2. Section 2 [pg. 6-8] – Minerva Funds’ Philosophy/Process Summary….we focus on the process and let the results follow.
3. Section 3 [pg. 9-17] - India Underserved Construct
[pg. 14-15] – Illustration 1: PVR Cinemas [pg. 16-17] – Illustration 2: Mahindra & Mahindra Financial Svcs.
4. Section 4 [pg. 18-22] – India Undervalued Construct
[pg. 21-22] – Illustration 1: Shree Cement 5. Section 5 [pg. 23-29] - Market Irrationality, Team, Terms, and Performance
2

3
Exhibit 1 - Base-case (ex-investment) CAGR for sustainable GDP expansion By our estimate, India’s base-case sustainable growth over the next decade should be 5%+. This excludes key growth drivers such as acceleration in fixed capital formation, decline in unemployment, new industry evolution, broad-based monetization of savings, and associated multiplier effects1. Such level of sustainability renders the question of timing the entry largely redundant. We view India as one of the most sustainable growth stories available to investors. However, we don’t rely on this inherent macro safety. Rather, we focus on clearly identifying fundamental sources of company safety which has driven our outperformance across business cycles.
Source: Internal Estimates, NCAER, Ministry of Finance
$1,982 Bil
$3,321 Bil
C2014E GDP Urbanization Impact
Productivity Growth
Population Growth
Marginal lifestyle Changes
within top quintile
C2024E (Real Base Case)
5%+ Base-case CAGR
4
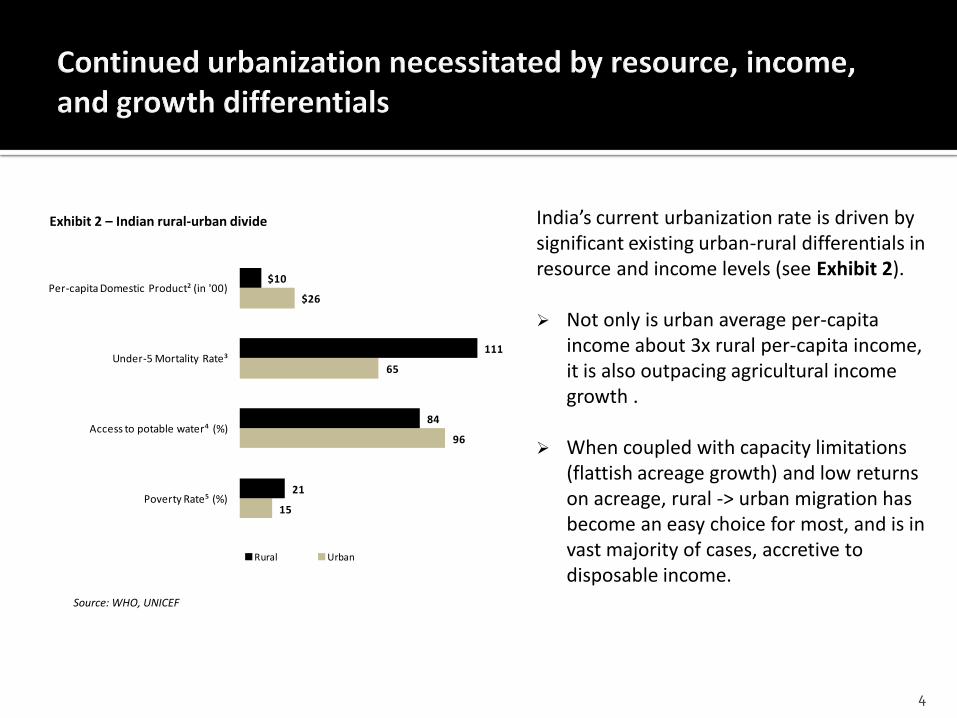
India’s current urbanization rate is driven by significant existing urban-rural differentials in resource and income levels (see Exhibit 2). Not only is urban average per-capita
income about 3x rural per-capita income, it is also outpacing agricultural income growth .
When coupled with capacity limitations
(flattish acreage growth) and low returns on acreage, rural -> urban migration has become an easy choice for most, and is in vast majority of cases, accretive to disposable income.
Source: WHO, UNICEF
Exhibit 2 – Indian rural-urban divide
15
96
65
$26
21
84
111
$10
Poverty Rate⁵ (%)
Access to potable water⁴ (%)
Under-5 Mortality Rate³
Per-capita Domestic Product² (in '00)
Rural Urban

5 5
Exhibit 3 – Low market concentration6 (Top-10 MV Companies)…… Exhibit 4 – ……comes with good liquidity…..
Exhibit 5 – ……strong corporate governance scores, and……
Source: Bloomberg, WFE; ACGA
Exhibit 6 – ……continued investor endorsement.
India
Malaysia
Hong Kong
China
South Africa
ThailandIndonesia
Philippines
Turkey
Brazil
Argentina
Poland
Mexico
0%
10%
20%
30%
40%
50%
60%
70%
80%
20% 30% 40% 50% 60% 70% 80%
Top
10 C
ompa
nies
(%
of A
ggre
gate
Dai
ly T
urno
ver)
Top 10 Companies (% of Aggregate Market Capitalization)
0
500
1,000
1,500
2,000
2,500
3,000
3,500
4,000
Ko
rea
Bra
zil
Sou
th A
fric
a
Ind
ia
Thai
lan
d
Me
xico
Sin
gap
ore
Mal
aysi
a
Ind
on
esi
a
Po
lan
d
Isra
el
C20
13 T
rad
ing
Vo
lum
e [U
SD B
il]]
37
41
45
49
51
53
69
Indonesia
Philippines
China
Korea
India
Taiwan
Singapore
-
20
40
60
80
100
120
140
160
180
0
100
200
300
400
500
600
700
800
Sep-
07
Ap
r-0
8
Nov
-08
Jun
-09
Jan
-10
Aug
-10
Mar
-11
Oct
-11
May
-12
Dec
-12
Jul-
13
Feb-
14
Sep-
14
Cum
ulat
ive
Fore
ign
Hol
ding
($
Bil)
BSE
500
Fre
e-fl
oat M
arke
t Ca
p ($
Bil)
Cumu. Foreign holding ($Bil) BSE 500 Free-float cap ($Bil)

6
i. Process – We thrive on analytical intensity and investing discipline. We triangulate a conservative estimate of intrinsic value using financials, forensics, and a thorough on the ground approach. We then build a diversified book of businesses with a concentrated focus on our best ideas.
ii. People – Diverse global experience which helps identify certain tertiary effects that drive sharp value movements in emerging markets. Based on our backgrounds, we are able to overlay “macro” risk management to our largely deep-dive “micro” process.
iii. Partners – Smart investors that allow us the freedom to steer clear of speculation, incentivize “rigor” over “fashion”, and appreciate our effort to capitalize on opportunities that present themselves during periods of panic and sharp corrections.

7
Basis for our Process - Our work on Indian markets shows that growth, margin sustainability, accounting clarity, and value hold significant explanatory power for attributing long-term material outperformance within Indian equities. These are therefore some of our key screening levers. We don't constrain our universe by looking only at simple metrics such as earning yields or headline multiples. If our selected businesses show…..
1. sustainable promise, 2. ability to retain pricing power, 3. material ignored/under-appreciated facets, and 4. clearly quantifiable incremental catalysts,……
…….they become prospects for inclusion in one of our two sub-strategies. Our process thrives on discipline and is well positioned to look for and own strong (or potentially strong) businesses, run by shareholder friendly management teams, at attractive valuations.

8
Our process is highly iterative in which we play devil’s advocate and try to “kill” our best ideas. Some of the reasons why an idea may be “killed”: 1. Valuation, 2. Management integrity/ability, 3. Strategic advantage not defensible enough, 4. Lack of accounting clarity, 5. Lack of identifiable catalyst(s), etc.

9

Our India Underserved strategy focuses on businesses within most underpenetrated categories, which have the largest potential upsides to come in line with G7 levels. These names are then screened using our value and forensic screens to be identified for further fundamental work. We only proceed if our fundamental work on these names manages to keep us interested while offering free or near-free embedded optionality within assets.
10

Our current India Underserved universe comprises about 100 names - we continually trim and expand this list according to fundamental and technical variables. Here are some of the key attributes we found in this universe:
Sustainability – Our Underserved universe is comprised of businesses that are expected to sustainably outpace the broader economy over the medium and long-term. Typically, we expect such categories to expand at least 30x before nearing saturation.
Partially constrained by value – Our tests on Underserved categories (not constrained by a “fixed” value multiple) suggest that investors reward sustainable growth in such businesses. We screened primarily for cash generation ability and margin tenacity. An equally-weighted book of such screened businesses doubled during our test periods, far outpacing the benchmarks, with more than 3/4th of constituents registering +ve returns. Predictably, not having ‘multiple-based’ constraints didn’t preclude material outperformance within our screened universe.
11

12
Categories included are typically those where consumption is often an exponential function of income growth. Typical categories include: autos, hospitality, select food categories (such as Coffee -see Exhibit 7), etc.
Exhibit 7- Per-capita Coffee Consumption vs. Income
India
Malaysia
Korea
Brazil
United States
Norway
Switzerland
Israel
Sweden
Australia
Romania
y = 7E-06x1.2775
R² = 0.7211
0
2
4
6
8
10
12
$0 $10,000 $20,000 $30,000 $40,000 $50,000 $60,000
Pe
r-ca
pit
a C
off
ee
Co
nsu
mp
tio
n (
Kgs
)
Per-capita GDP (PPP)

13
Exhibit 8a – Mortgage/GDP vs. Per-capita income Exhibit 8b – Mortgage/GDP of <$7.5K countries vs. trend7
Sources: Respective central banks
We remain aware of categories, which while still under-penetrated, might be running ahead of natural economic evolution curves. Residential mortgages are a case in point – While India is a hugely under-banked market, lending categories such as residential mortgages have more than 2x the penetration rate one would expect for an economy like India (see peer set comparison in Exhibit 8b).
y = 1E-05x + 0.0162
R² = 0.75
0%
20%
40%
60%
80%
100%
120%
140%
160%
$0
$1
0
$2
0
$3
0
$4
0
$5
0
$6
0
$7
0
$8
0
$9
0
$1
00
$1
10
Mo
rtga
ge /
GD
P
Per-capita income ($ '000)
-120%
-100%
-80%
-60%
-40%
-20%
0%
20%
40%
60%
80%
100%
120%
140%
Indi
aC
hin
aN
epal Fiji
Thai
land
Geo
rgia
Alb
ania
Ken
yaM
on
golia
Bu
lgar
iaSe
rbia
Arm
enia
Ukr
ain
eZa
mbi
aIn
do
nes
iaPh
ilipp
ines
Ug
an
da
Sri L
anka
Bo
snia
Nig
eria
Ecu
ado
rTa
nza
nia
Para
guay
Pak
ista
n
Mo
rtga
ge/G
DP
-A
ctu
al v
s. T
ren
d
14
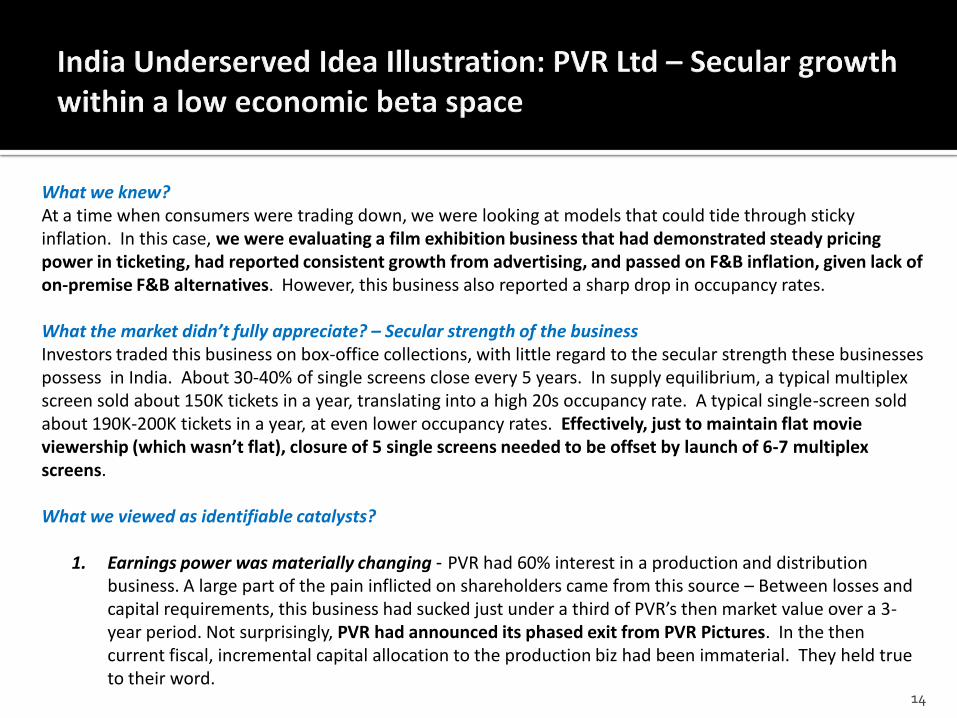
What we knew? At a time when consumers were trading down, we were looking at models that could tide through sticky inflation. In this case, we were evaluating a film exhibition business that had demonstrated steady pricing power in ticketing, had reported consistent growth from advertising, and passed on F&B inflation, given lack of on-premise F&B alternatives. However, this business also reported a sharp drop in occupancy rates. What the market didn’t fully appreciate? – Secular strength of the business Investors traded this business on box-office collections, with little regard to the secular strength these businesses possess in India. About 30-40% of single screens close every 5 years. In supply equilibrium, a typical multiplex screen sold about 150K tickets in a year, translating into a high 20s occupancy rate. A typical single-screen sold about 190K-200K tickets in a year, at even lower occupancy rates. Effectively, just to maintain flat movie viewership (which wasn’t flat), closure of 5 single screens needed to be offset by launch of 6-7 multiplex screens. What we viewed as identifiable catalysts?
1. Earnings power was materially changing - PVR had 60% interest in a production and distribution business. A large part of the pain inflicted on shareholders came from this source – Between losses and capital requirements, this business had sucked just under a third of PVR’s then market value over a 3-year period. Not surprisingly, PVR had announced its phased exit from PVR Pictures. In the then current fiscal, incremental capital allocation to the production biz had been immaterial. They held true to their word.

15
What we viewed as identifiable catalysts?......contd.
2. Geographic mix was getting favorable. During F07-F10, ~1/2 of all PVR’s screens were launched in the crowded NCR and Mumbai markets (39 of 43 screens in the then preceding fiscal), dragging occupancy rates. Of those operational elsewhere, blended ATP was just about 10% below PVR’s F3Q11 average, indicating that even 2-3% higher occupancy in these new screens could offset the pricing drag on realization/seat. Occupancy was bound to improve as geographic mix was diversifying.
3. Priced at INR 80K/seat per seat for the core business, while
other businesses were being given away for free. PVR’s base-case EBITDA (at 25% occupancy rate) with then existing footprint was >INR 450 mil (as opposed to then recent run-rate of ~INR 1 bil, despite sub 28% occupancy rate). At 6x, that translated into just about 25% discount from where the market was valuing PVR. This was the “hell breaks loose” scenario. The conservative potential upside at mid-high teen margin and unlevered growth rates, suggested that PVR could have expanded at least 2x from there.
0x
10x
20x
30x
40x
50x
60x
Jan-
06
Jun-
06
Nov
-06
Apr
-07
Sep-
07
Feb-
08
Jul-
08
Dec
-08
May
-09
Oct
-09
Mar
-10
Aug
-10
Jan-
11
EV /
EBI
TDA
0
500
1,000
1,500
2,000
2,500
3,000
3,500
4,000
4,500
5,000
F201
0A
F201
1E
F201
2E
F201
3E
F201
4E
F201
5E
F201
6E
F201
7E
F201
8E
F201
9E
F202
0E
Nu
mb
er
of
Seat
s [0
00
s]
PVR's Seats Other Multiplex Seats Single Screen Seats
Assuming that leverage wasn't a constraint, our extremely conservative estimate suggested that PVR's seats could quadruple in a decade.

16
What we knew? MMFS’ predominant business (historically) has been vehicle financing, within rural and semi-urban markets. It is typically the organized lender of last resort and has largely grown by creating a new market vs. gaining share within an existing market. What the market didn’t fully appreciate? MMFS’ enviable positioning – Our work on branch level economics suggested that it is very difficult for competitors (without a captive auto base) to enter MMFS’ turf of servicing under-banked customers, and profitably operate, unless one is willing to assume incremental risk and (in many cases) willing to dilute existing profitability – An average MMFS branch originated north of 450 contracts in FY10 (we initiated this position in mid-F2011), with the vast majority of contracts underwritten through an on-the-ground approach vs. processing readily available documentation.
Case of a small rural center (Population of 120K) – We estimated that in many such centers, MMFS did under a tenth of all new vehicle-loan originations, mostly as the last organized lender of choice. Within its addressable market (limited income documentation) it enjoyed a monopoly. Competing within its addressable market is very difficult for an NBFC competitor that doesn’t have a sizeable captive base , given our break-even estimate of 140 annual originations for a very small branch. For a state-controlled or regional co-operative bank, economics of such a business and growth prospects aren’t too compelling to compete, even if they were to become very nimble in their hiring and turn aggressive on underwriting.

17
What we viewed as identifiable catalysts?
1. Continued penetration within under-banked consumers. Given then lower vehicle ownership and lack of access to credit, we expected MMFS’s sweet-spot of vehicle demand from under-banked, largely unleveraged customers to grow at-least as fast as the broader auto market in the near term.
2. Significant optionality on offer (Cross-selling mortgages and home re-modeling loan products).
While we ascribed no material value to a fledgling housing business, we realized that MMFS has room to originate more mortgages than their current volume of vehicle loans, even if its share in such a business remains well below its then high-single digit national share in vehicle loans (ex- 2Ws and 3Ws).
Valuation – Our target price suggested at least 40%+ upside. Despite significantly muted origination growth expectations going forward (below then recent averages and F2009’s low-point of just over 13% ) , we identified 40%+ upside in early September 2010, which ascribed no value to a fast-growing home loan business. We were equally impressed by a management team that made an effort to engage its shareholders and conservatively accounted for losses within a unique, but relatively riskier, business model.

18

19
Our India Undervalued strategy is typically a collection of our 10-25 best value ideas. Unlike our India Underserved book, India Undervalued book isn’t constrained by specific categories. Instead, the focus is on absolute upside over 1-3 years, regardless of industry/sector, while having similar fundamental attributes that we typically focus on within our Underserved portfolio (please refer to our process schematic for details).

20
What we knew? Shree Cement was the fastest growing Indian cement company. At capacity of 13.5 million tons, it was the #1 player in North India and top 5 nationally. Cement manufacturing in India is regionally driven and the top 8 players in each region control 60-80% of the local capacity. Shree had averaged 38% margins over trailing 5 years vs. industry average of 27-30% at similar utilization. Higher profitability was driven by flexible input costs (almost 100% usage of pet-coke vs. industry average of ~20%), regional advantage in logistics/pricing, and higher capacity utilization. It is critical to note that even if Shree’s major competitors were to match its higher capacity utilization (unlikely given then market dynamics), Shree would have likely continued to have a 4%+ margin advantage over competition, given its sourcing and operational advantages. What the market didn’t fully appreciate?
1. Overcapacity in the overall industry (~80% effective capacity utilization in F2011). Indian cement
industry had averaged demand growth of ~9% over the then trailing 5 years. Capacity utilization for Shree was expected to remain above industry due to its continued stronger than industry average demand (15% volume growth in the last 10 years vs. 10% for industry).

2. Lack of cushion in times of industry overcapacity. Shree’s power trading business had become and would have continued to become a significant cushion for the cement business. In FY12, with projected flat cement sales, we expected power to make up ~12% of total sales (vs. 8.8% in FY11).
3. Management was not given enough credit (see then valuation Exhibit 13 below) for operating and
capital allocation prowess they have shown in a “vanilla” industry. Bangur family, owned 2/3rd of the business and itwas run by the son of Chairman B.G. Bangur. It was clear that they were outstanding cost-cutters and anticipated trends within the industry - all demonstrated by their success in aggressively yet sensibly expanding capacity since inception (then IRR of 26% since inception in mid-80s). We anticipated upside of at least 20% from late May 2011 levels, and exited in June 2012 with nearly 70% (after-tax) upside (~50% on cost).
Exhibit 13 – How Shree stacked vs. peers*
21
Price
M. Cap (INR
Mil) EV (Rs. m) ROE FY'12
EBITDA
Margin
(FY'12) PE (FY'12)
EV /ton- Rs.
(FY'13)
EV/EBITDA
(FY'12)
ACC 1001 188,270 187,726 17.2% 20% 13.3x 6,258 9.0x
Ambuja 136 208,140 192,896 16.9% 23% 13.4x 8,037 8.6x
Jaiprakash 82 174,050 448,723 10.0% 24% 16.7x NA 12.5x
Shree 1,854 64,590 64,943 14.9% 27% 14.2x 4,811 5.5x
*As of 27/05/11

22
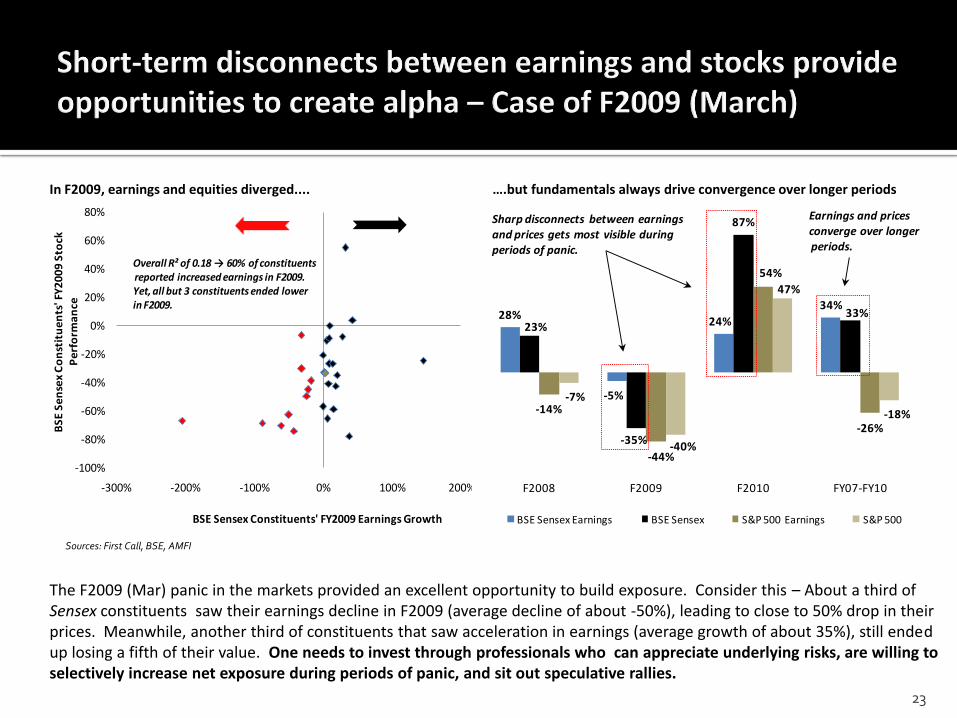
In F2009, earnings and equities diverged.... ….but fundamentals always drive convergence over longer periods
23
Sources: First Call, BSE, AMFI
The F2009 (Mar) panic in the markets provided an excellent opportunity to build exposure. Consider this – About a third of Sensex constituents saw their earnings decline in F2009 (average decline of about -50%), leading to close to 50% drop in their prices. Meanwhile, another third of constituents that saw acceleration in earnings (average growth of about 35%), still ended up losing a fifth of their value. One needs to invest through professionals who can appreciate underlying risks, are willing to selectively increase net exposure during periods of panic, and sit out speculative rallies.
-100%
-80%
-60%
-40%
-20%
0%
20%
40%
60%
80%
-300% -200% -100% 0% 100% 200%
BS
E S
en
sex
Co
nst
itu
en
ts' F
Y2
00
9 S
tock
P
erf
orm
an
ce
BSE Sensex Constituents' FY2009 Earnings Growth
Overall R² of 0.18 → 60% of constituentsreported increased earnings in F2009. Yet, all but 3 constituents ended lower in F2009.
28%
-5%
24%
34%
23%
-35%
87%
33%
-14%
-44%
54%
-26%
-7%
-40%
47%
-18%
F2008 F2009 F2010 FY07-FY10
BSE Sensex Earnings BSE Sensex S&P 500 Earnings S&P 500
Sharp disconnects between earningsand prices gets most visible duringperiods of panic.
Earnings and pricesconverge over longerperiods.

24
Be it a case of a simple fad, aggressive growth expectations within an underpenetrated category, or ill-informed extrapolation of unsustainable performance, we find no dearth of irrational valuations within Indian equities. Here is one of our studied situations: Case of a hospitality company (reviewed in Oct 2010)
Background on the situation - This business sells multi-year (20+ years) hospitality service rights, with installments typically paid within the initial 3-4 years, translating into an attractive cash float. It is a highly capital intensive business and requires significant operating working capital. Critical issue that the market ignored or under-appreciated:
1. Its core business had decelerated from 50%+ a few years back to mid-teens; 2. By our est, their capacity at that time was unlikely to service materially over 70% of its
members (Global average for similar business models suggest 50%+ excess capacity to manage peak demand), and would have likely resulted in meaningful deceleration in growth and/or significant leverage added on the books.
Sky-high valuation – Stock was trading at ~70x F2010 FCF, which wasn’t sustainable. Even assuming that this business somehow regained its pace of growth from mid-2000s (without the associated capex growth i.e. stretches its current sub-par capacity even further), we still saw 50%+ downside from there.
i. Lack of Investor sophistication - Too much direct retail participation. Retail investor’s focus on “quick” appreciation is clearly visible. Several names often exchange hands much more frequently than even the most liquid names on NYSE – 1 out of every 163 tradable shares* of an average DJIA constituent trades daily vs. 1 out of every 25 tradable shares of NSE’s ‘speculative bunch’.
We pay no heed to momentum in prices and use our safety first/disciplined investment process to identify key themes and select securities which have such inherent strengths that the long-term returns should be higher than benchmarks irrespective of “feel-good” Western/macro stories.
ii. Inefficient shorting alternatives hamper price discovery – Very thin volume and limited breadth within stock specific derivatives; No centralized clearing house to manage counterparty risk for investors who wish to borrow stocks to short.
We manage market froth by selectively hedging out macro and security specific risks using derivatives. On the flip side, we can selectively take “enhanced” security–specific exposures through calls, when bargains can be distinctly identified and there is material call volume in such a security.
* Freely floated shares
25

26
Piyush Sharma, born and raised in India, has over a decade experience in investment research. Having spent time with Citigroup and Bombay Stock Exchange in India, he moved to United States in 2002, where he covered stocks within Business Services, Autos, Consumer Products and Financials with Sanford Bernstein, Longbow Research and Avondale Partners, working in teams that received accolades by leading institutional research arbiters. Piyush has an MBA from University of North Carolina at Chapel Hill, MS from MNNIT, and BS in Accounting from University of Allahabad. [email protected] Gaurav Aggarwal, CFA, CPA, born and lived his early childhood in India, has several years of investment analysis experience at established investment management firms in New York, Florida, and the Middle East. Prior to that, he was a senior analyst with portfolio management duties over $50 million in fund of fund assets at a leading regional investment bank in the Middle East. Prior to this, he was with Bay Harbour Management, a $1.2 billion distressed debt and equity hedge fund in New York City. He has also served as an analyst with Polen Capital Management, a $2 billion long-only value money manager in Florida. He received an M.S. in Accounting (specializing in Finance) and B.S. in Business Administration from the University of North Carolina at Chapel Hill. He is a Chartered Financial Analyst and a Certified Public Accountant. [email protected] We are always available and would love to hear from you and share views (especially views which might not currently agree with our own!).

27
Note – *Actively managed closed-ended funds in US; returns are adjusted for USD/INR changes; our performance is net of all execution
charges and management fees but before performance fees.
India
Underserved
India
UndervaluedNifty
S&P BSE
500
S&P BSE
Midcap
S&P BSE
Smallcap
Eurekahedge
India
India-focused
CE Funds*
Trailing 12 months 14% -8% -14% -12% -3% -4% 1% -11%
Trailing 24 months 67% 52% 24% 34% 65% 74% 50% 46%
Trailing 36 months 97% 69% 25% 31% 49% 54% 35% 48%
Since inception 132% 90% 29% 33% 45% 23% 23% 39%
2016 YTD -6% -6% -5% -6% -7% -8% 0% -4%
2015 22% -2% -4% -1% 7% 7% 6% -1%
2014 34% 52% 31% 37% 55% 69% 39% 49%
2013 21% 18% 7% 3% -6% -11% -6% 6%
2012 39% 37% 28% 31% 38% 33% 14% 28%
2011 -11% -12% -25% -27% -34% -43% -25% -31%
Annualized Volatility (TTM) 14% 13% 11% 11% 11% 15% 8% 12%
Sharpe Ratio 1.08 0.69 0.23 0.26 0.33 0.17 0.17 0.32

28
DISCLAIMER: The information, opinions, estimates and projections contained in this fund brief were prepared by managers of Right Horizons Minerva Funds and constitute its current judgment as of the date of this note. The information contained herein is believed to be reliable and has been obtained from sources believed to be reliable, but Right Horizons makes no representation or warranty, either expressed or implied, as to the accuracy, completeness or reliability of such information. Right Horizons does not undertake, and has no duty, to advise you as to any information that comes to its attention after the date of this fund brief or any changes in its opinion, estimates or projections. Prices and availability of securities are also subject to change without notice. This is not a prospectus and does not constitute investment advice or an offer or solicitation to buy or sell any designated investments discussed herein. Neither Right Horizons, nor its officers, directors, agents, employees, Minerva Funds’ managers makes any warranty, express or implied, as to the suitability of any fund as an investment or of any kind whatsoever, or assumes any responsibility for, and none of these parties shall be liable for, any losses, damages, costs, or expenses, of any kind or description, arising out of this brief or your investment in any fund. You understand that you are solely responsible for reviewing any fund, its offering and any statements made by a fund or its manager and for performing such due diligence as you may deem appropriate, including consulting your own legal and tax advisers.
29
1. 50% of income expansion impact (from urban migration) is estimated to lead to consumption, Productivity growth has averaged 2.5% over the last 2 decades, with distinct acceleration; Acceleration in domestic fixed capital formation, decline in unemployment, new industry evolution, broad-based monetization of savings, FDI, Infrastructure spending and associated multiplier effects etc. aren't included in base case formulation. 2. Source - Economic Survey (2013) 3. Under-5 mortality rate is based on a 2012 calculation. The rate is based on mortality per 1,000 live births for 10-yr period preceding the survey. 4. Source - WHO 5. Source - UNICEF 6. Market Concentration is defined as “influence” of top 10 securities (in terms of market capitalization) in the market; Lower the concentration, greater the market breadth; All microstructure numbers are based on annual statistics. 7. Peer set was defined based on current urbanization, per-capita incomes, and income inequality.

30
CONTACT US: Right Horizons Financial Services Pvt Ltd.
No 6, Arekere, II Main,
Bannerghatta Road,
Bangalore – 560076.
Tel: +91-80-65687503 to 65687518
All rights reserved©. No part of this document may be reproduced in any form by any electronic or mechanical means (including photocopying, recording, or information storage and retrieval) without written consent of authors.