rift valley fever: influence of herd immunity patterns on transmission dynamics
TRANSCRIPT

Rift Valley fever: Influence of herd immunity patterns on transmission dynamics
John Gachohi and Bernard Bett
Regional Conference on Zoonotic Diseases in Eastern Africa
Naivasha, Kenya 9-12 March 2015

Outline
Background
Research objective
Model description
Model application
Key findings & interpretation
Conclusion
Background
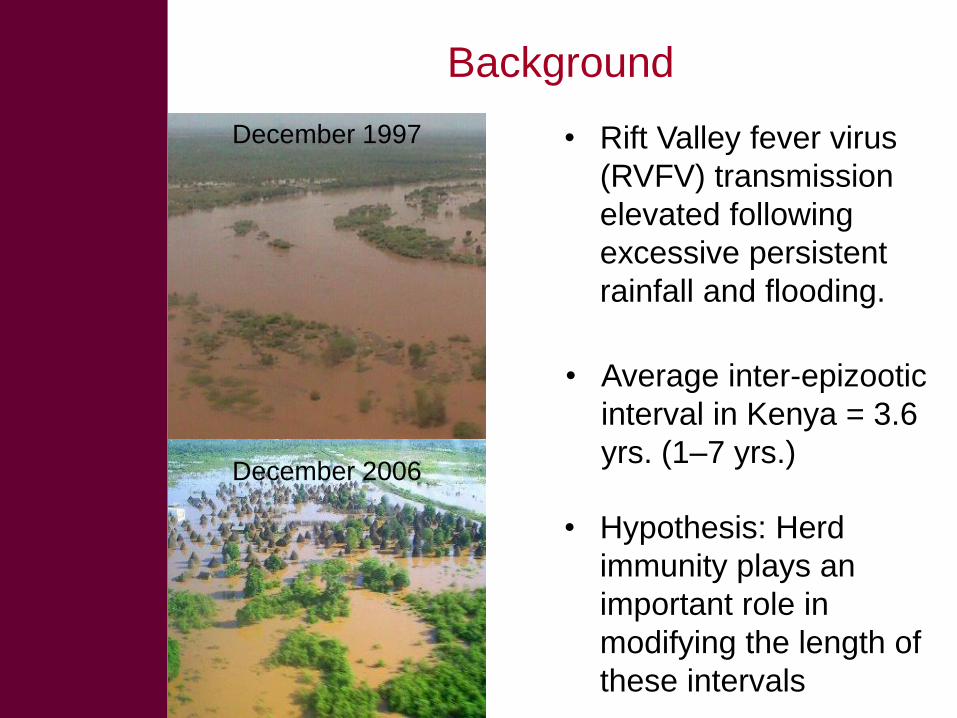
• Rift Valley fever virus
(RVFV) transmission
elevated following
excessive persistent
rainfall and flooding.
December 1997
December 2006
• Average inter-epizootic
interval in Kenya = 3.6
yrs. (1–7 yrs.)
• Hypothesis: Herd
immunity plays an
important role in
modifying the length of
these intervals

Research objective
To evaluate the relationship between herd
immunity and RVFV transmission dynamics
Evaluation – based on a transmission
dynamics simulation model

RVF transmission model description
Host module
A 2-host model – cattle and sheep – based upon:
Age-structured population dynamics – individual-based – characteristics
and behaviour tracked for each host
Vector module
A 2-vector model – Aedes and Culex spp.
Population-based – Life stages modelled using difference equations
Population dynamics – driven by satellite-based rain using probability
functions

RVF transmission model description
Spatial grid cell framework
representation of spatial heterogeneities in the model through the
variation of:
the locations of vector breeding sites
host movement patterns
Transmission module
Individual host: Susceptible, Exposed, Infected, Recovered
I E s R Vector (population-based): Susceptible, Exposed, Infected
I E s

Model application
Variations in vectors’ population growth and data
periods
Simulations implemented for 1200 days that cover
the data period to predict 2006-07 outbreak
Transmissions are subsequently shut. Simulations
then run for five years to assess the post-outbreak
evolution of herd immunity dynamics.
C++: 1000 simulations for each scenario

Key predictions (1)
The model reproduces the temporal course of
2006-07 RVF outbreak
Plus seasonal transmissions that are dependent
on amount of rain

Key predictions (2)
The model predicts a high herd immunity level at
the end of that outbreak:
Sheep: 94% [range 65%, 99%]
Cattle: 89% [range 81%, 96%]
Over time, after the outbreak, immunity wanes.
Five years later, declines to:
Sheep: 0.3% [range 0.07%, 0.5%]
Cattle: 6% [range 4%, 8%]
This period falls within the reported range of
inter-epizootic period in Kenya and appears to
depend on species

Key predictions (2)
A box-and-whisker plot : evolution of herd immunity
dynamics during the post-outbreak period
The serial
numbers
denote time in
years following
the outbreak

Key predictions(3) Can herd immunity dynamics modify the length of
inter-epizootic intervals?
Separate model analyses – assessing impact of
control options
Predicted full-blown outbreak prevention window Average 317 days in sheep
Average 723 days in cattle

Interpretation
Rate of decline in herd immunity higher in sheep
than in cattle
Likely due to the greater population turnover
Inter-annual transmissions might be responsible
for sustaining herd immunity over time
Predictions suggest that host diversity can
influence the temporal pattern of a multi-host
epizootic

Conclusion
Findings provide a better understanding of
immunity patterns critical in refining existing
control strategies
Strategies aimed at boosting herd immunity
during the inter-epizootic period
Findings provide huge potential for use in
evaluation of cost-effectiveness of vaccination
campaigns