riemann's sum
TRANSCRIPT

Approximating the area under a curve.


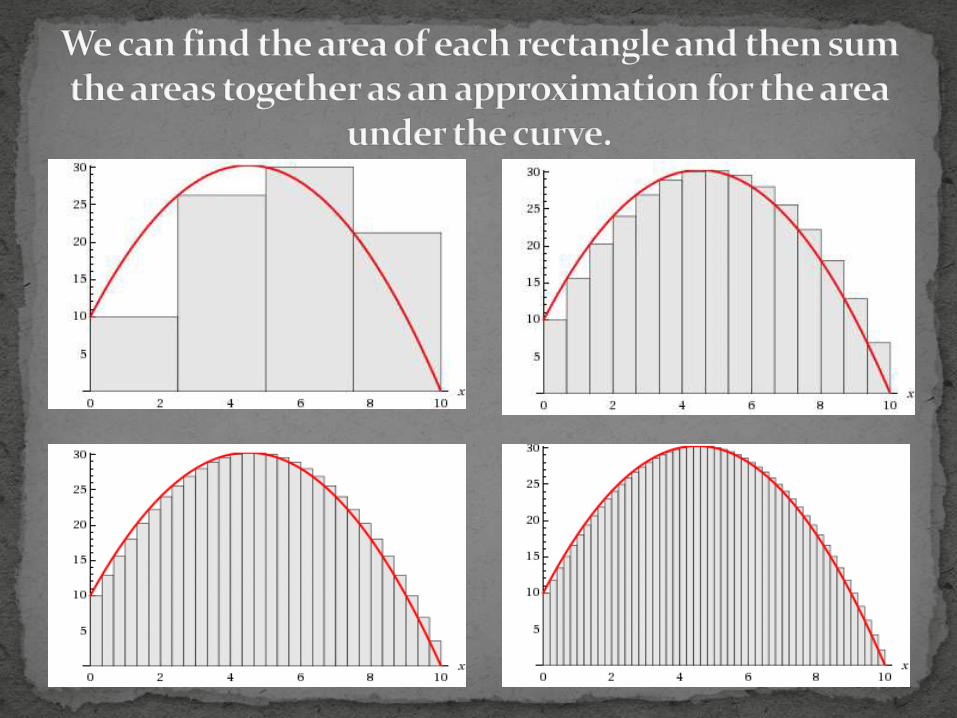

Here we begin by using 4 rectangles.Number of rectangles we call n, so n=4.
Notice were calculating the area under a curve, f(x) from 0 to 10.The greatest endpoint we call b and the lowest we call a, so b=10 and a=0
Using the picture as a reference come up with a formula for the width of each rectangle using a, b, and n.
In our Riemann Sums the width of each rectangle is equivalent.

n=4 Number of rectangles to be useda=0 Lower endpointb=10 Upper endpoint
We take the interval length 10 and we want to break it up into 4 equal sections giving us
10/4. We call this width Δx
Δx=(b-a)/n
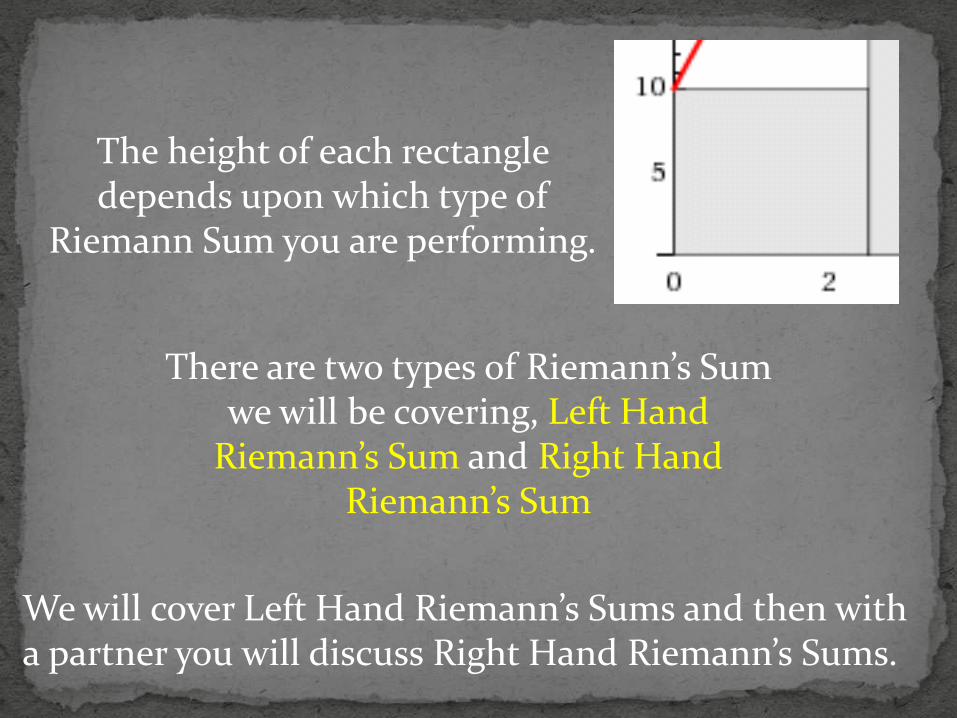
The height of each rectangle depends upon which type of
Riemann Sum you are performing.
There are two types of Riemann’s Sum we will be covering, Left Hand
Riemann’s Sum and Right Hand Riemann’s Sum
We will cover Left Hand Riemann’s Sums and then witha partner you will discuss Right Hand Riemann’s Sums.

Left Hand Riemann’s Sum
In our example we will look at the left endpoint of each subinterval, recall Δx=2.5, so each xi as they are called are 2.5 greater than the prior.
x0=0, x1=2.5, x2=5, and x3=7.5
Now for the height of each rectangle we look at f(xi).
What is f(x1) in the example below?

f(x1)=10 and we see this from the graph, now using the equation in the upper left corner we can find the other f(xi) values.
Now each rectangle’s area is f(xi)Δx And so our Left Hand Riemann’s Sum
LHS=Δx[f(x0)+f(x1)+f(x2)+…+f(xn-1)]

Discuss with a partner what you think the Right Hand Riemann’s Sum is.
Also why in this picture is there only 3 rectangles visible if n=4 and were using the Right Hand Riemann’s Sum?

RHS=Δx[f(x1)+f(x2)+f(x3)+…+f(xn)]
Notice that f(x4)=f(10)=0 so the fourth rectangle has a height of 0 and so it doesn’t appear in the graph.

What’s the point and where are we going?
Riemann’s Sums are approximation and they can be used to approximate area’s of awkwardly shaped areas .
For example say you want to calculate the area under a shelf (this is exactly what you are going
to want to do in the next lesson) but you don’t know the “function” of the shelf, how could you. Using Riemann Sums you can approximate the
area however.
Economist use Riemann’s Sums when looking at consumer surplus. Scientists also use the sums when sometimes looking at blood flow.

What’s the point and where are we going?
What can we do to Riemann’s Sum (how can we change it or enhance it) to find the exact
area under a curve?
The following link is of a lecture given by Eddie Woo that we will watch the first 5 minutes and 15 seconds of to see where it is that
we are headed with these Riemann Sums.
Eddie Woo Lecture
http://mathworld.wolfram.com/RiemannSum.html
http://www.math.upenn.edu/~rimmer/math104/ch9sc4notes.pdf
https://www.youtube.com/watch?v=2eumjKINo6w
https://www.asme.org/getmedia/a82f3ac6-8a15-4a68-9936-040df6a0c0af/Modeling_Blood_Flow_for_Heart_Pumps-Fluids_Engineering-02.jpg.aspx?width=340
http://www.crazycatcondos.com/curvedwallshelf.jpg